Improving Cost Efficiency and Customer Service for the Phoenix Water Services Department · ·...
38
Improving Cost Efficiency and Customer Service for the Phoenix Water Services Department Russell Becker, Les Stotler, Mark Roye - City of Phoenix Esteban Azagra - Red Oak Consulting
Transcript of Improving Cost Efficiency and Customer Service for the Phoenix Water Services Department · ·...

Improving Cost Efficiency and Customer Service for the Phoenix
Water Services Department
Russell Becker, Les Stotler, Mark Roye - City of Phoenix Esteban Azagra - Red Oak Consulting

IT Governance
New Deputy CIO position created in 2006 for Water Services Department Reports to City CIO and Assistant Water
Services Director Joined the City in 2006 All of my prior work experience was in
private sector

Business Issues Limited view of deployed assets No consolidated view of spare parts inventory No real-time work order scheduling Limited preventative maintenance Limited long term replacement cost forecasting Numerous manual data entry tasks resulted in
inaccurate or inconsistent data No end-to-end view of customer service
requests
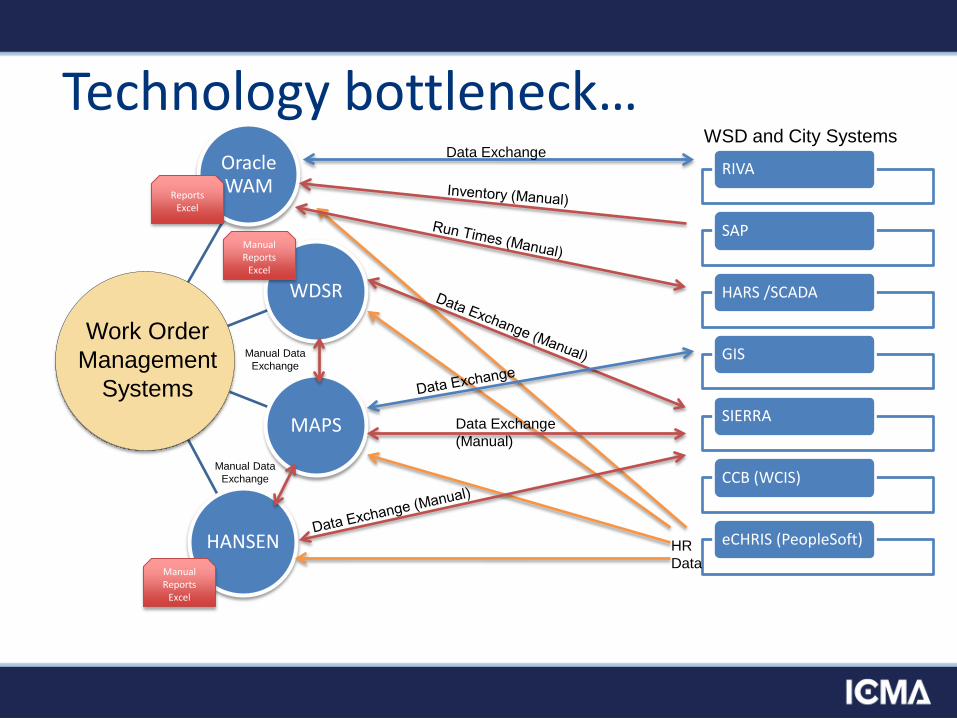
Technology bottleneck… Oracle WAM
WDSR
MAPS
HANSEN
Work Order Management
Systems Manual Data
Exchange
Manual Data Exchange
Manual Reports
Excel
Manual Reports
Excel
RIVA
SAP
HARS /SCADA
GIS
SIERRA
CCB (WCIS)
eCHRIS (PeopleSoft)
WSD and City Systems Data Exchange
Data Exchange (Manual)
HR Data
Reports Excel

Why did this happen? No defined strategy for work order and
asset management Water Services did not think department
wide, technology decisions were made at division level Didn’t rely on citywide IT infrastructure
We needed a vision!

Department Goals in Three Broad Areas
Enhance Customer
Service
Better Manage Costs
Improve Asset Performance

Enhance Customer
Service
Goals to Enhance Customer Service
Streamline performance reporting, focus and act on service
metrics
Single integrated work order system , reduce
response times
Field crews to use mobile solution, live mapping, new work
orders, and real-time status updates
GIS integration, use GIS integration to create work orders, locate
assets, improve service

Better Manage Costs
Goals to Better Manage Costs Consolidate redundant
systems, reduce support labor, eliminate IT maintenance fees
Integrate Service Orders and Work Orders,
eliminate duplicate data entry labor costs
Manage the supply chain, reduce inventory
carrying costs
Use asset management, to optimize R&R
budgeting (long term cost control)
Increase use of Reliability Centered Maintenance,
reduce critical asset risk, and unplanned maintenance
costs

Improve Asset Performance
Goals to Improve Asset Performance
Continuous improvement, asset
management practices and system use
Increase use of Reliability Centered
Maintenance, optimize performance of critical
equipment Streamline
performance reporting, focus and act on asset performance metrics
Timely and accurate inventory, make sound maintenance and R&R
decisions
Use consistent asset characteristics, share
assets and parts across all divisions

What did we do? Engaged Red Oak Develop business requirements Assess current technology Develop strategy Develop high level project plan and phases Develop a staffing and support plan
Recommendation: Migrate to Oracle’s WAM application
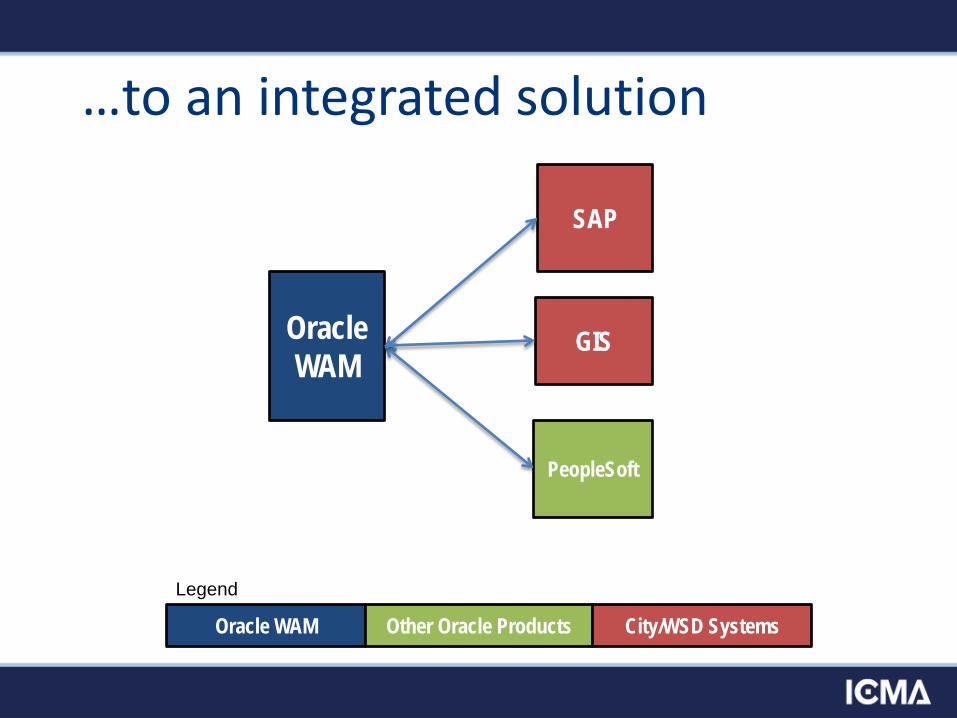
…to an integrated solution
Oracle WAM
SAP
PeopleSoft
GIS
Oracle WAM Other Oracle Products City/WSD Systems
Legend

Balancing Goals and Cost
Goals
1. Consolidate Redundant IT Systems
2. Consistent WAM Asset characteristics
3. Timely and Accurate Inventory
4. Integrated Service and Work Order Process
5. Managed Supply Chain
6. Reliability Centered Maintenance (RCM) at Plants
7. Streamlined Performance Reporting
8. Field Crew to Use Mobile Solution
9. GIS Integration for WAM
10. Optimize R&R Budget
11. Continuously Improve
12. Establish WAM Roles and Responsibilities
$$$

….FUTURE STATE
Oracle WAM
SAP
PeopleSoft
ESRI GIS
Oracle Utilities Suite Other Oracle Products City/WSD Systems
Legend Or
acle
Inte
grat
ion S
ervic
es
Oracle MWM
Oracle CC&B
Oracle Business Analytics (Dashboards, Reports and Analysis)
FULL SYSTEM INTEGRATION
HARS/UCOS

Background
• Population Served – 1,507,899 over 540 Sq. miles • Plants
Water Production - 5 Wastewater Treatment – 2
• Miles of Linear Infrastructure Water – 6,953 Wastewater – 4,984
• Assets Water – 1,570,000 Wastewater – 670,000 Hydrants – 54,001

Phoenix Area Water Sources
Reclaimed Wastewater
Salt River
Central Arizona Project
Existing Water Treatment Plant
Future Water Treatment Plant
Existing Wastewater Treatment Plant
Existing Water Reclamation Treatment Plant
Future Water Reclamation Treatment Plant
Groundwater
Verde River
24th STREET

Preliminary Observations Organizational No single individual or organizational unit
responsible for work and asset management oversight
Division-level organizations to support Work and Asset Management (WAM) are inconsistent
System administration and enhancement support for “WAM” is minimal
Most interviewed employees want change

Preliminary Observations Work Process Many “WAM” processes are disjointed
• Service request and work order coordination • After-the-fact work orders; duplicate data entry • Condition assessments separate from work order
management Asset Inventory is not complete or consistently applied Asset Hierarchy is geography-based and may not facilitate
desired queries or reporting Work orders are not labor-costed Limited coordination of CIP/R&R planning and “WAM”
processes
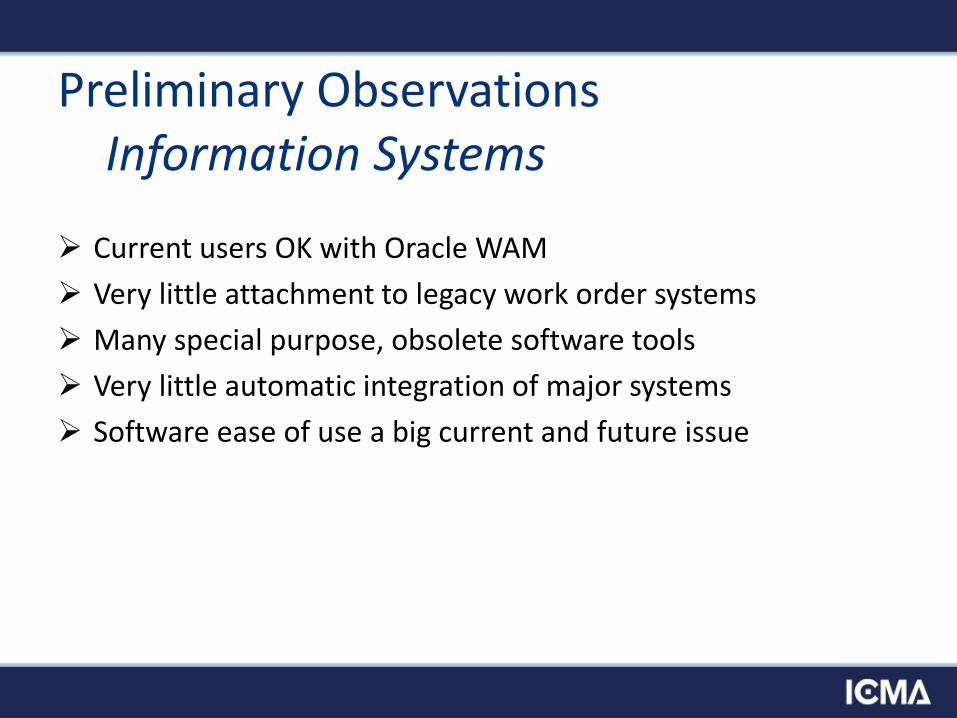
Preliminary Observations Information Systems
Current users OK with Oracle WAM Very little attachment to legacy work order systems Many special purpose, obsolete software tools Very little automatic integration of major systems Software ease of use a big current and future issue

How did we do it… Phase 1 – completed 9/26/12
Collection and Distribution Develop Core Team and Roles Build full two way integration points with our GIS system Integration with other major systems, SAP and PeopleSoft Rollout of mobile solution for the field staff
Phase 2 – currently ongoing
Water Treatment and Production plants conversion to the new system Integration with process control (UCOS) for runtime Reconcile phase 1 decision and improve business processes
Phase 3 – Start 2013
Build integration points with the Oracle Utility suite MWM and CC&B Implement full business analytics application
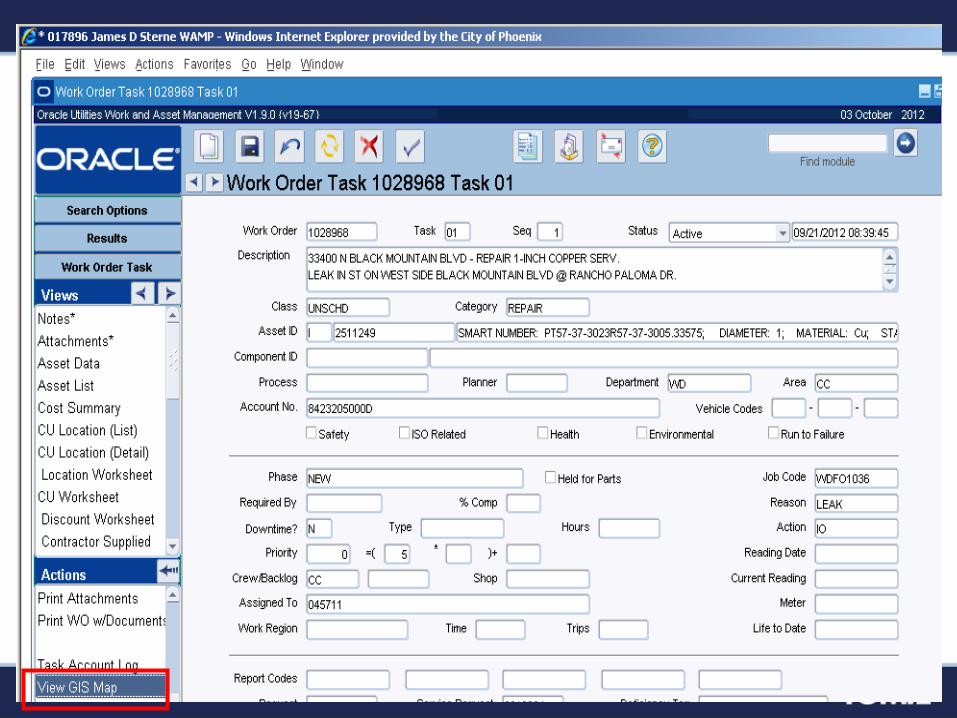
Demo


Real Outcomes
Project Core Team
People Technology
Business Process

Project Phased projects will need to be reconciled
after completed implementation Survey your users often Don’t treat your vertical assets like linear
assets Listen to the SME in “your” organization Start your change management early in the
project

Core Team • Created the role of Asset Manager With the duties of Business Process Optimization Asset Organization Linear vs. Vertical Asset specifications consistency and QA/QC Role is similar to a Business Analyst with the focus
on Assets
• Larger support staff after go live than you think (consider 24x7)

People Steep learning curve for the end users Slow adoption to new business processes Continuous QA/QC is really necessary Continuous training Face time with the field staff at their location Share your reporting with the users, as well as
management

Technology Valuable integration with GIS Saved duplicate data entry with interface with
financial system Field use of laptop has reduced travel time Easy access to GIS and live system data has
provided increased productivity Document management Keeping vanilla has its drawbacks

Business Processes Standardized business processes across the
department for asset management and WO processing Increase accountability for inventory “Real” costing for assets maintenance Asset work history is more complete

Goals Grade
1. Consolidate Redundant IT Systems A+
2. Consistent WAM Asset Characteristics A
3. Timely and Accurate Inventory B
4. Integrated Service and Work Order Process A
5. Managed Supply Chain C
6. Reliability Centered Maintenance (RCM) at Plants Phase 2
7. Streamlined Performance Reporting Phase 2
8. Field Crew to Use Mobile Solution B
9. GIS Integration for WAM A
10. Optimize R&R Budget WIP
11. Continuous Improvement A
12. Establish WAM Roles and Responsibilities B
Goals Report Card

Operating saving will be $2.7 million dollars over the first five years of this consolidation.
Financial Outcome

• Comparison of Four Maintenance Programs : Reactive Maintenance (Breakdown or Run-to-
Failure Maintenance): Cost: $18/hp/yr Preventive Maintenance (Time-Based
Maintenance): Cost: $13/hp/yr Predictive Maintenance (Condition-Based
Maintenance): Cost: $9/hp/yr Reliability Centered Maintenance (Pro-Active or
Prevention Maintenance): Cost: $6/hp/yr
Financial Outcome
Reference: Piotrowski, J. April 2, 2001. Pro-Active Maintenance for Pumps, Archives, February 2001 .

More reasons we will be more efficient in the future Proactive vs. Reactive Maintenance
(increased system reliability) Reduced Asset Maintenance Costs Increased Accuracy of Future CIP Planning Single System Asset Information and History

Final Reason for Success --------Business Analytics---------
Management level reports Ability to drill down to details Speed to develop reports Ad-hoc reporting needs Ability to mash-up data sources Provide end user data analysis Fast user adoption Mobility

Answering key questions on performance for everyone
What happened? Why? What should we be doing?

Questions/Comments? Contact information
Russ Becker, ITS Deputy CIO [email protected] Mark Roye, Water Services, WAM Project Manager [email protected] Les Stotler, ITS Applications Manager [email protected]