Improving air quality in the UK · UK record in tackling air pollution ... National action to...
70
www.gov.ur Improving air quality in the UK Tackling nitrogen dioxide in our towns and cities UK overview document December 2015
Transcript of Improving air quality in the UK · UK record in tackling air pollution ... National action to...

www.gov.ur
Improving air quality in the UK Tackling nitrogen dioxide in our towns and cities UK overview document December 2015

© Crown copyright 2015
You may re-use this information (excluding logos) free of charge in any format or medium, under the terms of the Open Government Licence v.3. To view this licence visit www.nationalarchives.gov.uk/doc/open-government-licence/version/3/ or email [email protected]
Any enquiries regarding this publication should be sent to us at:

Contents
Executive Summary .............................................................................................................. i
1. Introduction ................................................................................................................... 1
2. The challenge ............................................................................................................... 1
2.1. The causes of air pollution ...................................................................................... 1
2.2. Impact on health and the environment .................................................................... 3
2.3. Emissions from transport ........................................................................................ 4
2.4. UK record in tackling air pollution ........................................................................... 4
2.5. Raising awareness ................................................................................................. 6
2.6. Quantifying the ambition ......................................................................................... 8
3. National action to improve air quality .......................................................................... 15
3.1. England ................................................................................................................ 15
3.2. Scotland ................................................................................................................ 15
3.3. Wales .................................................................................................................... 16
3.4. Northern Ireland .................................................................................................... 17
3.5. Clean Air Zones .................................................................................................... 19
3.6. Clean Air Zones outside London ........................................................................... 24
3.7. Greater London ..................................................................................................... 25
3.8. Improving air quality in all areas ........................................................................... 28
4. Impact of measures .................................................................................................... 33
5. Detailed measures ...................................................................................................... 36
5.1. Incentivising ultra low emission vehicles ............................................................... 36
5.2. The national and local road network ..................................................................... 38
5.3. Reducing emissions from buildings ...................................................................... 40
5.4. Reducing emissions from other sources ............................................................... 40

6. Annex 1 ...................................................................................................................... 45
6.1. Evaluation of progress towards meeting the nitrogen dioxide limit values ............ 45
6.2. General background information on the UK .......................................................... 48
7. Annex 2 ...................................................................................................................... 50
7.1. Infrastructure and land use planning ..................................................................... 50
7.2. Local action .......................................................................................................... 52
7.3. Ports and shipping ................................................................................................ 54
7.4. Freight .................................................................................................................. 56
7.5. Reducing emissions from buildings ...................................................................... 57
7.6. Industry ................................................................................................................. 58
7.7. Emissions from other stationary sources .............................................................. 59
7.8. Non-Road Mobile Machinery ................................................................................ 60
8. Annex 3 ...................................................................................................................... 61
9. Glossary ..................................................................................................................... 63

i
Executive Summary We are committed to improving the UK’s air quality, reducing health impacts, and fulfilling our legal obligations. This Plan sets out a comprehensive approach for meeting these goals by implementing a new programme of Clean Air Zones. Under this Plan, by 2020 the most polluting diesel vehicles - old polluting buses, coaches, taxis and lorries - will be discouraged from entering the centres of Birmingham, Leeds, Southampton, Nottingham and Derby. Newer vehicles that meet the latest emission standards, and private cars, will be unaffected.
Progress to date Over recent decades, air quality has improved significantly. Between 2005 and 2013 emissions of nitrogen oxides have fallen by 38% and particulate matter has reduced by more than 16%. Over the past five years the Government has committed over £2 billion to help bus operators upgrade their fleets, reduce pollution from a range of vehicles such as refuse trucks and fire engines through cutting edge technologies, and promote the development of clean alternative fuels such as powering taxis with liquid petroleum gas in Birmingham.
Targeted Clean Air Zones In order to bring the UK into legal compliance and to reduce concentrations of nitrogen dioxide below 40 µg/m3 Clean Air Zones will be introduced in five cities. These Zones will reduce the pollution in city centres and encourage the replacement of old, polluting vehicles with modern, cleaner vehicles. Similar zones in Germany and Denmark have been shown to improve air quality. These Zones will target air quality hot spots. Following scoping studies, which Government will provide funding for, Councils will consult on the details on these Zones.
Vehicles covered In Birmingham, Leeds, Southampton, Nottingham and Derby, these Zones will cover old diesel buses, coaches, taxis and lorries. Newer vehicles that meet the latest emissions standards will not need to pay and, under this Plan, no private car will have to pay. The local authorities will have to set charges at levels designed to reduce pollution, not to raise revenue (beyond recovering the costs of the scheme). Birmingham and Leeds will also discourage old polluting diesel vans and implement other measures including park and ride schemes, signage, changes in road layouts and provision of infrastructure for alternative fuels.

ii
Transition to new fleets Many companies have already started to update their fleets to modern, cleaner vehicles. For example, by 2017 British Gas will have replaced at least 10% of their commercial fleet with electric vehicles, reducing emissions compared to their old diesel vans. The new electric vans also represent a saving over their diesel counterparts. In London the cost savings could be as high as 20%, with other locations saving between 6-10%. The Environment Agency, winner of Green Fleet of the Year 2015, has committed to increase the number of ultra-low emission vehicles to more than 100 by the end of 2015. Another example of businesses modernising their fleet is Reading Buses - 38% of their fleet are ‘ultra-clean’ drastically reducing their emissions. Drivers are also given advice on fuel efficient eco-driving techniques.
Testing standards One of the main reasons our cities continue to face air quality problems is the failure of diesel vehicles to deliver expected emission reductions in real world driving conditions. We have recently secured agreement in the EU to introduce more stringent emissions testing across the EU, ensuring that vehicles live up to their low emission credentials. Our Plan fully factors in current car performance and future performance standards following this agreement.
London The Mayor of London has a well-developed strategy for improving air quality by 2025, including the implementation of an ultra-low emission zone by 2020, retro-fitting of buses and licensing new taxis to be zero emission capable from 2018. We will continue to support and monitor the delivery of the Mayor’s plans.

1
1. Introduction 1. This document provides an overview of the UK plan for improving air quality. Along
with the associated zone plans it sets out how the Government will fulfil its commitment to improve air quality and meet the requirements of the Ambient Air Quality Directive 2008 (the ‘Air Quality Directive’)1 for nitrogen dioxide in the shortest possible time.
2. This plan has been developed following a forty day public consultation on draft plans (launched in September 2015) which received over 480 responses. The plan has also been informed by a series of round table discussions with relevant industries and specialist groups. We held two engagement events where key elements of the plan were discussed in depth, one with local authorities and the other with organisations covering a broad range of interests from environmental groups to technology providers. We have also held detailed discussions on the local issues facing those cities with the most challenging air quality issues.
3. Implementation of the plan and progress on delivering improved air quality across the country will be closely monitored both through formal reporting processes and through continued engagement with local authorities, industry, and other relevant parties.
4. The UK is divided into 43 zones and agglomerations for air quality monitoring and reporting purposes (see map 1 in Annex 1). This plan should be read alongside the other documents published with this overview:
• the individual local plans for each of the 38 zones where we have currently identified air quality issues with nitrogen dioxide (NO2);
• the list of UK and national measures; and
• the technical report on the modelling and assessment methodology used in the preparation of the plan.
2. The challenge 5. The Government is taking action on air quality in order to improve health and the
environment. We are not alone in facing this challenge, 16 other European countries will need to take action to reduce their nitrogen dioxide levels.
2.1. The causes of air pollution 6. Air pollution is primarily caused by the combustion of fossil fuels, for example, in
power generation, industrial processes, domestic heating and road vehicles. These
1 European Directive 2008/50/EC on ambient air quality and cleaner air for Europe. This sets maximum concentrations of key pollutants in ambient air, i.e. the air that we all breathe.

2
can give rise to a number of pollutants including nitrogen oxides (NOx)2, sulphur dioxide (SO2) and particulate matter (PM). Chemical reactions in the atmosphere can also lead to the generation of other pollutants. Ozone is produced by the effect of sunlight on nitrogen oxides and volatile organic compounds (also produced by industry), while NOx and sulphur oxides can also contribute to the formation of particulate matter.
7. On average transport is responsible for 80% of NOx emissions at the roadside in areas where we need to act to reduce levels. Figure 1 provides an overview of the breakdown of roadside NOx emissions in 2013 and the emission rates by vehicle type for Euro 5/V (the standards in force in 2013).
Figure 1: a) Average NOx source apportionment on UK road links outside London exceeding an annual mean NO2 concentration of 40µg/m3 in 2013 b) vehicle emissions per kilometre by vehicle type Euro 5/V
8. Although non-transport sources of nitrogen oxides, such as industrial processes, are
still considerable contributors, the largest source of emissions in the areas of greatest concern are diesel vehicles. This is due to both the significant growth in vehicle numbers over the last ten years and the emissions standards not delivering the expected reductions under real world driving conditions3, even before the revelations over the use of so called ‘defeat devices’. However, the vehicle mix in particular areas will vary according to circumstance and the approach in this plan seeks to address all relevant modes of transport. A more detailed breakdown of source apportionment by road link is available in the accompanying zone plans.
2 Nitrogen oxides (NOX) is the term used to describe the sum of nitrogen dioxide (NO2) and nitric oxide (NO). Ambient NO2 concentrations include contributions from both directly emitted primary NO2 and secondary NO2 formed in the atmosphere by the oxidation of NO.
3 Compared to laboratory testing

3
2.2. Impact on health and the environment 9. Improving air quality can improve health in the short and in the long-term. Better air
quality will have particular benefits for people with heart or lung conditions or breathing problems.
10. The Committee on the Medical Effects of Air Pollutants (COMEAP) has identified that the evidence associating exposure to NO2 with health effects has strengthened substantially in recent years4. An estimate of an effect on mortality equivalent to 23,500 deaths annually in the UK has been made on the basis of NO2 concentrations5. Many of the sources of NOx are also sources of particulate matter (PM). The impact of exposure to small particulate matter pollution (PM2.5) is estimated to have an effect on mortality equivalent to nearly 29,000 deaths in the UK6. There may be overlap between these two estimates of mortality, but the combined impact of these two pollutants is a significant challenge to public health. Recommended limits for exposure have been set taking account of guidelines by the World Health Organisation.
11. At a local level the potential impact of poor air quality on health is captured in the Public Health Outcomes Framework7, which sets out the desired outcomes for public health in England and provides a means for driving improvement within and across authorities. The Public Health Outcomes Framework includes an air pollution indicator: the percentage of mortality attributable to particulate matter (PM2.5) pollution. This indicator is intended to raise awareness of the impact of air pollution on public health. It allows Directors of Public Health to prioritise action on air quality in their local area to help reduce the health burden from air pollution. Public Health England has also published estimates of the mortality burden attributable to particulate matter pollution in local authority areas in the UK8. Although these estimates are based on studies of the health effects associated with particulate matter pollution, many of the measures and the drivers behind improvements will have wider benefits, including reducing NOx emissions and NO2 concentrations.
12. Improving air quality will also provide additional benefits by reducing damage to the natural environment. Nitrogen oxides can contribute to eutrophication of waterways that damages aquatic life. They can also lead, through chemical reactions with volatile organic compounds, to ground level ozone that damages crops.
4 Statement on the evidence for the effects of nitrogen dioxide on health https://www.gov.uk/government/publications/nitrogen-dioxide-health-effects-of-exposure 5 Defra analysis using interim recommendations from COMEAP’s working group on NO2. The working group made an interim recommendation for a coefficient to reflect the relationship between mortality and NO2 concentrations (per µg/m3). COMEAP has not yet made any estimates of the effects of NO2 on mortality. Any analysis will be subject to change following further analysis by the working group and consultation with the full committee. 6 COMEAP (2009) The Mortality Effects of Long-Term Exposure to Particulate Air Pollution in the United Kingdom https://www.gov.uk/government/uploads/system/uploads/attachment_data/file/304641/COMEAP_mortality_effects_of_long_term_exposure.pdf 7 https://www.gov.uk/government/publications/healthy-lives-healthy-people-improving-outcomes-and-supporting-transparency 8 https://www.gov.uk/government/publications/estimating-local-mortality-burdens-associated-with-particulate-air-pollution

4
2.3. Emissions from transport 13. The introduction of increasingly strict vehicle emissions regulations (Euro standards)
has not delivered the expected NOx emission reductions from diesel vehicles in real world use. As a result road transport is still by far the largest contributor to NO2 pollution in areas where the UK is exceeding NO2 limit values.
14. Addressing road transport therefore presents the most significant opportunity to improve air quality. Transport is a key part of almost everything we do, as individuals or businesses, and its impacts are much wider than air quality. By the careful choice of appropriate and proportionate measures that recognise the economic and social impacts and value, we can deliver broader benefits. The opportunities are not limited to transport. A significant proportion of background emissions still come from non-transport sources and, as set out in Section 5 and Annex 2, we are also taking action to tackle emissions from industrial, domestic and other sources.
15. Transport is a major source of atmospheric carbon dioxide (CO2) and many of the measures which will improve air quality will also decrease CO2 emissions and reduce long term climate change.
16. Increasing the number of ultra low emission technologies in the vehicle fleet, most notably through electrification, has a number of benefits. Not only does it support growth and UK innovation, it is the most significant action that can benefit both air quality and reducing carbon emissions. Ultra low emission vehicles emit extremely low levels of carbon dioxide9 and other pollutants compared to conventional vehicles fuelled by petrol/diesel. They typically also have much lower or virtually nil emissions of air pollutants, and lower noise levels. In the longer term, combined with increasing use of low carbon energy to provide the power from the National Grid, these vehicles can become truly zero emission, not just when in use.
17. The UK is a leader in the development of clean transport technologies. Accelerating the uptake of these technologies will help drive growth and the economy as well as improve air quality. The 2015 Autumn Statement set out that Government will spend more than £600 million between 2015 and 2020 to support uptake and manufacturing of ultra low emission vehicles in the UK. This will help maintain the global leadership that in 2014 saw 1 in 4 of all European electric vehicles built here, and keep the UK on track for almost every car and van to be effectively zero emission by 2050. This investment will save 65 million tonnes of carbon and help deliver the long term answer on urban air quality.
2.4. UK record in tackling air pollution 18. We have achieved significant improvements in air quality across a range of pollutants
over the last five decades (Figure 2) through the successful introduction by Government and others of a range of measures in the UK. Emissions of nitrogen oxides alone have fallen by 62% since 1970.
9 The Office for Low Emission Vehicles has considered ultra low emission vehicles to be new cars or vans that emit less than 75 grams of CO2 from the tailpipe per kilometre driven.

5
19. This has been achieved through the regulatory frameworks we have put in place and supported at local, national, European or international level, and through significant investment by industry in cleaner processes. For example, we have driven reductions in emissions from power stations through the use of improved combustion technologies (such as low-NOx burners and retro-fitting coal-fired power stations), through legislation including the Large Combustion Plant and Industrial Emissions Directives and the shift in the UK fuel mix away from coal towards nuclear, gas and renewables. The UK continues to meet international and European ceilings for emissions of nitrogen oxides.
Figure 2: Trends in UK sulphur dioxide, nitrogen oxides, non-methane volatile organic compounds, ammonia and particulate matter (PM10, PM2.5) emissions 1970 – 2013
20. We have also successfully reduced ambient concentrations of NO2. These have
decreased since 1990 (Annex 1, Figure 5) through stricter European vehicle emission standards together with a wide range of measures and investment. If the most recent standards had successfully been delivered by vehicle manufacturers to give the reductions in emissions of nitrogen oxides anticipated, the UK would expect to have seen further improvements in these trends. Since 2011 we have committed over £2bn on greener transport measures. Table 1 provides a summary of some of the action we have taken so far. Further background is included in Annex 2. Details on the range of other measures we have taken, and will take in the future, are provided throughout this plan.

6
Table 1: Supporting National and Local Greener Transport
Ultra low emission vehicles
£1000m Commitment between 2010-2020 to put the UK at the global forefront of ultra low emission vehicle development, manufacture and use: £400m in the last Parliament and a further £600m to 2020.
Local Sustainable Transport Fund
£665m Over 2011-2015 £600m to support 96 project across 77 local authorities to increase the use of buses, cycling and walking. An additional £65m to support 44 local authorities in 2015/16.
£580m Over 2015-2020 for a new ‘Access’ fund for sustainable travel, building on the legacy of the Local Sustainable Transport Fund and supporting growth in cycling and walking.
Buses £89m To bus operators and local authorities in England up to 2013 to purchase over 1,200 new low emission buses.
£7m In 2015 to local authorities in England to support the retrofitting of buses.
£7m
In 2013-2014, to 18 local authorities to upgrade approximately 500 buses with pollution reducing technology.
£5m To upgrade, together with match funding, around 900 London buses in in 2012-2013.
Cleaner Vehicle Technologies
£8m In 2014 via the Clean Vehicle Technology Fund to 23 local authorities for fitting cutting-edge, pollution reducing technologies to over 1,200 vehicles.
National Road Network
£100m
Ring-fenced air quality fund for Highways England over 2015-2021 to address air pollution as part of the Road Investment Strategy.
£100m For Highways England over 2015-2021 to improve cycling conditions alongside and crossing the strategic road network.
Cycling and walking
£593m On a variety of measures 2011-2020 to support cycling under the Local Sustainable Transport Fund, Bikeability, the Cycle Ambition Scheme, and Cycle Rail
2.5. Raising awareness 21. Access to data and information is essential to our ability to make informed choices to
tackle the sources of, and reduce exposure to, pollution. We aim to reach people both routinely and during periods of poor air quality in the way they commonly access information, whether through social, local, national or other media. The Government is committed to making air quality data publically available and to work with others to

7
develop innovative tools to help the public understand what this information means for their health.
22. Up to date and accessible information about current and forecast air quality levels helps everyone to take action to mitigate the short-term effects of air pollution on their health. It enables, for example, people to change their own driving behaviour where necessary to reduce their contribution to pollution. It can also help people avoid areas during episodes of high pollution. This is particularly important for those who may be vulnerable because of, for example, heart or lung conditions. In the longer term this information also helps raise wider awareness of the problem and the development of solutions.
23. The UK is providing near real time monitoring information for a range of pollutants on the UK-Air website10. Separate sites are also provided by the Devolved Governments11. The UK Government provides 5-day pollution forecasts which are updated daily and allow the public to look ahead and plan if pollution levels are likely to rise.
24. The information available includes hourly mean NO2 levels, and health advice for the general public, including children and other vulnerable groups. This information is presented using a Daily Air Quality Index (DAQI) of 5 pollutants, including NO2, and provides a clear 10-point scale of pollution from low to very high. Each DAQI banding is accompanied by health messages for at-risk individuals, and for the general population. Our monitoring information is made publically available so that it can be widely used.
25. We will continue to examine and develop how best to reach those who may be affected by poor air quality, including examining the potential for introducing a formal air quality warning system alongside the current processes. Such a warning system, to inform the public about the potential risk of pollution, may work along the lines of those used, for example, during severe weather alerts.
26. We are using local channels to encourage action to mitigate air pollution, including local authorities, elected officials and Directors of Public Health, so that air quality is appropriately prioritised in areas where it is an issue. We have published a toolkit12 to assist local decision makers in engaging with their communities. This includes information on the evidence to help them argue the case for action and advice on communicating with the public and others.
27. We are continuing to develop advice and guidance for local authorities and communities. Public Health England has developed a programme in support of National and Local Government to reduce mortality in England attributable to air pollution. The programme focuses on helping raise awareness of the health effects of air pollution and further developing and synthesising the evidence on the health
10 uk-air.defra.gov.uk 11 Scotland: http://www.scottishairquality.co.uk/ Wales: http://www.welshairquality.co.uk/ Northern Ireland: http://www.airqualityni.co.uk/ 12 Directors of Public Health Air Quality toolkit http://randd.defra.gov.uk/Default.aspx?Menu=Menu&Module=More&Location=None&Completed=0&ProjectID=18580#Description

8
effects of air pollutants, including NO2, PM and ozone. Public Health England will focus its efforts on promoting actions that can bring a range of health benefits.
28. We use social and other media to communicate and highlight episodes of high or forecast high air pollution. We also work with health Non-Governmental Organisations who have agreed to use their networks and media channels to help reach vulnerable groups and individuals during episodes.
29. Local authorities, Non-Governmental Organisations and other stakeholders can also play a role in helping disseminate advice and guidance. Using information provided they can help people understand the health impacts, steps they can take to reduce exposure to air pollution and how to reduce the impacts and causes. We will encourage these organisations to work with us to help identify the wide range of information resources available, target these appropriately and disseminate information.
30. Together these measures will help ensure that we raise public awareness of both the challenge we face and the opportunities for personal action.
2.6. Quantifying the ambition 31. Given the health impacts on individuals we need to make further improvements for
the benefit of people living and working in our cities. To do this, and to support both our domestic ambition and international negotiations, we need to be able to measure and define air quality to a consistent, logical and internationally recognised approach.
32. The Air Quality Directive helps to achieve this by setting out how air quality should be measured and also setting limit values that should be met to protect health and the environment.
2.6.1. The Air Quality Directive standards 33. The Air Quality Directive takes account of guidelines from the World Health
Organisation. It sets certain limits and information requirements for a number of pollutants, including nitrogen dioxide (NO2), to help countries address and prioritise the harmful effects of pollution.
34. For NO2 the Air Quality Directive sets two limit values13 for the protection of human health. These require Member States to ensure that:
• annual mean concentration levels of NO2 do not exceed 40μg/m3; and
• hourly mean concentration levels of NO2 do not exceed 200μg/m3 more than 18 times a calendar year.
13 Limit values are expressed in terms of μg/m3 (micrograms per cubic metre). This may also be written as μgm-3

9
35. Member States were required to meet these limits by 1 January 2010 unless an extension was granted for up to 5 years to 1 January 2015. The UK was granted an extension in 12 of the 43 air quality zones and agglomerations.
36. The UK assesses progress against these limits through a UK wide system of over 145 air quality monitoring stations, known as the Automatic Urban and Rural Network (AURN), together with a Pollution Climate Mapping (PCM) model14.
Air quality reporting 37. The UK reports air quality data on an annual basis. In 2013 five zones met the limit
value for annual mean NO2 concentrations, with an additional 7 zones meeting the Directive requirements within a margin of tolerance as part of an agreed time extension15 (Table 2). The remaining 31 zones had measured or modelled NO2 levels over the limit and had no time extension.
Table 2: UK zones and agglomerations meeting limit values in 2013
Zones meeting the annual mean limit value for NO2 in 2013:
Blackpool Urban Area
Preston Urban Area
Highland
Scottish Borders
Northern Ireland
Zones exceeding the annual mean limit value, but within the annual mean limit value plus margin of tolerance
Portsmouth Urban Area
Birkenhead Urban Area
Southend Urban Area
Edinburgh Urban Area
Swansea Urban Area
Central Scotland
North Wales
38. In 2013 the UK met the limit value for hourly mean NO2 in all zones except for Greater London.
2.6.2. Future air quality 39. As part of our commitment to addressing the health impact of air pollution, the UK is
determined to meet the requirements set out in the Air Quality Directive and to do so in the shortest time possible. Our evaluation of the measures we will put in place to
14 For details of the PCM model and monitoring approach see the Technical Report 15 Where a time extension applies the UK is required to provide the Commission with data indicating that the annual mean NO2
concentrations in these zones have remained at or below the annual limit value plus the maximum margin of tolerance to 60 μg/m3

10
achieve this, and assessment to ensure they are focused on the right areas and issues, is based on the most up to date information available.
40. We have used our Pollution Climate Mapping model to project future NO2 concentrations, and provide projected dates for when each UK zone will meet the requirements of the Air Quality Directive.
41. These projections look at five year intervals going forward with a baseline year of 2013. The quantifiable impacts of measures implemented and planned since we last submitted plans in 2011 have been included in these baselines. The projections show that through existing measures (set out in this plan) which we have taken to reduce NO2 and other pollutants in the UK, 35 zones are expected to meet the required levels by 2020. This will lead to significant benefits for the UK, including helping to avoid health impacts.
42. Table 3 summarises both the projected dates by when the required levels will be achieved in individual zones if we rely only on these existing actions, and the impact of the additional measures in this plan in bringing those dates forward. Eight zones are projected to not meet the limit values in 2020 without this further additional action.

11
Table 3: Summary of 2013 exceedance of NO2 limit values and projected dates of compliance
2013 assessment16 Baseline projections for 2020 Compliance Zone/Agglomeration Maximum
annual mean limit value
exceedance
Km of road exceeding limit value
Maximum annual mean
(µg/m3)
Hourly limit value
exceedance
Km of road exceeding annual limit
value
Maximum annual mean
(µg/m3)
Compliance with NO2 limit values projected with no new measures
Compliance estimate
based on this plan
Greater London Urban Area Y 1078.5 126 Y 240.3 71 2030 2025 West Midlands Urban Area Y 189.9 70 N 4.3 47 2025 2020 Greater Manchester Urban Area Y 170.3 61 N 0.0 38 2020 2020 West Yorkshire Urban Area Y 82.7 74 N 2.7 47 2025 2020 Tyneside Y 47.2 65 N 0.0 39 2020 2020 Liverpool Urban Area Y 38.6 57 N 0.0 36 2020 2020 Sheffield Urban Area Y 34.9 57 N 0.0 38 2020 2020 Nottingham Urban Area Y 33.6 65 N 0.8 42 2025 2020 Bristol Urban Area Y 18.3 53 N 0.0 35 2020 2020 Brighton/Worthing/Littlehampton Y 0.8 41 N 0.0 27 201517 2015 Leicester Urban Area Y 19.4 53 N 0.0 39 2020 2020 Portsmouth Urban Area Y 10.0 53 N 0.0 37 2020 2020 Teesside Urban Area Y 9.7 65 N 0.0 39 2020 2020 The Potteries Y 19.9 58 N 0.0 35 2020 2020 Bournemouth Urban Area Y 11.2 49 N 0.0 34 2020 2020 Reading/Wokingham Urban Area Y 6.9 49 N 0.0 36 2020 2020 Coventry/Bedworth Y 15.0 52 N 0.0 34 2020 2020 Kingston upon Hull Y 21.1 54 N 0.0 31 2020 2020
16 Note this assessment differs from data submitted to the Commission in September 2013. To ensure we use best available evidence the 2013 assessment has been updated to take account of latest emission factors. This data has been resubmitted to the Commission. 17 This is still a projected date until the full year of data is analysed for the 2015 compliance assessment

12
2013 assessment16 Baseline projections for 2020 Compliance Southampton Urban Area Y 18.4 68 N 0.3 41 2025 2020 Birkenhead Urban Area Y 5.3 47 N 0.0 31 2020 2020 Southend Urban Area Y 7.1 56 N 0.0 37 2020 2020 Blackpool Urban Area N 0.0 34 N 0.0 22 Compliant Compliant Preston Urban Area N 0.0 40 N 0.0 28 Compliant Compliant Glasgow Urban Area Y 76.2 68 N 0.0 38 2020 2020 Edinburgh Urban Area Y 8.8 50 N 0.0 34 2020 2020 Cardiff Urban Area Y 19.8 54 N 0.0 37 2020 2020 Swansea Urban Area Y 2.7 48 N 0.0 33 2020 2020 Belfast Metropolitan Urban Area Y 51.8 64 N 0.0 37 2020 2020 Eastern Y 39.9 70 N 0.8 41 2025 2020 South West Y 31.8 52 N 0.0 35 2020 2020 South East Y 107.4 59 N 0.0 37 2020 2020 East Midlands Y 65.3 64 N 0.9 43 2025 2020 North West & Merseyside Y 60.7 72 N 0.0 40 2020 2020 Yorkshire & Humberside Y 49.8 57 N 0.0 37 2020 2020 West Midlands Y 43.3 60 N 0.0 39 2020 2020 North East Y 47.2 65 N 0.0 39 2020 2020 Central Scotland Y 21.4 51 N 0.0 34 2020 2020 North East Scotland Y 7.9 52 N 0.0 34 2020 2020 Highland N 0.0 32 N 0.0 19 Compliant Compliant Scottish Borders N 0.0 26 N 0.0 17 Compliant Compliant South Wales Y 30.3 66 N 2.1 41 2025 2020 North Wales Y 7.7 55 N 0.0 35 2020 2020 Northern Ireland N 0.0 37 N 0.0 22 Compliant Compliant

13
43. The latest projections are a significant improvement from the projections published in July 2014 which indicated that 28 zones would still exceed the limits in 2020. This improvement is mainly due to the incorporation in the Pollution Climate Mapping model of updated information on vehicle emissions factors. This is provided by COPERT18, the recommended method for calculating vehicle emissions by the European Monitoring and Evaluation Programme and the European Environment Agency Emissions Inventory Guidebook; other Member States use a similar approach. The most significant changes affecting the projection are a revised assessment of the performance of both Euro 5 and Euro 6 light duty diesel vehicles and a significant drop in the expected emissions from Euro VI heavy duty vehicles19; early independent evidence has already demonstrated that the newest lorries and buses are emitting significantly less NOx. There are also other factors such as changes in fleet composition.
44. The UK has been pushing strongly for action to ensure that emissions testing works in practice for light duty vehicles. In October 2015, an agreement was reached between Member States and the European Commission on the implementation of new procedures for real driving emissions (RDE) tests for cars and vans. The agreement reached requires manufacturers to ensure new cars and vans meet strict emissions limits in normal real-world use as well as during the laboratory test. This will be introduced in a staged approach with the first stage applying to all new model types in September 2017 and all vehicle registrations in September 2019. This will be followed by a second stage bringing further reductions that will apply from January 2020.
45. The European Parliament and the Council now have a period of 3 months in which to object to the agreement after which it is expected to be formally adopted in early 2016.
46. The recent discovery of the use of so-called ‘defeat devices’ places even greater importance on the introduction of real world driving emissions testing.
47. The current differences between laboratory testing and real world emissions are unacceptable. We need to be ambitious and bold so that vehicle emissions tests enable proper control of urban pollution and consumers can be confident with the published results and information provided to them.
48. The Vehicle Certification Agency (VCA) is already working with vehicle manufacturers to ensure that this issue is not industry wide. The Government has announced a UK programme to retest vehicles. The VCA is running laboratory tests starting with those VW Group vehicles for which it has provided approvals. The UK has also begun a wider testing programme to understand the real world emissions of
18 COPERT 4v11 Computer Programme to Calculate Emissions from Road Transport: http://emisia.com/copert 19 Successive emissions standards have been set by the European Commission for certain types of vehicle. There are separate standards for light vehicles (cars and vans) and heavy vehicles (HGVs, buses etc.). The standards for light vehicles are indicated with a number e.g. Euro 6, while those for heavy vehicles are indicated with a roman numeral e.g. Euro VI. The most recent standards are Euro 6 for light-duty vehicles and Euro VI for heavy-duty vehicles. See: http://ec.europa.eu/growth/sectors/automotive/environment-protection/emissions/index_en.htm and http://europa.eu/rapid/press-release_MEMO-15-5705_en.htm

14
other vehicles on the market, including a sample of the newest and the UK’s top selling vehicles. These tests will compare real world driving emissions against laboratory performance. The UK is taking steps to ensure independence; neither the cars nor the testing facilities will be provided by the vehicle industry themselves. As COPERT emissions factors include an element of real world testing they take into account the difference between the emissions standard and real world performance.
49. We want to see, as already agreed, real driving emissions tests implemented as quickly as possible. Longer term, we want European policy on road transport’s contribution to air quality and climate change to be more joined up. We see real world vehicle testing as an essential part of this. The UK Government will continue to press the Commission for a comprehensive approach to emissions testing to restore consumer confidence and deliver our wider air quality, and climate change, objectives.
50. The impact of this agreement on real driving emissions is not included in the baseline projections set out in Table 3. However, we have taken it into account in certain scenarios, as part of assessing the impact of additional measures we are introducing, as set out in Section 4. In general the improved real world performance will provide additional benefits to the measures the UK is taking to achieve compliance and in many zones may bring compliance forward.
51. Due to the sensitivity of the modelling to the delivery of real world emissions improvements from the Euro 6 and upcoming Euro 6d standards, it will be important to monitor the performance of Euro 6 vehicles as they come to market. This plan has been developed based on the best available evidence. We will continue to monitor the emergence of new evidence and any potential impact on these plans.
52. Alongside the baseline projections from our modelling, Table 3 shows the projected dates for meeting our obligations on NO2. These are based on the measures being taken in this plan, including the introduction of Clean Air Zones. Additional local measures, while not quantified in this assessment, are likely to bring these dates forward more generally across all zones. Earlier delivery will be further supported by the introduction of RDE.

15
3. National action to improve air quality 53. Responsibility for meeting air quality limit values in the UK is devolved to the national
administrations in Scotland, Wales and Northern Ireland. The Secretary of State for Environment, Food and Rural Affairs has responsibility for meeting the limit values in England and the Department for Environment, Food and Rural Affairs (Defra) co-ordinates assessment and air quality plans for the UK as a whole.
3.1. England 54. Our projections show that due to the measures already implemented since our 2011
plans, alongside natural vehicle fleet turnover, we will have much reduced concentrations of NO2 compared to the 2013 baseline and be at or below the limit values in all but six20 cities in 2020.
55. The most significant challenge relates to these six cities in England that are projected to exceed the limit values in 2020. In these cities - London, Birmingham, Leeds, Nottingham, Derby and Southampton - additional measures will be required to address the particular issues, and areas, that are causing the exceedance.
56. For the five cities outside London, Government will require the introduction of Clean Air Zones, as set out below in Sections 3.5 and 3.6, along with additional measures in Leeds and Birmingham. In London the Mayor has already agreed to introduce a range of measures including the introduction of the Ultra Low Emission Zone (ULEZ).
3.2. Scotland 57. Four out of six zones and agglomerations in Scotland exceeded the limit values in
2013. Our projections indicate that by 2020, with measures presently in place, all zones in Scotland should be compliant with NO2 limit levels.
58. In November 2015, The Scottish Government published ‘Cleaner Air for Scotland – The Road to a Healthier Future’21 which sets out in detail how Scotland intends to deliver further improvements to air quality over the coming years, including full compliance with Directive requirements in Scotland by 2020.
59. The Cleaner Air for Scotland strategy sets out a national approach to improving air quality. There are three main areas of the strategy to deliver this national approach:
• the National Modelling Framework (NMF), which promotes a standard approach to assessing and evaluating air quality. The NMF provides evidence to support the actions and decision making process around land use and traffic management to improve local air quality;
20 There are seven air quality zones but the exceedance in the Eastern zone falls within the greater London area and is addressed by London action 21 http://www.gov.scot/Publications/2015/11/5671

16
• the National Low Emission Framework (NLEF) which is designed to enable local authorities to appraise, justify the business case for, and implement a range of, air quality improvement options. The NLEF will be supported by the analysis and evidence from the NMF; and
• communications to convey the health effects of poor air quality.
60. The approach taken in the Cleaner Air For Scotland Strategy is consistent with and complementary to this UK plan and will support the individual Scottish zone plans.
61. In Scotland, £0.5million of funding is available annually to local authorities to assist them with air quality monitoring. In addition, £1million is available annually for supporting action plan measures in Scotland.
3.3. Wales 62. Controlling air pollution in Wales is a high priority for the Welsh Government. The
driver is not only meeting the requirements of European legislation, but a commitment to protect human health and the environment. The Welsh Government takes very seriously the fact that our assessment shows four zones and agglomerations in Wales were in exceedance of the limit values in 2013 and will continue to work with stakeholders towards further improvement and to develop additional measures to achieve nationwide compliance in the shortest possible time.
63. The projections show that in 2020 three out of four of the zones will be compliant. In the South Wales zone a section of road, not more than 500 metres in length, remains the only location within Wales which is predicted to exceed the limit value beyond 2020.
64. The Welsh Government is committed to achieving compliance for the South Wales zone in the shortest possible time and at the latest by 2020. Working with stakeholders, the Welsh Government will look at a range of measures to meet limit values, including exploring with the local transport authority traffic management, measures to improve traffic flow, and noting that it is predicted that a targeted bus improvement scheme would bring this zone into compliance by 2020 at the latest. Further modelling undertaken for the South Wales zone, (section 4.1.1), indicates that improvements in vehicle emissions alone, following the agreement for real world emissions testing, will bring this zone into compliance by 2020.
65. In 2012 the Welsh Government launched a grant scheme for local authority-led projects to improve air quality, noise and the provision of tranquil urban green space, with an annual budget of £500,000. This was combined with other funding streams in 2015 to make a single local authority revenue grant for environment and sustainable development work. Action to improve air quality (over and above statutory duties under local air quality management) remains a stated purpose of this ongoing Welsh Government funding stream for local authorities.
66. In 2015, the purposes to which Welsh Government core funding for NGOs and small-scale project funding for community groups could be put were broadened to include

17
action to improve air quality. Prior to 2015, these funding streams could not be used for air quality work.
67. Reducing the contribution of transport to air pollution and other harmful emissions is one important objective of the Welsh Government’s Transport Strategy22. The Welsh Government published a National Transport Finance Plan in July 2015 setting out investment priorities for transport focusing on the next five years and beyond.
68. The interventions identified seek to improve air quality by promoting a shift from private motor vehicle use to active travel and integrated public transport, and supporting highway schemes designed to reduce traffic congestion. Key transport investments and proposals that will have a positive impact on air quality include:
• taking forward the Cardiff Capital Region Metro project – an integrated public and active travel system for South Wales focused on joining up and improving rail infrastructure, rail stations, park and ride schemes, bus routes and walking and cycling schemes;
• intelligent transport systems and other innovative technical solutions to reduce congestion on our strategic road network;
• continuing to support the shift of freight from road transport through grant support schemes;
• reflecting the introduction of the Active Travel (Wales) Act, directing funding at a local level for walking and cycling infrastructure and delivering travel routes in the urban nodes of Cardiff, Newport, Merthyr and Bridgend;
• improvements to the trunk road network designed to reduce congestion such as relief roads and bypasses;
• continuing to invest in the Bus Service Operators Grant and looking to include broader outcomes, including bus priority routes and reducing emissions;
• working with local authorities and bus operators to identify and resolve congestion and pinch points on the network that affect bus reliability, with a view to developing a package of bus priority measures along key strategic corridors; and
• railway improvements, including electrification of the Great Western Mainline and improvements to the Valleys Line in South Wales.
3.4. Northern Ireland 69. Of the two zones and agglomerations in Northern Ireland only the Belfast
Metropolitan Urban Area exceeded the limit values in 2013. Our projections show that this zone should be compliant by 2020 as a consequence of measures currently in place. The Department of the Environment for Northern Ireland intends to start a
22 http://gov.wales/topics/transport/planning-strategies/?lang=en .

18
comprehensive review of Northern Ireland’s clean air and air quality policy and legislation in 2016. The review will take account of ongoing research into pollution from residential emissions, as well as current problems with air pollution resulting from road transport emissions. The Department will work with local authorities in Northern Ireland to review the Local Air Quality Management regime, so that funding support is shifted away from monitoring and onto specific outcome-based measures which will improve air quality in problem areas.
70. Northern Ireland remains committed to the principle of sustainable development and improved air quality through the setting and implementation of new national policies which guide local planning including development plans and infrastructure investments. The Regional Development Strategy for Northern Ireland 2035 provides a spatial development framework and aims to reduce carbon emissions and enable adaptation to the effects of climate change, while improving air quality. A New Approach to Regional Transportation Strategy 2012 – A Sustainable Transport Future includes the high level aim: “To reduce the environmental impact of Transport.”
71. Transport plans and local development plans are now being developed in line with the new national policies highlighted above. In the interim, a number of initiatives are already in place that will reduce private car use and tail-pipe emissions, including:
• the Active Travel Strategy for Northern Ireland 2011–20 which is aimed at increasing walking and cycling and includes four demonstration projects in regional towns and cities;
• the development of the Northern Ireland Strategic Transport Model – a forecast model to test the change in travel behaviour likely to arise from possible changes in land use (new development), transport policy (e.g. public transport fares) or new infrastructure (e.g. increased road capacity or more frequent rail services);
• the Active School Travel Programme 2013–16 which is focused on long term behavioural change to reduce car dependency and increase use of active travel modes;
• E-car charging infrastructure. This project has installed over 350 charging points across Northern Ireland and provided grants for home charging equipment to encourage the purchase and use of electric vehicles with zero tail-pipe emissions; and
• the Bicycle Strategy 2015–40 was published in August 2015, and will be followed by a Delivery Plan including capital schemes.
• provision of around 2,000 additional park and ride spaces over the last 2 years at strategic locations across Northern Ireland to encourage use of public transport for onward travel to congested urban centres.
72. There are a number of relevant major infrastructure schemes that are planned for delivery during the 2016-2020 period, including:

19
• Belfast Rapid Transit – an urban public transport system with two primary arterial routes forecast to result in a significant shift from private car use;
• Railway track improvements between Coleraine and Derry – to facilitate further growth in rail passenger numbers and transfer from private cars;
• York Street Interchange Belfast - providing full grade separation of the three roads with the highest volume traffic in Northern Ireland and removing traffic queues that contribute to poor local air quality; and
• Belfast Transport Hub – a flagship project to develop and construct a new modern public transport facility integrating rail and coach services with new commercial developments and car-parking, to provide public transport access to the city centre.
3.5. Clean Air Zones 73. Clean air is essential for making sure our cities are welcoming places for people to
live and work, now and in the future. To realise our ambition for the UK to have some of the very best air quality in the world we must start with some of the most difficult challenges in our cities. Clean Air Zones are designed to help deliver this ambition.
74. Clean Air Zones are areas where only the cleanest vehicles are encouraged (through the use of vehicle emission standards) and action is focussed to improve air quality. They are geographically defined areas allowing action and resources to be targeted to deliver the greatest health benefits.
75. Clean Air Zones are grouped into classes covering different vehicle types as set out in Table 4 below.
Table 4: Clean Air Zone Classes
Clean Air Zone class Vehicles included
A Buses, coaches and taxis23
B Buses, coaches, taxis and heavy goods vehicles (HGVs)
C Buses, coaches, taxis, HGVs and light goods vehicles (LGVs)
D Buses, coaches, taxis, HGVs, LGVs and cars
23 Taxis will generally also include private hire vehicles

20
76. Vehicle owners will be required to pay a charge if they enter a Clean Air Zone which has a standard for their type of vehicle and it does not meet that standard. In this plan, no cities will be required to charge cars to enter a Clean Air Zone.
77. Clean Air Zones will be clearly signposted on access routes in a similar way to the current low emission zone in London. Any cities with Clean Air Zones other than Class A are likely to use cameras24 to ensure that those vehicle owners that are required to pay a charge do so.
78. In England Government will legislate to require the implementation of Clean Air Zones in five cities (Birmingham, Leeds, Nottingham, Southampton and Derby) as set out in Section 3.6 below. London already has plans in place to bring in their Ultra Low Emission Zone (broadly equivalent to a Class D Clean Air Zone) in 2020. Other local authorities can also adopt Clean Air Zones as a way to focus their action to improve air quality.
79. A number of authorities are already considering action to restrict polluting vehicles from city centres and several have already implemented schemes for buses. However, as industry and local authorities have made clear, different approaches in different cities can make it difficult for businesses and individuals that travel across a number of cities to make straightforward, economic and operational decisions about the vehicles they buy.
80. To address this uncertainty the Government will set out a clear Framework for Clean Air Zones which will include the important principles that need to be consistent from city to city, for example which vehicle standards to apply, to ensure Clean Air Zones are implemented in the same way by local authorities across England.
81. Setting out the principles in this way will support both those authorities required by Government to implement a Clean Air Zone and those who, after analysing their own situation, consider a Clean Air Zone to be an appropriate measure to bring in. Those authorities that have already implemented schemes which restrict polluting vehicles could transition these into a Clean Air Zone using the same principles. Any local authority choosing to implement a Clean Air Zone will normally decide which class of zone is appropriate for their situation and the type of vehicles which will be subject to control, based on their understanding of local conditions, underpinned by national and local modelling and monitoring.
82. As a consistent network of Clean Air Zones develops across the country, businesses and individuals will be able to purchase vehicles which they can be confident will be able to enter any Clean Air Zone without charge.
83. In 2016 we will consult on the detail of the proposal for Clean Air Zones and set out the approach through which we will impose duties on the five cities (Birmingham, Leeds, Nottingham, Derby and Southampton) to deliver them. We will also publish a full impact assessment. We will work closely with local authorities and other
24 Class A Clean Air Zones will be enforced through licencing and operating restrictions on buses and taxis or similar measures

21
stakeholders to ensure that we provide the guidance they would find most relevant and useful.
84. In those cities where there will be a duty on the local authority to implement a Clean Air Zone to ensure we meet the limits in the Air Quality Directive, we will require a certain class of Zone to be implemented. None of these cities will be required to charge cars to enter the Clean Air Zone. A local authority may choose to go further if it wishes to do so.
Vehicles in Clean Air Zones 85. To ensure that only the cleanest vehicles are encouraged to enter the Clean Air
Zones, vehicle standards will be based around Euro standards, either directly or through using vehicle manufacture dates as a proxy (similar to the approach currently taken in London). The minimum emission standards proposed for the most common conventional vehicles are set out in Table 5. Vehicles which do not meet these standards will be charged to enter the Clean Air Zone in line with the class of Zone in place.
Table 5: Clean Air Zone emission standards for common vehicle types
Vehicle type NOx Emissions limit
Bus/coaches Euro VI
HGV Euro VI
Van (1305-3500kg) Euro 6 (diesel) Euro 4 (petrol)
Car/light commercial (up to 1305kg) Euro 6 (diesel) Euro 4 (petrol)
86. We will set out a more complete description of vehicle types as part of the full Clean Air Zone design. The Euro standards have been used rather than just single pollutant emissions limits to help ensure emissions reductions are achieved for all pollutants not just NOx. The emissions standards for light vehicles have been set based on an equivalent level of allowed NOx emissions at 0.08g/km at the time of manufacture. The 0.08g/km limit was introduced for petrol cars in the Euro 4 standard but has only been introduced for diesel under Euro 6.
87. Raising the emissions standard of existing vehicles through retrofit and/or alternative fuels is part of our approach to addressing air quality and bringing forward compliance. The Clean Air Zone approach can help to support this by providing an additional incentive for conversion.
88. Similarly Clean Air Zones will allow all ultra low emission vehicles free access, to send a strong signal to support their use given the air quality and CO2 benefits such vehicles can deliver. This is the proposed approach in the Ultra Low Emission Zone in London which is broadly equivalent to a Clean Air Zone Class D. Clean Air Zones can also support the use of additional incentives for ultra low and zero emission vehicles, for example, chargepoints and preferential parking.

22
89. We will consider in detail appropriate standards to ensure hybrid vehicles, those using suitable alternative fuels, and those which have been retrofitted, can all enter the Clean Air Zones without restriction provided they meet comparable emissions levels in the urban environment. Indicative NOx emissions levels will be based on Euro VI/6 requirements. Government will also consider the need for standards on other pollutants, and pollution abatement equipment and controls, to ensure that vehicles meet equivalent standards for all pollutants not just NO2.
90. In the Clean Air Zone design we will also consider how the Zone standards might keep pace with vehicle development and whether in time they could be tightened to further reduce emissions and encourage the very cleanest vehicles. This has been the approach of the London Low Emission Zone and soon-to-be Ultra Low Emission Zone.
91. We will work with the DVLA and others to ensure that the necessary vehicle databases containing all the information required by local authorities for the operation of a zone are available.
92. We will consider the use of exemptions for certain vehicles (for example, emergency services).
93. Both nationally and locally, any action to tackle air quality must use the best information and evidence to assess the impact of different approaches. We will continue to review the performance of the new Euro 6 light duty vehicles which are now coming into service. This will be relevant to any local authority considering the introduction of a Clean Air Zone which extends to light duty vehicles.
94. To ensure retrofitted vehicles meet the required standards we will develop a national accreditation scheme to operate alongside the standards and to be incorporated into the vehicle database. Work on accreditation is already underway, for example, OLEV has match-funded industry contributions to develop an accreditation scheme for low carbon HGV technologies. For more details see Annex 2, Section 7.4.1.
3.5.1. Clean Air Zones as part of a coherent local approach 95. Clean Air Zones will bring together action to enhance public transport and accelerate
the transition to ultra low emission vehicles, both to increase local uptake and to support national ambition. We want to create places which encourage walking and cycling for short journeys or as part of a longer journey and make the most of public transport.
96. It is intended that the introduction of a Clean Air Zone will also have an impact in the wider area and guide investment. This will include direct impacts, for example influencing the provision of local passenger transport that passes into or through a zone, and also indirectly by demonstrating exemplar cities to stimulate change by others.
97. Action linked to a Clean Air Zone might include: integrated public transport networks based on low emission vehicles; park and ride schemes; provision of infrastructure for electric charging or other alternative fuels; promotion of electric vehicle use, particularly in public sector fleets, public transport, and for the last mile of deliveries
23
within city centres (e.g. trialled during the 2012 Olympics); urban traffic management; business recognition schemes (e.g. ECO-Stars freight scheme which aims to help fleet operators improve fuel efficiency and reduce emissions); and preferential access for electric vehicles or benefits such as parking spaces or taxi ranks.
98. This approach of a Clean Air Zone acting as a focus for integrating action to improve air quality is what differentiates it from a traditional low emission zone which only seeks to exclude polluting vehicles.
Beyond transport 99. Action within Clean Air Zones is not limited to transport. We will identify how relevant
emission limits could be applied to Non-Road Mobile Machinery (NRMM), particularly construction equipment, mobile generators and short term operating reserve generators to ensure only the cleanest equipment can be used within a Clean Air Zone. This type of approach is already in place in London for construction equipment.
100. We will also consider how to encourage further the use of low NOx boilers both in domestic and commercial premises.
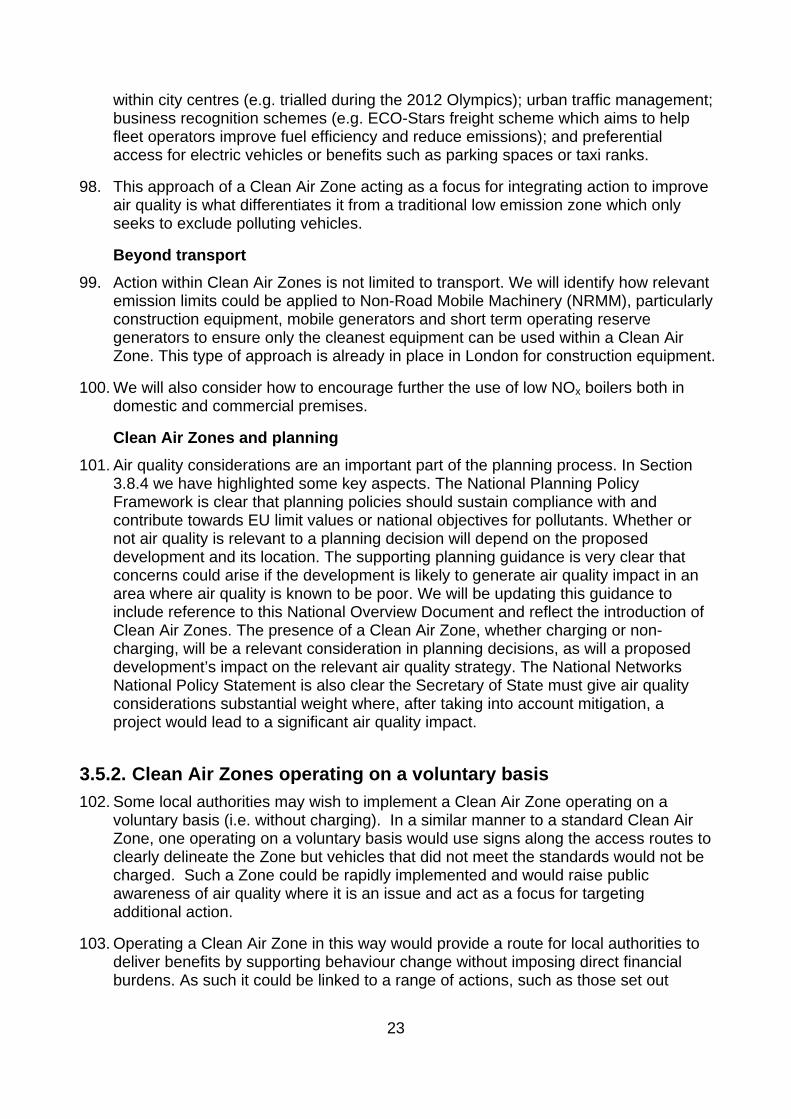
Clean Air Zones and planning 101. Air quality considerations are an important part of the planning process. In Section
3.8.4 we have highlighted some key aspects. The National Planning Policy Framework is clear that planning policies should sustain compliance with and contribute towards EU limit values or national objectives for pollutants. Whether or not air quality is relevant to a planning decision will depend on the proposed development and its location. The supporting planning guidance is very clear that concerns could arise if the development is likely to generate air quality impact in an area where air quality is known to be poor. We will be updating this guidance to include reference to this National Overview Document and reflect the introduction of Clean Air Zones. The presence of a Clean Air Zone, whether charging or non-charging, will be a relevant consideration in planning decisions, as will a proposed development’s impact on the relevant air quality strategy. The National Networks National Policy Statement is also clear the Secretary of State must give air quality considerations substantial weight where, after taking into account mitigation, a project would lead to a significant air quality impact.
3.5.2. Clean Air Zones operating on a voluntary basis 102. Some local authorities may wish to implement a Clean Air Zone operating on a
voluntary basis (i.e. without charging). In a similar manner to a standard Clean Air Zone, one operating on a voluntary basis would use signs along the access routes to clearly delineate the Zone but vehicles that did not meet the standards would not be charged. Such a Zone could be rapidly implemented and would raise public awareness of air quality where it is an issue and act as a focus for targeting additional action.
103. Operating a Clean Air Zone in this way would provide a route for local authorities to deliver benefits by supporting behaviour change without imposing direct financial burdens. As such it could be linked to a range of actions, such as those set out

24
above, and encourage individuals and businesses across all vehicle types to think about the modes of transport they use and what type of vehicles they purchase.
104. Where a charging Clean Air Zone is needed it could initially be operated on a voluntary basis. The resulting action and behaviour change could potentially reduce the need for the charging Clean Air Zone or reduce either the number of vehicle types to be included within the controls or the area the Zone needs to cover. This phasing in of Clean Air Zones would send a clear market signal allowing individuals and businesses to consider air quality as a factor in purchasing decisions over time.
3.6. Clean Air Zones outside London 105. Birmingham, Leeds, Southampton, Derby and Nottingham will need to take additional
action in order to achieve the limit values in the shortest possible time and at the latest by 2020.
106. In order to ensure this action is delivered Government will impose legal requirements on the relevant local authorities in these cities to implement a defined class of Clean Air Zone. Government has allocated funding to help these local authorities implement Clean Air Zones, support the implementation of additional measures where necessary and meet new burdens associated with implementing the Zones. Government will of course keep under review the effectiveness of such measures and may also take further action to ensure NO2 requirements are met if this appears to be in doubt.
107. The class and extent of any Zone ultimately required in each city will depend upon the outcome of a more detailed local assessment. The combination of measures required, along with details of the Zone, will be determined through scoping studies led by local authorities and which will be funded by central Government. Achieving value for money will be a core consideration.
108. However, based on our current assessment, the expected combination of a Clean Air Zone and other local measures we will require is set out below in Table 6.
Table 6: Summary of Clean Air Zone requirements outside London
CITY MEASURE REQUIRED BY 2020
Birmingham Class C and additional local action
Leeds Class C and additional local action
Nottingham Class B
Derby Class B
Southampton Class B
109. Action that will need to be taken by London is dealt with separately in Section 3.7.

25
3.6.1. Detail of actions required Leeds and Birmingham
110. Leeds and Birmingham will be required by Government to implement a Class C Clean Air Zone. The class and area of the Zones will be finalised based on scoping studies funded by Government.
111. Modelling indicates the need for measures additional to a Clean Air Zone in these cities to reduce NO2 to the required level in the shortest possible time and by 2020 at the latest. This will be a combination of improved signage and rerouting, switching to different forms of transport (e.g. use of Park and Ride), road improvements, and infrastructure for alternative fuels (e.g. support for use of compressed natural gas (CNG)). The scoping studies supported by Government funding will assess the optimum balance of additional measures. Where additional measures are required Government will keep the delivery of such measures under review, and will take further action if progress is insufficient.
Nottingham, Derby and Southampton 112. Nottingham, Derby and Southampton will be required to implement a Class B Clean
Air Zone to reduce NO2 levels to the necessary level in the shortest possible time and by 2020 at the latest. The class and area of the Zones will be finalised based on the scoping studies funded by Government.
113. The scoping studies that will be undertaken prior to Clean Air Zone implementation will ensure issues such as traffic displacement can be effectively addressed. This will avoid creating new problem areas and can take account of expected growth in and around the key cities.
3.7. Greater London 114. The Greater London urban area currently has the highest NO2 exceedance in the UK.
The size and complexity of the Capital’s transport networks and construction activity from unprecedented growth means the task of reducing NOx emissions, and NO2 concentrations, is the most challenging in the country.
115. London has a particular set of issues due to the scale of its population and the level of challenge presented by current levels of NO2. A number of other factors also combine to make London a unique situation, these include: the fleet composition; the level of control exercised by the Mayor over public transport; existing infrastructure; air quality measures already in place; the scale and distribution of air quality exceedances; and, the sheer scale of the London area. To reflect these factors our approach to London is necessarily different from other cities.
116. Greater London also covers parts of the Eastern air quality zone because the Greater London Authority boundary does not match the boundary of the Greater London agglomeration air quality zone. Measures to address air quality within other zones that fall within the Greater London Authority boundary are included in the London measures.

26
117. The Mayor is required25 to produce a London Environment Strategy, which must contain provisions dealing with air quality. The Mayor also has powers26 to direct the boroughs in the performance of their Local Air Quality Management functions which may be used to require action to be taken for the purpose of meeting the UK’s obligations under the Air Quality Directive, particularly as regards any current breach. The Mayor may also give boroughs guidance as to how they are expected to discharge their air quality management functions.
118. In London, the breakdown of traffic sources is also considerably different to other areas of the UK (Figure 3). Emissions from diesel vehicles continue to dominate, but the distribution includes a broader range of vehicles including cars, heavy goods vehicles, light goods vehicles, buses and taxis. These averages also conceal significant local variation. For example, the average taxi contribution is 3% of total concentrations but on some of the roads with the most intractable problems it is over twice this level and equivalent to over 10% of the traffic emissions.
Figure 3: Average NOx source apportionment on UK road links in London exceeding an annual mean NO2 concentration of 40µg/m3 in 2013
119. In 2010 the Mayor of London published his Air Quality Strategy. This is a statutory
document which commits the Greater London Authority and Transport for London to implement certain measures, most of which are now in place. This year the Mayor confirmed a further package of measures, including the Ultra Low Emission Zone to be implemented in stages in the years up to 2020.
120. Overall, the Mayor has been taking forward a comprehensive and ambitious package of measures to bring London into compliance with NO2 limit levels in the shortest possible time. This includes actions to:
25 Under the Greater London Authority Act 1999 26 Under the Environment Act 1995

27
• reduce emissions from buses. By 2016 NOx emissions from the London bus fleet will have been halved compared to 2008 due to the introduction of: 1,700 hybrid buses; the world’s largest bus retrofit programme; and trials of new technologies such as electric and hydrogen buses;
• reduce emissions from taxis. The introduction of an age limit for taxis has retired more than 6,000 of the most polluting taxis, and from 2018 new London taxis will be required to be zero emission capable;
• reduce emissions from other sources. Air quality neutral requirements in planning provisions are reducing emissions from future developments; new minimum emissions planning standards for construction equipment will deliver a reduction in NOx emissions in this sector of around 40% relative to 2013 levels; and energy efficient retrofit programmes have reduced emissions from more than 500,000 buildings across the capital; and
• tackle local hotspots. A new £20m Mayor’s Air Quality Fund is supporting London boroughs in tackling local air quality. The first round of funding of £6m is already supporting 42 projects in 29 boroughs.
121. In addition to these measures as part of the 2015 Spending Review settlement for Transport for London the Mayor put forward proposals to:
• ensure the bus fleet will meet the Euro VI standard;
• the remainder of the black cab fleet will become zero-emission capable; and
• the ULEZ being fully implemented.
122. Alongside these actions the Mayor has consulted on a new approach to Local Air Quality Management for London boroughs to reflect the capital’s unique challenges and opportunities for innovative solutions to poor air quality. This system will help ensure that the boroughs’ statutory responsibilities are simplified and clear and will also provide support, coordination and resource to help ensure consistent and effective action at the local level.
123. The air quality zone plan for the London Urban Agglomeration sets out more detail on these and other actions being undertaken to improve air quality in London.
3.7.1. Clean Air Zones in London 124. As part of the London Air Quality Strategy and reiterated as part of the Spending
Review settlement the Mayor has committed to an Ultra Low Emission Zone (ULEZ) in central London, which will be delivered in phases by September 2020. The ULEZ includes new exhaust emissions standards for vehicles driving in central London that are broadly equivalent to a Class D Clean Air Zone.
125. From September 2020, all cars, motorcycles, vans, minibuses and Heavy Goods Vehicles (HGVs) travelling within the ULEZ will need to meet strict exhaust emission standards or pay an additional daily charge. The Mayor has defined the ULEZ

28
emission standards as Euro 6 diesel vehicles, Euro 4 petrol vehicles and Euro VI HGVs, buses and coaches, consistent with a Class D Clean Air Zone.
126. The ULEZ also includes a commitment from TfL that, by 2020, all 3,000 double deck buses operating in central London will be hybrid diesel-electric and all 300 single decks will be zero tailpipe emissions (i.e. hydrogen or pure electric).
127. The ULEZ includes the introduction of new London-wide vehicle licensing requirements for taxis and private hire vehicles. From 2018, all taxis licensed for the first time need to be zero emission capable, with a maximum 15 year age limit. New emission standards will also be introduced for private hire vehicles: from 2020 all new vehicles licensed for the first time need to be zero emission capable.
128. The introduction of the ULEZ will contribute to a significant reduction in NOx emissions and roadside NO2 concentrations elsewhere in London. The majority of traffic entering the ULEZ will be from outside the zone, leading to wider benefits on roads across Greater London and potentially further afield. The Greater London Authority estimate this will lead to around 82% of central London having a mean concentration of less than 40µmg/m3, while the number of people living in areas of exceedance would reduce by 72% in central London and 50% outside the zone.
129. London also has in place an existing low emission zone for larger vehicles such as buses, HGVs and vans27. Our national Pollution Climate Mapping model shows that in order meet the limit values for NO2 across all of Greater London by 2025 at the latest, as well as implementing the ULEZ in 2020, the London Low Emission Zone will need to meet the standards of a Class C Clean Air Zone by 2025.
130. However the Mayor has proposed a number of measures (see paragraph 131) that can be applied in London alongside the ULEZ. Our analysis28 demonstrates this delivers the same outcome within the same timescale when combined with the tightening of the current low emission zone to a minimum equivalent to Class B Clean Air Zone (see technical report).
131. The Greater London Authority is in the process of developing proposals for tightening the current low emission zone29, subject to statutory process and consultation. Government will keep the delivery of London measures under review, and will take further action if progress is insufficient.
3.8. Improving air quality in all areas 132. Alongside the specific challenges in the six cities set out above we need to tackle the
problem of air pollution across the UK. Action is required in all of the zones that currently have air quality problems to ensure they meet the required NO2 levels in the shortest possible time. Local authorities in zones forecast to meet the levels in 2020, or before, will need to monitor progress and ensure the measures they are taking
27 https://tfl.gov.uk/modes/driving/low-emission-zone 28 Analysis based on data provided by Transport for London 29 Item 5 Future of ULEZ and LEZ (TEC 10/12) http://www.londoncouncils.gov.uk/node/28008

29
under local air quality management arrangements are delivering results as soon as possible.
133. As a minimum we expect all local authorities with areas currently exceeding the required levels to consider putting in place a Low Emission Strategy. Such a Strategy could be used to set out a range of commitments and actions to tackle pollution as part of a coherent multi-year programme and ensure they identify and exploit the national assistance available.
134. In developing our measures we have explored with local authorities their understanding of the issues in order to develop a fully rounded picture of the steps that need to be taken. The UK Government will continue to work closely together with the cities of London, Birmingham, Leeds, Nottingham, Derby and Southampton, and other local authorities as necessary, through the implementation phase.
3.8.1. Local air quality management 135. Local authorities have a central role in achieving improvements in air quality. Their
local knowledge and interaction with the communities that they serve mean that they know the issues on the ground in detail and the solutions that may be necessary or appropriate.
136. Through the existing Local Air Quality Management (LAQM) system local authorities are required30 to assess air quality in their area and designate air quality management areas (AQMA) if improvements are necessary. Where an air quality management area is designated, local authorities must produce an air quality action plan describing the pollution reduction measures to be put in place.
137. UK local authorities have designated over 700 active AQMAs, more than 670 of which concern NO2, and put in place local air quality action plans.
138. We are consulting on improving the LAQM system to increase its focus on supporting local authorities to take action, in particular on priority pollutants such as NO2
31. The consultation proposes guidance changes to reduce reporting burdens on local authorities and enable them to direct more of their resources to delivering action. We are also updating the Emissions Factor Toolkit which supports local authorities in developing localised air quality assessments.
139. There is also potential for future Growth Deals or Devolution Deals to include measures to encourage a focus on air quality. The West Midlands included air quality in their devolution deal agreed with Government in November 2015. As part of the deal, the West Midlands will bring forward proposals for potential inclusion in the West Midlands Mayoral Parliamentary Order. As we work with local authorities to develop and implement devolution deals we will seek to ensure these align with our aims to reduce NO2 concentrations as well as other pollutants.
30 Under the Environment Act 1995 and Environment (Northern Ireland) Order 2002 31 Local Air Quality Management review: changes to guidance and reporting - Consultations - GOV.UK

30
3.8.2. Local action 140. Local authority action is critical to delivering improvements in air quality and the
protection of public health. As the UK improves air quality, air quality hotspots are going to become even more localised and the importance of local authority action will increase. National Government plays an important role in supporting that action through a range of funding and guidance.
141. Individual actions by local authorities to address NO2 are set out in detail in each of the 38 air quality zone plans that accompany this document. In total these highlight around 6000 measures that have been undertaken, are underway or are planned.
142. These actions demonstrate how a range of innovative and targeted approaches to managing local air quality issues is addressing NOx emissions and roadside NO2 concentrations. Many local authorities are encouraging cleaner ways of travel. They are supporting the uptake of cleaner vehicles through introducing low emission zones and using more ultra low emission vehicles in their own fleets; providing infrastructure such as electric vehicle charging points; introducing park and ride schemes and promoting cycling and walking. For example:
• Oxford, Norwich and most recently Brighton have implemented low emission zones to ensure the use of cleaner buses;
• Local authorities in West Yorkshire are working together to make the area a leader in encouraging ultra low emission vehicles through a combined transport plan;
• Manchester and surrounding authorities are putting in place a range of measures including: electric vehicle infrastructure: improvements to public transport: working with freight operators; improvements to local road schemes and the promotion of cycling and walking;
• Leicester has encouraged cleaner taxis through a 50% reduction in the licence fee for those at Euro 6 standard. A Bristol car club is trialling six new diesel electric vehicles and electric powered cycles together with promoting eco-driving;
• Bournemouth has seen its approach to public transport contribute to a rise in the use of rail, bus, walking and cycling. New suburban rail and rapid bus schemes in Bristol are helping provide public transport alternatives;
• Middlesbrough has installed cycle paths and infrastructure along transport corridors to improve journeys and connect major trip-generating locations to areas of housing, alongside cycle training and promotional events. In Southend a social enterprise offers reconditioned cycles at affordable prices alongside advice on all sustainable modes of transport; and
• projects funded by the Welsh Government since 2012 include: the Swansea Nowcaster Project, linking real-time air quality modelling to variable traffic message signs for road users; optimising traffic signal in Rhondda Cynon Taf to improve traffic flow; road layout changes in Merthyr Tydfil to reduce NO2 concentrations and tree planting to absorb pollutants in Neath Port Talbot.

31
3.8.3. National support for local authorities 143. To help deliver the local action identified by local authorities through the LAQM
process national Government operates a number of schemes through which local authorities can access support to deliver improved air quality in their areas. These range from direct support for focussed air quality action through the air quality grant scheme to broader measures supporting green transport.
The Air Quality Grant
144. Defra’s air quality grant scheme supports expenditure by eligible local authorities in England on measures to improve air quality. The scheme has awarded over £10.5 million in funding in the last 10 years to a variety of projects to help local authorities in making air quality improvements.
145. In recent years we have targeted funding at those authorities who are exceeding limits for NO2 in their area, supporting a wide range of projects including scoping studies for low emission zones and behaviour change and community engagement projects.
146. In 2015/16 we will provide £0.5 million to local authorities and we will provide more funding in future years to assist the delivery of compliance in the shortest possible time in all zones. Supporting local greener transport initiatives
147. The UK Government is supporting local authorities, public transport providers and others to introduce local transport initiatives to help tackle pollution, reduce NOx emissions, and create local growth. To increase the use of buses, cycling, walking and other local transport initiatives. We have committed:
• £580 million for a new ‘Access’ fund for sustainable travel over 2015 to 2020, building on the legacy of the Local Sustainable Transport Fund and supporting growth in cycling and walking;
• £7m under the Clean Bus Technology Fund in 2015 to help local authorities and operators retrofit and upgrade buses; and
• £30m via a new Low Emission Bus Scheme in 2015, now extending to Wales as well as England, for bus operators and local authorities to invest in low emission buses and/or supporting infrastructure.
148. A Cycling and Walking Investment Strategy for England (CWIS) will be published in 2016 and a statement of the funds available will be published by February 2016. The CWIS will build on a range of investment already put in place. The Government has already provided considerable investment to support cycling and walking programmes across England. More details on these are in Annex 2. Between 2015 and 2021 Government will invest at least £300m.

32
149. Cleaner Air for Scotland32 provides further details of actions and support to reduce NOx emissions through greener transport initiatives in the country.
3.8.4. Infrastructure and land use planning 150. New infrastructure and other developments need to be sensitively planned to ensure
they do not add to, or cause, significant additional air quality issues. Air quality should be considered early in any development so that mitigation measures can be developed where necessary. Air quality considerations are firmly embedded within national policy which includes strong protections to safeguard people from unacceptable risks from air pollution, as set out in Annex 2.
151. The National Planning Policy Framework (2012) sets out national planning policies and principles for England and how these are expected to be applied, and is supported by Planning Practice Guidance on air quality. We will update this guidance to include reference to this UK overview document and to reflect the introduction of Clean Air Zones.
32 http://www.gov.scot/Publications/2015/11/5671

33
4. Impact of measures 152. As this plan sets out, action across a range of areas will help reduce the level of NO2
to deliver our air quality ambitions and meet our legal and environmental obligations. As we move forwards our projections show the issues become much more localised in nature. For each zone we have considered the trajectory between the reported compliance data for the base year of 2013 and the projection for 2020. Local authorities have provided information on action currently underway and planned, including action on transport that could have significant air quality impacts.
153. As the modelling provides five year snapshots of the air quality situation we have not been able to identify more precise zone by zone compliance dates within these five year periods. It has also not been possible to quantify the impacts of all of the local and national level measures on emissions and ambient concentrations through the national Pollution Climate Mapping (PCM) model. These unquantified measures will bring compliance forward in their respective zones, although the impact in the five cities and London is not likely to be significant enough relative to the challenge they face.
154. In assessing the impact of selected local measures we have used a streamlined version of our PCM model. This streamlined model focuses on the impact of measures on roads which exceed the limit values. It does not capture the wider impacts of the local measures in terms of fleet change or their impact on background concentrations of NO2. It will, for some measures, underestimate the impact such as that of cleaner cars driving outside Clean Air Zones. Further details of the streamlined model are set out in the technical report.
155. The models are not able to take into account the displacement effect of Clean Air Zones and other similar measures on surrounding roads. Scoping studies prior to implementation of the Zones will ensure boundaries are designed to minimise the negative impacts of any displacement and ensure other roads do not lead to cities failing to meet limit values by the dates set out below.
156. As mentioned in Section 3.6, for the cities where Government will require the local authority to implement a Clean Air Zone, it is possible that the detailed evidence generated through these studies may result in the final class of Clean Air Zone being different to that we currently envisage. However, no changes would be made which would delay those cities meeting the limit values compared with the dates identified below.
157. We have met with those local authorities who have roads projected to be only marginally compliant in 2020 to ensure that there is continuing action in these zones to bring forward the point at which limit values are met. The individual zone plans describe local authority action which, combined with the measures outlined in this national plan, will help to bring forward compliance as soon as possible in these zones, ensuring that the limit values are achieved in the shortest possible time and at the latest by 2020.
158. For those zones that are projected to still have exceedances in 2020 the action local authorities are already taking is not yet enough to be at or below the 40μg/m3 limit

34
level earlier. The most persistent exceedances in these zones are within the six cities identified in this plan (London, Leeds, Birmingham, Southampton, Nottingham and Derby) and a short stretch of road in the South Wales zone outside of Cardiff.
159. We have run the full PCM model applying Clean Air Zones as set out below. Where necessary we have modelled further local measures using the streamlined PCM model. Further details are outlined in the technical document accompanying this plan, together with an analysis of the costs and benefits.
4.1.1. Achieving limit values outside London Birmingham
160. The full PCM model was used to assess the impact of a Class C Clean Air Zone in central Birmingham. The streamlined PCM model was used to further assess the impact of improved signage and rerouting, along with the introduction of real world driving emissions testing for light duty vehicles. Based on the projected impact of the combination of the Clean Air Zone with these additional measures, the modelling showed Birmingham would be at or below limit values by 2020.
Leeds 161. The full PCM model was used to assess the impact of a Class C Clean Air Zone in
Leeds. The streamlined PCM model was used to further assess the impact of improved signage and rerouting, along with the introduction of real world driving emissions testing for light duty vehicles. Based on the projected impact of the Clean Air Zone with these additional measures, the modelling showed Leeds would be at or below limit values by 2020.
South Wales Zone 162. Baseline projections from the full PCM model were supplemented by streamlined
PCM model analysis to assess the introduction of real world driving emissions testing for light duty vehicles. The streamlined model showed the South Wales zone would be at or below limit values by 2020.
Nottingham 163. The full PCM model was used to assess the impact of a Class B Clean Air Zone in
Nottingham. The model showed Nottingham would be at or below limit values by 2020.
Derby 164. The full PCM model was used to assess the impact of a Class B Clean Air Zone in
Derby. The model showed Derby would be at or below limit values by 2020.
Southampton 165. The full PCM model was used to assess the impact of a Class B Clean Air Zone in
Southampton. The model showed Southampton would be at or below limit values by 2020.

35
166. This modelling shows that it is possible to deliver the level of change required for the zones outside London to be at or below the limit value by 2020. As with those zones already projected to be at or below the limit values by 2020 it is not possible to estimate a more specific compliance date within the five years before 2020 and there will be some variation between zones with some achieving levels below the limit value earlier than modelled.
167. There are practical limits on how quickly all measures could be introduced, for example due to capacity and technical constraints on programmes. Despite consultation and stakeholder engagement, we have not identified other appropriate national measures which would help to bring forward dates for reaching the required limit values of NO2. In our response to the consultation document, which will be published in February 2016, we will set out in greater detail our reasons for not adopting other measures for tackling emissions which have been considered when formulating these plans.
168. We therefore consider that the measures in the plan will improve the air quality in all zones outside London to meet the requirements of the Directive in the shortest possible time, projected to be by 2020. Many individual zones may do so before 2020.
169. Map 2 in Annex 3 shows the impact of this plan on projected annual mean roadside NO2 concentrations for 2020.
4.1.2. Achieving limit values in London 170. Modelling of London specific measures based on information provided by the Greater
London Authority, set out in Section 3.7 of this overview, shows that with these measures in place NO2 levels will be at or below limit values by 2025.
171. As a comparator we have used the PCM model to assess the impact of the Ultra Low Emission Zone, in place in 2020, (Class D Clean Air Zone plus additional requirements) and the current London Low Emission Zone converted to a Class C Clean Air Zone by 2025. This alternative approach also modelled that London will be at or below limit values by 2025.
172. We consider that the measures in these plans, together with the many measures already in place, will improve air quality sufficiently in London to meet the requirements of the Directive in the shortest possible time, projected to be 2025.
173. Map 3 in Annex 3 shows the impact of this plan on projected annual mean roadside NO2 concentrations for 2025.

36
5. Detailed measures 174. This section provides more detail on the additional measures we plan to take at a
national level to ensure all zones achieve legal limits for NO2 concentrations in the shortest possible time. This is further supplemented by the information in Annex 2.
175. Measures arising from the Government’s approach to avoiding the risk of dangerous climate change are also helping to lower emissions in our towns and cities. The Climate Change Act 2008 is at the heart of this approach. The UK was the first country to introduce legally binding emission reduction targets. As the world’s first long-term legally binding national framework, the Act requires us to reduce our emissions by at least 80% by 2050 and 34% by 2020 based on a 1990 base year.
5.1. Incentivising ultra low emission vehicles 176. Meeting our long term goal of electrification of the fleet will be critical to the delivery
of sustainable permanent improvement in air quality and the decoupling of economic growth from both CO2 emissions and air pollution.
177. Electric vehicles, hydrogen fuel cell vehicles and plug in hybrids (when driven in electric mode) produce no pollution at point of use and are the long term answer to road transport air quality problems. The UK wants to be at the global forefront of ultra low emission vehicle development, manufacture and use, with our aim for nearly every car and van to be effectively zero emission by 2050.
178. Through the Office of Low Emission Vehicles (OLEV) the Government is providing a package of funding for businesses, consumers and local authorities that puts the UK at the cutting edge of investment and innovation. A number of schemes have already delivered a range of support, as illustrated in Table 7. Further details of Government support for the sector continue to be announced.
179. The last Government committed £400m to support the uptake of ultra low emission vehicles. In the 2015 Spending Review it was announced that the Government would spend more than £600m between 2015 and 2020 to support ultra low emission vehicles in the UK. The UK is the fourth largest market for ultra low emission vehicles globally, the largest single market in the EU and has the most extensive network of rapid chargers in Europe.
180. The recent Spending Review settlement means that the UK will continue to provide one of the most comprehensive packages of support for ultra low emission vehicles in the world. The Plug-in Car Grant continues at £5,000 until March 2016 and confirmed funding of £600m means that a grant can remain for several years, as long as there is a demonstrable market need.

37
Table 7: Details of key OLEV schemes for 2010-15.
Progress so far in supporting ultra low emission vehicles – examples of spending from 2010/11 to 2014/15
Measure Spending Delivery
Vehicles £128m Over 45,000 plug-in car grants have been awarded since the scheme was launched in 2011. 30 different models are currently eligible for the plug-in car grant, with another 10 currently planned for release in 2016.
Charging infrastructure £82m The UK now has 690 rapid chargepoints, more than 7,000 publically accessible fast and slow chargers, approximately 500 workplace chargepoints, and around 60,000 home chargepoints
Research and development £82m Grant funding committed to well over 120 industry-led R&D projects.
5.1.1. Innovation and alternative fuels 181. The Government is working to address the environmental impacts associated with
the road freight sector through encouraging the uptake of cleaner fuels and supporting developments in vehicle technologies and refuelling infrastructure. The Government is keen to see the ongoing development and deployment of cleaner burning fuels, such as gas to liquids, and fuel additives which can provide opportunities to reduce NOx and other polluting emissions from the existing vehicle fleet.
182. We need to continue to invest in a cleaner environment and look for future innovation and new technologies to reduce emissions and benefit the UK economy. To help drive this innovation, at the Spending Review we reaffirmed our £500m commitment, matched by industry, to the Advanced Propulsion Centre33. This £1bn will help transform Britain into a world leader in the development and production of low emission propulsion technology.
183. The use of alternative fuels also presents opportunities, for example through increased use of liquefied petroleum gas (LPG) in taxi fleets where appropriate and liquefied and compressed natural gas (LNG/CNG) in HGVs. Trials are in progress to explore this potential in HGVs, along with a Department for Transport (DfT) funded research project to improve our understanding of the greenhouse gas and air
33 http://www.apcuk.co.uk/

38
pollution impacts associated with gas and dual-fuelled (diesel/gas) HGVs. Through the Low Carbon Truck Trial (see Section 5.4.4) the Government is also providing over £11m to help operators establish and run fleets of low carbon HGVs.
5.1.2. Government procurement 184. Central Government is taking action to ensure their operations and purchasing power
support reductions in NO2 and other pollutants. The Government Buying Standards (GBS) for vehicles set down minimum mandatory and best practice standards requirements for cars, vans, buses and trucks. All central Government departments and their related organisations must ensure that they meet the minimum mandatory GBS.
185. The current GBS is focused primarily on reducing CO2 emissions but early next year we will publish revised standards with the intention of encouraging the purchase of ultra low emission vehicles where appropriate. We are also updating the standard for cars and vans. These actions will ensure that NOx emissions are taken into account in procurement decisions and will aim to help procurers make an informed decision as to the size and type of vehicle required, reflecting the area in which the vehicle will be used (e.g. a Clean Air Zone) and the type of usage.
186. Government departments can make their procurement more sustainable by going further and voluntarily following or specifying the best practice standard in tenders. The wider public sector, including Local Government, is also encouraged to specify the GBS standards in tenders.
187. The revised GBS will reward manufacturers who reduce the carbon and NOx emissions of their vehicles, sending a clear message to the market that it is not only carbon emissions that need to be reduced but also vehicle pollutant emissions.
5.2. The national and local road network
5.2.1. Road investment strategy 188. Whilst there have been improvements in air quality in recent decades we recognise
there is more to be done to continue to reduce pollution on the national road network. Traffic that moves more freely improves both air quality and productivity, for example through time saving.
189. Within the Road Investment Strategy there is £100 million of committed funding over the next 6 years to help support the development of innovative solutions to bring about improvements in air quality.
190. Highways England will undertake 10 studies within the first three years of the Road Investment Strategy to help deliver on this commitment. The studies will look at the specific causes of pollution in a geographic area and will explore local options for reducing pollution or alternatively the effectiveness of a specific intervention. They will also consider the applicability of solutions to the wider network.

39
191. The work undertaken by Highways England as part of the Road Investment Strategy will help support scheme delivery, as well as the objective of meeting limit values in the shortest possible time. Highways England will aim to:
• build a clear picture of pollution across the national road network through improved air quality monitoring;
• work with partners, both across Government and locally, to develop and deliver policies to help improve air quality;
• explore ways of actively managing the use of the road network to reduce air pollution; and,
• explore and implement new and innovative approaches, where they are demonstrated to be viable and effective, on the motorway and trunk road network to improve air quality.
5.2.2. Specific road improvements 192. Alongside this national approach to improving the Strategic Road Network in
England, existing investment and coordinated local action to reduce congestion is addressing air quality at particularly problematic road junctions. More detail is available in zone plans, where appropriate, but examples include:
• Northwest and Merseyside: As highlighted in the National Infrastructure Plan, a second Mersey crossing is being built, due to open in 2017. This is a major scheme to build a new six-lane toll bridge over the River Mersey between the towns of Runcorn and Widnes. The new bridge will relieve congestion on the current Silver Jubilee Bridge reducing traffic volume and pollution emissions significantly. It will also enhance the general urban environment, while improving public transport links across the River Mersey and encouraging the increased use of cycling and walking. Over 70% of funding for the project is coming from the private sector.
• Nottingham: improvements to the Ring Road (A6514) to reduce congestion and delays, will also help address pollution emissions. This includes the upgrading and redesigning of key junctions, widening and reconstruction of the carriageway, and better road facilities for buses, pedestrians and cyclists. The scheme is due for completion in spring 2016.
• Birmingham: The remodelling of the Paradise Circus gyratory taking place in the city centre will help tackle pollution emissions. A change will be made in vehicle access to and from Broad Street which will be restricted to allow only buses and Hackney Carriages. This is expected to be completed by summer 2016. In addition the Metro is in the process of being extended to Centenary Square via the Paradise Circus redevelopment and is expected to be completed by 2018.

40
193. In Wales, the Welsh Government has set out its plans to invest in sustainable highway improvements in its National Transport Finance Plan34 based on improvements to the trunk road network designed to reduce congestion; such as relief roads and bypasses. Specific schemes include:
• The M4 corridor around Newport and complementary measures;
• M4 J28 improvements, South East Wales;
• Improvements to the A55/A494/A548 corridor in Deeside, North Wales; and,
• The A483/A489 Newtown and A483 Llandeilo bypasses in Mid Wales.
5.3. Reducing emissions from buildings 194. Reducing CO2 emissions to help tackle climate change can also reduce NOx
emissions. More efficient use of, and lower demand for, energy means less need for combustion for power generation and a reduction in the associated NO2 emissions.
195. Improving and decarbonising our homes and businesses, and realising the associated air quality benefits, will require consideration of both energy efficiency measures and heating systems in properties, and we are committed to considering both together, from a consumer perspective. Further detailed information on measures can be found in Annex 2, Section 7.5
196. The roll-out of smart electricity and gas meters to all homes and small businesses by the end of 2020 is also expected to lead to improvements in air quality as a result of reductions in energy consumption by consumers.
197. The Welsh Government is currently consulting on a new Energy Efficiency Strategy for Wales that will include action for households, businesses and public sector.
5.4. Reducing emissions from other sources
5.4.1. Ports and shipping 198. Emissions from shipping contribute to background levels of NOx. Reduction in
pollutant emissions from ships is driven by international legislation, notably the International Convention for the Prevention of Pollution from Ships (MARPOL) as outlined in Annex 2.
199. A separate directive, and national planning policy requirements, address the connection of ships at ports to on shore electricity supply. This can help reduce emissions from ships during their stay at ports. We will continue to encourage ports and shipping companies to examine the opportunities available for on shore electricity connection, particularly in areas identified as having poor air quality.
34 http://gov.wales/topics/transport/planning-strategies/ntp/?lang=en).

41
5.4.2. Aviation 200. Many of the larger UK airports have strategies in place to reduce their emissions of
NOx, within the airport perimeter, such as: cleaner aircraft; cleaner airfield support vehicles; cleaner airfield operations such as reduced taxiing and the provision of fixed electrical ground power; and the use of auxiliary power units. A large proportion of the NOx close to airports will be road related and larger airports may have strategies to minimise the number of vehicle journeys to and from the airport. More detail on this is available in the relevant zone plan.
201. NOx emissions from aircraft engines are regulated over a simulated landing, taxi and take-off cycle. The most recent tightening of requirements took effect in 2012. However, at the moment innovation by the manufacturers is developing new improved products without the need for a further tighter standard. Lean burn technology has started to become reality for some engines with certificated emissions levels reduced by more than 50%. Cruise emissions are reduced even more and the technology will spread to most sizes and makes of engines over the next decade. The UK Government will continue to monitor the progress of the technology and when appropriate will ask the International Civil Aviation Organisation to consider further tightening those standards to ensure that the latest available technology is incorporated into new products.
202. Technology transition is relatively slow in the aviation sector; new types of aircraft are typically built for 30 years or more with upgrades. However as new aircraft enter service they displace less clean and less efficient ones so NOx emissions will continue to fall around airports.
203. Airports are permitted to impose an element of emission related charges at airports which sends a strong signal to operators to use their cleanest aircraft to serve those airports.
5.4.3. Rail 204. Whilst emissions from the rail sector are relatively low, the UK is committed to
reducing them even further. Electric trains are zero emission at point of use which makes them ideal for use in air quality problem areas such as city centres.
205. The Government has committed to a major rail electrification programme that will see a significant number of diesel trains progressively replaced with electric equivalents.
206. The UK Government’s investment in the Intercity Express programme will see the introduction of state-of-the-art electric and bi-mode trains. The bi-mode version will be able to draw electricity from overhead lines where it is available and switch to low emission diesel engine power where it is not. The new trains will come into service from 2017 on the Great Western Main Line and from 2018 on the East Coast Main Line.
207. Through the UK Government sponsored Future Railway programme, we are supporting a range of innovation projects to reduce rail’s carbon footprint that will also provide benefits for air quality. At the beginning of 2015 one of the projects – a battery powered train – was successfully demonstrated in passenger service. The
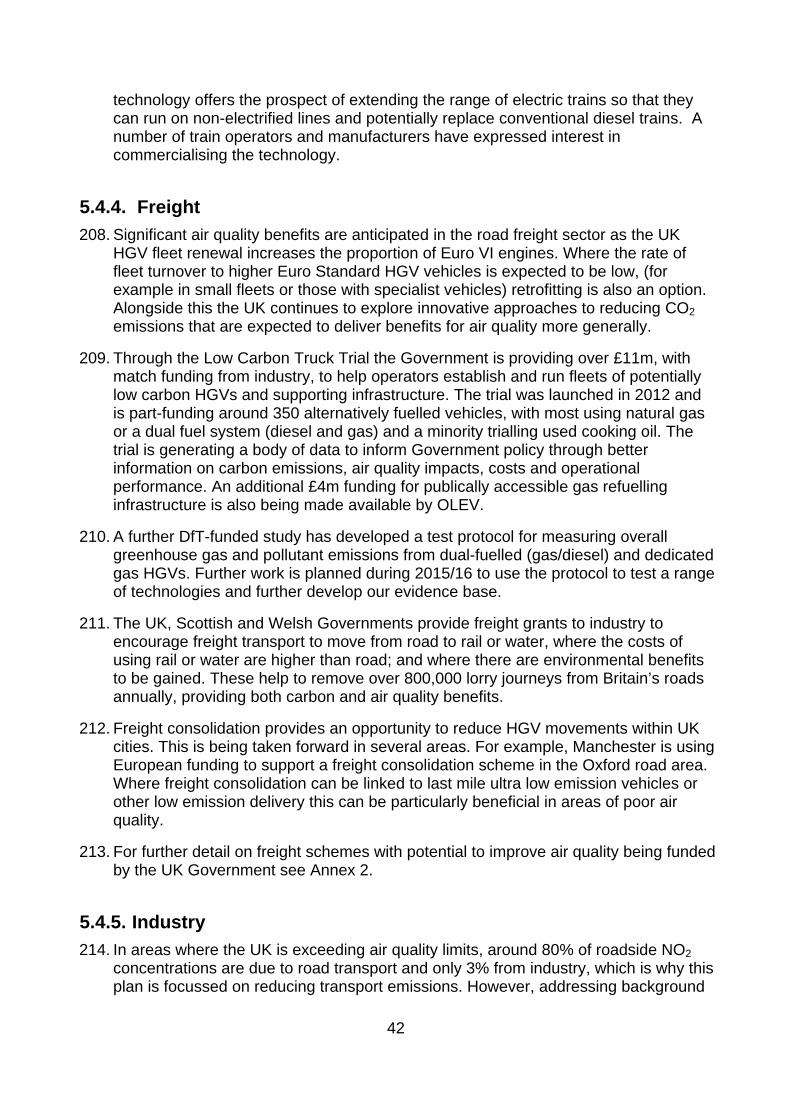
42
technology offers the prospect of extending the range of electric trains so that they can run on non-electrified lines and potentially replace conventional diesel trains. A number of train operators and manufacturers have expressed interest in commercialising the technology.
5.4.4. Freight 208. Significant air quality benefits are anticipated in the road freight sector as the UK
HGV fleet renewal increases the proportion of Euro VI engines. Where the rate of fleet turnover to higher Euro Standard HGV vehicles is expected to be low, (for example in small fleets or those with specialist vehicles) retrofitting is also an option. Alongside this the UK continues to explore innovative approaches to reducing CO2 emissions that are expected to deliver benefits for air quality more generally.
209. Through the Low Carbon Truck Trial the Government is providing over £11m, with match funding from industry, to help operators establish and run fleets of potentially low carbon HGVs and supporting infrastructure. The trial was launched in 2012 and is part-funding around 350 alternatively fuelled vehicles, with most using natural gas or a dual fuel system (diesel and gas) and a minority trialling used cooking oil. The trial is generating a body of data to inform Government policy through better information on carbon emissions, air quality impacts, costs and operational performance. An additional £4m funding for publically accessible gas refuelling infrastructure is also being made available by OLEV.
210. A further DfT-funded study has developed a test protocol for measuring overall greenhouse gas and pollutant emissions from dual-fuelled (gas/diesel) and dedicated gas HGVs. Further work is planned during 2015/16 to use the protocol to test a range of technologies and further develop our evidence base.
211. The UK, Scottish and Welsh Governments provide freight grants to industry to encourage freight transport to move from road to rail or water, where the costs of using rail or water are higher than road; and where there are environmental benefits to be gained. These help to remove over 800,000 lorry journeys from Britain’s roads annually, providing both carbon and air quality benefits.
212. Freight consolidation provides an opportunity to reduce HGV movements within UK cities. This is being taken forward in several areas. For example, Manchester is using European funding to support a freight consolidation scheme in the Oxford road area. Where freight consolidation can be linked to last mile ultra low emission vehicles or other low emission delivery this can be particularly beneficial in areas of poor air quality.
213. For further detail on freight schemes with potential to improve air quality being funded by the UK Government see Annex 2.
5.4.5. Industry 214. In areas where the UK is exceeding air quality limits, around 80% of roadside NO2
concentrations are due to road transport and only 3% from industry, which is why this plan is focussed on reducing transport emissions. However, addressing background

43
concentrations and therefore other pollution sources, for example emissions from industrial processes, will also contribute to delivering health and environmental benefits.
215. Significant strides have been made in reducing industrial emissions in the UK. There has been a continuous downward trend in emissions of NOx from industry, with a 61% fall since 1990, largely due to the regulatory frameworks put in place by Government and significant investment by industry in cleaner processes. Further details on current and future requirements for industrial plant are contained in Annex 2.
5.4.6. Non-Road Mobile Machinery 216. Engines in mobile equipment not directly related to the transportation of passengers
or goods, such as excavators, bulldozers and cranes used in construction, are covered by regulations for Non-Road Mobile Machinery (NRMM). Engines for sale must be approved to demonstrate compliance with pollutant emission standards, including NOx.
217. Increasingly stringent European emissions standards for new NRMM have been introduced in stages since 1997. Stage IV standards, which came into force in 2014, and reduced permitted NOx emissions by 80% or more over the previous standard. As a result NOx emissions have reduced by nearly 50% since 2002. However it is important to further reduce such emissions. We will be considering how we might enable this, particularly within the context of designing the Clean Air Zones. Annex 2 sets out how London have been developing solutions for NRMM as well as more detail on the latest and future changes to the emissions standards.
5.4.7. Emissions from other stationary sources 218. The Clean Air Act prohibits emissions of smoke within designated smoke control
areas unless using an exempted appliance or authorised fuel. European Ecodesign Regulations will also introduce efficiency and emission criteria for solid fuel boilers35
and solid fuel local space heaters. Further detail on these measures is in Annex 2.
219. The UK Government and Devolved Administrations are reviewing the Clean Air Act to ensure that it continues to be effective in tackling air quality challenges and in particular will take account of source control measures under the Ecodesign Regulations and the Medium Combustion Plant Directive.
5.4.8. Government sustainability 220. Programmes to improve energy efficiency and reduce carbon emissions in schools
are also delivering air quality benefits alongside other environment savings.
35 Ecodesign requirements for solid fuel boilers directive http://eur-lex.europa.eu/legal-content/EN/TXT/?qid=1437551981787&uri=OJ:JOL_2015_193_R_0005
44
221. Since 2013, nearly £32m has been invested by the Department for Education and the Education Funding Agency through Salix loans. This has enabled over 800 energy efficiency projects in 670 schools (totalling £63m and 283,000t CO2 expected financial and carbon savings over these projects lifetime), which will also help contribute to wider air quality benefits.
222. Wider approaches on sustainable development across Government also support our ambition to improve air quality. The National Health Service’s Sustainable, Resilient, Healthy People and Place Strategy sets out the ambitions of this sector to reduce emissions in line with the sector’s Carbon Reduction Strategy, based on the legal limits set by the Climate Change Act 2008. The strategy sets out an ambition for the NHS to reduce environmental impacts, including pollution by, for example, encouraging walking and cycling which have direct health benefits and reduce emissions.

45
6. Annex 1 6.1. Evaluation of progress towards meeting the
nitrogen dioxide limit values 6.1.1. Nature and assessment of pollution 223. Figure 4 shows that between 2000 and 2013 total UK emissions of NOx have
decreased by 43%. The relative proportion of non-transport sources increased slightly in 2013 (58%) when compared to 2000 (53%). The contribution of other emissions sources has remained broadly the same. While non-transport emissions are the biggest source of total emissions, and contribute to the regional background concentrations, the greatest source of ground level concentrations of NO2 in the areas where we are above the limit values is transport (see Section 2.1).
Figure 4: Annual UK emissions of NOx since 2000
224. Table 8 illustrates that, while the percentage and total km of UK modelled road length exceeding the annual mean limit value has declined in recent years, the number of zones in exceedance has remained fairly constant since 2001. This is in line with the situation described in Section 2.1 that the issue of transport emissions in urban areas remains a challenge. In contrast the UK is meeting the NO2 hourly mean limit value across the UK in all zones apart from Greater London.

46
Table 8: Trend data: number of zones and km of road exceeding limit values
YEAR 2001 2002 2003 2004 2005 2006 2007 2008 2009 2010 2011 2012 2013
Number of zones exceeding NO2 annual mean LV
38 36 42 39 38 39 41 40 40 40 40 38 38
Number of zones exceeding NO2 hourly mean LV 4 1 3 1 2 1 2 3 2 3 3 2 1
Km in exceedance of NO2
annual mean LV 5521 3346 7375 4902 5018 4720 4781 3594 3247 4192 2942 2721 2511
% of UK modelled road length exceeding LV 35% 21% 53% 35% 36% 34% 34% 26% 25% 32% 23% 21% 19%

47
225. Figure 5 shows ambient concentrations of NO2 (as measured by the AURN) have decreased since 1990. NO2 concentrations are shown for the following groups of sites36:
• all AURN urban background (non-traffic) sites;
• a sub-set of eight long-running urban background sites operating since 1993 or earlier to show changes over time unaffected by variations in monitoring sites;
• all traffic-related urban monitoring sites since 1997; and
• a sub-set of eight long-running traffic urban sites in operation since 1998 to show changes over time without any effects due to variations in monitoring sites.
Figure 5: Average annual mean NO2 concentrations: background urban and traffic urban AURN sites
0
10
20
30
40
50
60
70
80
1990 1991 1992 1993 1994 1995 1996 1997 1998 1999 2000 2001 2002 2003 2004 2005 2006 2007 2008 2009 2010 2011 2012 2013
Aver
age
annu
al m
ean
NO
2 co
ncen
trat
ion,
µgm
-3
Urban Traffic, 8 long-running sites
Urban Traffic, All Sites
Urban Background, 8 long-running sites
Urban Background, All Sites
226. This illustrates that the annual mean NO2 concentration averaged for:
• all urban background (non-traffic) sites in the AURN shows a steady decrease until around 2007 before levelling off slightly;
36 A full description of these sites is available in Air Pollution in the UK 2013 http://uk-air.defra.gov.uk/assets/documents/annualreport/air_pollution_uk_2013_issue_1.pdf
48
• the eight long-running urban background sites shows a general decrease until around 2002 and is subsequently stable until around 2011;
• the all urban traffic AURN sites is higher than the average for background sites, but shows a clear decrease over time, particularly since 2006;
• the eight long-running urban traffic sites shows no clear increase or decrease, and considerable year-on-year fluctuation. There is some indication of a year-on-year decrease from 2010 onwards.
6.2. General background information on the UK
6.2.1. Climatic data and topography 227. The United Kingdom has a temperate, maritime climate with typical annual average
wind speeds around five metres per second. The UK is well known for the variability of its weather - from day to day, season to season, year to year and place to place. Its position in the mid-latitude westerly wind belt on the edge of the Atlantic Ocean with its relatively warm waters, yet close to the continental influences of mainland Europe, plays a major role in this. The topography of much of the UK is relatively flat with the dispersion conditions in the majority of large urban areas not significantly influenced by large scale topography such as mountain valleys. Changes in topography and land use over relatively short distances, together with a long coastline and numerous islands, all add to the variety of weather.
228. Within the UK, England has mostly lowland terrain; the highest point is 978 metres above sea level. In Scotland, the main population centres are in the lowlands, which lie to the south and east and, in particular, the central belt between Glasgow and Edinburgh. The highest point is 1344 metres above sea level in the sparsely populated Highland region to the north and west of the country. Likewise in Wales, the main population centres including Cardiff and Swansea are in the south, away from the more mountainous regions of north and mid-Wales. The highest point is 1085 metres above sea level. Northern Ireland is best described as hilly, rather than mountainous. The highest point is 852 metres above sea level.
229. In general, places in the east and south of the UK tend to be drier, warmer, sunnier and less windy than those further west and north. Also, these favourable weather conditions usually occur more often in the spring and summer than in autumn and winter. But that is by no means the whole story, and climate descriptions illustrating the all-important regional and seasonal variations can be found on the Metrological Office website37.
37 http://www.metoffice.gov.uk/climate/uk/regional-climates

49
Map 1- UK Zones and Agglomerations for Ambient Air Quality Reporting

50
7. Annex 2 230. The UK is taking a range of action to reduce NO2 concentrations and emissions as
set out in this plan. This annex provides more background on some of the legislative, policy and funding approaches already in place.
7.1. Infrastructure and land use planning 231. New infrastructure and other developments need to be sensitively planned to ensure
they do not add to, or cause, significant additional air quality issues. Air quality should be considered early in any development so that mitigation measures can be developed where necessary. Air quality considerations are firmly embedded within national policy which includes strong protections to safeguard people from unacceptable risks from air pollution.
7.1.1. The National Planning Policy Framework (England) 232. The National Planning Policy Framework (2012)38 sets out national planning policies
and principles for England and how these are expected to be applied. It provides a Framework within which local people and their accountable councils produce their own distinctive local and neighbourhood plans which reflect the needs and priorities of their communities. The National Planning Policy Framework is clear that the planning system should contribute to and enhance the natural and local environment by preventing both new and existing development from contributing to or being put at unacceptable risk from, or being adversely affected by, unacceptable levels of air pollution. New development should be appropriate for its location, taking proper account of the effects of pollution on people’s health.
233. Local authority planning policies should sustain compliance with and contribute towards meeting EU limit values or national objectives for pollutants, which includes NO2, taking into account the presence of Air Quality Management Areas, and the cumulative impacts on air quality from individual sites in local areas. Planning decisions should also ensure that any new development in Air Quality Management Areas is consistent with the local air quality action plan.
234. The National Planning Policy Framework also includes policies on promoting sustainable transport and is clear that the transport system needs to be balanced in favour of sustainable transport modes. Plans should protect and exploit opportunities for the use of sustainable modes including, where practical, incorporating facilities for charging plug-in and other ultra low emission vehicles and give priority to pedestrian and cycle movements and have access to high quality public transport facilities. This is complemented by existing permitted development rights, introduced in 2011, which
38 http://planningguidance.planningportal.gov.uk/blog/policy/achieving-sustainable-development/delivering-sustainable-development/11-conserving-and-enhancing-the-natural-environment/

51
allow for the installation of electrical outlets for recharging electric vehicles in off-street car parks without the need for a planning application.
7.1.2. Planning practice guidance on air quality 235. To support the National Planning Policy Framework, Planning Practice Guidance39 on
air quality provides guiding principles on how planning decisions should take account of the impact of new development on air quality. We will update the guidance to include reference to this UK plan for NO2 and to reflect the introduction of Clean Air Zones.
7.1.3. Local authority plans 236. Local plans, prepared by local councils working with their local communities are very
important to delivering sustainable development. They inform individual decisions on the location of new development. In making decisions on planning applications local planning authorities take into account whether what is proposed is sustainable development, in line with the National Planning Policy Framework and supporting guidance and any local action to improve air quality and mitigation measures proposed as part of the development in question.
7.1.4. Nationally significant infrastructure 237. England and Wales have a bespoke planning system for major infrastructure projects
introduced through the 2008 Planning Act – the Nationally Significant Infrastructure Planning regime. In England the regime covers transport infrastructure, including the provision of road and rail infrastructure, which is also subject to strict consideration of air quality requirements.
238. The National Networks National Policy Statement (2014)40 sets out the need for, and policies to deliver, nationally significant road and rail infrastructure projects in England. It recognises that increases in emissions of pollutants during the construction or operation of projects can result in the worsening of local air quality in some cases. Accordingly decisions on projects are required to consider air quality impacts over wider areas which are likely to be affected, as well as areas in the near vicinity of a scheme.
239. The statement sets out how decisions on road and rail infrastructure must take account of relevant statutory air quality thresholds, including those for NO2. Where a road or rail project is likely to lead to a breach of the thresholds appropriate mitigation measures should be secured to ensure, so far as possible, they are not breached. It also sets out that consent should be refused where, after taking into account mitigation, the air quality impacts of a scheme will result in a currently compliant zone or agglomeration becoming non-compliant; or affect the ability of a non-compliant
39 http://planningguidance.planningportal.gov.uk/blog/guidance/air-quality/ 40 https://www.gov.uk/government/publications/national-policy-statement-for-national-networks

52
area to achieve compliance within the most recent timescales reported to the European Commission at the time of the decision.
7.1.5. Land use planning (Scotland) 240. Scotland’s Cleaner Air for Scotland strategy provides further information on land use
planning and the approach being taken to air quality in Scotland. In addition, a major review of the land use planning system is currently underway in Scotland.
7.1.6. Land use planning (Wales) 241. Planning Policy Wales41 sets out the land use planning policies of the Welsh
Government with regard to air quality. It states that both the effects of development on air quality and the effects which existing land uses may have on new development proposals should be considered both when preparing development plans and when determining planning applications. It emphasises that local development plans are important vehicles for the promotion of environmental protection, having a valuable role to play in avoiding or minimising the adverse effects of any environmental risks on present or future land use.
242. When preparing strategies for future growth and allocating land for particular uses, local planning authorities should consider the effects which proposed developments may have on air quality, as well as the effects that air quality in an area would have on the acceptable future use of land. In doing so, development plan strategies and policies should be compatible with strategies and policies contained in regional transport plans, road traffic reduction reports, and air quality management plans.
243. When determining planning applications, statutory air quality objectives, together with the results of air quality reviews and assessments and any air quality management plans or area action plans should be taken into account. Local planning authorities should work closely with pollution control authorities when considering applications.
7.2. Local action
7.2.1. Local greener transport initiatives 244. Through the Local Sustainable Transport Fund (LTSF) the UK Government invested
£600m between 2011 and 2015. Together with match funding from local authorities over £1bn of investment supported 96 projects across 77 local authorities to increase the use of, for example, buses, cycling and walking. An additional £64.5m for 2015-16 is supporting 44 local authorities. In the 2015 Spending Review the Government announced £580 million for a new ‘Access’ fund for sustainable travel, building on the legacy of the Local Sustainable Transport Fund and supporting growth in cycling and walking.
41 http://gov.wales/topics/planning/policy/ppw/?lang=en
53
245. The Government has supported local authorities and bus operators to purchase new low emission buses, to retrofit existing buses and to put in place supporting infrastructure, for example through:
• the Green Bus Fund which provided £89m over 2009-2013 and helped put over 1,200 cleaner buses on the road;
• the Clean Bus Technology Fund which has supported the upgrade of older buses with £7.3m for local authorities outside London in 2013;
• a further £7m being provided under the Clean Bus Technology Fund in 2015 focusing on bus retrofitting; and
• a new Low Emission Bus Scheme, for England and Wales, providing £30m for bus operators and local authorities to bid for in 2015 for low emission buses and/or supporting infrastructure.
246. The Government has also supported innovative upgrading of other vehicle types through the £8m Clean Vehicle Technology Fund. In 2014 grants of up to £500,000 were awarded to enable the upgrading of vehicles with technology to reduce emissions in areas of poor air quality. Twenty three local authorities have been awarded grants for cutting-edge, pollution reducing technologies which are now being fitted to over 1,200 vehicles.
247. In Wales, the Sustainable Travel Centres Initiative was completed in 2012/13, supported by over £40 million investment from the Welsh Government. This supported and promoted a range of active travel and integrated transport infrastructure improvements, including better integration at transport interchanges, between bus services and railway stations - for example linking access to park-and-ride and park-and-share facilities, and cycling routes.
7.2.2. Cycling and Walking
248. As noted in Section 3.8.3, the forthcoming Cycling and Walking Investment Strategy for England (CWIS) will set out objectives and the financial resources to be made available to meet these objectives. The CWIS will build on a range of investment already put in place. Between 2011 and 2015 £374m was invested by the UK Government in cycling. Between 2015 and 2021 Government will invest at least £300m. Investment to date includes:
• through the Local Sustainable Transport Fund where 95 of the 96 projects funded between 2011 and 2015 contained an element of cycling or walking. For 2015/16, all projects will seek to improve cycling and walking levels;
• the Government’s Cycle City Ambition programme which seeks to grow the numbers of cyclists in eight English cities (Birmingham, Bristol, Cambridge, Leeds, Manchester, Newcastle, Norwich and Oxford). The first phase of this programme was awarded £77m and is due to be completed in full by March 2016. The second phase has been awarded £114m and will run from 2015 through to 2017-2018;

54
• £17m invested in cycling in national parks during 2013 and 2015;
• £12m a year invested in Bikeability, a scheme to provide children and teenagers with the skills and confidence to cycle;
• £35m invested in improving cyclist safety at junctions in England, including £15m going to Transport for London to improve cycle safety in the capital, between 2011 and 2015;
• £30m invested in improving cycle-rail links, between 2013 and 2015, and £15m will be invested in 2015/16 to improve cycle facilities at railway stations;
• the Department of Health’s Walking Cities programme which provided five English cities (Cambridge, Manchester, Birmingham, Leeds/Bradford and Norwich) with £1.2m between 2013 and 2015 to increase walking through, for instance, health walks, community street audits and walking challenges; and
• £100m of funding to 2021 through the Road Investment Strategy has also been provided to Highways England to improve the conditions for cyclists and walkers alongside and crossing the Strategic Road Network.
249. In Wales, the Welsh Government is implementing the Active Travel (Wales) Act 2013, requiring local authorities to continuously improve facilities and routes for pedestrians and cyclists and to prepare maps identifying current and potential future routes for their use. The Act also requires new road schemes (including road improvement schemes) to consider the needs of pedestrians and cyclists at design stage.
250. The Welsh Government is promoting the implementation of the Active Travel (Wales) Act through supporting Local Transport Plans by local authorities in Wales which include walking, cycling, public transport and highways schemes. Applications to deliver schemes are assessed and supported by Welsh Government through its local transport fund, which makes £15 million available a year.
7.3. Ports and shipping
7.3.1. Ports 251. Connecting ships and other vessels to on shore electricity supply at ports and
marinas can help reductions in pollutant emissions through alleviating the need for on board energy generation. Under EU Directive 2014/94/EU on the deployment of alternative fuels infrastructure, Member States must assess the need for shore-side electricity supply for inland waterway vessels and seagoing ships in their national policy frameworks. The Directive recognises that installation must be subject to demand and that the costs of implementation should not be disproportionate to the benefits, including environmental benefits.
252. The Government has already encouraged ports to design new developments so that the necessary equipment could be installed without undue cost and disruption,

55
should it be decided in future to install shore-side electricity. For port development, especially for nationally significant infrastructure projects as defined in the Planning Act 2008, the National Policy Statement for Ports provides that proposed developments should at least make reasonable advance provision for shore-side supply or explain why this would not be economically and environmentally worthwhile.
253. There are opportunities for existing development to explore the opportunities for shore-side electricity supply connections and further reduce emissions at port side. A new technical standard for on shore electricity supply connections has been agreed42. This should provide confidence for those investing in these facilities that there is a common standard across the industry. We will continue to encourage Ports and shipping companies to examine the opportunities available, particularly in areas identified as having poor air quality.
7.3.2. Shipping 254. Reduction in pollutant emissions from ships is driven by international legislation,
notably the International Convention for the Prevention of Pollution from Ships (MARPOL). This regulates pollution from ships and the overwhelming majority of States, including the UK, are Parties.
255. MARPOL’s Annex VI contains provisions which regulate emissions of NOx from ships. It sets out a staged progression of more stringent limits for sulphur oxides and NOx both inside and outside waters designated by the International Maritime Organisation (IMO) as an Emission Control Area (ECA).
256. The control requirements for NOx apply to certain installed marine diesel engines over 130 kilowatt irrespective of the ship tonnage with limit values for grams of NOx per kilowatt hour. There are three different ‘Tiers’ of control which apply based on the ship construction date. The most stringent, Tier III, is applicable in designated NOx ECA’s43 to marine diesel engines installed on ships constructed on or after 1 January 2016 when operating in the ECA.
257. States which propose further, new NOx ECAs have the flexibility to apply the NOx Tier III emission standard to ships constructed on or after the date of circulation of their proposal to the IMO for the adoption of the ECA. The UK Government supports the IMO’s three-tier regime and intends to implement these international provisions for regulating NOx emissions from shipping through amendments to the UK’s Merchant Shipping legislation.
258. The UK Government is supportive of the case for a NOx ECA in the North Sea in conjunction with other North Sea States and has engaged with stakeholders on the issue. The matter is currently subject to detailed discussions amongst North Sea States.
42 ISO/IEC/IEEE 80005-1:2012 43 There are currently two – the North American and the US Caribbean Sea ECAs

56
7.4. Freight 259. In addition to the schemes set out in Section 5.4.4, Government is providing funding
for other trials that may have air quality benefits.
260. A 10 year trial of longer semi-trailers (LSTs) was launched in January 2012 by the Department for Transport. This trial is ascertaining the environmental and economic benefits of two length variants of LST – one at 14.6m and the other at 15.65m. Both have a maximum permitted weight of 44 tonnes, as with the current largest standard sized lorries on UK roads. Some 3000 tonnes of CO2 emissions are expected to be saved over the course of the trial from fewer lorries being needed to transport the same volume of goods. The latest annual report of the trial, published in July 2015, provides encouraging findings. The total estimated savings from using LSTs in the trial to the end of 2014 is 4.2 to 5.2 million vehicle kilometres.
261. This suggests a beneficial outcome in terms of reduced emissions of CO2 and air quality pollutants which, while not quantified in this report, is planned to be evaluated at the later stages of the trial.
262. Alongside these trials, we also continue to ensure the regulatory framework supports the adoption of new technologies. The amending Directive to 96/53/EC, which sets out the maximum permitted weights and dimensions of certain road vehicles circulating within the EU was published in May 2015. The provisions of the new Directive include up to one tonne extra in weight for vehicles with alternative fuel powertrains, where these are heavier than conventional fuel systems. These include powertrains on vehicles with electric/hybrid and gas technologies.
263. Given that the Directive sets maximum authorised weights in relation to international journeys only, the Government also wishes to extend this benefit to purely national journeys within the UK and plans to consult as such in early 2016. While there is no guarantee that this extra weight provision would be taken up by a significant number of operators and it is therefore difficult to quantify what this might mean in terms of improved air quality, it provides an opportunity for improvement.
7.4.1. Accreditation schemes 264. Work on accreditation schemes for retrofitted vehicles and alternatively fuelled
vehicles is already underway. OLEV has match-funded industry contributions to develop an accreditation scheme for low carbon HGV technologies. The scheme aims to independently validate the fuel consumption savings offered by low carbon retrofit devices under a range of operating conditions and provide reassurance to commercial operators that they will see a return on their investment in the technology. It can also be used to measure NOx emissions. The scheme is expected to launch in 2016.
265. An accreditation scheme has also been developed for OLEV’s Low Emission Bus Scheme (LEBS). Under LEBS, bus operators and local authorities can bid for Government funding towards the costs of buying low emission vehicles. New buses have to undergo a series of tests in order to demonstrate that they are low emission vehicles, before they can be certified and qualify for grant funding under LEBS.

57
266. Building on these two schemes the Department for Transport has commissioned the Low Carbon Vehicle Partnership to develop a new Clean Vehicle Retrofit Accreditation Scheme. This will ensure that there is a robust system in place providing independent evidence that any future vehicle retrofit technology schemes will deliver significant NOx emission reductions and air quality benefits. The Accreditation Scheme will cover a wide range of vehicles - buses, taxis, coaches, trucks, mini buses and vans, and will facilitate the development of an approved list of suppliers and technologies. The expectation is that the Scheme will be in place by early summer 2016.
7.5. Reducing emissions from buildings 267. Over the last decade, the UK has introduced a range of energy efficiency measures
for homes and buildings. These measures have included: progressive strengthening of the energy efficiency standards in national building regulations for new buildings and when boilers and windows are replaced in existing properties; domestic boiler scrappage schemes44; the Warm Front scheme45 and more recently the Energy Company Obligation.
268. We have already made good progress by improving energy efficiency across the country with 3.8 million lofts and 2 million cavity walls insulated between April 2010 and June 2015 and around 1.5 million energy efficiency measures installed in 1.2 million properties through the Energy Company Obligation, Cashback, Green Deal Plans and the Green Deal Home Improvement Fund between January 2013 and April 2015. Our focus now is on developing a coherent and cost effective framework for home energy efficiency.
269. The Renewable Heat Incentive (RHI)46 is the world’s first long-term financial support programme for renewable heat. The RHI pays participants of the scheme that generate and use renewable energy to heat their buildings. From October 2012, incentivisation of renewable heat has been accompanied by NOX and PM10 emission limits for biomass-burning appliances below 20MW thermal capacity. Applicants on or after the 24 September 2013, will need to have emissions levels no higher than 30 grams per gigajoule (g/GJ) net heat input for PM10 and 150g/GJ for NOx47. From 5 October 2015, requirements for sustainable biomass in the RHI scheme were introduced which included a minimum 60% greenhouse gas emission saving48. The RHI has a budget agreed to 2015/16.
44 http://www.energysavingtrust.org.uk/Home-improvements-and-products/Heating-and-hot-water/Boiler-Scrappage-Scheme 45 http://www.direct.gov.uk/en/Environmentandgreenerliving/Energyandwatersaving/Energygrants/DG_10018661 46http://webarchive.nationalarchives.gov.uk/20121217150421/http://decc.gov.uk/en/content/cms/meeting_energy/renewable_ener/incentive/incentive.aspx 47https://www.gov.uk/government/uploads/system/uploads/attachment_data/file/128679/Gov_response_to_non_domestic_July_2012_consultation_-_26_02_2013.pdf 48 https://www.gov.uk/government/uploads/system/uploads/attachment_data/file/403106/Non-domestic_RHI_-_Biomass_and_Biomethane_Sustainability_Feb15_Final.pdf

58
7.6. Industry 270. Significant strides have been made in reducing industrial emissions in the UK. There
has been a continuous downward trend since the 1990s in emissions of NOx from industry, with a 61% fall since 1990. This is largely due to the regulatory frameworks put in place by Government, and significant investment by industry in cleaner processes. The UK is continuing to implement and enforce regulatory controls over industrial processes in the UK to ensure that their contribution to emissions continues to decline in a sustainable and cost-beneficial manner without imposing an unreasonable burden on industry.
7.6.1. Industrial emissions directive 271. Around 4000 industrial sites in the UK are subject to the requirements of the
Industrial Emissions Directive (IED). The IED aims to minimise pollution from industrial activities and continues the work of the seven previous European Commission Directives covering industrial emissions, including the Large Combustion Plants Directive and Integrated Pollution Prevention and Control Directive.
272. The IED covers many industrial sectors, including power stations, certain food and farming industries and speciality organic chemicals manufacture. Industrial installations covered are required to comply with stringent standards, limits on emissions and standards on, waste minimisation and energy efficiency commonly referred to as best available techniques. All installations need an environmental permit from the regulator49 in order to operate. This permit sets out various requirements including emission limits and monitoring arrangements. Monitoring must meet the quality requirements set by the regulator. If an installation does not comply with the conditions of their permit, the regulator will take enforcement action.
273. The best available techniques are reviewed regularly and agreed at EU-level. This ensures that there is continued improvement in the environmental performance of UK industries and a level playing field across the EU. The implementation of the IED will ensure that emissions from industrial sources continue to decrease.
7.6.2. The Medium Combustion Plant Directive 274. The Medium Combustion Plant Directive (MCPD) will introduce a system of
registration / permitting, regular monitoring and emission limit values (ELVs) for plants of 1-50MW. These plants are typically found on a range of industrial sites and also provide heat and emergency power to large buildings such as hospitals and universities. There are over 10,000 such plants in the UK, 90% of which are within the 1-5 MW range and currently unregulated.
49 The Environment Agency in England; Natural Resources Wales in Wales; Scottish Environment Protection Agency in Scotland; The Industrial Pollution and Radiochemical Inspectorate of the Northern Ireland Environment Agency (NIEA) in Northern Ireland

59
275. The MCPD package will improve air quality by reducing emissions of NOx as well as other pollutants. It will also help to deliver compliance with revised National Emission Ceilings. The Directive will come into force on 20 December 2015 and must be transposed into UK law within two years. New plant will be required to meet the ELVs with effect from 12 months after the transposition deadline. For existing plant ELVs will apply in 2025 (for those greater than 5MW) and 2030 (for those 5MW and below).
7.6.3. Smaller installations 276. Smaller installations in England, Northern Ireland and Wales are regulated by local
authorities, and in Scotland by SEPA, to monitor and control any pollution to air they may cause. There are about 18,000 industrial plant regulated by local authorities in England. This includes a wide range of businesses from dry cleaners to petrol stations. Businesses which operate these premises must have a permit which must include conditions to ensure the best available technique is used to minimise emissions.
7.7. Emissions from other stationary sources
7.7.1. The Clean Air Act 277. The Clean Air Act (1993) enables local authorities to designate Smoke Control
Areas50. The Act prohibits emissions of smoke within these Smoke Control Areas unless using an exempted appliance or authorised fuel.
278. These appliances and fuels have passed emissions tests which confirm they are capable of burning solid fuel (including wood) in a way that produces none or very little smoke – and so are permitted for use in Smoke Control Areas. Non-domestic furnaces (e.g. boilers) must be notified to the local authority and under certain circumstances51 their chimney height must be approved by the local authority before operation. Breaches of the Clean Air Act (1993) can result in fines being levied by the regulatory authority.
279. The UK Government and Devolved Administrations are reviewing the Clean Air Act to ensure that it continues to be effective in tackling air quality challenges and in particular will take account of source control measures under the Ecodesign Regulations and the Medium Combustion Plant Directive. In England Ministers have also consolidated a number of regulations under the Act to streamline the regulatory burdens placed on businesses and local authorities.
50 www.gov.uk/smoke-control-area-rules 51 If burning either pulverised fuel, or any other solid matter at a rate of 45.4kg or more an hour, or any liquid or gaseous matter at a rate of 366.4 kilowatts or more

60
7.7.2. Ecodesign - solid fuel boilers and local space heaters 280. European Ecodesign Regulations will introduce efficiency and emission criteria for
solid fuel boilers52 and solid fuel local space heaters53 (e.g. domestic wood burning stoves) with effect from 2020 and 2022 respectively. They will set emission criteria for a number of pollutants, including NOx. They should contribute to the further reduction of NOx emissions by ensuring new products across the UK conform to emission limits, and will apply not just in Smoke Control Areas. Review clauses will ensure that consideration is given two years after coming into force of whether stricter emission limits may be possible. The UK will take a view on stricter emissions limits at that time.
281. The Stove Industry Alliance is developing an industry led voluntary scheme that would see its members committing to producing only Ecodesign compliant wood burning stoves by 2020 (two years ahead of it coming into force). For those products that are already Ecodesign compliant, as demonstrated by independently verified testing, it is developing a scheme to enable manufacturers to promote the benefits of these cleaner stoves. It is hoped that such a scheme will increase consumer awareness of the benefits of choosing more efficient solid fuel stoves and drive further improvements from manufacturers in reducing emission levels from their products.
7.8. Non-Road Mobile Machinery 282. Following the introduction of the Stage IV standards for Non-Road Mobile Machinery
(NRMM) the UK has been working with the European Commission on proposals which will further cut emissions of major air pollutants and improve the legal framework. This revision includes extending the scope to cover all sizes of petrol and diesel engines. The new EU regulations are expected to come into force in January 2017, with new emissions standards being mandatory for engines being sold, for the first tranche of engine categories, from January 2019.
283. The UK will continue to support and press for revised regulations to be in place to this timetable to ensure NRMM equipment conforms to up-to-date and tighter emission standards. The revised standards are estimated to lead to approximately a 12% reduction in NOx (and 50% of PM) produced by this sector in the UK from when the regulation is expected to come into effect in 2019.
284. NRMM emissions make a significant contribution to the NO2 levels in London. The Greater London Authority has estimated that about 12% of NOx emissions in London are from NRMM on construction sites. Consequently, the Greater London Authority has introduced new requirements for NRMM being used on construction sites from 1 September 2015. At national level around 10% of NOx and about 7% of particulate matter emissions are from NRMM and Government will consider whether such machinery can be included within the design of Clean Air Zones.
52 Ecodesign requirements for solid fuel boilers directive 53 Ecodesign requirements for solid fuel local space heaters directive

61
8. Annex 3 Map 2: Air quality plan projected annual mean roadside NO2 concentration 2020 (µg/m3)

62
Map 3: Air quality plan projected annual mean roadside NO2 concentration 2025 (µg/m3)

63
9. Glossary AQMA air quality management area AURN Automatic Urban and Rural Network CO2 carbon dioxide COMEAP Committee on the Medical Effects of Air Pollutants COPERT Computer programme to calculate emissions from road transport CNG compressed natural gas CWIS Cycling and Walking Investment Strategy for England DAQI Daily Air Quality Index Defra Department for Environment, Food and Rural Affairs DfT Department for Transport DVLA Driver and Vehicle Licensing Agency ECA Emission Control Area ELVs emission limits values EU European Union GBS Government Buying Standards GJ gigajoule GLA Greater London Authority HGVa heavy goods vehicles - articulated HGVr heavy goods vehicles - rigid HGVs heavy goods vehicles IED Industrial Emissions Directive IMO International Maritime Organisation LAQM Local Air Quality Management LEBS Low Emission Bus Scheme LEZ low emission zone LGVs light goods vehicles LNG liquefied natural gas LPG liquefied petroleum gas LSTs longer semi-trailers LTSF Local Sustainable Transport Fund LV limit value MARPOL International Convention for the Prevention of Pollution from Ships MCPD Medium Combustion Plant Directive MW megawatts NMF National Modelling Framework NLEF National Low Emission Framework NGOs Non-Governmental Organisations NO nitric oxide NO2 nitrogen dioxide NOx nitrogen oxides NRMM Non-Road Mobile Machinery OLEV Office for Low Emission Vehicles PCM Pollution Climate Mapping PHV private hire vehicles PHOF Public Health Outcomes Framework PHE Public Health England

64
PM particulate matter PM2.5 particulate matter – particles with a diameter less than 2.5µm PM10 particulate matter – particles with a diameter less than 10µm R&D research and development RDE real driving emissions RHI Renewable Heat Incentive RIS Road Investment Strategy SO2 sulphur dioxide ULEVs ultra low emission vehicles ULEZ Ultra Low Emission Zone VCA Vehicle Certification Agency VOCs volatile organic compounds