
Improving Agricultural Runoff Management for Irrigated Lands in California A. Ristow, S. Prentice,...
39
Improving Agricultural Runoff Management for Irrigated Lands in California A. Ristow, S. Prentice, W. Wallender, W. Horwath Department of Land, Air, and Water Resources University of California, Davis, California
-
Upload
liliana-mclaughlin -
Category
Documents
-
view
217 -
download
0
Transcript of Improving Agricultural Runoff Management for Irrigated Lands in California A. Ristow, S. Prentice,...

Improving Agricultural Runoff Management for Irrigated Lands in
California
A. Ristow, S. Prentice, W. Wallender, W. Horwath
Department of Land, Air, and Water Resources University of California, Davis, California

Outline
Introduction SAFS Project Initial Runoff Research Current Water Quality
Research Results Recommendations

Introduction
Delta water resources are being stressed by population growth, climate, and competing land uses
Focus of Clean Water Act (1973) is shifting Loss of agricultural discharge waiver
pressuring growers (2003)
POINT SOURCE POLLUTION CONTROLS 19731973
TMDL MONITORING
20032003
Introduction
Farm-based conservation practices presently exist for reducing soil losses and runoff potential…
Winter Legume Cover Cropping (WLCC)
Reduced Tillage (RT) Systems
Sediment Traps
Introduction
…However, potential benefits and disadvantages for California’s unique agro-ecosystems are not well understood
Changes in water balance and management
Timing of Field Operations
Cost / Benefit analyses of WLCC and RT systems
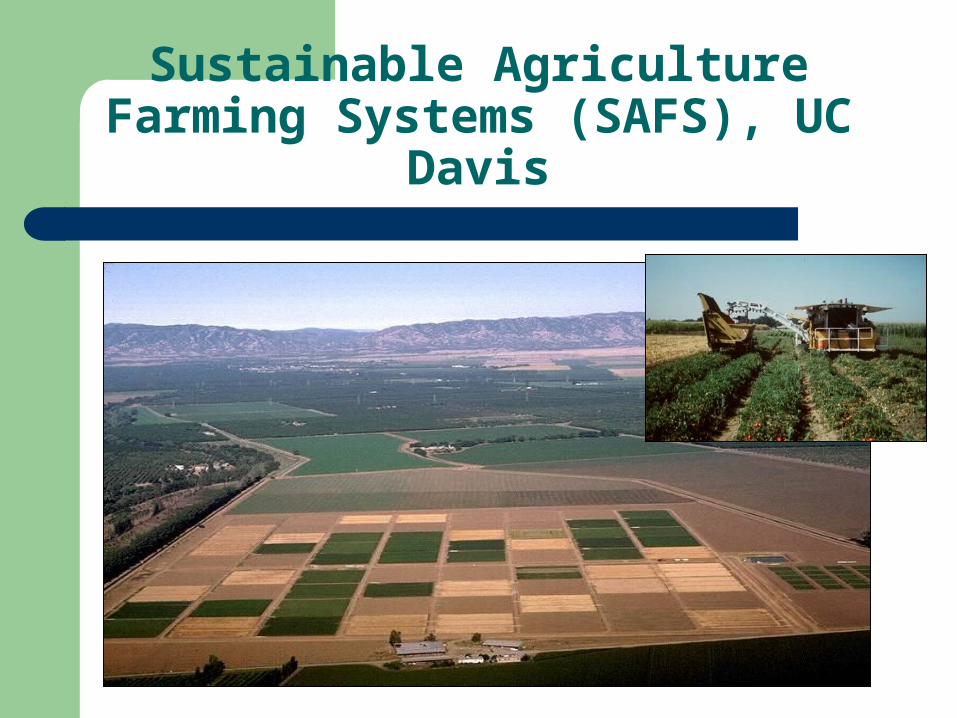
Sustainable Agriculture Farming Systems (SAFS), UC Davis
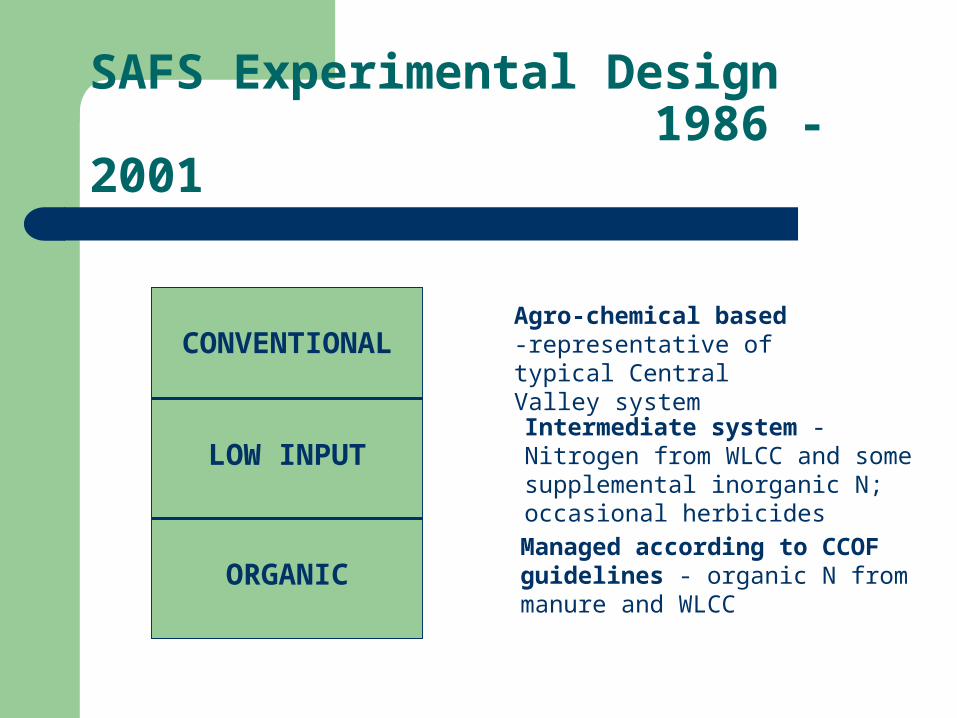
SAFS Experimental Design 1986 - 2001
Agro-chemical based -representative of typical Central Valley system
CONVENTIONAL
LOW INPUT
ORGANICManaged according to CCOF guidelines - organic N from manure and WLCC
Intermediate system - Nitrogen from WLCC and some supplemental inorganic N; occasional herbicides

• Four year, three crop rotation
• Side-by-Side research plots
• Adaptive Management
• Collaborative research
SAFS Experimental Design 1986 - 2001

Runoff Infiltration and Soil Water Storage Using WLCC (1998-2000)
Determine a field’s ability to conserve water for subsequent crops
Evaluate the effects of soil physical conditions on the water balance
Rainfall, runoff, and soil water content data collected on Fallow and WLCC treatments
Objectives

Winter Runoff SAFS Research Plots
WLCC
Fallow

0
20
40
60
80
100 1
-17
1-1
8
1-2
4
1-2
4
1-2
5
1-2
5
1-3
1
2-4
2-5
2-1
0
2-1
1
2-1
2
2-1
3
2-1
3
2-1
4
2-1
6
2-2
6
3-6
3-9
Pe
rce
nt
of
Ra
infa
ll (%
)
0
10
20
30
40
50
60
Pre
cip
ita
tio
n (
mm
)
CONVENTIONAL
LOW INPUT
ORGANIC
Precipitation
SAFS-Runoff as Percentage of Rainfall 1999-2000

1998 – 2000 Runoff Research Summary
Net runoff from CONV (winter fallow) test areas was consistently higher than WLCC and ORG
Soil moisture content was significantly higher in the WLCC system
WLCC can improve soil water storage for subsequent crops if it is destroyed before additional soil water is lost as evapotransporation

SAFS Experimental Design 2002 - Present
CONVENTIONAL
LOW INPUT
ORGANIC
Initial SAFS study led to expansion of parameters in 2002 and relocation to dedicated sustainable agriculture research facilities

SAFS Experimental Design 2002 - Present
CONVENTIONAL
LOW INPUT
ORGANIC
STANDARD TILLAGE
REDUCED TILLAGE
STANDARD TILLAGE
REDUCED TILLAGE
STANDARD TILLAGE
REDUCED TILLAGE

2003 – 2006 SAFSWater Quality Research
– Examine runoff quality and quantity – Tillage system comparisons– Use of grower-collaborator fields– Determine relationships between
cropping systems and TMDL discharge potential
2003 – 2006 SAFS Research
Quantify runoff from systems employing WLCC, RT, and sediment traps
Quantify nutrient, pesticide, and sediment concentrations of runoff from each system
Identify factors influencing runoff quality and soil water relations in the systems under study
Objectives

SAFS Controlled Research Plots - Winter 2003-2004
Runoff channeled through trapezoidal flume draining into a ditch at the end of plot
Portable sampler and data-logger collect data on runoff quantity
Water samples taken automatically at regular intervals during storm

Challenges To Monitoring
•Data collection was limited by several complexities during the first storm season
•Sampler was not designed for this scale of operation
•Small plot size and flat runoff surface produced negligible discharge from all research plots
•The natural variation associated with agro-ecosystems is an important factor to consider when monitoring for water quality

Rainfall Simulation
Attempts To Overcome Challenges
• Installed stilling well to overcome “noise” in data readings
• Rainfall simulation exercise to determine minimum rainfall needed to generate runoff
Installation of Stilling Well
Grower-Collaborator Fields Winter 2003 – 2004
•Negligible data from SAFS research plot for 2003-2004
•However, 2003–2004 data collection from grower fields was effective
•Growers were added for 2004 – 2005 season
•Additional growers will provide information on RT systems for 2004 - 2005
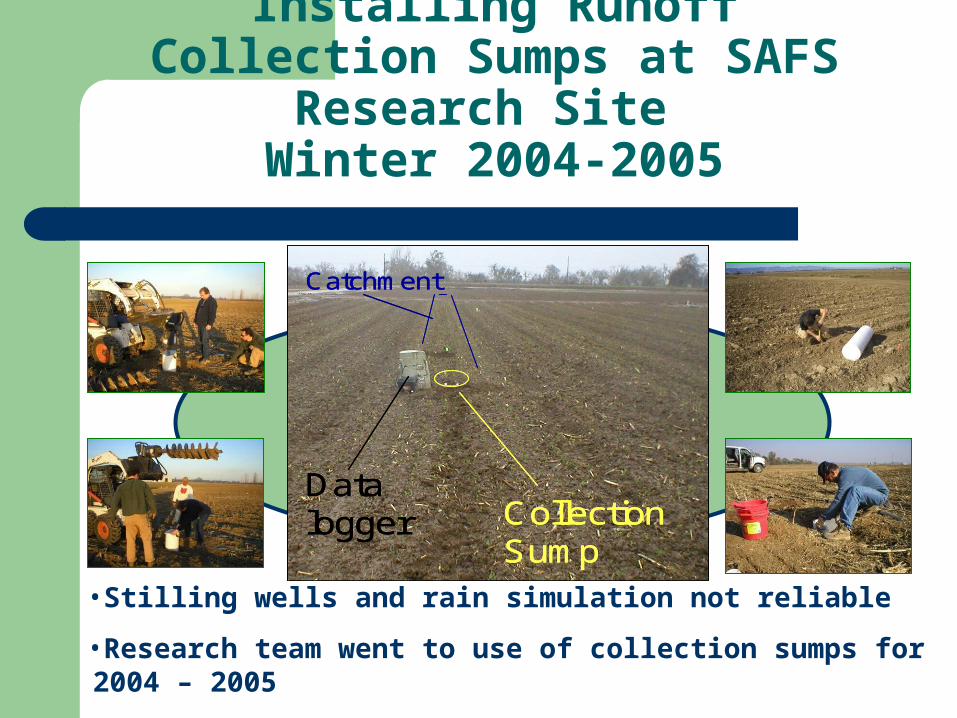
Installing Runoff Collection Sumps at SAFS Research Site
Winter 2004-2005
Collection Sump
Data logger
Catchment
Collection Sump
Data logger
Catchment
Collection Sump
Data logger
Catchment
•Stilling wells and rain simulation not reliable
•Research team went to use of collection sumps for 2004 – 2005
−This change has provided useful data (Analysis pending)
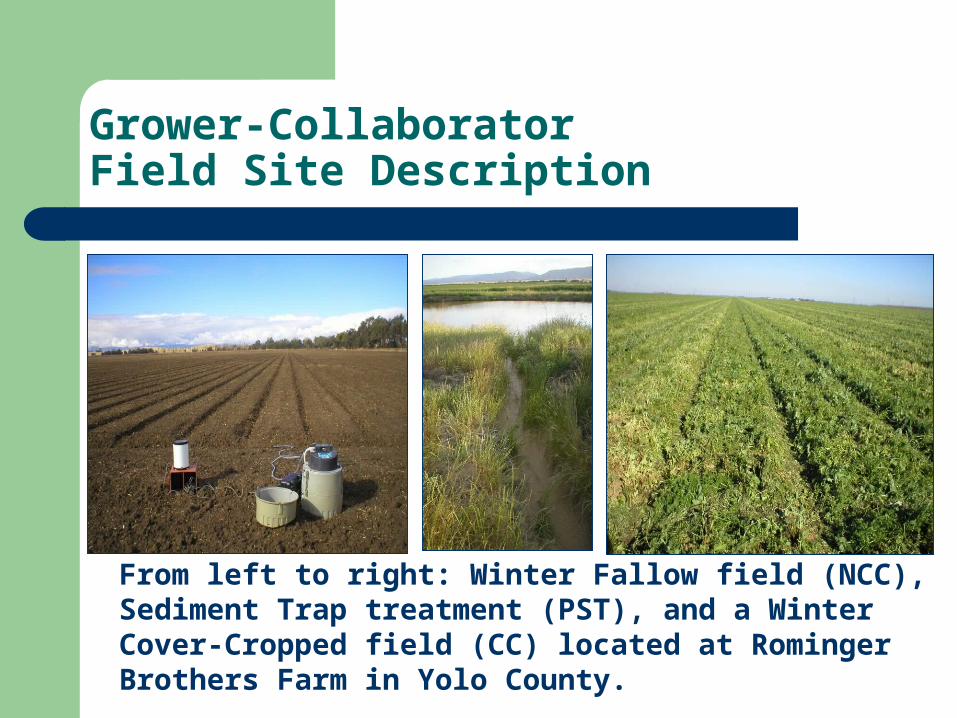
Grower-CollaboratorField Site Description
From left to right: Winter Fallow field (NCC), Sediment Trap treatment (PST), and a Winter Cover-Cropped field (CC) located at Rominger Brothers Farm in Yolo County.
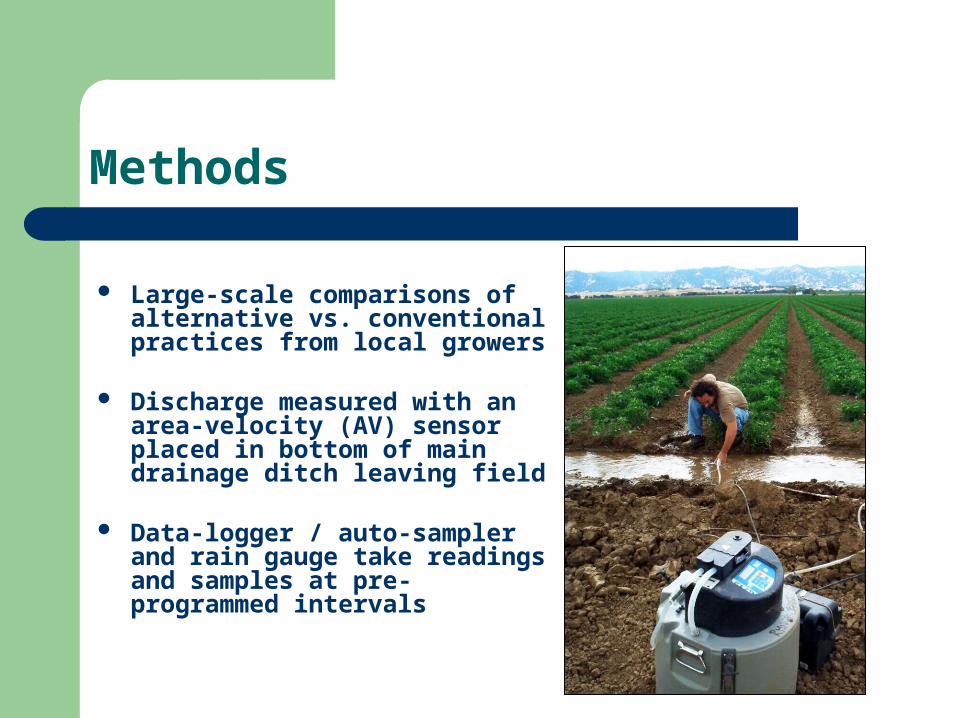
Methods
Large-scale comparisons of alternative vs. conventional practices from local growers
Discharge measured with an area-velocity (AV) sensor placed in bottom of main drainage ditch leaving field
Data-logger / auto-sampler and rain gauge take readings and samples at pre-programmed intervals

Methods continued
Discharge is measured and sampled at regular intervals during all runoff events…
…then collected and transported to UCD for water quality analyses:
– Sediment– Nitrate (NO3
-), Ammonium (NH4
+), Phosphate (PO4-)
– Dissolved Organic Nitrogen, Phosphorus, and Carbon (DON, DOP, DOC)
– Pesticides

Winter 2003 – 2004
Summer 2004
Results From Grower Fields

Discharge Hydrograph Comparing Non-CC and CC
FieldsEarly Storm Season
(December 29th, 2003)Late Storm Season
(February 25th, 2004)
0.00
0.01
0.02
0.03
0.04
012345
3AM25 Wed Feb 2004
6AM 9AM 12PM 3PM 6PM 9PM 26 Thu 3AM 6AM 9AM 12PM 3PM
25-26 February 2004
m3smm
2/25/2004 2:00:00 AM - 2/26/2004 4:00:00 PM
Cover Cropped (133.723 m3) Non Cover Cropped (912.445 m3) Precip (52.7 mm)
0.00
0.01
0.02
0.03
0.04
012345
6AM29 Mon Dec 2003
9AM 12PM 3PM 6PM
29 December 2003
m3smm
12/29/2003 3:00:00 AM - 12/29/2003 9:00:00 PM
Cover Cropped (58.015 m3) Non Cover Cropped (246.951 m3) Precip (49.7 mm)Precip.
NCCCC
mm3 / s
mm
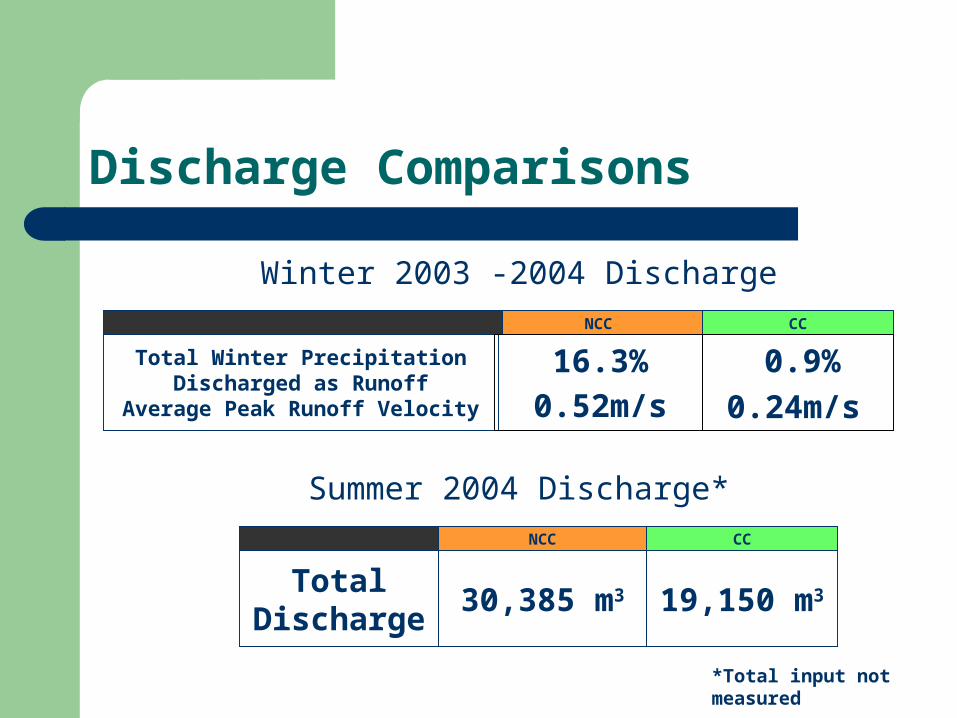
Discharge Comparisons
Winter 2003 -2004 Discharge
16.3%0.52m/s
0.9%Total Winter Precipitation Discharged as Runoff
Average Peak Runoff Velocity
NCC CC
0.24m/s
Summer 2004 Discharge*NCC CC
Total Discharge
30,385 m3 19,150 m3
*Total input not measured
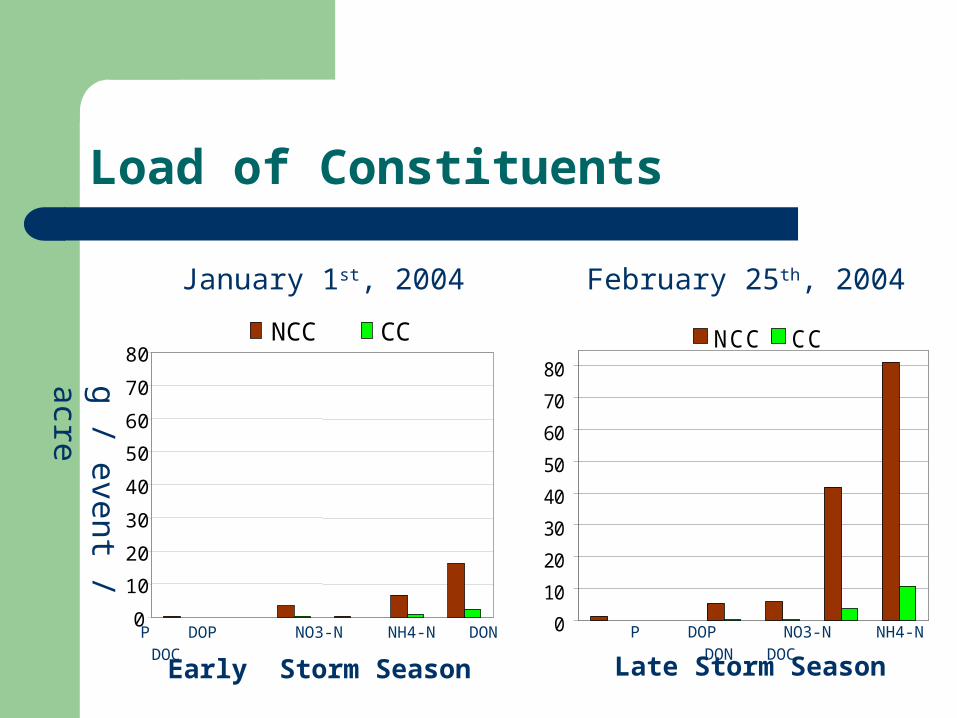
Load of Constituents
P DOP NO3-N NH4-N DON DOC
January 1st, 2004 February 25th, 2004
g / event / acre
0
10
20
30
40
50
60
70
80NCC CC
0
10
20
30
40
50
60
70
80
NCC CC
P DOP NO3-N NH4-N DON DOC
Early Storm Season Late Storm Season

Sediment Load
0
50
100
150
NCC CC
0
50
100
150
NCC CC
Kg
/ ev
ent
/ ac
re
TSS
January 1st, 2004 February 25th, 2004
Early Storm Season Late Storm Season
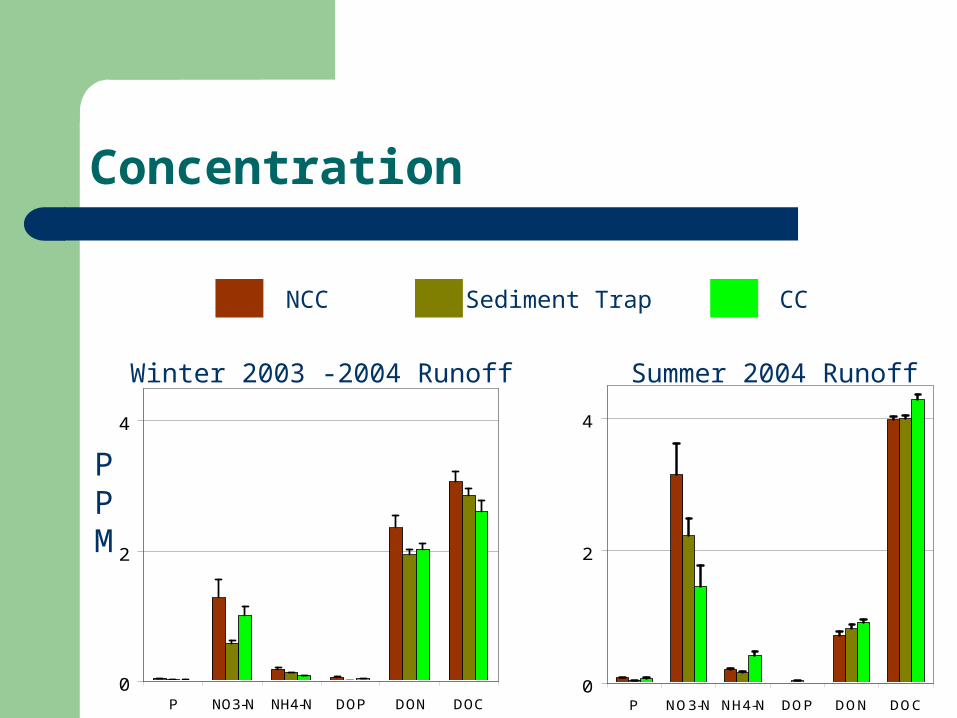
Concentration
PPM
Winter 2003 -2004 Runoff Summer 2004 Runoff
NCC Sediment Trap CC
0
2
4
P NO3-N NH4-N DOP DON DOC0
2
4
P NO3-N NH4-N DOP DON DOC

Results
SS (mg / L)
Tur
bidi
ty
(N
TU
)
Relationship between Suspended Solids (SS) and Turbidity
Winter 2003 – 2004
y = 0.6305x + 199.14
R2 = 0.7956
0
500
1000
1500
2000
2500
3000
3500
4000
4500
0 1000 2000 3000 4000 5000 6000 7000
Summary of Results:Winter 2003 - 2004
Winter fallow field discharged eighteen times more runoff than WLCC field
Average peak runoff velocities from fallow field were twice as high as WLCC field runoff
Use of sediment trap significantly reduced phosphate, NO3, NH4, dissolved organic P and N concentrations from fallow field runoff

Summary of Results:Winter 2003 - 2004
Significantly lower concentrations for Phosphate, NH4, organic N, and Turbidity in WLCC field compared to Fallow field
Concentrations for all fields were low Cover Cropping appears to greatly
minimize sediment loads and other non point source pollutants (NPSP)

Summary of Results:Summer 2004
Following winter CC, concentrations of most water quality constituents were significantly higher than winter fallow runoff concentrations

Recommendations
Alternative management practices have potential to reduce winter and summer discharge
These practices may:– Minimize Sediment loads– Mitigate agro-chemical pollution in California
Agriculture– Assist water coalition groups in meeting watershed
TMDL goals
Recommendations
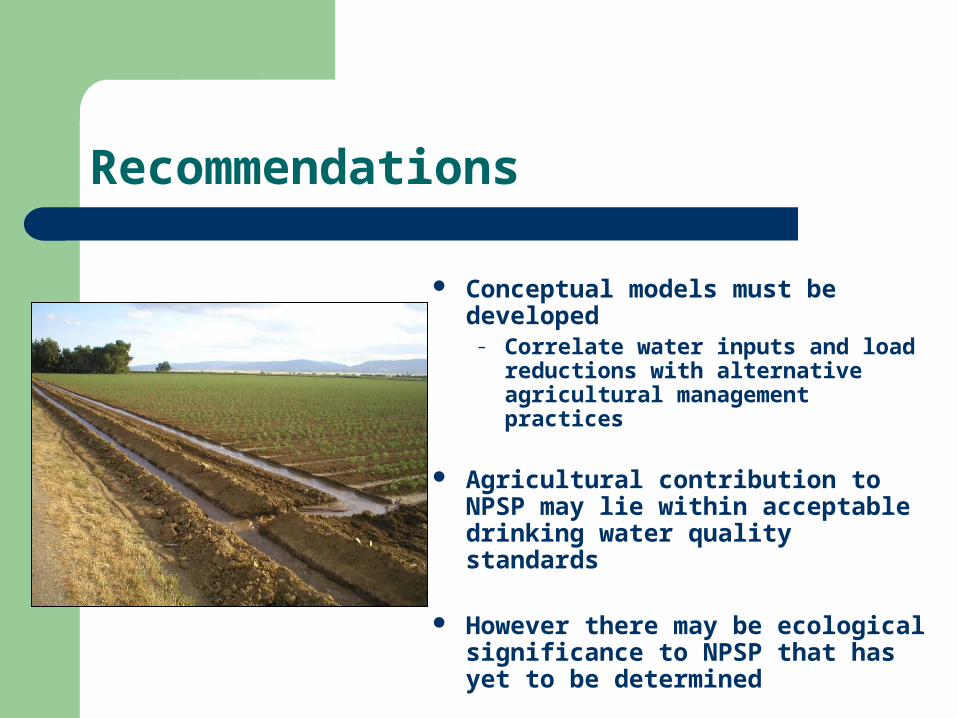
Conceptual models must be developed
– Correlate water inputs and load reductions with alternative agricultural management practices
Agricultural contribution to NPSP may lie within acceptable drinking water quality standards
However there may be ecological significance to NPSP that has yet to be determined

Concern?
In Summer, field scale water balance may be affected following winter CC. The pros and cons must be examined.
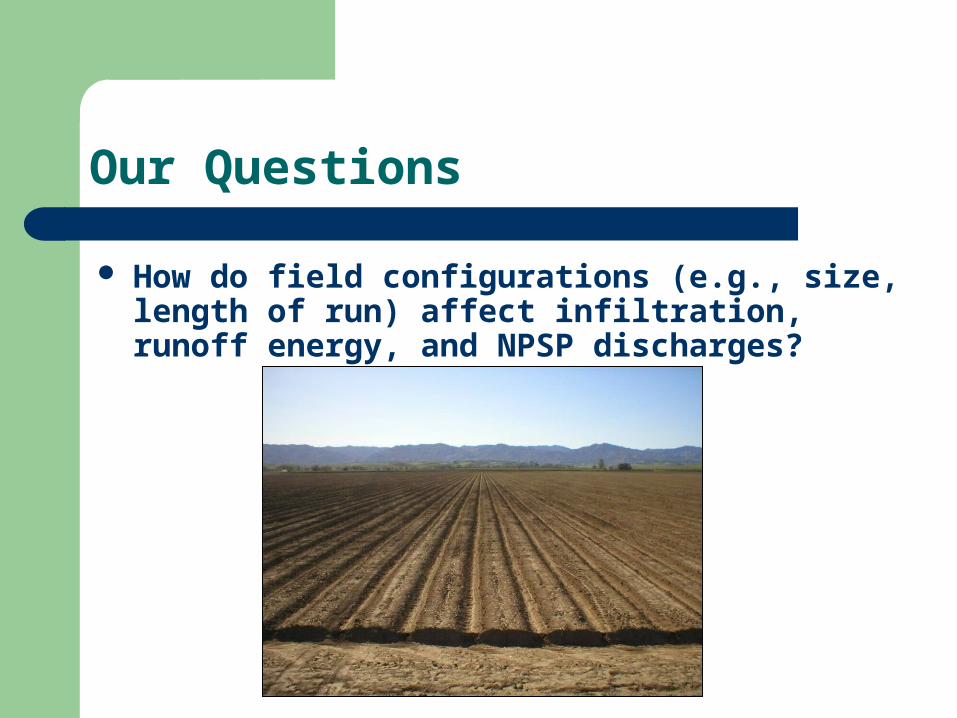
Our Questions
How do field configurations (e.g., size, length of run) affect infiltration, runoff energy, and NPSP discharges?

Your Questions…
?