improveRVA history presentation
20
improveRVA 2025 Richmond’s History Learned Engaged Learning Presentation January 28, 2015 Hardywood Park Brewery
-
Upload
andreas-addison -
Category
Government & Nonprofit
-
view
151 -
download
0
Transcript of improveRVA history presentation

improveRVA 2025
Richmond’s History LearnedEngaged Learning Presentation
January 28, 2015Hardywood Park Brewery

Event Overview
• January 28th, 30 RVA residents came to Hardywood Park Craft Brewery
• Matt Freeman, TMI Consulting, led an engaged learning conversation about Richmond’s history, transportation, race, and education
• Here are the results:

Where do we live?
East End (including downtown) North side South side West End (including VCU/Fan)0.00%
10.00%
20.00%
30.00%
40.00%
50.00%
60.00%
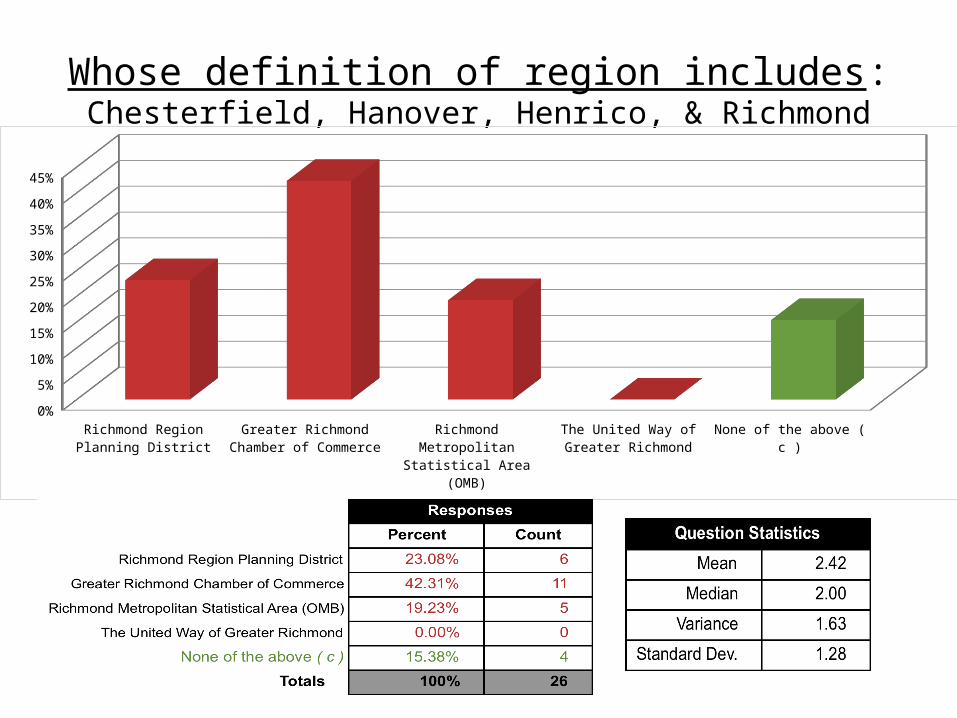
Whose definition of region includes: Chesterfield, Hanover, Henrico, & Richmond
Richmond Reg
ion Planning D
istric
t
Greater
Richmond Cham
ber of C
ommerce
Richmond M
etropolita
n Stati
stical
Area (O
MB)
The U
nited W
ay of G
reater
Richmond
None of th
e above
( c )
0%5%
10%15%20%25%30%35%40%45%

During which census was Richmond’s population the highest?
1950 1960 1970 ( c ) 20100%
5%
10%
15%
20%
25%
30%
35%

Which jurisdiction has the most jobs?
Chesterfield Hanover Henrico ( c ) Richmond0%
10%
20%
30%
40%
50%
60%

What is the Census Bureau’s poverty threshold for a 4-person family in 2014?
$18,422 $24,008 ( c ) $29,190 $33,1140%
5%
10%
15%
20%
25%
30%
35%
40%
45%
50%
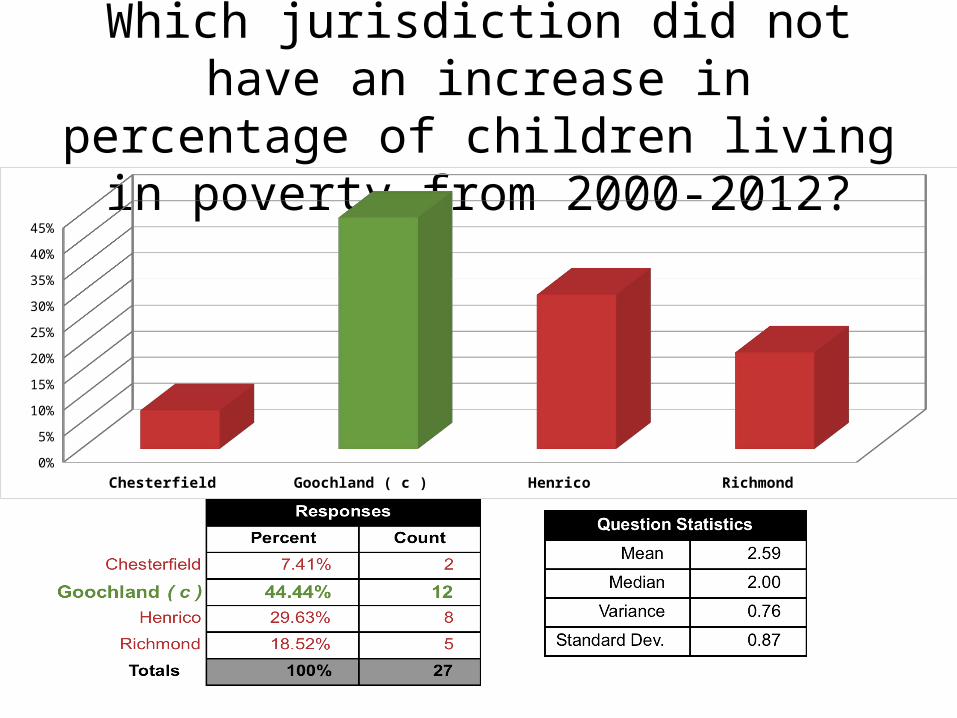
Which jurisdiction did not have an increase in percentage of children living in poverty
from 2000-2012?
Chesterfield Goochland ( c ) Henrico Richmond0%
5%
10%
15%
20%
25%
30%
35%
40%
45%
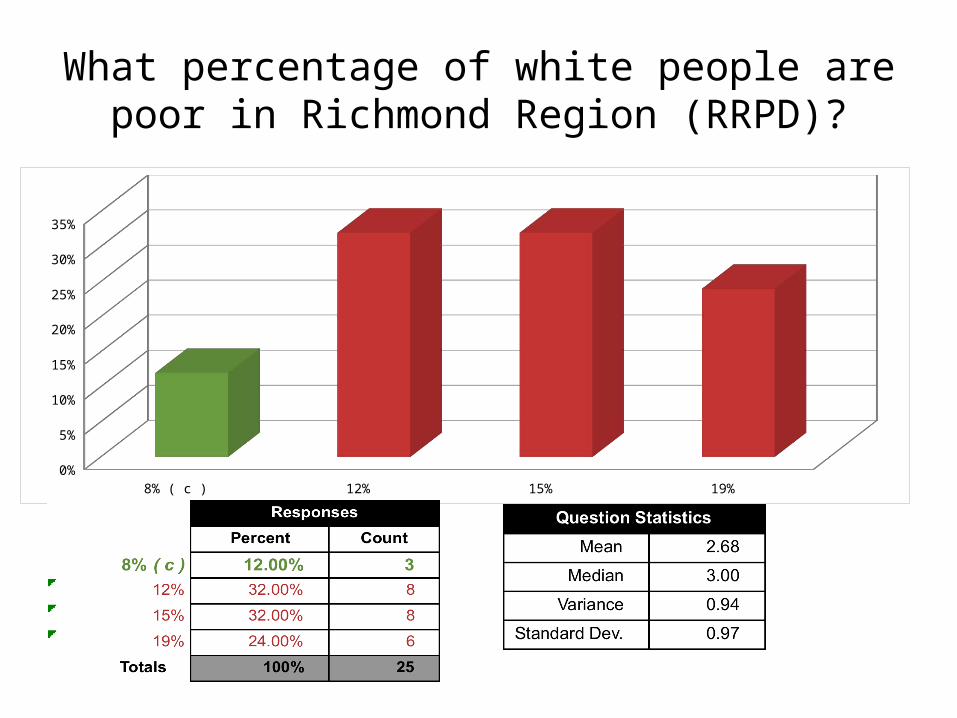
What percentage of white people are poor in Richmond Region (RRPD)?
8% ( c ) 12% 15% 19%0%
5%
10%
15%
20%
25%
30%
35%

In what year did Richmond become the capital of Virginia?
1765 1780 ( c ) 1792 18100%
5%
10%
15%
20%
25%
30%
35%

After Congress banned the importation of African slaves, what was Richmond’s national rank in slave market?
1st (the largest) 2nd ( c ) 4th 7th0%
10%
20%
30%
40%
50%
60%
70%

When did Richmond elect its first African-America mayor?
1968 1970 1977 ( c ) 19820%
10%
20%
30%
40%
50%
60%
70%
80%
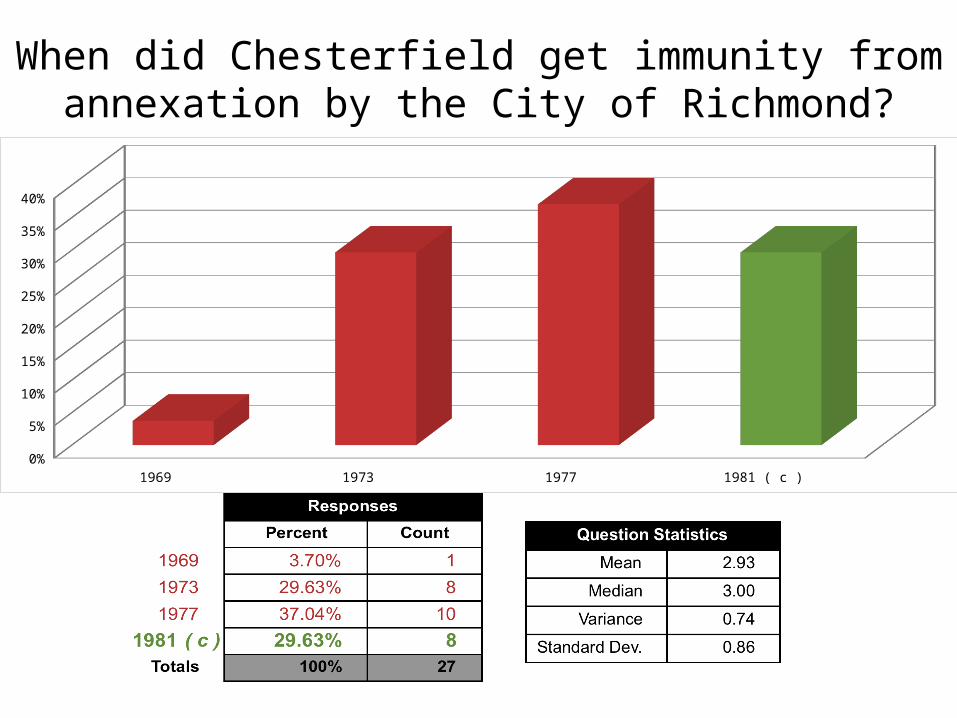
When did Chesterfield get immunity from annexation by the City of Richmond?
1969 1973 1977 1981 ( c )0%
5%
10%
15%
20%
25%
30%
35%
40%

How much is bus fare on GRTC?
$1.00 $1.25 $1.50 ( c ) $2.000%
5%
10%
15%
20%
25%
30%
35%
40%
45%
50%

What jurisdiction(s) own GRTC?
Richmond Richmond & Henrico Richmond & Chesterfield ( c ) Richmond, Henrico, & Chesterfield0%
10%
20%
30%
40%
50%
60%

Which jurisdiction had the most fatal vehicle accidents in 2013?
Chesterfield ( c ) Goochland Henrico Richmond0%
10%
20%
30%
40%
50%
60%

How many of Richmond’s 47 public schools have 10 or fewer white students?
0 7 14 ( c ) 230%
5%
10%
15%
20%
25%
30%
35%
40%

What percentage of Henrico public schools are “students of color”?
11% 23 % 44 % 57 % ( c )0%
5%
10%
15%
20%
25%
30%
35%
40%
45%
50%
Overview & Outcomes
• Regional definition of Richmond varied, which plays into issues of regional projects – Public Transit for example
• Historical context of population growth/decline, history, & education was highlighted
• Regional poverty level of 8% was not known• Wonder if the same 13 people who knew who
owns GRTC were the same that knew the fare cost?

Next Steps & Events
• Takeover GRTC event planning• Sweet Spot Conversation: the crossroads of
bike paths, BRT, GRTC and urban development– Bring together bike coordinator, BRT advocates,
GRTC leadership and others• Event to highlight need for regionalism, who is
involved, what projects are important, etc.• Deeper history of Richmond conversation