
Improvements to the Total Temperature Calibration …...responded to icing community suggestions...
24
E. Allen Arrington and Jose C. Gonsalez QSS Group, Inc., Cleveland, Ohio Improvements to the Total Temperature Calibration of the NASA Glenn Icing Research Tunnel NASA/CR—2005-213875 September 2005 AIAA–2005–4276 https://ntrs.nasa.gov/search.jsp?R=20050217033 2020-07-13T19:01:58+00:00Z
Transcript of Improvements to the Total Temperature Calibration …...responded to icing community suggestions...
E. Allen Arrington and Jose C. GonsalezQSS Group, Inc., Cleveland, Ohio
Improvements to the Total TemperatureCalibration of the NASA GlennIcing Research Tunnel
NASA/CR—2005-213875
September 2005
AIAA–2005–4276
https://ntrs.nasa.gov/search.jsp?R=20050217033 2020-07-13T19:01:58+00:00Z

The NASA STI Program Office . . . in Profile
Since its founding, NASA has been dedicated tothe advancement of aeronautics and spacescience. The NASA Scientific and TechnicalInformation (STI) Program Office plays a key partin helping NASA maintain this important role.
The NASA STI Program Office is operated byLangley Research Center, the Lead Center forNASA’s scientific and technical information. TheNASA STI Program Office provides access to theNASA STI Database, the largest collection ofaeronautical and space science STI in the world.The Program Office is also NASA’s institutionalmechanism for disseminating the results of itsresearch and development activities. These resultsare published by NASA in the NASA STI ReportSeries, which includes the following report types:
• TECHNICAL PUBLICATION. Reports ofcompleted research or a major significantphase of research that present the results ofNASA programs and include extensive dataor theoretical analysis. Includes compilationsof significant scientific and technical data andinformation deemed to be of continuingreference value. NASA’s counterpart of peer-reviewed formal professional papers buthas less stringent limitations on manuscriptlength and extent of graphic presentations.
• TECHNICAL MEMORANDUM. Scientificand technical findings that are preliminary orof specialized interest, e.g., quick releasereports, working papers, and bibliographiesthat contain minimal annotation. Does notcontain extensive analysis.
• CONTRACTOR REPORT. Scientific andtechnical findings by NASA-sponsoredcontractors and grantees.
• CONFERENCE PUBLICATION. Collectedpapers from scientific and technicalconferences, symposia, seminars, or othermeetings sponsored or cosponsored byNASA.
• SPECIAL PUBLICATION. Scientific,technical, or historical information fromNASA programs, projects, and missions,often concerned with subjects havingsubstantial public interest.
• TECHNICAL TRANSLATION. English-language translations of foreign scientificand technical material pertinent to NASA’smission.
Specialized services that complement the STIProgram Office’s diverse offerings includecreating custom thesauri, building customizeddatabases, organizing and publishing researchresults . . . even providing videos.
For more information about the NASA STIProgram Office, see the following:
• Access the NASA STI Program Home Pageat http://www.sti.nasa.gov
• E-mail your question via the Internet [email protected]
• Fax your question to the NASA AccessHelp Desk at 301–621–0134
• Telephone the NASA Access Help Desk at301–621–0390
• Write to: NASA Access Help Desk NASA Center for AeroSpace Information 7121 Standard Drive Hanover, MD 21076
E. Allen Arrington and Jose C. GonsalezQSS Group, Inc., Cleveland, Ohio
Improvements to the Total TemperatureCalibration of the NASA GlennIcing Research Tunnel
NASA/CR—2005-213875
September 2005
National Aeronautics andSpace Administration
Glenn Research Center
Prepared under Contract NAS3–00145
Prepared for the41st Joint Propulsion Conference and Exhibitcosponsored by the AIAA, ASME, SAE, and ASEETucson, Arizona, July 10–13, 2005
AIAA–2005–4276

Available from
NASA Center for Aerospace Information7121 Standard DriveHanover, MD 21076
National Technical Information Service5285 Port Royal RoadSpringfield, VA 22100
Available electronically at http://gltrs.grc.nasa.gov
NASA/CR—2005-213875 1
Improvements to the Total Temperature Calibration of the NASA Glenn Icing Research Tunnel
E. Allen Arrington and Jose C. Gonsalez QSS Group, Inc.
Cleveland, Ohio 44135
Abstract The ability to accurately set repeatable total temperature conditions is critical for collecting quality icing
condition data, particularly near freezing conditions. As part of efforts to continually improve data quality in the NASA Glenn Icing Research Tunnel (IRT), new facility instrumentation and new calibration hardware for total temperature measurement were installed and new operational techniques were developed and implemented. This paper focuses on the improvements made in the calibration of total temperature in the IRT.
Nomenclature A0, A1, A2 RTD probe total temperature flow recovery curve fit coefficients C0, C1 Test section total temperature calibration curve fit coefficients M Mach number PT Total pressure, psia PS Static pressure, psia Pair Spray bar air pressure, psig t time, seconds TT Total temperature, °C (K, °F) TT,jet Total temperature of the free jet calibration facility airflow, °R TT,probe Total temperature of the probe (RTD) being calibrated, °R TS Static temperature, °C (°F) TT,davg Average of the 24 Corner D total temperature measurements, °C (°F) U Velocity, knots (ft/sec) X Axial coordinate with axis origin at bellmouth/test section weld seam, in. Y Spanwise coordinate with axis origin at the test section inner wall, in. Z Vertical coordinate with axis origin at the test section floor, in. σ Standard deviation Subscripts c Calibrated value t time, seconds ts Test section conditions bm Bellmouth conditions
I. Introduction The NASA Glenn Research Center (GRC) Icing Research Tunnel (IRT) is the primary ground test facility for the
study of aircraft icing phenomena in the United States. As such, the IRT facility staff and GRC icing experts are always looking for ways to improve the data quality, data accuracy and test efficiency. In 2004, the IRT team responded to icing community suggestions about improving a perceived lack of accuracy in the total temperature measurement in the facility. The facility total temperature was monitored using a set of 24 type-T thermocouples mounted along the leading edges of the Corner D turning Vanes. It was suggested that the overall measurement quality could be improved by replacing the existing thermocouples with resistive temperature device (RTD) transducers. The IRT engineering staff completed a detailed review of the available RTD measurement systems and replaced the D-Corner thermocouples in early 2004 (during the planned facility downtime for replacement of the drive fan inlet guide vanes). This paper provides and overview of the improvements made in the total temperature measurement in the IRT, with the focus on the total temperature calibration.

NASA/CR—2005-213875 2
II. Total Temperature Measurement Issues and Solutions In a specialized test facility, like the IRT, it is critical that the test customers have confidence in the data, which
means confidence in the test facility, test techniques, instrumentation and data systems. The facility staff must understand more than just the standard subsonic wind tunnel calibration and flow quality parameters of pressure, flow angle, turbulence and Mach number; there are parameters associated with the icing cloud formation, such as liquid water content and droplet size that are of paramount importance when setting icing conditions. Depending on the specific conditions, such as near freezing, total and static temperature settings are also critical parameters, since the type of icing phenomena an aircraft will encounter is dictated in part by the air temperature. Because of the criticality of the temperature measurement, the IRT management and staff decided to improve the overall total temperature measurement system in the IRT.
There were several related issues that were addressed to improve the total temperature measurement system in the IRT. While the improvement to the facility instrumentation was the primary change to the total temperature measurement system, it was also necessary to improve the total temperature calibration methodology. The following is a list of the issues and their solutions that have been implemented in the IRT. The effectiveness of the solutions will be addressed throughout the remainder of the paper.
• Overall total temperature measurement accuracy: The accuracy of the total temperature measurement is very
important in the IRT, particularly for icing conditions at or near the freezing point. IRT personnel changed the facility instrumentation in D Corner to RTDs to improve overall accuracy.
• Total temperature calibration accuracy: In concert with the facility total temperature instrumentation upgrade, it was necessary to replace the temperature calibration instrumentation to improve the overall accuracy of the total temperature calibration. RTD probes were selected for use on the test section calibration hardware to provide the required accuracy improvement as well as consistency with the facility instrumentation.
• Spatial and temporal variations: Prior to 2004, all aero-thermal calibration data were collected using a rake that spanned the test section horizontally and was positioned at multiple vertical heights to survey a plane in the test section. This survey method artificially magnified the apparent total temperature variation over the survey plane since it was not possible to account for normal temporal variations in the flow field. A recommendation was made following the 2000 calibration that a 2-D array of temperature probes should be used to collect data over the entire survey plane simultaneously.
• Low speed calibration: Spraybar air injection has a significant effect on the test section airspeed at 50 knots. The total temperature calibration relationship was tailored to address the affects of spraybar air injection on the test section temperature at the low speed condition.
• Reduction of test time required: The 2-D array described above would have the added benefit of greatly reducing the test time and cost needed to complete the total temperature calibration.
III. Description of Facility The NASA Glenn Icing Research Tunnel is a closed-loop atmospheric tunnel with rectangular cross sections.
The airflow is driven by a 25-ft diameter twelve blade fan that is powered by a 5000-horsepower electric motor. The tunnel test section is 6-ft high, 9-ft wide, and 20-ft long. There is no divergence along any of the test section surfaces. The velocity in an empty test section can be varied between 25 and 340 knots at –17.8 °C (37 to 575 ft/sec at 0 °F).* A set of ten horizontally oriented spray bars, located in the settling chamber at the bellmouth inlet, inject atomized water into the airflow to create icing conditions. The tunnel has been in service since 1944 and has undergone several major upgrades and modifications over the years to insure that it remains the lead ground test facility for icing research (refs. 1 and 2). In 2004, the inlet guide vanes (IGVs) upstream of the drive fan were replaced, primarily for structural reasons, but also to improve aerodynamic performance. The new RTDs were installed in D Corner during this downtime. Figure 1 shows the IRT plan view as the tunnel is currently configured. More information about the IRT is located in reference 3.
*In general, English units are used in the aero-thermal calibration of all wind tunnels at NASA Glenn. However, for consistency with many of the icing tests conducted in the IRT, velocity is expressed in knots and temperatures in degrees Celsius. Exceptions are noted in the text.

NASA/CR—2005-213875 3
Figure 1. Layout of the NASA Glenn Icing Research Tunnel.
IV. Hardware Description There have been several sets of instrumentation used to calibrate the aero-thermal characteristics of the IRT
during the course of its history. In general, instrumented rakes of pressure and temperature probes have been used to collect both calibration and flow quality data in the IRT test section. In 1997, an instrumented rake, known as the 9-ft survey rake, was designed specifically for the IRT aero-thermal calibration testing, which allowed the simultaneous measurement of total and static pressure, total temperature, flow angle and turbulence.
In order to improve the accuracy and confidence in the total temperature calibration, it was necessary to upgrade the calibration instrumentation from thermocouples to RTDs to match the newly installed instrumentation in D-Corner. Recommendations made following the 2000 aero-thermal calibration called for the use of an array or grid of temperature probes to collect test section temperature data in order to eliminate any temporal variation in the data caused when collecting data using a single rake positioned at multiple heights over the course of several test runs. Therefore, rather than refit the 9-ft survey rake with RTDs, a new piece of hardware of developed specifically for the IRT total temperature calibration, the 2-D RTD array.
A. 9-Foot Survey Rake The 9-ft survey rake has been the primary tool for carrying out full aero-thermal test section calibrations and flow
quality measurements since 1997. Figure 2 is a photograph of the 9-ft survey rake installed in the IRT test section at a vertical height of Z=36 in. (centerline) and axial position of X=179.3 in. downstream of the tunnel datum line (106.3 in. downstream of the test section inlet). Figure 3 shows the plan view of the IRT test section with the survey rake installed. The survey rake was supported at both ends by bolting the rake to wall mounted support plates. These support plates are 6-ft tall and have a bolt pattern that allow the rake to be positioned vertically every 6-in. above or below the test section centerline. A vertical strut was also used to support the rake in the center. The main body of the rake is formed by two aluminum I-beams and thin aluminum plates riveted together. Thin sheets of aluminum were bent to form the leading and tailing edge of the rake body.
The instrumentation mounted on the 9-ft survey rake includes eleven flow angle pressure probes, eleven total temperature thermocouple probes, and three single sensor or dual sensor hot wire probes. The flow angle pressure probes are of hemi-spherical head design and have five total pressure ports in the head. The four circumferential total pressure ports measure pitch and yaw angle. The center port measures total pressure. Four static pressure ports are located downstream of the head. The heads of the probes are 20.75-in. upstream of the rake leading edge; spacing between the probes is 9 in. The static pressure taps on each probe are 5.75-in. downstream of the head. The rake is mounted in the test section so that the tips of the pressure probes are positioned at the centerline of the test section turntable. The probes were calibrated for Mach numbers between 0.1 and 0.6 in the NASA Glenn 3.5-in. diameter free jet calibration facility.

NASA/CR—2005-213875 4
Figure 2. Photograph of the 9-foot horizontal survey rake installed in the IRT test section.
Datum line (weld seam)
Test section inlet
73.0
179.3106.3
Figure 3. Plan view of the IRT test section showing the installed location of the 9-foot survey rake.
Aspirated total temperature thermocouple probes with copper/constantan (type T) wires were used. The probes are
mounted to the bottom surface of the survey rake with the tips of the probes about 0.5-in. upstream of the rake leading edge and 2.0-in. below the rake centerline; probe spacing is 9 in. The total temperature probes were calibrated for total temperature recovery in the NASA Glenn 3.5-in. diameter free jet calibration facility.
Three single sensor or dual sensor hot wire probes (0.00015-in. diameter tungsten wires) were used. The probes were mounted to the upper surface of the rake body as depicted in figure 2. The probe tips were located 9.75 in. upstream of the rake body leading edge and 3.0-in. above centerline.
B. 2-D RTD Array The 2-D RTD Array was designed and built to provide a more accurate total temperature calibration and
temperature mapping of the test section, while also reducing overall test time and cost. There were several items that were considered during the design that are discussed in the following sections.

NASA/CR—2005-213875 5
1. RTD Array Design The first design point was to
determine the number and arrangement of the RTD probes in order to provide adequate coverage of the test section flow field. Reference 5 provided a recommendation on the arrangement of the probes in the test section that was adopted for the RTD array. The resulting layout is a 7-by-7 grid with the probes spaced at 0, ±25, ±50 and ±75 percent of the test section dimension from the horizontal and vertical centerlines, as shown in figure 4. This arrangement provided the test section coverage required without incurring an unreasonable cost for the RTD probes.
The next step was to design a support system for the RTD probes that would allow for the needed test section coverage without excessive blockage. Other considerations were weight (for ease of installation), probe installation (to allow for replacement or repair of damaged probes) and protection of the instrumentation lines. The final solution was to construct and array of seven vertical members, that would each house the seven RTD probes and instrumentation wiring, and four horizontal members for structural rigidity. The array would be secured to the test section walls, floor and ceiling, however allowances were made to account for thermal expansion of the array. Figure 5 shows the 2-D RTD array installed in the IRT test section.
2. Selection of RTD Probes
The RTD total temperature probe selection process first began with a review of the desired total temperature accuracy. The thermocouple total temperature probes used for previous test section aero-thermal calibrations had an absolute measurement uncertainty of ±1.1 °C (±2 °F) (ref. 4). The goal was to improve the absolute measurement uncertainty. The resulting 4-wire RTD total temperature probe system has an absolute measurement uncertainty of ±0.10 °C (±0.18 °F) for a probe that was individually calibrated for total temperature flow recovery. The details of this uncertainty analysis are left to the uncertainty section of this paper.
Figure 5. Installation of the 2-D RTD Array in the IRT test section. (a) view looking downstream. (b) view looking upstream.
(a) (b)
-36
-27
-18
-9
0
9
18
27
36
-54 -40.5 -27 -13.5 0 13.5 27 40.5 54Distance from centerline, in.
Dis
tanc
e fro
m c
ente
rline
, in
Figure 4. 7x7 grid arrangement of the RTD probes in the IRT test section. The intersections of the dotted lines indicate the probe positions.
NASA/CR—2005-213875 6
RTD ceramic capsule
Prototype “A”
Prototype “B”, types 1 and 2
Prototype “C”
φ0.28 φ0.38
0.060.59
45º internal chamfer (typical)
φ0.19 φ0.19 φ0.25
4 holes, φ0.065 0.270.69
φ0.19
4 holes, φ0.065 and φ0.110
0.250.75
4 holes, φ0.065
φ0.19 φ0.19 φ0.25
0.510.69
1.00
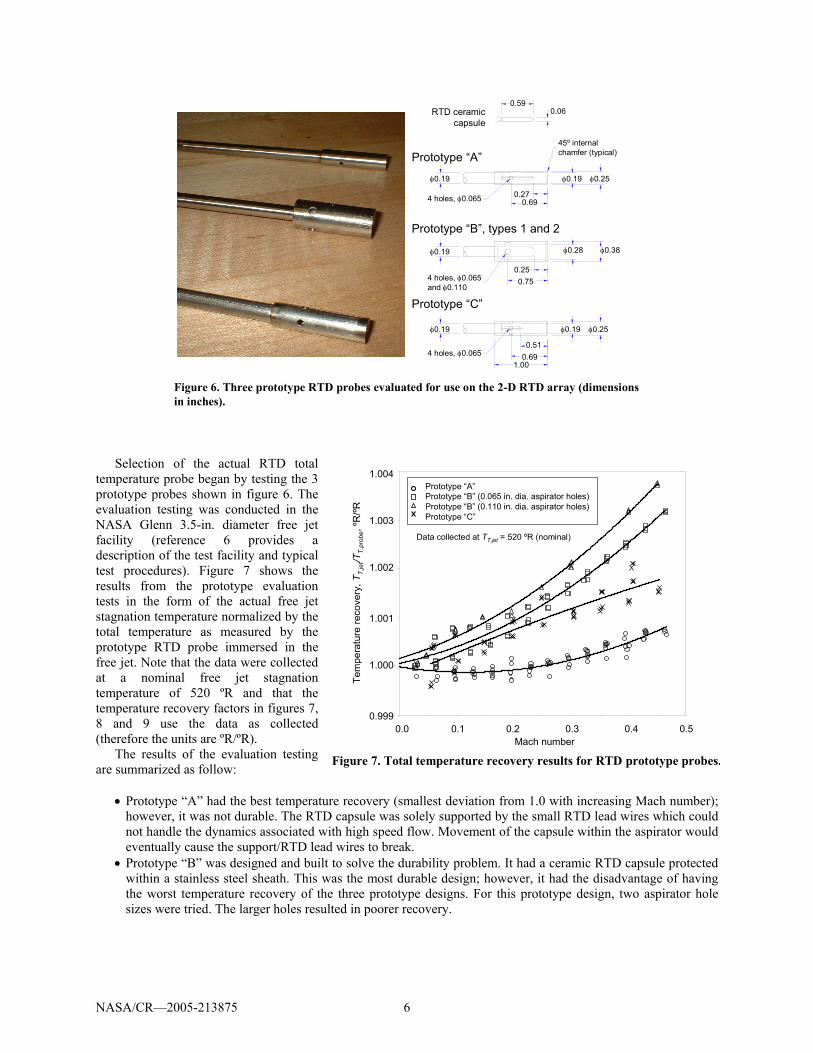
Figure 6. Three prototype RTD probes evaluated for use on the 2-D RTD array (dimensions in inches).
Selection of the actual RTD total temperature probe began by testing the 3 prototype probes shown in figure 6. The evaluation testing was conducted in the NASA Glenn 3.5-in. diameter free jet facility (reference 6 provides a description of the test facility and typical test procedures). Figure 7 shows the results from the prototype evaluation tests in the form of the actual free jet stagnation temperature normalized by the total temperature as measured by the prototype RTD probe immersed in the free jet. Note that the data were collected at a nominal free jet stagnation temperature of 520 ºR and that the temperature recovery factors in figures 7, 8 and 9 use the data as collected (therefore the units are ºR/ºR).
The results of the evaluation testing are summarized as follow:
• Prototype “A” had the best temperature recovery (smallest deviation from 1.0 with increasing Mach number);
however, it was not durable. The RTD capsule was solely supported by the small RTD lead wires which could not handle the dynamics associated with high speed flow. Movement of the capsule within the aspirator would eventually cause the support/RTD lead wires to break.
• Prototype “B” was designed and built to solve the durability problem. It had a ceramic RTD capsule protected within a stainless steel sheath. This was the most durable design; however, it had the disadvantage of having the worst temperature recovery of the three prototype designs. For this prototype design, two aspirator hole sizes were tried. The larger holes resulted in poorer recovery.
0.999
1.000
1.001
1.002
1.003
1.004
0 0.05 0.1 0.15 0.2 0.25 0.3 0.35 0.4 0.45 0.5
Mach Number
Tem
pera
ture
Rec
over
y, T
Tjet
/ TT
prob
e
Prototype 'A'Prototype 'B', 0.065" Diameter Aspirator HolesPrototype 'B', 0.110" Diameter Aspirator HolesPrototype 'C'
Figure 7. Total temperature recovery results for RTD prototype probes.
0.0 0.1 0.2 0.3 0.4 0.5Mach number
Tem
pera
ture
reco
very
, TT,
jet/T
T,pr
obe,
ºR/ºR
1.000
1.003
1.001
0.999
1.002
1.004Prototype “A”Prototype “B” (0.065 in. dia. aspirator holes)Prototype “B” (0.110 in. dia. aspirator holes)Prototype “C”
Data collected at TT,jet = 520 ºR (nominal)

NASA/CR—2005-213875 7
0.9998
1.0000
1.0002
1.0004
1.0006
1.0008
1.0010
1.0012
1.0014
1.0016
1.0018
0.00 0.05 0.10 0.15 0.20 0.25 0.30 0.35 0.40 0.45 0.50
Mach Number, M
Tota
l Tem
pera
ture
Rec
over
y, T
Tjet
/ TT
prob
e
TTjet / TTprobe = 6.099340E-03*M**2 + 6.670401E-04*M + 1.0
0.9995
1.0000
1.0005
1.0010
1.0015
1.0020
0.00 0.10 0.20 0.30 0.40 0.50
Mach Number, M
Tota
l Tem
pera
ture
Rec
over
y, T
Tjet
/ TT
prob
e
TTjet / TTprobe = 6.881316E-03*M**2 + 1.490507E-04*M + 1.0
Figure 8. Typical total temperature flow recovery curve for the 2-D RTD array probes.
Figure 9. Total temperature flow recovery data for RTD probes 1 through 23 with average curve fit.
Mach number, M0.0 0.1 0.2 0.40.3 0.5To
tal t
empe
ratu
re re
cove
ry, T
T,je
t/TT,
prob
e, ºR
/ºR
0.9998
1.0000
1.0002
1.0004
1.00061.0008
1.0010
1.0012
1.0016
1.0018
1.0014TT,jet/TT,probe = 1.0 + 6.670401x10⁻⁴·M
+ 6.09934x10⁻³·M2
Probe number 15
0.0 0.1 0.2 0.3 0.4 0.5Mach number, M
0.9995
1.0000
1.0005
1.0010
1.0015
1.0020TT,jet/TT,probe = 1.0 + 1.490507x10⁻⁴·M
+ 6.881316x10⁻³·M2
Data collected at TT,jet = 520 ºR (nominal)
Tota
l tem
pera
ture
reco
very
, TT,
jet/T
T,pr
obe,
ºR/ºR
• Prototype “C” seemed to be the best compromise between recovery and durability. It featured an exposed
ceramic RTD capsule that was partially pulled back and potted into the supporting probe shaft (the RTD length was half that of prototype “A”). This gave it good durability and recovery better than having the RTD capsule encased in a stainless steel sheath. The recovery characteristics of this prototype in comparison to prototypes A and B are shown in figure 7.
Through this series of evaluation tests, prototype “C” was selected as the actual probe design to be used on the
IRT test section RTD array. A total of 52 RTD probes were built for use in the IRT aero-thermal calibration based on the prototype “C” design. Three of the probes were mounted on the subsonic quick-check rake (serial numbers 1 through 3) and the remaining probes were assigned to the 2-D RTD array (serial numbers 4 through 52). 3. Flow Recovery Testing
A portion of the RTD probes (serial numbers 1 through 23) were calibrated for temperature flow recovery in the 3.5-in. Diameter Free Jet Facility. The recovery testing was conducted to determine how well the probes sense the total pressure over a range of airflow conditions. During the testing, the free jet air temperature was set to a nominal condition (about 520 °R) and held constant while the free jet Mach number was varied from 0 to 0.5. Figure 8 shows the total temperature recovery results for a typical probe (serial number 15) with its individual flow recovery curve. The recovery curves were subsequently used to correct data collected in the IRT. The 20 RTD probes that were individually calibrated for flow recovery were mounted in the center of the 2-D RTD array. The probes that did not have their recovery characteristics directed measured were mounted around the periphery of the array and used the average recovery from all the calibrated probes (fig. 9).
C. Facility Instrumentation The following standard facility instrumentation was used during this test program:
1) Bellmouth/test section pitot-static probes: Two probes are mounted near the exit of the bellmouth, one on the inner wall and one on the outer wall. These probes are used to measure the test section total and static pressure. Measurements from both probes are averaged to arrive at PT,hm and PS,,bm. These probes are shown in figure 3.
2) Total temperature probes in corner D: Twenty-four RTD probes are arrayed on the leading edges of the turning vanes in Corner D to measure the temperature profile exiting the facility cooler. The distribution of the measured temperatures and the average of these twenty-four probes, TT,davg, is used to monitor the operation of the heat exchanger. The locations of these probes are shown in figure 10.

NASA/CR—2005-213875 8
8.7 8.78.75.8 5.8
49.22.9
Outer wall
Dxx : RTD probe
22.9
16.4
3.3
9.8
Figure 10. Layout of the RTD probes mounted on the Corner D turning vanes. View looking upstream. Dimensions in feet (not to scale).
D11 D12
D31 D32
D51 D52
D71 D72
#1
#3
#5
#7
D23 D22 D21
D33 D43 D42 D41
D53 D63 D62 D61
D73 D83 D82 D81
#2
#4
#6
#8
D13
Heat exchanger module number
Inner wall
D. Steady-State Data Acquisition System Real-time steady-state data acquisition and data display was provided by a NASA Glenn Escort Alpha system. This
system is the standard data acquisition and data display system used in the large test facilities at NASA Glenn. The system accommodates inputs from the Electronically Scanned Pressure System (ESP), inputs from the facility distributed process control system, and inputs from any analog devices such as thermocouples, RTDs and pressure transducers. This system recorded all steady-state pressures and temperatures from the 9-ft survey rake, 2-D RTD array, the tunnel bellmouth pitot-static probes, and the total temperature probes in Corner D. It also recorded important facility parameters such as fan rotational speed and spray bar air pressure.
The Electronically Scanned Pressure system used during this test program utilized plug-in modules that each contained 32 individual transducers with individual ports. Each transducer/port can be addressed separately and scanned at a rate of 10,000 ports per second. Calibration of all ESP transducers was performed automatically by the system at least every 30 minutes. For this test program, ±5 psid modules were used.
V. Test Procedures In addition to the improvements in test hardware and instrumentation, there were also improvements in the test
procedures and modifications to the total temperature calibration test matrix, since the 2000 test section calibration. Detailed descriptions of the test procedures for the 2000 calibration are found in reference 7; the detailed report on the 2004 and 2005 calibrations will be published later in 2005. The procedures used in the 2000, 2004 and 2005 calibrations are summarized below.
A. 2000 Calibration The 2000 aero-thermal calibration (ref. 7) was the second full test section calibration using the 9-ft survey rake
as the primary aero-thermal calibration measurement platform (this initial use of the 9-ft survey rake was in 1997). The thought was to use a single piece of hardware to collect all of the required test data in a given location at one time, but to use a single element rake to minimize the size and blockage of the test hardware to reduce influence on the pressure measurements. The trade-off was the added test time required to completely survey a cross-sectional plane in the test section by moving the rake through 11 vertical positions. The test time was further increased due to the need to run the “aero” portion of the test matrix separately from the temperature surveys, since the pressure probes ice-up at lower temperatures. The test matrix for the 2000 aero-thermal calibration is shown in table 1. A total of 8 test days were required to complete the aero-thermal calibration testing using the 9-ft survey rake.
Two recommendations were made following the 2000 aero-thermal calibration, as listed in reference 7. First, all pressure data should be collected at ambient temperature settings in order to reduce the risk of water condensation in the tunnel which would cause the probes to ice-up or results in water in the instrumentation lines. The second recommendation was to fabricate a 2-D grid of temperature probes in order to reduce the time required to collect temperature data and to separate spatial and time variations in the temperature data.
NASA/CR—2005-213875 9
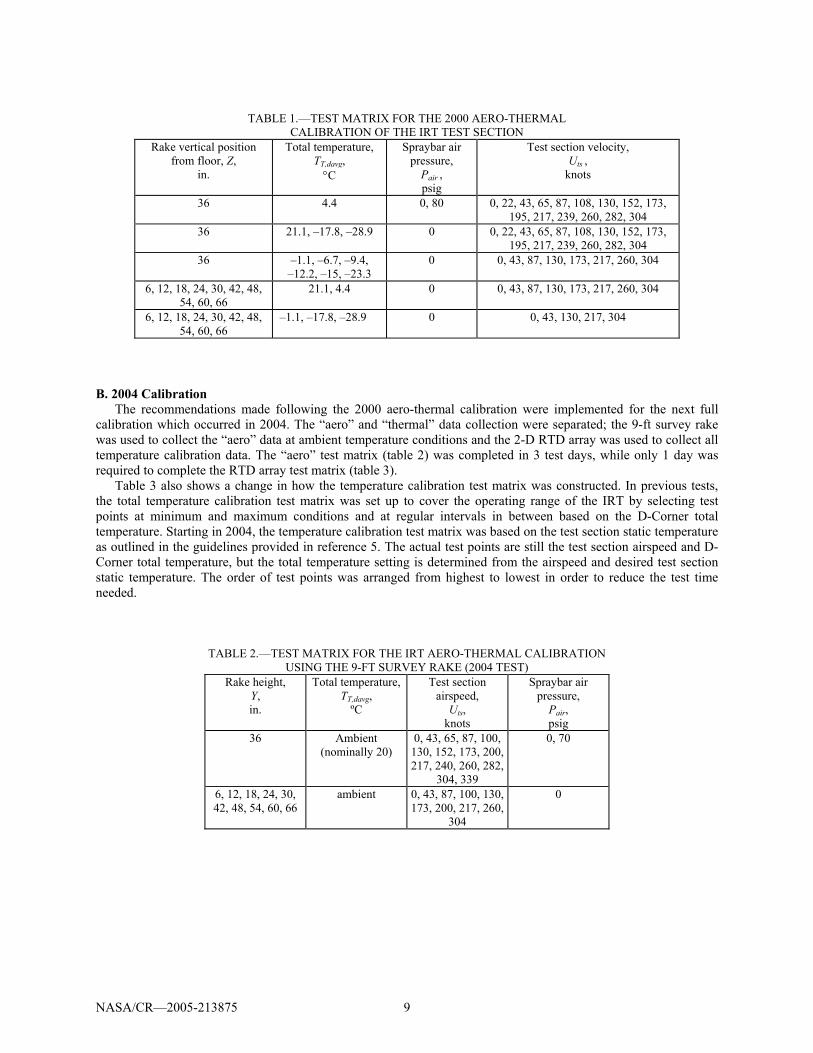
TABLE 1.—TEST MATRIX FOR THE 2000 AERO-THERMAL CALIBRATION OF THE IRT TEST SECTION
Rake vertical position from floor, Z,
in.
Total temperature, TT,davg, °C
Spraybar air pressure,
Pair , psig
Test section velocity, Uts ,
knots
36 4.4 0, 80 0, 22, 43, 65, 87, 108, 130, 152, 173, 195, 217, 239, 260, 282, 304
36 21.1, –17.8, –28.9 0 0, 22, 43, 65, 87, 108, 130, 152, 173, 195, 217, 239, 260, 282, 304
36 –1.1, –6.7, –9.4, –12.2, –15, –23.3
0 0, 43, 87, 130, 173, 217, 260, 304
6, 12, 18, 24, 30, 42, 48, 54, 60, 66
21.1, 4.4 0 0, 43, 87, 130, 173, 217, 260, 304
6, 12, 18, 24, 30, 42, 48, 54, 60, 66
–1.1, –17.8, –28.9 0 0, 43, 130, 217, 304
B. 2004 Calibration The recommendations made following the 2000 aero-thermal calibration were implemented for the next full
calibration which occurred in 2004. The “aero” and “thermal” data collection were separated; the 9-ft survey rake was used to collect the “aero” data at ambient temperature conditions and the 2-D RTD array was used to collect all temperature calibration data. The “aero” test matrix (table 2) was completed in 3 test days, while only 1 day was required to complete the RTD array test matrix (table 3).
Table 3 also shows a change in how the temperature calibration test matrix was constructed. In previous tests, the total temperature calibration test matrix was set up to cover the operating range of the IRT by selecting test points at minimum and maximum conditions and at regular intervals in between based on the D-Corner total temperature. Starting in 2004, the temperature calibration test matrix was based on the test section static temperature as outlined in the guidelines provided in reference 5. The actual test points are still the test section airspeed and D-Corner total temperature, but the total temperature setting is determined from the airspeed and desired test section static temperature. The order of test points was arranged from highest to lowest in order to reduce the test time needed.
TABLE 2.—TEST MATRIX FOR THE IRT AERO-THERMAL CALIBRATION USING THE 9-FT SURVEY RAKE (2004 TEST)
Rake height, Y, in.
Total temperature, TT,davg,
ºC
Test section airspeed,
Uts, knots
Spraybar air pressure,
Pair, psig
36 Ambient (nominally 20)
0, 43, 65, 87, 100, 130, 152, 173, 200, 217, 240, 260, 282,
304, 339
0, 70
6, 12, 18, 24, 30, 42, 48, 54, 60, 66
ambient 0, 43, 87, 100, 130, 173, 200, 217, 260,
304
0

NASA/CR—2005-213875 10
C. 2005 Calibration The 2005 aero-thermal calibration test matrices was identical to those used in 2004, except for the addition of 40
psig spraybar air setting. This condition was added to check the sensitivity of the airspeed and temperature calibrations with respect to spraybar air pressure, especially at the very low speed settings.
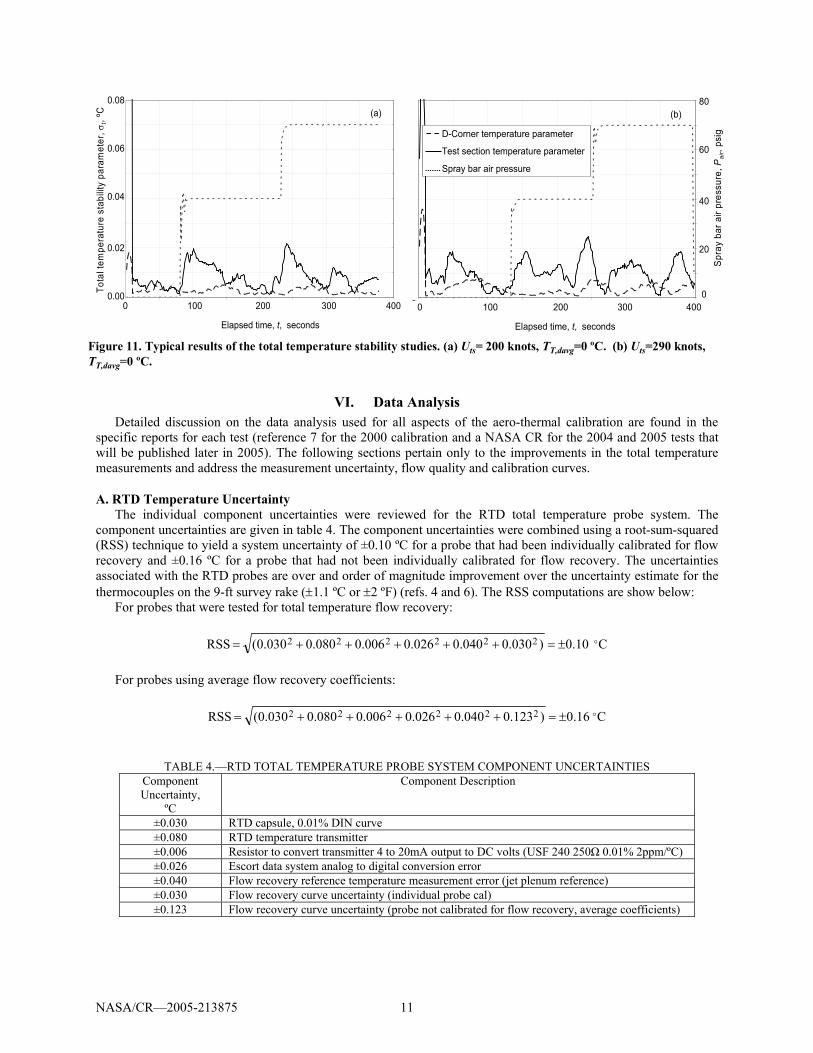
Also during 2005, the RTD array was used to study the spatial and temporal stability of the D-Corner and test section total temperature measurements. The goal of this study† was to develop a graphical tool for monitoring the stability of the D-Corner total temperature in order to determine the best conditions to collect research test data. The graphical tool monitored the change in the standard deviation of the average D-Corner or test section temperatures over time. While still in development, this tool was used during the collection of the temperature calibration data.
Figure 11 provides an example of the data used to determine the stability of the D-Corner and test section total temperatures. For the D-Corner temperature, the instantaneous average temperature was computed each time the Escort data system scanned the data channels (once per second). The standard deviation of the average D-Corner total temperature was completed using the previous 10 scans (10 seconds) of data and was updated every second. For example, at time = 10 seconds, the standard deviation data point was calculated from scans 1 through 10; at time = 11 seconds, the calculation used scans 2 through 11, and so on. The standard deviation for the D-Corner average total temperature for time = t is
1
)()1(
2,,,
−
−
=σ∑
−−== n
TTt
ntidavgTidavgT
tt
Similar equation was used to calculate the test section total temperature stability parameter.
†The details of the D-Corner temperature stability study are outside the scope of this paper. This study was conducted by Ide and Del Roso and a paper describing the study is planned.
TABLE 3.—TEMPERATURE CALIBRATION TEST MATRIX USING THE 2-D RTD ARRAY (2004 TEST) Test section
static temperature,
TS,ts, ºC
Test section airspeed,
Uts, knots
D-Corner total temperature,
TT,davg, ºC
Spraybar air
pressure, Pair, psig
Test section static
temperature, TS,ts, ºC
Test section
airspeed, Uts,
knots
D-Corner total
temperature, TT,davg,
ºC
Spraybar air
pressure, Pair, psig
–30 43 –29.8 0, 70 –5.6 43 –5.3 0, 70 –30 100 –28.7 0, 70 –5.6 109 –4.2 0, 70 –30 130 –27.8 0, 70 –5.6 130 –3.3 0, 70 –30 200 –24.5 0, 70 –5.6 200 –0.3 0, 70 –30 217 –23.8 0, 70 –5.6 217 0.7 0, 70 –30 304 –17.8 0, 70 0 43 0.2 0, 70
–17.8 43 –17.6 0, 70 0 100 1.3 0, 70 –17.8 100 –16.4 0, 70 0 130 2.2 0, 70 –17.8 130 –15.6 0, 70 –0.6 200 4.7 0, 70 –17.8 200 –12.5 0, 70 –1.7 217 4.6 0, 70 –17.8 217 –11.6 0, 70 –7.2 304 4.9 0, 70 –17.8 304 –5.6 0, 70 4.4 43 4.7 0, 70
3.3 100 4.7 0, 70
NASA/CR—2005-213875 11
00
01
02
03
04
05
06
07
08
0 50 100 150 200 250 300 350 400
Elapsed time, seconds
0
10
20
30
40
50
60
70
80
Spra
y ba
r air
pres
sure
, Pai
r, ps
ig
D-Corner temperature parameter
Test section temperatureparameterspray bar air pressure
01000 200 300 400
80
60
40
20
0
Spr
ay b
ar a
ir pr
essu
re, P
air,
psig
2
4
6
8
D-Corner temperature parameter
Test section temperature parameter
Spray bar air pressure
(b)
Elapsed time, t, seconds
0.00
0.01
0.02
0.03
0.04
0.05
0.06
0.07
0.08
0 50 100 150 200 250 300 350 400
Elapsed time, seconds
Tota
l tem
pera
ture
sta
ndar
d de
viat
ion
para
met
er
0
1
2
3
4
5
6
7
8To
tal t
empe
ratu
re s
tabi
lity
para
met
er, σ
t,ºC
0.02
0.04
0.06
0.08
1000 200 300 400
Elapsed time, t, seconds
0.00
8
6
4
2
0
(a)
Figure 11. Typical results of the total temperature stability studies. (a) Uts= 200 knots, TT,davg=0 ºC. (b) Uts=290 knots, TT,davg=0 ºC.
VI. Data Analysis Detailed discussion on the data analysis used for all aspects of the aero-thermal calibration are found in the
specific reports for each test (reference 7 for the 2000 calibration and a NASA CR for the 2004 and 2005 tests that will be published later in 2005). The following sections pertain only to the improvements in the total temperature measurements and address the measurement uncertainty, flow quality and calibration curves.
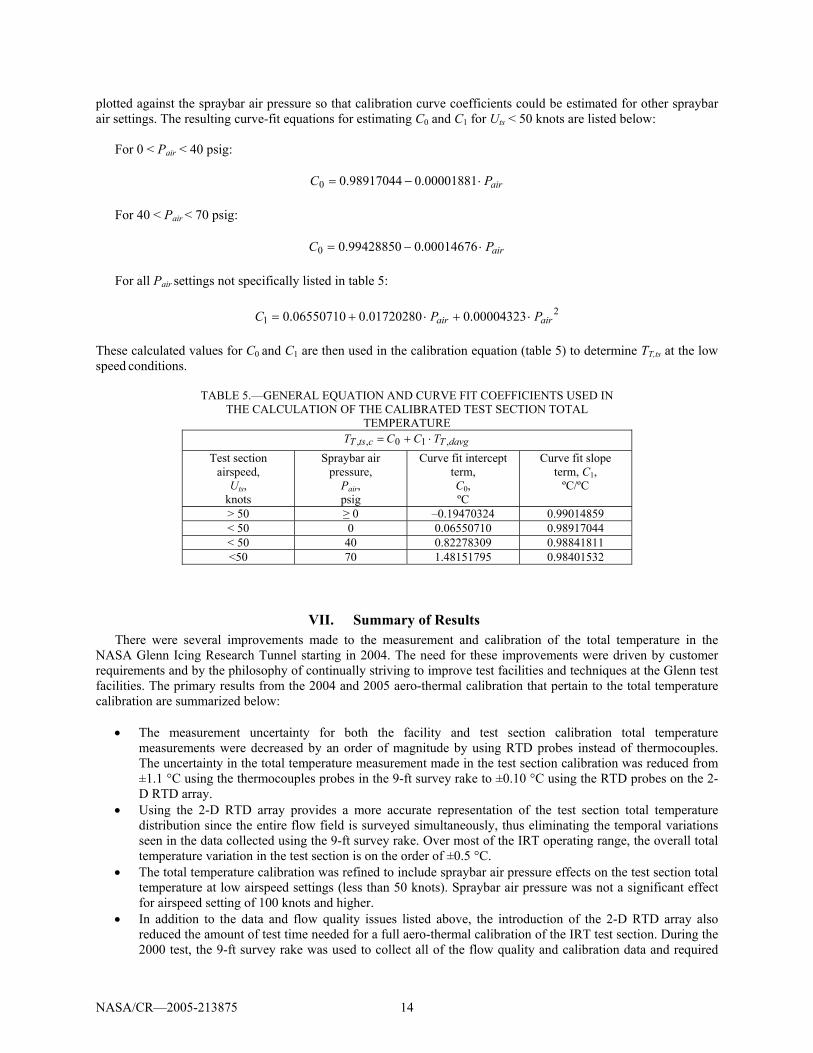
A. RTD Temperature Uncertainty The individual component uncertainties were reviewed for the RTD total temperature probe system. The
component uncertainties are given in table 4. The component uncertainties were combined using a root-sum-squared (RSS) technique to yield a system uncertainty of ±0.10 ºC for a probe that had been individually calibrated for flow recovery and ±0.16 ºC for a probe that had not been individually calibrated for flow recovery. The uncertainties associated with the RTD probes are over and order of magnitude improvement over the uncertainty estimate for the thermocouples on the 9-ft survey rake (±1.1 ºC or ±2 ºF) (refs. 4 and 6). The RSS computations are show below:
For probes that were tested for total temperature flow recovery:
C10.0)030.0040.0026.0006.0080.0030.0(RSS 222222 o±=+++++=
For probes using average flow recovery coefficients:
C16.0)123.0040.0026.0006.0080.0030.0(RSS 222222 o±=+++++=
TABLE 4.—RTD TOTAL TEMPERATURE PROBE SYSTEM COMPONENT UNCERTAINTIES Component Uncertainty,
ºC
Component Description
±0.030 RTD capsule, 0.01% DIN curve ±0.080 RTD temperature transmitter ±0.006 Resistor to convert transmitter 4 to 20mA output to DC volts (USF 240 250Ω 0.01% 2ppm/ºC) ±0.026 Escort data system analog to digital conversion error ±0.040 Flow recovery reference temperature measurement error (jet plenum reference) ±0.030 Flow recovery curve uncertainty (individual probe cal) ±0.123 Flow recovery curve uncertainty (probe not calibrated for flow recovery, average coefficients)

NASA/CR—2005-213875 12
B. Total Temperature Uniformity The spatial uniformity of a given
flow field parameter in a wind tunnel test section is important to know to aid in the evaluation and possible correction of test data. In an icing wind tunnel, the temperature distribution in the test section flow field is critical as it will affect the icing cloud characteristics. Testing conducted in 2000 and earlier used the 9-ft. survey rake which required several tunnel runs to completely survey the test section flow field by moving the rake through 11 vertical positions. It was discovered during the 2000 testing that this survey method artificially increased the apparent total temperature distribution in the test section. This was due in part to temporal differences between the D-Corner total temperature and the test section measurements (as illustrated in fig. 11) and the accuracy of the thermocouples used for both the D-Corner and test section measurements. The driver of the temporal differences is that control setting changes to the facility heat exchanger have a much larger and more immediate affect on the test section flow than in D-Corner, most likely due to the difference in volume and airspeed. As mentioned, following the 2000 test a recommendation was made to use a 2-D array of temperature probes to survey the test section in order to eliminate the spatial and temporal issues and this recommendation was implemented in 2004.
Figure 12 shows typical test section total temperature distribution data collected in 2000 and 2005. Note that only 8 of the 11 vertical rake positions are shown for the 2000 data; this was done to provide a more direct comparison with the corresponding probe positions in the 2005 data. The overall spread in the 2000 data is about 1.6 ºC (excluding the “hot spots” recorded near the test section floor and walls), while the spread in the 2005 data at similar airspeed and temperature settings is only 0.5 ºC. Between 2000 and 2005, there were no changes made to the IRT tunnel
0.9930.9940.9950.9960.9970.9980.9991.0001.0011.0021.0031.0041.0051.0061.0071.008
0 12 24 36 48 60 72 84 96 108Distance from inside wall, inches
TT,ts
(K)/T
T,dc
(K)
253.4253.6253.8254.0254.2254.4254.6254.8255.0255.2255.4255.6255.8256.0256.2256.4256.6256.8257.0257.2
Appr
oxim
ate
abso
lute
tem
pera
ture
, K
Z = 58 inches 52 46 40 34 28 22 10
Figure 12. Comparison of test section total temperature flow fielddistributions collected in 2000 using the 9-ft survey rake and in 2005 usingthe 2-D RTD array. (a) 2000 data: Uts = 133 knots, TT,davg = -18.0 ºC. (b)2005 data: Uts = 132 knots, TT,davg = -15.4 ºC.
App
roxi
mat
e ab
solu
te te
mpe
ratu
re, K
Tem
pera
ture
ratio
, TT,
ts/T
T,da
vg, K
/K
-16.6
-16.4
-16.2
-16.0
-15.8
-15.6
-15.4
-15.2
-15.0
-14.8
-14.6
0 12 24 36 48 60 72 84 96 108Distance from Inner wall, inches
Test
sec
tion
tota
l tem
pera
ture
, TT,
ts, C
Z = 63 inches 54 45 36 27 18 9 TT,dc
Distance from inside wall, inches
Tota
l tem
pera
ture
, TT,
ts, º
C
0 12 24 36 48 60 72 84 96 108
-15.0
-16.4
-16.2-16.0
-15.8
-15.6
-15.4
-15.2
-16.6
-14.8
-14.6
(a)
(b)
0.0
0.2
0.4
0.6
0.8
1.0
1.2
1.4
1.6
1.8
2.0
25 50 75 100 125 150 175 200 225 250 275 300 325
2000; TT,dc>4 C 2005; TTdc>1 C2000; -2<TT,dc<0 C 2005; -6<TT,dc<12000; -19<TT,dc<-17 C 2005; -17<TT,dc<-112000; TT,dc<-28 C 2005; TT,dc<-24
Test section airspeed, Uts, knots
Sta
ndar
d de
viat
ion
of te
st s
ectio
n to
tal t
empe
ratu
re, º
C
Figure 13. Comparison of standard deviation in test section total temperature distribution data between the 2000 (9-ft rake data) and 2005 (2-D RTD array data) tests.
2000; TT,davg > 4 ºC2000; -2 < TT,davg < 0 ºC2000; -19 < TT,davg < -17 ºC2000; TT,davg < -28 ºC
2005; TT,davg > 1 ºC2005; -6 < TT,davg < 1 ºC2005; -17 < TT,davg < -11 ºC2005; TT,davg < -24 ºC

NASA/CR—2005-213875 13
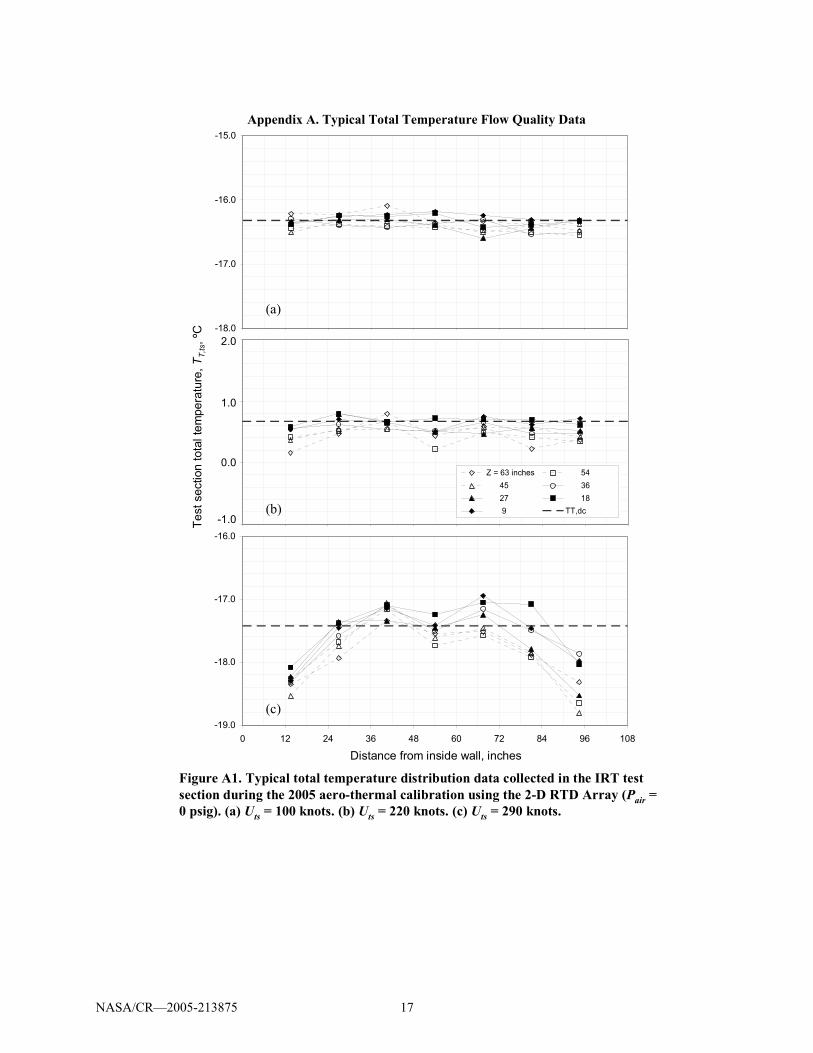
loop that would account for improvements of this magnitude in the total temperature distribution, therefore the spread in the 2000 data is attributed to the measurement technique (the replacement of the drive fan inlet guide vanes would not have this kind of effect on the test section total temperature distribution. The results shown in figure 12 are typical across the operating range of the IRT. Figure 13 compares the standard deviation of the test section total temperature distribution data for the 2000 and 2005 tests across the airspeed and temperature range of the tunnel with the spraybar air turned off (Pair = 0 psig). The data in figure 13 are binned by total temperature range and while the bins do not match exactly between the 2000 and 2005 data due to differences in the test matrices, they do provide a sufficient basis for comparison. For all the data represented, the standard deviation in the 2005 data is considerably smaller than the 2000 data, except for the very low speed and very low temperature setting, where there 2000 and 2005 data were about equal. The largest effect was seen in the high temperature range (above freezing) where the 2000 data showed standard deviations of greater than 1 ºC but the 2005 data showed that the actual standard deviation was less than 0.5 ºC. In the airspeed range of 100 to 250 knots, where much of the research testing is conducted, all of the conditions surveyed in 2005 showed standard deviations of less than 0.5 ºC; the total temperature standard deviation in this airspeed range was less then 0.2 ºC for temperature settings above -24 ºC. The true test section total temperature flow quality is represented by the 2005 test data in figures 12 and 13. The 2004 and 2005 data sets can be used to address any questions concerning the test section flow quality following 2000 facility modifications that included the installation of flat heat exchangers and new D- and C- corner turning vanes (ref. 7). The facility modifications had a significant positive impact on the overall test section flow quality, but the full extent of the improvements were not recognized due to limitations of using the 9-ft survey rake to document the total temperature distributions in the test section. The data collected with the 2-D RTD array in 2004 and 2005 shows complete impact of the facility modifications. Additional examples form the 2005 are provided in appendix A. Full documentation of the flow quality data will be presented in a NASA Contractor Report.
C. Total Temperature Calibration The total temperature calibration relationship is one of a set of three calibrations used to fully define the aero-
thermal operating conditions in the IRT test section (the other two calibration relationships are static pressure and Mach number). The total temperature calibration simple relates the test section total temperature measured by the 2-D RTD (average of 49 measurements) array to the total temperature measured in D-Corner (average of 24 measurements). Previous to 2005, a single curve-fit was used to represent the total temperature calibration across the operating range of the IRT. This single curve-fit did not include data collected at low speed with the spray bar air turned on due to the amount of scatter in these data relative to the data collected at higher airspeeds.
The current total temperature calibration relationship was created using the 2005 data. Due to the improved measurement accuracy and because of increased interest in low speed test conditions, some analysis was done to determine if a family of calibration curves was needed for the total temperature to account for airspeed and spraybar air pressure effects. The final conclusion was that there is a break-point between 50 and 100 knots where at above this point, spraybar air pressure no longer has a significant effect on the total temperature calibration. The result was to create a set of four calibration curves, one for airspeeds greater than 50 knots and three for airspeed less than 50 knots based on the spraybar air pressure setting (0, 40 or 70 psig). The resulting total temperature calibration curves are shown in figure 14. Table 5 provides the details for the calculation of the calibrated test section total temperature from the measured D-Corner total temperature. In order to provide some degree of vernier on the spraybar air pressure at the low speed conditions, the slope and intercept from each of the low speed calibration curve-fits were
-30
-25
-20
-15
-10
-5
0
5
-30 -25 -20 -15 -10 -5 0 5
V>50 knots; all P settingsV<50 knots; P=0 psigV<50 knots; P=40 psigV<50 knots; P=70 psigLinear (V>50 knots; all P settings)Linear (V<50 knots; P=0 psig)Linear (V<50 knots; P=70 psig)Linear (V<50 knots; P=40 psig)
D-Corner total temperature, TT,davg, ºC
Test
sec
tion
tota
l tem
pera
ture
, TT,
ts, º
C
Figure 14. Total temperature calibration curves for the IRT.
Uts > 50 knots; all Pair settingsUts < 50 knots; Pair = 0 psig Uts < 50 knots; Pair = 40 psig Uts < 50 knots; Pair = 70 psig
(Uts > 50 knots; all Pair settings)(Uts < 50 knots; Pair = 0 psig) (Uts < 50 knots; Pair = 40 psig) (Uts < 50 knots; Pair = 70 psig)
NASA/CR—2005-213875 14
plotted against the spraybar air pressure so that calibration curve coefficients could be estimated for other spraybar air settings. The resulting curve-fit equations for estimating C0 and C1 for Uts < 50 knots are listed below:
For 0 < Pair < 40 psig:
airPC ⋅−= 00001881.098917044.00 For 40 < Pair < 70 psig:
airPC ⋅−= 00014676.099428850.00
For all Pair settings not specifically listed in table 5:
2
1 00004323.001720280.006550710.0 airair PPC ⋅+⋅+=
These calculated values for C0 and C1 are then used in the calibration equation (table 5) to determine TT,ts at the low speed conditions.
TABLE 5.—GENERAL EQUATION AND CURVE FIT COEFFICIENTS USED IN THE CALCULATION OF THE CALIBRATED TEST SECTION TOTAL
TEMPERATURE davgTctsT TCCT ,10,, ⋅+=
Test section airspeed,
Uts, knots
Spraybar air pressure,
Pair, psig
Curve fit intercept term, C0, ºC
Curve fit slope term, C1,
ºC/ºC
> 50 ≥ 0 –0.19470324 0.99014859 < 50 0 0.06550710 0.98917044 < 50 40 0.82278309 0.98841811 <50 70 1.48151795 0.98401532
VII. Summary of Results There were several improvements made to the measurement and calibration of the total temperature in the NASA Glenn Icing Research Tunnel starting in 2004. The need for these improvements were driven by customer requirements and by the philosophy of continually striving to improve test facilities and techniques at the Glenn test facilities. The primary results from the 2004 and 2005 aero-thermal calibration that pertain to the total temperature calibration are summarized below:
• The measurement uncertainty for both the facility and test section calibration total temperature measurements were decreased by an order of magnitude by using RTD probes instead of thermocouples. The uncertainty in the total temperature measurement made in the test section calibration was reduced from ±1.1 °C using the thermocouples probes in the 9-ft survey rake to ±0.10 °C using the RTD probes on the 2-D RTD array.
• Using the 2-D RTD array provides a more accurate representation of the test section total temperature distribution since the entire flow field is surveyed simultaneously, thus eliminating the temporal variations seen in the data collected using the 9-ft survey rake. Over most of the IRT operating range, the overall total temperature variation in the test section is on the order of ±0.5 °C.
• The total temperature calibration was refined to include spraybar air pressure effects on the test section total temperature at low airspeed settings (less than 50 knots). Spraybar air pressure was not a significant effect for airspeed setting of 100 knots and higher.
• In addition to the data and flow quality issues listed above, the introduction of the 2-D RTD array also reduced the amount of test time needed for a full aero-thermal calibration of the IRT test section. During the 2000 test, the 9-ft survey rake was used to collect all of the flow quality and calibration data and required

NASA/CR—2005-213875 15
67.5 hours of test time over 8 days. In 2004, the 9-ft survey rake was used to collect only pressure data and the 2-D RTD array was used to collect all temperature data; the combined test time was 25.25 hours over 4 days.
VIII. Recommendations The following recommendations are presented as means to provide additional improvements to the temperature
calibration of the NASA Glenn Icing Research Tunnel: • One of the drivers for the improvements listed in this paper was input from the IRT customers as to changes
to their test requirement needs. It is vital that input from the IRT test customers is solicited and integrated into the test section calibration requirements. Insuring that test customer requirements are achieved is a critical issue in developing a successful wind tunnel calibration program (ref. 8).
• The data collected in 2004 and 2005 showed that spraybar air injected into the airstream has a very noticeable effect on the test section operating conditions as the very low speed settings (less than 50 knots). Additional testing is needed to determine (1) the test section airspeed at which spraybar air pressure no longer has a significant effect and (2) the minimum spraybar air pressure that causes a noticeable effect at the low speed settings.
References 1. Leary, William M., “We Freeze to Please: A History of NASA’s Icing Research Tunnel and the Quest for Flight
Safety,” NASA/SP—2002–4226, 2002. 2. Irvine, T.B., Kevdzija, S.L., Sheldon, D.W. and Spera, D.A., “Overview of the Icing and Flow Quality
Improvements Program for the NASA Glenn Icing Research Tunnel,” AIAA–2001–0229, 2001. 3. Soeder, R.H., Sheldon, D.W., Ide, R.F., Spera, D.A. and Andracchio, C.R., “NASA Glenn Icing Research
Tunnel User Manual,” NASA/TM—2003-212004, 2003. 4. Gonsalez, J.C., and Arrington, E.A., “Aerodynamic Calibration of the NASA Lewis Icing research Tunnel
(1997 Tests),” NASA/CR—2001-210809, AIAA–98–0633, 2001. 5. “Calibration and Acceptance of Icing Wind Tunnels,” SAE Standards ARP5902, 2003. 6. Gonsalez, J.C., Arrington, E. A., “Five-Hole Flow Angle Probe Calibration for the NASA Glenn Icing Research
Tunnel,” NASA/CR—1999-202330, AIAA–96–2201, 1999. 7. Gonsalez, J.C., Arrington, E.A., and Curry III, M.R., “Aero-Thermal Calibration of the NASA Glenn Icing
Research Tunnel (2000 Tests),” NASA/CR—2001-210685, AIAA–2001–0233, 2001. 8. “Calibration of Subsonic and Transonic Wind Tunnels,” AIAA Recommended Practice R-093-2003, 2003.

NASA/CR—2005-213875 17
Appendix A. Typical Total Temperature Flow Quality Data
-18.0
-17.0
-16.0
-15.0
0 12 24 36 48 60 72 84 96 108
-1.0
0.0
1.0
2.0
0 12 24 36 48 60 72 84 96 108
Z = 63 inches 54 45 36 27 18 9 TT,dc
-19.0
-18.0
-17.0
-16.0
0 12 24 36 48 60 72 84 96 108
0.0
1.0
2.0
-1.0
Distance from inside wall, inches
Test
sec
tion
tota
l tem
pera
ture
, TT,
ts, º
C
(a)
(b)
(c)
Figure A1. Typical total temperature distribution data collected in the IRT test section during the 2005 aero-thermal calibration using the 2-D RTD Array (Pair = 0 psig). (a) Uts = 100 knots. (b) Uts = 220 knots. (c) Uts = 290 knots.

This publication is available from the NASA Center for AeroSpace Information, 301–621–0390.
REPORT DOCUMENTATION PAGE
2. REPORT DATE
19. SECURITY CLASSIFICATION OF ABSTRACT
18. SECURITY CLASSIFICATION OF THIS PAGE
Public reporting burden for this collection of information is estimated to average 1 hour per response, including the time for reviewing instructions, searching existing data sources,gathering and maintaining the data needed, and completing and reviewing the collection of information. Send comments regarding this burden estimate or any other aspect of thiscollection of information, including suggestions for reducing this burden, to Washington Headquarters Services, Directorate for Information Operations and Reports, 1215 JeffersonDavis Highway, Suite 1204, Arlington, VA 22202-4302, and to the Office of Management and Budget, Paperwork Reduction Project (0704-0188), Washington, DC 20503.
NSN 7540-01-280-5500 Standard Form 298 (Rev. 2-89)Prescribed by ANSI Std. Z39-18298-102
Form ApprovedOMB No. 0704-0188
12b. DISTRIBUTION CODE
8. PERFORMING ORGANIZATION REPORT NUMBER
5. FUNDING NUMBERS
3. REPORT TYPE AND DATES COVERED
4. TITLE AND SUBTITLE
6. AUTHOR(S)
7. PERFORMING ORGANIZATION NAME(S) AND ADDRESS(ES)
11. SUPPLEMENTARY NOTES
12a. DISTRIBUTION/AVAILABILITY STATEMENT
13. ABSTRACT (Maximum 200 words)
14. SUBJECT TERMS
17. SECURITY CLASSIFICATION OF REPORT
16. PRICE CODE
15. NUMBER OF PAGES
20. LIMITATION OF ABSTRACT
Unclassified Unclassified
Final Contractor Report
Unclassified
1. AGENCY USE ONLY (Leave blank)
10. SPONSORING/MONITORING AGENCY REPORT NUMBER
9. SPONSORING/MONITORING AGENCY NAME(S) AND ADDRESS(ES)
National Aeronautics and Space AdministrationWashington, DC 20546–0001
Available electronically at http://gltrs.grc.nasa.gov
August 2005
NASA CR—2005-213875AIAA–2005–4276
E–15246
WBS–22–077–41–14NAS3–00145
23
Improvements to the Total Temperature Calibration of the NASA GlennIcing Research Tunnel
E. Allen Arrington and Jose C. Gonsalez
Wind tunnel; Calibration; Temperature; Icing; Flow quality; Subsonic
Unclassified -UnlimitedSubject Category: 09
QSS Group, Inc.21000 Brookpark RoadCleveland, Ohio 44135
Prepared for the 41st Joint Propulsion Conference and Exhibit cosponsored by the AIAA, ASME, SAE, and ASEE,Tucson, Arizona, July 10–13, 2005. Project Manager, Robert Freedman, Research Testing Division, NASA GlennResearch Center, organization code DRA, 216–433–2038.
The ability to accurately set repeatable total temperature conditions is critical for collecting quality icing condition data,particularly near freezing conditions. As part of efforts to continually improve data quality in the NASA Glenn IcingResearch Tunnel (IRT), new facility instrumentation and new calibration hardware for total temperature measurementwere installed and new operational techniques were developed and implemented. This paper focuses on theimprovements made in the calibration of total temperature in the IRT.