Improvements to the Calibration of Electronic Distance ... · PDF fileImprovements to the...
84
Page | University of Southern Queensland Faculty of Engineering and Surveying Improvements to the Calibration of Electronic Distance Measurement Equipment (EDME) A Dissertation Submitted by Mr Rhys Daniel Wayne Pescod In Fulfilment of the requirement of Course ENG4111 and ENG 4112 Research Project Towards the degree of Bachelor of Spatial Science (Surveying) Submitted: 28 th October, 2015
-
Upload
truongnguyet -
Category
Documents
-
view
219 -
download
0
Transcript of Improvements to the Calibration of Electronic Distance ... · PDF fileImprovements to the...

P a g e |
University of Southern Queensland
Faculty of Engineering and Surveying
Improvements to the Calibration of Electronic
Distance Measurement Equipment (EDME)
A Dissertation Submitted by
Mr Rhys Daniel Wayne Pescod
In Fulfilment of the requirement of
Course ENG4111 and ENG 4112 Research Project
Towards the degree of
Bachelor of Spatial Science (Surveying)
Submitted: 28th October, 2015
P a g e | I
ABSTRACT
As Electronic Distance Measurement Equipment (EDME) technology significantly
advances, so too must the way instruments are calibrated. Valuable time and
resources are committed to ensuring EDME is calibrated to ensure national standards
are met. As such, it is vital that the methods employed for calibration are the most
appropriate for the instruments used.
In order to assist the profession in this regard, this paper investigates the current
EDME calibration baseline designs used in Queensland and analyses the suitability
of each in order to devise an alternative baseline design. The methodology used was
to identify key characteristics of an existing baseline design and select the most
accurate of those to construct a new design. This process was then applied over
multiple designs and the results analysed and compared to determine the viability of
the alternative design.

P a g e | II
University of Southern Queensland
Faculty of Health, Engineering and Sciences
ENG4111/ENG4112 Research Project
Limitations of Use
The Council of the University of Southern Queensland, its Faculty of Health,
Engineering & Sciences, and the staff of the University of Southern Queensland, do
not accept any responsibility for the truth, accuracy or completeness of material
contained within or associated with this dissertation.
Persons using all or any part of this material do so at their own risk, and not at the
risk of the Council of the University of Southern Queensland, its Faculty of Health,
Engineering & Sciences or the staff of the University of Southern Queensland.
This dissertation reports an educational exercise and has no purpose or validity
beyond this exercise. The sole purpose of the course pair entitled “Research Project”
is to contribute to the overall education within the student’s chosen degree program.
This document, the associated hardware, software, drawings, and other material set
out in the associated appendices should not be used for any other purpose: if they are
so used, it is entirely at the risk of the user.

P a g e | III
University of Southern Queensland
Faculty of Health, Engineering and Sciences
ENG4111/ENG4112 Research Project
Certification of Dissertation
I certify that the ideas, designs and experimental work, results, analyses and
conclusions set out in this dissertation are entirely my own effort, except where
otherwise indicated and acknowledged.
I further certify that the work is original and has not been previously submitted for
assessment in any other course or institution, except where specifically stated.
Rhys Daniel Wayne Pescod
U1006119

P a g e | IV
Acknowledgements:
This research project was carried out under the guidance and supervision of Mr
Gregory Williams, Cadastral Surveyor of Moreton Bay Regional Council.
I would like to thank Dr Glenn Campbell who has supervised the completion of this
research project. This project would not have been achieved without his guidance
and support.
I wish to specifically thank Colin Moorhead who provided the required software for
this project and assisted my understanding of its application. Further thanks to Isaac
Stiller of DNRM who has provided valuable advice throughout this research project.
Finally, I would also like to thank my wife Shannon for her ongoing and unwavering
support and understanding throughout this research project, without whom I would
not have been able to achieve a completed project.
Table of Contents
ABSTRACT ................................................................................................................................................. I
Limitations of Use ................................................................................................................................... II
Certification of Dissertation ................................................................................................................... III
Acknowledgements:............................................................................................................................... IV
LIST OF FIGURES ................................................................................................................................ V
LIST OF TABLES ................................................................................................................................. VI
CHAPTER 1 - Introduction .................................................................................................................... 1
1.1 Project Topic Description ........................................................................................................ 1
1.2 Project aim and Objectives ..................................................................................................... 1
1.3 Project Background ................................................................................................................. 2
1.4 Conclusion ..................................................................................................................................... 4
CHAPTER 2 - Literature Review ........................................................................................................... 5
2.1 Introduction .................................................................................................................................. 5
2.2 History of EDME ............................................................................................................................ 5
2.3 Principles of EDME ........................................................................................................................ 6
2.3 Legal traceability ........................................................................................................................... 7
2.4 Calibration of EDME ...................................................................................................................... 8
2.4.1 Constant Error ................................................................................................................................ 9
2.4.2 Scale Error .................................................................................................................................. 9
2.4.3 Cyclic Error ............................................................................................................................... 10
2.5 Methods of Calibration ............................................................................................................... 11
2.5.1 HEERBRUGG/SCHWENDENER. ................................................................................................. 12
2.5.2 AARAU DESIGN ......................................................................................................................... 13
2.5.3 HOBART/SPRENT ZWART ......................................................................................................... 13
2.5.4 BASELINE DESIGN IN AUSTRALIA ............................................................................................. 13
2.6 Alternative Calibration Methods ................................................................................................ 14
2.6.1 GNSS Calibration ...................................................................................................................... 15
2.6.2 Compact Laboratory Calibration .............................................................................................. 15

CHAPTER 3: Methodology .................................................................................................................. 16
3.1 Introduction to Project Methodology ......................................................................................... 16
3.2 Caboolture EDM Baseline ........................................................................................................... 17
3.3 Alternative Baseline Designs ....................................................................................................... 19
3.4 Observations ............................................................................................................................... 20
3.4.1 Instruments .............................................................................................................................. 20
3.4.2 Observation Sequences ........................................................................................................... 21
3.5 Reduction .................................................................................................................................... 23
3.6 Legal Traceability ........................................................................................................................ 24
Chapter 4: Analysis of Data and Results .............................................................................................. 25
4.1 Introduction ................................................................................................................................ 25
4.2 Baseline Design combinations .................................................................................................... 25
4.3 Reduction and Results................................................................................................................. 27
4.4 Adjustments to 5 Pillar Design. ................................................................................................... 33
Chapter 5 – Discussion and Conclusions .............................................................................................. 36
5.1 Introduction ................................................................................................................................ 36
Chapter 6 – Future Work ...................................................................................................................... 38
Bibliography ......................................................................................................................................... 39
List of Appendices ................................................................................................................................. 42

P a g e | V
LIST OF FIGURES
Figure 1.1 – EDME sinusoidal wavelengths: (n λ + p)
Figure 3.1 – Aerial Photograph of Caboolture EDM Baseline
Figure 3.2 – Distance modulo of Unit Length of the Caboolture range (10m)
Figure 3.3 – Forward Run Sequence Pattern
Figure 3.4 – Distance modulo of Unit Length of the Caboolture range (1m)
Figure 3.5 – Forward Run Sequence Pattern
Figure 4.1 – Index Constant Uncertainty (95%)
Figure 4.2 – Scale Factor Uncertainty (95%)
P a g e | VI
LIST OF TABLES
Table 1.1 – Qld EDME Calibration Baselines (DNRM)
Table 4.1 – 4 Pillar Combinations
Table 4.2 – 5 Pillar Combinations
Table 4.3 – 6 Pillar Combinations
Table 4.4 – Results of the Topcon ES 103
Table 4.5– Results of the Nikon NPR-362
Table 4.6 – Results of the Leica TS-15
Table 4.7 – Comparison between old and new 5 pillar designs.
Table 4.8 – Topcon comparisons between old and new 5 pillar designs.
Table 4.9 – Nikon comparisons between old and new 5 pillar designs.
Table 4.10 – Leica comparisons between old and new 5 pillar designs.

P a g e | 1
CHAPTER 1 - Introduction
1.1 Project Topic Description
The reliability and accuracy of Electronic Distance Measurement Equipment
(EDME), like any equipment, is critical. To ascertain this, EDME is calibrated on
government maintained baselines. The calibration process identifies any existing
errors of the instrument so that adjustments may be made to account for those errors.
The design of a calibration baseline is largely determined by the need to eliminate
specific types of error.
This project dissertation will investigate the different EDME calibration designs and
particularly focus on the current design format used in Queensland and the errors
they address. It is theorised that an alternate calibration baseline design is possible as
technological advances in EDME means that some types of errors (particularly
‘cyclic error’) may no longer be as prominent in modern day instruments, and
therefore there may be scope to redesign the current baseline used in Queensland.
The possibility of an alternative legally traceable calibration baseline will therefore
be explored.
1.2 Project aim and Objectives
The aim of this project is to investigate the current baseline designs used for the
calibration of EDME, undertake an analysis of these current designs and research
alternative methods that have been previously proposed and offer a fresh alternative
EDME baseline design.

P a g e | 2
The objective of an alternative EDME calibration baseline design is to ensure that
the types of errors that current calibration baselines address are still relevant and
required to be corrected when using modern day instruments. The alternative design
will focus on the fact that cyclic error may not need to be considered in the design
due to advances in technology. In this respect, a more efficient calibration baseline,
both economically and physically, is possible.
1.3 Project Background
The Department of Natural Resource and Mines (DNRM) is the authority appointed
for the verification of (and re-verification) of “length”. In order to perform their
obligations as a verifying authority, DNRM provide and maintain EDME Baselines
throughout the state of Queensland for the purpose of calibrating surveying
equipment.
There are currently 16 certified EDME Baselines in Queensland. Table 1.1 identifies
the length and locations of each baseline.

P a g e | 3
Location Length Location Length
Aloomba: Along railway
line.
730m Maroochy: Within airport
grounds
1004m
Bundaberg: Within airport
grounds.
1021m Maryborough 1021m
Caboolture: Along
railway line.
1148m Mica Creek 1021m
Cooktown: Within airport
grounds.
1021m Toowoomba 1011
Gold Coast: Within
sewage treatment plant.
1051m Townsville
(1)969m
(2)975m
Goonyella 1029m Tungamull 870m
Leyburn: Within scientific
reserve
1082m Walkamin: Within scientific
reserve.
1083m
Mackay 880m
Table 1.1: Qld EDME Calibration Baselines (DNRM)
Perusal of the Regulation 13 Certificates of each baseline reveals that all Queensland
calibration baselines consist of seven pillars and span, on average, approximately
one kilometre of unobscured land. As demonstrated in Table 1, baselines are often
situated in an area with restricted access, such as within airports or along railway
lines. These places provide an open, unobscured area large enough to accommodate
the seven pillar method.
In addition to modern instruments potentially outgrowing current calibration
methods, there are two further issues with the current baselines:
1. There are a limited number of certified baselines, affecting availability and
accessibility for surveyors.
2. There are difficulties in finding suitable land given the distance required for
seven pillar baselines especially in high populated areas.

P a g e | 4
1.4 Conclusion
The need to undertake this dissertation derives from the lack of suitable EDME
baselines in highly populated areas such as Brisbane. In addition to the lack of
EDME baselines, there is a need to investigate whether the current 7 pillar design is
now required to calibrate modern day instruments. This hasn’t yet been investigated
to ascertain if the current baselines are changing and adapting with advances in
technology, particularly with the reference to Cyclic error.
This project will aim to provide an alternative calibration baseline design. The
alternative baseline design aims to be more efficient in the calibration process whilst
ensuring legal traceability of the EDME. Further, the alternative baseline seeks to
achieve greater economy in maintenance and installation of new baselines as well as
being more versatile to allow the new baselines to be installed in more suitable
locations.

P a g e | 5
CHAPTER 2 - Literature Review
2.1 Introduction
This chapter will provide the intellectual and historical basis for the alternative
baseline design by conducting a review of the literature relevant to the calibration of
EDME.
There is a substantial amount of literature in regards to baseline designs. However,
very little material specifically investigates the advancements in technology in
modern EDME and the way in which this affects the calibration process. Research
has indicated that the relationship between the two is yet to be explored.
The aim of this chapter is to utilise and review the available literature. The primary
resources for this project were formally published, peer reviewed sources,
supplemented by anecdotal evidence of industry professionals.
2.2 History of EDME
A number of different surveying instruments have been used over time to measure
distance. By the 1980’s distances were predominantly measured electronically.
Early EDME, such as a Geodimeter, utilised light waves and were only able to
measure long distances at night (Rueger, 1980). Next came instruments that used
radio waves, such as the Tellurometer. The 1960’s saw a shift to Infrared light
sources in instruments. Modern instruments are total stations, utilising a coaxial,
visible red laser and are based on the principle of phase measurement.

P a g e | 6
2.3 Principles of EDME
The electronic measuring of a distance involves the emission of a signal from the
instrument to a reflector which returns the signal to the instrument. The electronic
signal has a sinusoidal wave form. The outgoing and incoming wavelengths are
compared and, rather than measuring the travel time of the signal, the signal
structure is measured to determine the phase lag (Rueger, 1980).
As it is emitted by the EDME at a specified frequency, the wavelength (λ) is a
known quantity. The signal leaves the EDME at 0o phase and completes a certain
amount (n) of full phases on its way to and from the reflector. The signal then returns
to the EDME at an angle that is between 0o and 360o creating a partial wavelength
(p). Therefore, the total distance is (n λ + p), as demonstrated in Figure 1.1.
Figure 1.1: EDME sinusoidal wavelengths: (n λ + p)
Modern EDME instruments are based on this principle regardless of light waves,
infrared waves or microwaves as carrier waves.

P a g e | 7
2.3 Legal traceability
Legal traceability is the linking of the distance measurement to the definition
contained in the relevant legislation. If a distance, or length, is proven traceable to
the national standard, the validity of the measurement will be strengthened should it
be scrutinised by a court of law.
Firstly, Regulation 73 of the National Measurement Regulations 1999 (Cth) provides
that an authority is to be appointed for the verification and re-verification of length
and the certification of measuring instruments. DNRM is the verifying authority of
Queensland and is therefore charged with providing legal traceability of length for
surveying EDME. To achieve this, DNRM maintain the EDME baselines throughout
Queensland.
Further, surveyors have a legal obligation to ensure that their equipment is
standardised. Section 20 Survey and Mapping Infrastructure Regulation 201 (Qld)
provides that a cadastral surveyor who carries out, or is responsible for carrying out,
a cadastral survey must ensure any survey equipment used for the survey is:
a) Standardised; and
b) Capable of achieving the accuracy stated in the relevant survey standard for
cadastral surveys.
This statutory provision of instrument verification/standardisation establishes
traceability of the instruments measurements to the national standard.
Equipment is standardised (and therefore legally traceable) if:
1. The measurements are made by an appropriate EDME instrument that has
been tested according to the recommended procedure on an EDME Baseline;

P a g e | 8
2. At the time of testing, the EDME baseline held a valid and current Regulation
13 Certificate issued by DNRM (under the National Measurement Act 1960
(Cth);
3. That baseline was calibrated according to approved procedures and using the
designated EDME baseline calibration instrument;
4. The calibration instrument and supporting instruments hold a valid and
current calibration certificate.
The Intergovernmental Committee on Surveying and Mapping – Special Publication
1 (SP1) provides that EDME be calibrated once per year. Additionally, they should
be calibrated after each repair or maintenance. DNRM are soon to release the
updated Cadastral Survey Requirements (Version 7) which will mirror the provisions
of SP1.
To ensure legal traceability occurs as provided above, the Legal Traceability of
Length for EDME (LTOLE) (DNRM, 2012) defines DNRM’s recommended
procedure for carrying out EDME comparison.
2.4 Calibration of EDME
EDM instruments inherently contain errors. To determine the error of an instrument
it must be calibrated over a known distance. Calibration is the process of comparing
a measured value to a known value, e.g. by comparison to a standard of the physical
quantity length (Janssen and Watson, 2014). The calibration process will identify the
nature and extent of the errors of an instrument.
The three primary sources of error that are determined by calibration are: zero
constant error, scale error and cyclic error (Rueger 1980). Emenike (1982) also
identified constant, scale and cyclic errors as the most ‘serious’ of error groups in
EDME instruments and states that they should be eliminated. The two that remain

P a g e | 9
accepted as sources of error are the zero constant error and scale error. As
technology has advanced it has been suggested that cyclic error is now an
insignificant consideration (Ellis, 2013). However, cyclic error remains relevant to
any discussion regarding EDME calibration as it remains vital to legal traceability.
2.4.1 Constant Error
Also known as the zero or index error, the constant error is an algebraic constant to
be applied directly to every measurement. It is caused by three factors:
1. Electrical delays, geometric detours and eccentricities in the EDM
instrument.
2. Differences between the electronic and mechanical centres of the EDM
instrument.
3. Differences between the optical and mechanical centres of the reflector.
The zero error arises from the distance measuring points of the EDM instrument and
of the reflector not being coincident with the vertical axes at either end of the
measured line. This error may vary with a change of reflector, after receiving
impacts, with different instrument mountings and after service (Janssen, 2015).
2.4.2 Scale Error
The scale error is linearly proportional to the length of the measured line. It is caused
by:
1. Variations in the modulation frequency of the EDM instrument. This may be
due to ageing or drift of the frequency oscillator used or to temperature
effects on the oscillator;

P a g e | 10
2. Errors in the measured temperature, atmospheric pressure and humidity,
which affect the velocity of the signal propagation;
3. Non-homogeneous emission/reception patterns from the emitting and
receiving diodes (phase inhomogeneities).
4. Errors in the collection and use of atmospheric data. This includes the use of
uncalibrated thermometers/barometers, not taking atmospheric measurements
in the shade and the incorrect entry of the atmospheric correction into the
EDM (Ellis, 2013).
The scale factor will generally vary for subsequent calibrations within the accuracy
specification of the instrument because it is dependent on the instrument’s
modulation frequency, which may change with variations in the ambient
temperature. To a lesser extent, the scale factor can also change as a result of
frequency drift and ageing of the frequency oscillator. Consequently, if the scale
factor falls within the instrument’s specification, it should not be applied as a
correction to measured field distances.
If the scale factor falls outside the instrument’s specification, the instrument should
be returned to the manufacturer for service. However, it is advisable to repeat the
calibration under different climatic conditions both to confirm the result and to
observe if the scale factor changes with different ambient temperatures. The
thermometers and barometers used in the calibration should also be re-calibrated
against a certified standard as an error in temperature and pressure readings will
contribute to the scale error of measured distance (Janssen 2015).
2.4.3 Cyclic Error
The precision of an EDM instrument depends largely on the precision of the internal
phase measurement. Phase measurement error can occur due to unwanted feed
(electrical and optical interference) through the transmitted signal onto the received

P a g e | 11
signal (Khalil 2005). Bannister et al. (1998) describes the cyclic error as a function
of the actual phase difference measured by the EDM instrument.
It varies across the modulated wavelength and is generally sinusoidal with a
wavelength equal to the unit length of the EDM device (Couchman 1974). The unit
length is the scale on which the EDM instrument measures the distance and is
derived from the fine measuring frequency. The unit length is equal to exactly one
half of the EDM instruments modulation wavelength (Rüeger, 1996).
As the cyclic error repeats itself for every unit length contained within a measured
distance, its sign and magnitude vary depending on the length measured. Cyclic error
is known to increase in magnitude as the instrument’s components age (Janssen,
2015).
Ollis (2007) identified that early EDME instruments generally contained a cyclic
error of approximately 5 – 10 mm, while modern EDME instruments have a much
smaller cyclic error in the range of 1 – 2 mm. This small cyclic error has been
labelled ‘negligible’ (Janssen 2015) and has been said to have an insignificant effect
(DNRM, 2012). Consequently, LTOLE states cyclic error is not required to be
determined in calibration (DNRM, 2012).
2.5 Methods of Calibration
EDME is calibrated by measuring a combination of distances on a baseline. A key
feature of an EDME baseline is to enable the determination of all instrument errors
to an appropriate level of precision (DTPLI, 2014). Ruger (1989 “Baseline Design
Parameters”) identifies three key calibration Baseline Designs. These are the
‘Heerbrugg’, ‘AARAU’ and ‘Sprent/Zwart’ designs.

P a g e | 12
The difference between these designs lies in the associated methodology used to
determine cyclic error, and the observation procedures applicable to each one. Put
simply, short distance calibrations aid in determining the zero constant error. Long
distances assist in determining scale error. A design objective is to ensure that these
are determined without any cyclic error contributions.
2.5.1 HEERBRUGG/SCHWENDENER.
The Schwendener baseline design features an almost equal distribution of the
distances measured in all combinations over the baseline length as well as over the
unit length of the distance metre. This design is said to permit the detection of all
distance-dependent errors, including cyclic errors (Schwendener, 1972; Rüeger,
1996.) The original design consisted of seven stations, providing 21 observations in
all combinations and it happened to be a total length of 1021.5 metres. It is based on
a unit length of ten metres.
The Schwendener design is based on four input parameters:
U = unit length of distance metre(s) to be tested
A = shortest distance on baseline (multiple of U)
Co = desired total length of baseline
n = number of baseline stations.
A larger number of baseline stations (or pillars) will result in an increased number of
observations (over various combinations of distances), translating into a higher
precision of the resulting zero constant.
P a g e | 13
2.5.2 AARAU DESIGN
As explained by Rueger (1989) the AARAU baseline design features baseline
sections which are exact multiples of the unit length. Assuming that the amplitudes
and phases of the cyclic errors do not change over the length of the baseline the
cyclic errors will affect each combination measured on the baseline by an equal
amount. Any cyclic errors will therefore map into the zero constant error which is
derived from the baseline measurements (Rueger, 1989). Cyclic errors must be
determined separately on special cyclic error test lines and the bias of the zero
constant error removed.
2.5.3 HOBART/SPRENT ZWART
Proposed by Sprent & Zwart (1978), the Hobart design has stations spaced at equal
intervals over the entire baseline range. It is not based on the measurement of all
combinations of distances like the Heerbrugg and AARAU designs. It requires that
all true baseline distances be known at all times.
The additive constant and scale error are able to be determined independent of cyclic
error on Sprent/Zwart baselines because their design has the effect of cancelling out
cyclic error (DTPLI, 2104). If pairs of measurements are taken from pillars separated
by half the unit length of the EDM, the cyclic error affecting each pair will be equal
in magnitude and opposite in sign. An analysis, which treats the measurements as
pairs, can eliminate the effect of cyclic error.
2.5.4 BASELINE DESIGN IN AUSTRALIA
Queensland EDME calibration baselines conform to current best practice in that they
are all Schwendener design (1972) and consist of seven pillars (as noted on the
Regulation 13 Certificate of each baseline).

P a g e | 14
New South Wales EDME baselines also follow the Schwendener/Heerbrugg model,
however have significantly fewer pillars. Many New South Wales baselines consist
of only 4 pillars (Janssen 2015; Ellis 2013). It was recommended (Rueger 1992) that
4 pillar baselines be upgraded to 5 or 6 pillars. This will increase redundancies which
will allow for more accurate EDME calibration. As such, New South Wales is
seeking to align their EDME baselines with best practice principles and upgrade the
EDM infrastructure (Ellis 2013).
Victorian EDME baselines consist of Sprent/Zwart (Hobart) baseline design,
Schwendener design and custom designs intended to accommodate the mass of EDM
unit lengths in use. The original Sprent/Zwart design has been altered in Victoria by
slightly changing the pillar locations. DTPLI (2014) claims this allows the additive
constant to be determined with greater precision. Nevertheless, calibrations using
this design are marginally less precise than other baseline designs, as fewer
combinations of distances are measured. The great advantage of the Sprent/Zwart
method is its ease of use, and this unquestionably offsets the slightly lower precision.
It therefore appears commonly accepted that the higher the number of distances
observed, the more reliable the determination of instrument correction will be.
2.6 Alternative Calibration Methods
Alternative methods of calibrating EDME instruments have previously been
investigated. Rather than to simply improve on traditional baseline calibration
methods, the research outlined below sought to introduce a completely new method
of calibration.

P a g e | 15
2.6.1 GNSS Calibration
Global Navigation Satellite Systems (GNSS) Surveying involves the collection of
precise code and carrier phase measurements recorded simultaneously at two or
more survey control marks using GNSS equipment. Those measurements can then
be processed to derive GNSS baselines (SP1, 2014).
Complex mathematical algorithms are used within the GNSS manufacturer’s
software packages to determine linear distances between respective positions. These
algorithms are not available for analysis, as they are patented products. Therefore, it
is not possible to determine how distances measured by GNSS are calculated
(Bissett, 2008).
As concluded by Bissett (2008), GNSS measurements do not provide the accuracy
over shorter distances that EDM instruments do. For example, the manufacturer’s
specifications of a Trimble r7 note that horizontal error is +/- 10mm + 1ppm RMS.
As this falls short of the accuracy required for EDM calibration, GNSS is not a
suitable method.
2.6.2 Compact Laboratory Calibration
Khalil (2005) investigated an alternative method of calibration using compact
laboratory calibration baselines. This involved using mirrors to create a zigzag line
to enable the determination of the zero constant of an EDM instrument. It was
identified that shorter distances assist in the determination of the zero constant while
longer distances help solve the scale component. Importantly, in Khalil’s research,
the scale component of an EDM instrument was not determined using this compact
baseline method and only the zero constant was addressed in this research.
Therefore, while it is an alternative approach, the research did not prove that it is a
suitable one.

P a g e | 16
CHAPTER 3: Methodology
3.1 Introduction to Project Methodology
Prior to conducting any field observations or reductions the alternative proposed
baselines have to be designed and established. The design of the alternative baselines
is an imperative part of this dissertation as they will be compared and analysed
against the standard 7 pillar method currently used.
The key characteristics that the alternative baseline designs seek to achieve are:
Fewer pillars to improve efficiency for Surveyors;
Shorter overall distance to make it easier to install in more locations;
High accuracy to ensure legal traceability; and
Economically cheaper to install and maintain.
Once the alternative baselines have been designed, observations will be carried out
over the Caboolture EDM Baseline. These observations will be reduced and
comparisons will be made between the current standard seven pillar method and the
alternative designs.
Once the observations have been reduced and comparisons made, one of the
alternative baselines will be chosen as the new proposed baseline for this
dissertation. Alterations may be made to this baseline design to achieve a positive
balance between the above key characteristics which the design seeks to achieve.

P a g e | 17
3.2 Caboolture EDM Baseline
The Caboolture EDM baseline was originally built and designed in 1972 by Colin
Moorhead of then Caboolture Shire Council. The Baseline was then rebuilt in 2008
by Greg Williams (Moreton Bay Regional Council). The rebuild saw the baseline
shift approximately 19.5m to the East due to the duplication of the North Coast Rail
Line.
The Caboolture EDM baseline design is based on the Schwendener model. The
Regulation 13 Certificate of Verification confirms the baseline consists of 7 concrete
pillars. The distance between each pillar varies from as little as 64.874m (pillar 0-1)
and as great as 1148.526m (pillar 0-6). See Figure 3.1 for an aerial photo of the
baseline depicting the location of each of the 7 pillars.
Figure 3.1: Aerial Photograph of the Caboolture EDM Baseline
P a g e | 18
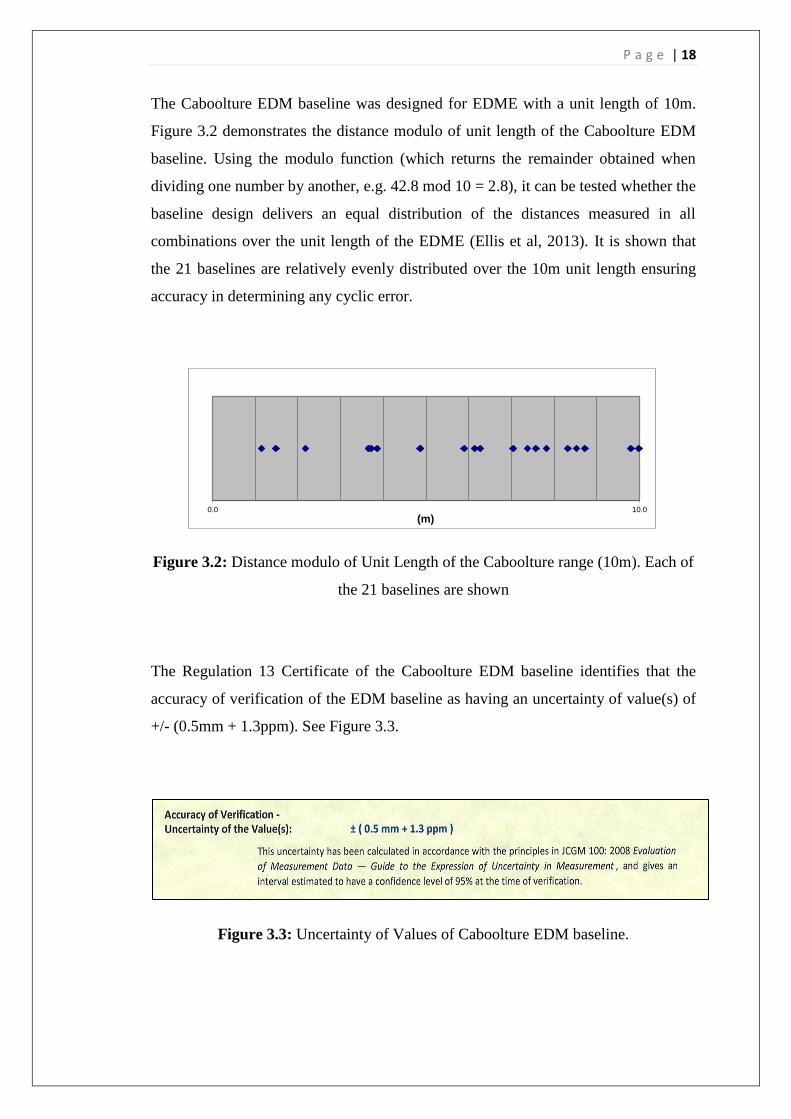
The Caboolture EDM baseline was designed for EDME with a unit length of 10m.
Figure 3.2 demonstrates the distance modulo of unit length of the Caboolture EDM
baseline. Using the modulo function (which returns the remainder obtained when
dividing one number by another, e.g. 42.8 mod 10 = 2.8), it can be tested whether the
baseline design delivers an equal distribution of the distances measured in all
combinations over the unit length of the EDME (Ellis et al, 2013). It is shown that
the 21 baselines are relatively evenly distributed over the 10m unit length ensuring
accuracy in determining any cyclic error.
Figure 3.2: Distance modulo of Unit Length of the Caboolture range (10m). Each of
the 21 baselines are shown
The Regulation 13 Certificate of the Caboolture EDM baseline identifies that the
accuracy of verification of the EDM baseline as having an uncertainty of value(s) of
+/- (0.5mm + 1.3ppm). See Figure 3.3.
Figure 3.3: Uncertainty of Values of Caboolture EDM baseline.
0.0 10.0
(m)

P a g e | 19
3.3 Alternative Baseline Designs
It was decided that initially three (3) alternative baseline designs will be tested.
Three alternatives will allow a thorough comparison of results. Each baseline design
will be based on the Caboolture EDM baseline and will use the certified distances
between the pillars.
One of the main characteristics for the alternative baseline designs was fewer pillars
to improve efficiency for surveyors. Due to this characteristic the three alternative
designs will consist of:
Design 1: Four pillar combination.
Design 2: Five pillar combination.
Design 3: Six pillar combination.
In finalising the designs, the accuracy of each pillar combination will be determined
by calculating a number of combinations. It is anticipated some pillar combinations
will be less accurate than others. Therefore the pillar combinations used in the design
will be selected based on the level of accuracy.
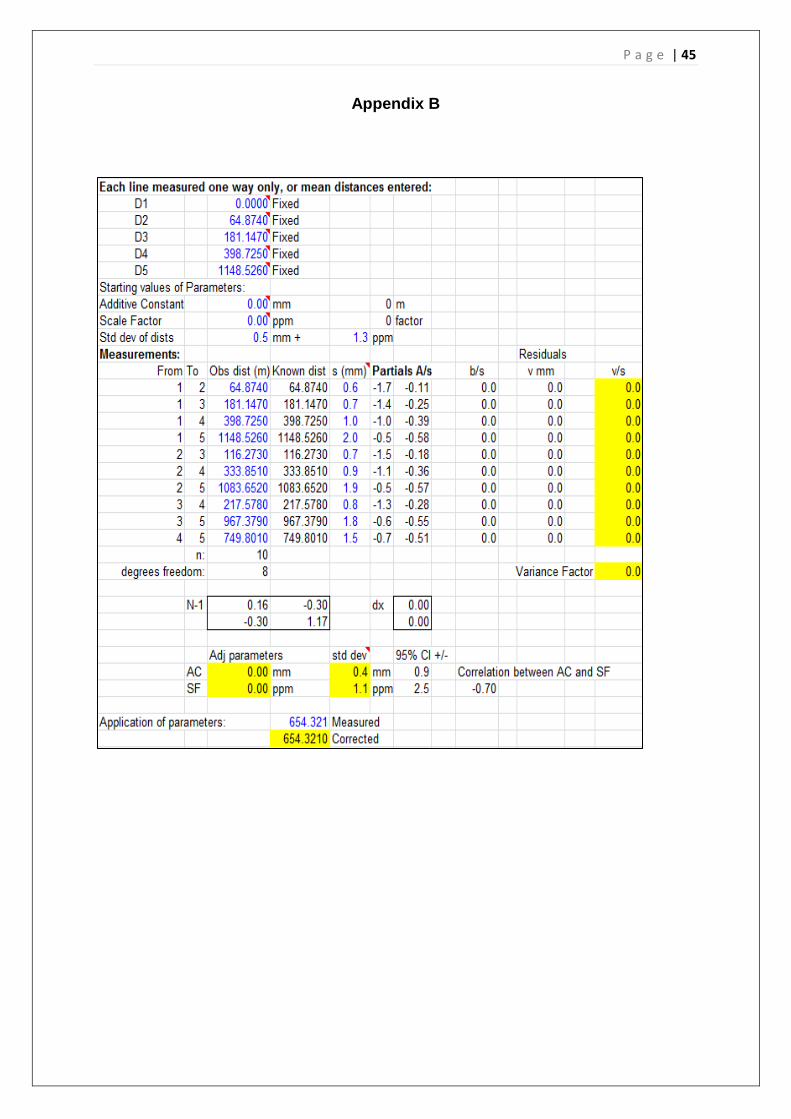
To determine the accuracy of each pillar combinations, a least squares adjustment
spread sheet prepared by Bruce Harvey from the University of New South Wales
will be used. See Appendix B for an example.
This spread sheet allows the user to input the certified distances between pillars and
based on the number of pillars used determine the accuracy of the different pillar
combinations. The additive constant and scale factor error can be calculated along
with the standard deviation of these results. Taking into account the uncertainty of
values of the baseline from the regulation 13 certificate, these can calculated at a
95% confidence interval.
P a g e | 20
3.4 Observations
Observations will be carried out over the Caboolture EDM baseline. Only one set of
observations will be taken for each instrument. By only taking the one set of
observations the comparison between the different baseline designs will be more
accurate as there will be fewer variables changing such as temperature and pressure.
These observations will help to indicate whether using modern day instruments will
result in fewer pillars being needed to be used for the calibration of EDME.
3.4.1 Instruments
Three total stations will be used to carry out the observations over the Caboolture
EDME baseline. The three instruments will be:
Topcon ES 103. This is a 3” instrument with a distance measurement
accuracy of 2mm +- 2ppm;
Leica Viva TS15. This is a 1” instrument with a distance measurement
accuracy of 1mm +- 1.5ppm and
Nikon NPR-362. This is a 3” instrument with a distance measurement
accuracy of 2mm +- 2ppm.
As previously noted, the Caboolture EDM range is designed for instruments with a
unit length of 10m, to account for cyclic error. However, as modern instruments
commonly have a unit length of approximately 1m this is an aspect of the range that
becomes redundant when redesigning it.
P a g e | 21
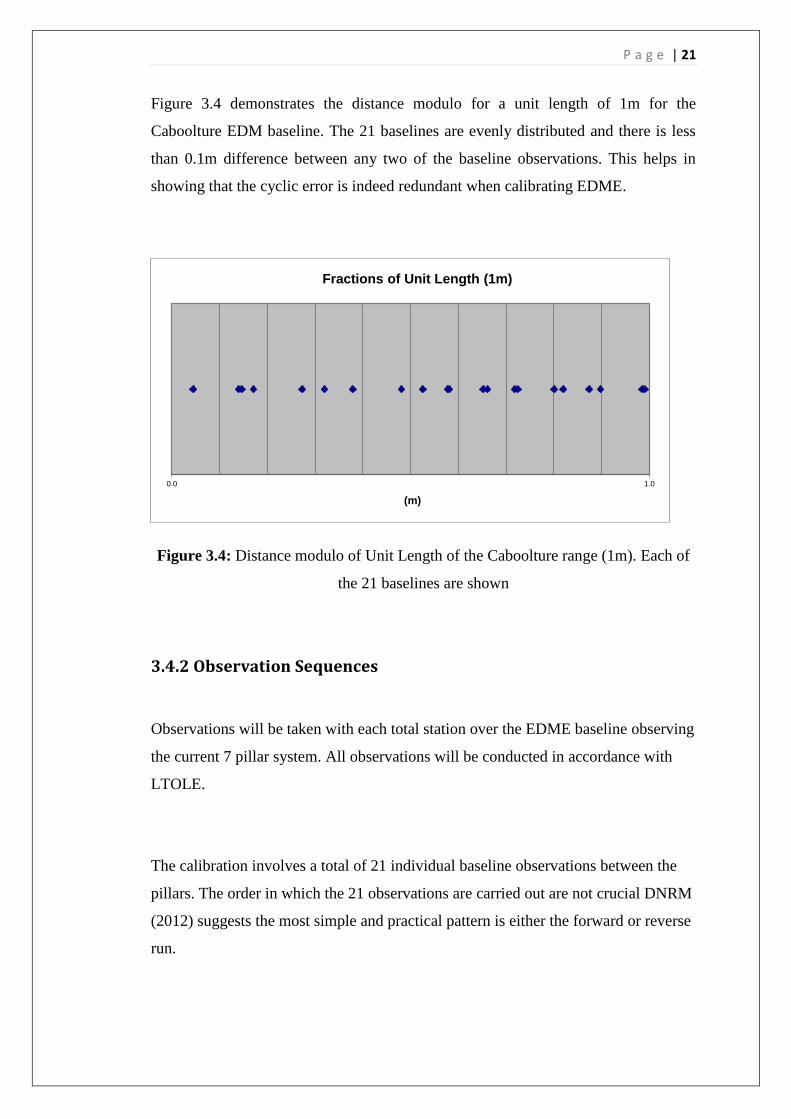
Figure 3.4 demonstrates the distance modulo for a unit length of 1m for the
Caboolture EDM baseline. The 21 baselines are evenly distributed and there is less
than 0.1m difference between any two of the baseline observations. This helps in
showing that the cyclic error is indeed redundant when calibrating EDME.
Figure 3.4: Distance modulo of Unit Length of the Caboolture range (1m). Each of
the 21 baselines are shown
3.4.2 Observation Sequences
Observations will be taken with each total station over the EDME baseline observing
the current 7 pillar system. All observations will be conducted in accordance with
LTOLE.
The calibration involves a total of 21 individual baseline observations between the
pillars. The order in which the 21 observations are carried out are not crucial DNRM
(2012) suggests the most simple and practical pattern is either the forward or reverse
run.
0.0 1.0
(m)
Fractions of Unit Length (1m)

P a g e | 22
The observations will occur in a forward run, whereby the EDM instrument starts at
Station 0 and measures to the prism on Station 1. Following this, the prism is moved
to Station 2 and so on until the prism has been observed at each pillar (1-6) from
pillar 0.
Next, the instrument is moved to Station 1 and the prism is moved in reverse order
so that the sequence observed is 1-6, 1-5, 1-4, 1-3, and 1-2. The instrument will then
be placed at Station 2, again measuring the prism at each pillar (2-3, 2-4, 2-5 and 2-
6).
The observations will continue in this sequence pattern until the last sequence of 5-6
is completed. Figure 3.5 demonstrated the series of observations to be undertaken.
Figure 3.5: Forward Run Sequence Pattern (DNRM, 2012)
As advised by DNRM (2012) a universal target height will be used for all stations.

P a g e | 23
3.5 Reduction
Two programs will be utilised for the reduction of the three different instruments.
Standard software provided by DNRM and a software program (EDM_08) provided
by retired Cadastral Surveyor Colin Moorhead. The DNRM software will be utilised
throughout the observation reductions where EDM_08 will be used only as a check
to verify the results of DNRM software.
Once reduced, the results will provide a report that states the relationship between
the measurements made by the instrument used and the certified values from the
calibration performed by the Verifying Authority (being the known distances of the
baseline). From this, the correction that is to be applied to the instrument is
discovered. The correction (or relationship) is described as a single correction with
two parts: zero constant error and scale error. DNRM (2012) states this is expressed
in the following way:
± (χ + у x 10-3.L ) mm (where L is length in m)
Or:
± ( χ mm + у PPM )
To determine how fewer observations will affect calibration results and the effect of
a shorter baseline on determining an accurate scale error, the results of reducing each
run will be compared, with the standard seven pillar design as the control.

P a g e | 24
These alternative baseline methods will address the three errors found in EDME.
Because modern day instruments have a smaller wavelength (commonly a unit
length of around 1m) any cyclic error can be determined by measuring fewer
baselines. The shorter wavelength means fewer modulo distances, the constant error
is able to be determined over a very short distance. It is not influenced by how great
the inter-pillar distance is, but by the number of inter-pillar distances measured. The
scale error is determined over longer distances and should be at least the length of
what an average surveyor would usually measure day to day in the field which is not
usually more than 700 metres.
3.6 Legal Traceability
The Legal Traceability of length for EDME (LTOLE), EDME Comparison
Procedure set out by the department of natural Resources and mines is the
departments recommended procedure for carrying out an EDME comparison, in
order to achieve legal traceability. All observations carried out in this project will
comply with the guidelines outlined in this procedure.
These procedures cover the setup and inspection of the pillars and baseline itself and
details observation requirements. Accordingly, and as described above, a total of 21
interstation observations will be carried out and all will be made to one prism only.

P a g e | 25
Chapter 4: Analysis of Data and Results
4.1 Introduction
The aim of this chapter is to determine the three alternative baseline designs by
calculating the most accurate pillar combinations for the 4, 5 and 6 pillar baselines
over the Caboolture EDM baseline.
Once these pillar combinations have been determined, the field observations will be
reduced and comparisons will be drawn between the standard seven pillar method
and the proposed alternative pillar baselines.
A brief analysis of the results will be undertaken and one of the three baseline
designs will be chosen based on the key characteristics mentioned in Chapter 3. The
chosen baseline will then be further analysed and alterations may be made to the
design to achieve a positive balance of the key characteristics.
4.2 Baseline Design combinations
Table 4.1 shows the different four pillar combinations along with their respective
index constant error, scale error and uncertainties at a 95% confidence interval. As
previously noted in Chapter 3, these results were simulated by utilising a least
squares adjustment spreadsheet provided by Bruce Harvey from the University of
New South Wales.

P a g e | 26
It can be seen from the results in Table 4.1 that the use of the pillar combinations 0,
1, 2 & 6 provides the most accurate baseline. This pillar combination will be adopted
as the alternative baseline design for 4 pillars and will be utilised for all reductions.
4 Pillar
Combinations
Index
Constant
Index Constant
(Uncertainty 95%)
Scale
error
Scale Factor
(Uncertainty 95%)
0,1,2,3 0.6 mm +-1.6 mm 2.8 ppm +- 7.9 ppm
0,1,2,5 0.5mm +-1.3 mm 1.6 ppm +- 4.5ppm
0,1,2,6 0.4 mm +-1.2 mm 1.2 ppm +- 3.3 ppm
0,4,5,6 0.9 mm +-2.5 mm 1.8 ppm +- 4.9ppm
0,1,5,6 0.6 mm +-1.7 mm 1.2 ppm +- 3.4 ppm
0,2,3,6 0.7 mm +-1.9 mm 1.5 ppm +-4.2ppm
Table 4.1: 4 Pillar combinations
Table 4.2 shows the different pillar combinations that were simulated when using 5
pillars. The results show that the most accurate baseline is determined by the use of
the pillar combination 0, 1, 2, 5 & 6. This pillar combination will be adopted as the
alternative baseline design for 5 pillars and will be used for all reductions.
5 Pillar
Combinations
Index
Constant
Index Constant
(Uncertainty 95%)
Scale
error
Scale Factor
(Uncertainty 95%)
0,1,2,3,4 0.5 mm +-1.1 mm 1.8 ppm +- 4.2 ppm
0,1,2,4,5 0.4 mm +-1.0 mm 1.4 ppm +- 3.2 ppm
0,1,2,3,5 0.5 mm +-1.1 mm 1.5 ppm +- 3.5 ppm
0,1,2,5,6 0.4 mm +-1.0 mm 1.0 ppm +- 2.3 ppm
0,1,2,3,6 0.4 mm +-0.9 mm 1.1 ppm +- 2.5 ppm
0,3,4,5,6 0.6 mm +-1.4 mm 1.4 ppm +- 3.2 ppm
Table 4.2: 5 Pillar combinations

P a g e | 27
Table 4.3 shows the different pillar combinations that were simulated when using 6
pillars. The results below for the different pillar combinations are very similar and
show little variation in accuracy. Pillar combination 0, 1, 2, 3, 4 & 6 has been chosen
as the alternative baseline design for 6 pillars. This is due to this combination
achieving the most accurate index constant and 2nd
most accurate scale factor error.
This pillar combination will be adopted as the alternative baseline design for 6 pillars
and will be utilised for all reductions.
6 Pillar
Combinations
Index
Constant
Index Constant
(Uncertainty 95%)
Scale
error
Scale Factor
(Uncertainty 95%)
0,1,2,3,4,5 0.4 mm +-0.9 mm 1.3 ppm +- 2.8 ppm
0,1,2,4,5,6 0.4 mm +-0.9 mm 0.9 ppm +- 2.0 ppm
0,1,2,3,4,6 0.4 mm +-0.8 mm 1.0 ppm +- 2.1 ppm
Table 4.3: 6 Pillar combinations
The three alternative pillar designs (as outlined in the preceding paragraphs) have
been chosen ensuring that they are the most accurate combination of pillars for each
individual design. The above results demonstrate that in order to achieve the most
accurate combination of pillars there has ta mixture of short distances (to aid with
zero constant error) and long distances (to aid with scale error) are required.
4.3 Reduction and Results
After the field observations had been carried out, the data was reduced for each of
the pillar combinations. The standard seven pillar combination was the first
reduction to be performed using the standard DNRM software in addition to
EDM_08 to verify the DNRM software. Following this, the alternative 4, 5, 6
baselines designs were reduced and compared to the standard 7 pillar results.
P a g e | 28
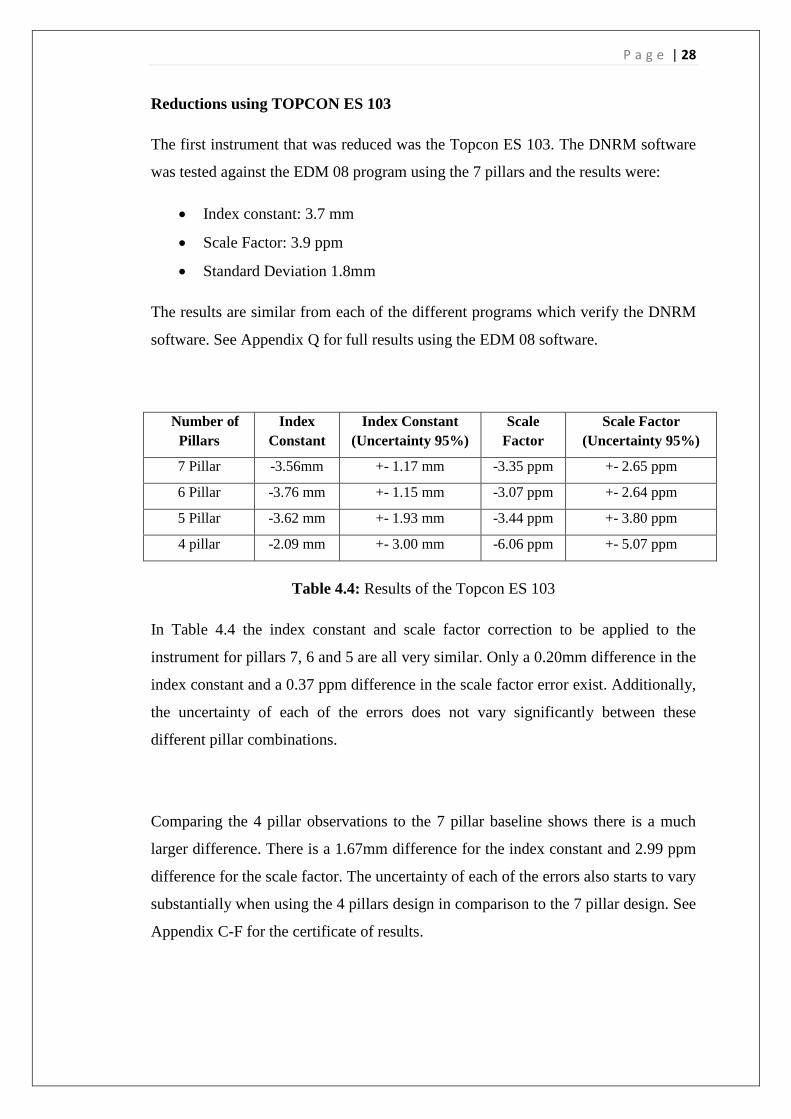
Reductions using TOPCON ES 103
The first instrument that was reduced was the Topcon ES 103. The DNRM software
was tested against the EDM 08 program using the 7 pillars and the results were:
Index constant: 3.7 mm
Scale Factor: 3.9 ppm
Standard Deviation 1.8mm
The results are similar from each of the different programs which verify the DNRM
software. See Appendix Q for full results using the EDM 08 software.
Number of
Pillars
Index
Constant
Index Constant
(Uncertainty 95%)
Scale
Factor
Scale Factor
(Uncertainty 95%)
7 Pillar -3.56mm +- 1.17 mm -3.35 ppm +- 2.65 ppm
6 Pillar -3.76 mm +- 1.15 mm -3.07 ppm +- 2.64 ppm
5 Pillar -3.62 mm +- 1.93 mm -3.44 ppm +- 3.80 ppm
4 pillar -2.09 mm +- 3.00 mm -6.06 ppm +- 5.07 ppm
Table 4.4: Results of the Topcon ES 103
In Table 4.4 the index constant and scale factor correction to be applied to the
instrument for pillars 7, 6 and 5 are all very similar. Only a 0.20mm difference in the
index constant and a 0.37 ppm difference in the scale factor error exist. Additionally,
the uncertainty of each of the errors does not vary significantly between these
different pillar combinations.
Comparing the 4 pillar observations to the 7 pillar baseline shows there is a much
larger difference. There is a 1.67mm difference for the index constant and 2.99 ppm
difference for the scale factor. The uncertainty of each of the errors also starts to vary
substantially when using the 4 pillars design in comparison to the 7 pillar design. See
Appendix C-F for the certificate of results.

P a g e | 29
The 4 pillar design remains in the range required by the minimum standards of the
uncertainty of calibration of an EDM instrument, being 4.0mm +/- 20 ppm. This
achieves a reasonably accurate result and falls well within the minimum standards
set by the Working Party of the National Standards Commission of the calibration of
EDM equipment of 1 February, 1983.
Reductions using NIKON NPR-362
The second instrument reduced was the Nikon NPR-362. The DNRM software was
again tested against the EDM 08 program using the 7 pillars and the results were:
Index constant: -1.3 mm
Scale Factor: 2.0 ppm
Standard Deviation 1.3mm
The results are similar from each of the different programs which verify the DNRM
software. See Appendix R for full results using the EDM 08 software.
Number of
Pillars
Index
Constant
Index Constant
(Uncertainty 95%)
Scale
Factor
Scale Factor
(Uncertainty 95%)
7 Pillar -0.90mm +- 1.00 mm -1.88 ppm +- 2.00 ppm
6 Pillar -0.79 mm +- 1.00 mm -1.60 ppm +- 2.00 ppm
5 Pillar -0.66 mm +- 1.31 mm -2.30 ppm +- 2.57 ppm
4 pillar -0.34 mm +- 2.26 mm -2.0 ppm +- 3.82 ppm
Table 4.5: Results of the Nikon NPR-362
Table 4.5 demonstrates that the Index constant and scale factor correction to be
applied to the instrument are all very similar for pillars 7, 6 and 5 and 4. There is
only a 0.66mm difference in the index constant and a 0.42 ppm in the scale factor
error.

P a g e | 30
However, when comparing the uncertainty values for the index constant and scale
factor a similar result to the Topcon ES103 is achieved. The uncertainty at a 95%
confidence interval is increased when comparing the 4 pillar design to the 7 pillar.
The 5 and 6 pillar designs are significantly more accurate than the 4 pillar which
agrees with the Topcon results. See Appendix G-J for the certificate of results.
Reductions using LEICA TS-15
The third and last instrument that was reduced was the Leica TS15. The DNRM
software was again tested against the EDM 08 program and the results were index
constant: 3.6mm and scale factor was 0.2 ppm with a standard deviation of 1.2mm
See appendix S For the full results. This again verifies the DNRM software.
Number of
Pillars
Index
Constant
Index Constant
(Uncertainty 95%)
Scale
Factor
Scale Factor
(Uncertainty 95%)
7 Pillar -3.25 mm +- 1.0 mm 0.43 ppm +- 2.0 ppm
6 Pillar -3.24 mm +- 1.0 mm 0.98 ppm +- 2.0 ppm
5 Pillar -3.43 mm +- 1.14 mm 0.43 ppm +- 2.25 ppm
4 pillar -2.81 mm +- 2.01 mm -0.65 ppm +- 3.40 ppm
Table 4.6: Results of the Leica Viva TS15
Table 4.6 demonstrates that the index constant and scale factor correction to be
applied to the instrument are very similar for pillars 7, 6, 5 and 4. There is only a
0.62 mm difference in the index constant and a 1.53 ppm in the scale factor error.
As seen with the other two instruments previously tested, when comparing the 4
pillar design to the 7 pillar the uncertainty at 95% increases dramatically compared
to the 5 and 6 pillar designs. See Appendix K-N for the certificate of results.

P a g e | 31
Summary of Reductions
All of the instruments have been reduced and the results tabulated. An obvious
pattern emerges between the current 7 pillar design and the three alternative designs.
The index constant and scale factor generally does not vary much between the
different pillar designs and instruments. The uncertainty values on the other hand do
vary, especially between the 4 pillar design and the 7 pillar. This will be investigated
in more detail.
Figure 4.1 below shows the different instruments and there corresponding index
constant uncertainty at a 95% confidence interval. It can be seen from the graph that
it is most accurate using the current 7 pillar design. This being said the alternative
designs for 6 and 5 pillars are also very accurate and only differ from the 7 pillar
design by 0-0.8mm. It can also be seen that the four pillar design for every
instrument increases in uncertainty and can vary up to 2.0 mm when compared to the
7 pillar design.
Figure 4.1: Index Constant Uncertainty (95%)
0.5
1
1.5
2
2.5
3
3.5
Pillar 7 Pillar 6 Pillar 5 Pillar 4
+ - mm
PILLARS
Index Constant Uncertainty (95%)
Nikon
Topcon
Lecia

P a g e | 32
Figure 4.2 below shows the different instruments and there corresponding scale
uncertainty at a 95% confidence interval. It is noted that the graph is very similar in
shape to figure 4.1 showing the index constant uncertainty.
This demonstrates that the 7 pillar baseline is the most accurate and that the
uncertainties slightly increase as the pillars decrease. As seen in Figure 4.1 the 5 & 6
pillar baseline designs are still very accurate and only differ from the 7 pillar design
by 0-1.7 ppm. To demonstrate this in a practical sense for every 1000 metres
measured there is a 1.7 mm uncertainty. It can be seen that all instruments in the four
pillar design increase in uncertainty.
Figure 4.2: Scale Factor Uncertainty (95%)
1
1.5
2
2.5
3
3.5
4
4.5
5
5.5
Pillar 7 Pillar 6 Pillar 5 Pillar 4
+ - PPM
PILLARS
Scale Uncertainty (95%)
Nikon
Topcon
Lecia

P a g e | 33
The above results indicate that all three of the proposed alternative baseline designs
fall well within the minimum standards set down for the calibration of EDME. It is
important to note that this guideline is now 32 years old and has therefore not
evolved to consider or account for advances in technology.
The results show that there is a significant decrease in accuracy from the 5 pillar
design to the 4 pillar design. It is concluded that the 4 pillar design is not sufficiently
accurate and does not satisfy one of the key characteristics of the alternative
baseline. The high uncertainty of the 4 pillar design is due to only 6 individual
baselines being measured, resulting in a minimal amount of redundancies.
4.4 Adjustments to 5 Pillar Design.
The 5 pillar design provided positive results and certainly demonstrated its
advantages over the current 7 pillar baseline. The 5 pillar design will be more
efficient for surveyors and be more economical to install and maintain. One main
characteristic the 5 pillar baselines did not achieve was to result in a shorter distance
to allow for easier installation in populated areas where space is an issue.
The 5 pillar design will be altered so that it is an overall distance of 714 metres as
opposed to 1148 metres. Shortening the baseline will cause an increase in the
uncertainty of the baseline design which will be investigated below. Consequentially,
the shorter distance will be easier to install in more locations, achieving a key
objective of an alternative baseline.
The average surveyor conducting work generally will not measure a distance of more
than 700m. Therefore, there is little benefit in calibrating instruments over these
longer distances.

P a g e | 34
The 5 pillar design is manipulated to decrease its length to approximately 700m. The
results of this manipulated 5 pillar design are then compared to the results of the
original 5 pillar design. This process will then be repeated using pillars 0,1,2,4, & 5.
The accuracy of this pillar combination is outlined in Table 4.7. This new baseline
will now be reduced and compared to the original 5 pillar design to see whether the
accuracy is compromised to allow the benefit of the shorter distance baseline.
0,1,2,4,5 0.4 mm +-1.0 mm 1.4 ppm +- 3.2 ppm
0,1,2,5,6 0.4 mm +-1.0 mm 1.0 ppm +- 2.3 ppm
Table 4.7: Comparison between old and new 5 pillar designs.
Reductions using Topcon ES-103
Table 4.8 shows the Comparison between old and new 5 pillar designs for the
Topcon ES-103. See Appendix O for the certificate of the results.
Number of
Pillars
Index
Constant
Index Constant
(Uncertainty 95%)
Scale
Factor
Scale Factor
(Uncertainty 95%)
7 Pillar -3.56mm +- 1.17 mm -3.35 ppm +- 2.65 ppm
5 Pillar -3.62 mm +- 1.93 mm -3.44 ppm +- 3.80 ppm
5 pillar Alt -3.36 mm +- 1.13 mm -5.68 ppm +- 3.05 ppm
Table 4.8: Topcon comparisons between old and new 5 pillar designs.
P a g e | 35
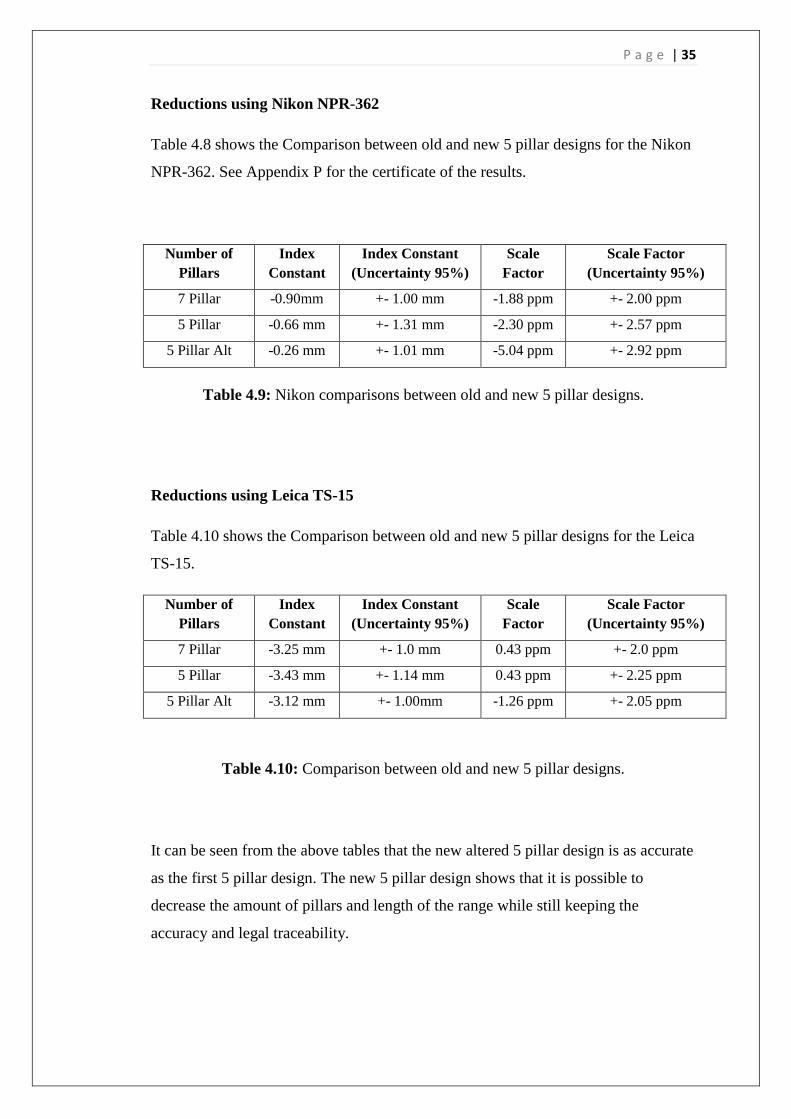
Reductions using Nikon NPR-362
Table 4.8 shows the Comparison between old and new 5 pillar designs for the Nikon
NPR-362. See Appendix P for the certificate of the results.
Number of
Pillars
Index
Constant
Index Constant
(Uncertainty 95%)
Scale
Factor
Scale Factor
(Uncertainty 95%)
7 Pillar -0.90mm +- 1.00 mm -1.88 ppm +- 2.00 ppm
5 Pillar -0.66 mm +- 1.31 mm -2.30 ppm +- 2.57 ppm
5 Pillar Alt -0.26 mm +- 1.01 mm -5.04 ppm +- 2.92 ppm
Table 4.9: Nikon comparisons between old and new 5 pillar designs.
Reductions using Leica TS-15
Table 4.10 shows the Comparison between old and new 5 pillar designs for the Leica
TS-15.
Number of
Pillars
Index
Constant
Index Constant
(Uncertainty 95%)
Scale
Factor
Scale Factor
(Uncertainty 95%)
7 Pillar -3.25 mm +- 1.0 mm 0.43 ppm +- 2.0 ppm
5 Pillar -3.43 mm +- 1.14 mm 0.43 ppm +- 2.25 ppm
5 Pillar Alt -3.12 mm +- 1.00mm -1.26 ppm +- 2.05 ppm
Table 4.10: Comparison between old and new 5 pillar designs.
It can be seen from the above tables that the new altered 5 pillar design is as accurate
as the first 5 pillar design. The new 5 pillar design shows that it is possible to
decrease the amount of pillars and length of the range while still keeping the
accuracy and legal traceability.
P a g e | 36
Chapter 5 – Discussion and Conclusions
5.1 Introduction
The results in chapter 4 provide an in depth review of the proposed baselines and
draws a comparison with the current standard 7 pillar baselines. It shows the
importance of which combination of pillars should be used. These observations have
revealed significant results that require in depth analysis to determine what is
ultimately the most desirable alternative baseline design for the calibration of
EDME.
This Chapter will analyse those results to finally determine the viability, accuracy
and value of the proposed alternative baseline.
With the rapid advances in EDME technology and the fact that current calibration
baselines throughout Queensland were designed for instruments from two decades
ago, it is a logical conclusion that the current baselines are outdated and do not
specifically cater to the modern day instrument.
This Project successfully demonstrates that a considered and carefully selected
combination of pillars set at certain distances apart, high accuracies can be achieved
using only 5 pillars and not the current 7 pillar method. This will allow modern day
instruments to potentially be calibrated over the current 7 pillars in around a third of
the time. Using a 5 pillar design, only 10 baselines are required to be measured. This
results in a total of 100 shots being taken in comparison to 21 baselines and 210
shots taken with the current 7 pillar method.

P a g e | 37
The literature review revealed that baselines should ideally be approximately one
kilometre in length in order to address the scale error in instruments. The results do
support this motion but the decreasing the range to around 700 metres does not affect
the accuracy of the scale error by very much. It also must be noted that most
surveyors will not measure distances of more than 600 metres on an average day. By
decreasing the overall distance of the baseline this will allow for the erection of more
baselines in highly populated areas.
It has to be remembered that the final 5 pillar design will not be the same design for
all EDM baselines. The final pillar combination is specific to the Caboolture EDM
range and will be different for all baselines.

P a g e | 38
Chapter 6 – Future Work
With the advances in technology and the increasing accuracy of EDME it will only
be a matter of time until the equipment is so accurate that the calibration baselines
are no longer required.
It is suggested that further research be conducted into the accuracy of the different
pillar setups and the errors inherit within these setups. Such research should account
for the movement of the concrete pillars. It is likely that such a consideration will
largely impact the accuracy of the baseline and therefore a valuable subject of future
work, but outside the scope of this project.
This dissertation has critically analysed modern day EDME and the errors that are
associated with these instruments. It has investigated different types of calibration
baselines and has designed and tested alternative baselines. From the results gathered
an alternative baseline has been proposed but it has not yet investigated possible
suitable locations for this alternative baseline.
Further work might investigate potential sites in and around Brisbane city to assist
city surveyors to calibrate their instruments. Investigating potential sites will
involve:
Underground services locations
Soil testing for stability
Line of site between all the pillars
Suitable land tenure
P a g e | 39
Bibliography
Bannister. A., Raymond. S. and Baker. R. 1998. “Surveying”, 7th Edition, Pearson
education Ltd, England, (1998)
Bisset, M (2008) Investigation on Utilising Real Time Kinematic (RTK) Global
Navigation Satellite Systems (GNSS) for Electronic Distance Measurement (EDM)
Baseline Calibration and Traceability of Measurement <
http://eprints.usq.edu.au/5868/1/Bissett_2008.pdf> Accessed May 2015.
Couchman, H (1974) ‘A method of evaluating cyclic errors in EDM equipment’ The
Australian Surveyor 26:2, 113-115
Department of Natural Resources and Mines (DNRM), Certificate of Verification of
a Reference Standard of Measurement in Accordance with Regulation 13 of the
National Measurement Regulations 1999 (Cth) in Accordance with the National
Measurement Act 1960 (Cth), Date of Issue: 25 September 2013.
Department of Transport, Planning and Local Infrastructure (DTPLI), State
Government of Victoria, (2014) EDM Calibration Handbook, 15th
Edition.
Ellis D, Janssen V. and Lock R. (2013) Improving survey infrastructure in NSW:
Construction of the Eglinton EDM baseline, Proceedings of Association of Public
Authority Surveyors Conference (APAS2013), Canberra, Australia, 12-14 March,
187-20
Emenike, E.N (1982) ‘On the Calibration of EDM instruments’ Australian Surveyor
31,3 page 175-185
Janssen et al (2013) ‘Made to measure: Constructing modern EDM baseline
infrastructure in NSW’ Azimuth, 52(9), 32-34.
Janssen V. and Watson T. (2014) Current status of EDM calibration procedures in
NSW, Proceedings of Association of Public Authority Surveyors Conference
(APAS2014), Pokolbin, Australia, 31 March – 2 April, 3-15

P a g e | 40
Janssen (2015) Best Practice: Performing EDM Calibrations in NSW, Proceedings of
the 20th Association of Public Authority Surveyors Conference (APAS2015) Coffs
Harbour, New South Wales, Australia, 16-18 March 2015.
Ollis, J. 2007. “A Reflective Look at the Calibration of EDM Instruments”. Institute
of Surveyors NSW, Azimuth No. 45, Issue 2, (p 27, 30 – 31)
Queensland Government (2012) Legal traceability of length for EDME: EDME
comparison procedure, Version 1, http://www.business.qld.gov.au/industry/titles-
propertyconstruction/surveying/calibration-equipment (Accessed May 2015)
Rüeger, J.M., 1980. “Legal Requirements for the Calibration of EDM-Instruments”.
Proc., 22nd Australian Survey Congress, Hobart, 1980, 10-1-10-1
Rüeger, J. M., 1996. “Electronic Distance Measurement - An Introduction. Fourth
corrected edition”. Springer-Verlag, Berlin-Heidelberg-New York, 276 pa
Rüeger, J.M. (1977). Design and Use of Baselines for the Calibration of EDM-
Instruments. Proc., 20th Australian Survey Congress, Darwin, 175-189.
Rüeger, J.M. (1989). Electronic Distance Measurement: An Introduction – 3rd
Totally Revised Edition. University of New South Wales
Rueger, J.M (1992). Legal calibration of electronic distance meters in Australia.
Australian Surveyor, 36:3, 195-2.
Rueger, J.M (1985) Traceability of Electronic Distance Measurement to National
Standards. Paper Presented at the 27th
Australian Surveyors Congress.
Schwendener H.R. (1972) Electronic distances for short ranges: Accuracy and
checking procedures, Survey Review, 21(164), 273-281.
The Intergovernmental Committee on Surveying and Mapping – Special Publication
1 (SP1) Version 2.1 (2014)
Surveying and Mapping Infrastructure Act 2003 (Qld)
Surveying and Mapping Infrastructure Regulation 2004 (Qld)
National Measurement Act 1960 (Cth)

P a g e | 41
National Measurement Regulations 1999 (Cth)

P a g e | 42
List of Appendices
Appendix A – RESEARCH PROJECT SPECIFICATION……………………44
Appendix B – LEAST SQUARES ADJUSTMENT SPREADSHEET……….45
Appendix C – TOPCON ES-103 7 PILLAR REDUCTION…………………..46
Appendix D – TOPCON ES-103 6 PILLAR REDUCTION…………………..48
Appendix E – TOPCON ES-103 5 PILLAR REDUCTION…………………..50
Appendix F – TOPCON ES-103 4 PILLAR REDUCTION…………………..52
Appendix G – NIKON NPR-362 7 PILLAR REDUCTION…………………..54
Appendix H – NIKON NPR-362 6 PILLAR REDUCTION…………………..56
Appendix I – NIKON NPR-362 5 PILLAR REDUCTION……………...……58
Appendix J – NIKON NPR-362 4 PILLAR REDUCTION…………………..60
Appendix K – LEICA TS-15 7 PILLAR REDUCTION………………..…….62
Appendix L – LEICA TS-15 6 PILLAR REDUCTION…………………...…64
Appendix M – LEICA TS-15 5 PILLAR REDUCTION……………….…….66
Appendix N – LEICA TS-15 4 PILLAR REDUCTION……………………..68
Appendix O – TOPCON ES103 5 PILLAR ALT REDUCTION………...….70
Appendix P – NIKON NPR-362 5 PILLAR ALT REDUCTION……………72
Appendix Q – TOPCON ES-103 EDM08 7 PILLAR REDUCTION…….....74
Appendix R – NIKON NPR-362 EDM08 7 PILLAR REDUCTION…….….75
Appendix S – LEICA TS-15 EDM08 7 PILLAR REDUCTION………...….76

P a g e | 44
Appendix A
ENG 4111/4112 Research Project
Project Specification
FOR: Rhys Pescod
TOPIC: Design of Electronic Distance Measurement Equipment (EDME)
SUPERVISORS: Dr Glenn Campbell (USQ Supervisor)
ENROLMENT: ENG 4111 – S1 2015
ENG 4112 – S2 2015
PROJECT AIM: This project seeks to investigate whether the current method of EDME calibration
is still necessary and to see if the design of the baselines can be modified due to changes in
technology.
PROGRAMME: 1. Research the history and background of EDME design and calibrations.
2. Establish the origins and design criteria for the current 7 pillar method.
3. Research alternative calibration methods that have been used in Australia and overseas.
4. Investigate the design and construction of current EDME, both time of flight and phase shift.
5. Design a more efficient and shorter EDME calibration technique.
6. Incorporate a method to estimate horizontal and vertical collimation errors within the new
design.
7. Compare the new EDME calibration technique to a current 7 Pillar Baseline.
8. Analyse and prepare findings
9. Prepare and submit a project dissertation.
P a g e | 45
Appendix B

P a g e | 46
Appendix C
Page 1 of 2
Job Identification: Topcon ES 103
EDM Calibration Certificate
This report has been generated by program Baseline Version 6.1.0.3, developed by the Western Australian Land Information Agency.
Use of this application elsewhere should rely on baseline distances certified by the relevant authority.
Observation Date: 10/06/2015 Computation Date: 12/08/2015
Instrument Operator: Rhys Pescod Computation Time: 2:58:52 PM
Equipment Details
Instrument Owner: MBRC
Owner Address: Strathpine Office Reflector Make: Sokkia
EDM Instrument Make: Topcon Reflector Model: Zero Const
EDM Instrument Model: ES103 Serial Number:
EDM Serial Number: BR0236 Reflector Constant: 0 mm
Baseline Details
Name CABOOLTURE Location: Dances Rd
Authority: DNRM Last calibration Date: 28/08/2013
Authority Address: Level 4, 33 King St, CABOOLTURE, QLD, 4510 This baseline consists of known lengths, which are the certified distances between the pillars of the baseline. All certified distances are on the same horizontal plane and on the same vertical plane running through the first and last stations.
Instrument Correction (IC) in mm (to be added to the instrument reading)
IC = -3.56 - 0.00335 L
Where L = distance in metres
The reflector constant has been entered into the instrument
CYCLIC ERRORS ARE INSIGNIFICANT
Calibration Parameters Value Uncertainty (95%)
Index -3.56 mm ± 1.17 mm
Scale -3.35 ppm ± 2.65 ppm
The instrument correction has been determined from measurements in the range of 65 to 1149metres
© Western Australian Land Information Authority 2007
12/08/2015 2:58:52 PM

P a g e | 47
Page 2 of 2
Job Identification: Topcon ES 103
EDM Calibration Certificate This report has been generated by program Baseline Version 6.1.0.3, developed by the Western Australian Land Information Agency.
Use of this application elsewhere should rely on baseline distances certified by the relevant authority.
Uncertainty of the Instrument Correction Minimum standard for the uncertainty of calibration of an EDM instrument is ± ( 4.00 mm + 20.00 ppm) as described in terms of Recommendation No.8 of the Working Party of the National Standards Commission on the calibration of EDM Equipment of 1 February, 1983. All uncertainties are specified at the 95% confidence level. A coverage factor of 2 has been used for the uncertainty computations.
Uncertainty of instrument correction: ± ( 1.17 mm + 2.65 ppm)
Instrument Minimum
Distance Uncertainty Standard
(metres) (mm) (mm) Comparison Test
50 ±1.30 ±5.00 PASS
100 ±1.43 ±6.00 PASS
300 ±1.96 ±10.00 PASS
500 ±2.49 ±14.00 PASS
800 ±3.29 ±20.00 PASS
1100 ±4.09 ±26.00 PASS
This instrument satisfies the National Standards Commission standards.
First Velocity Correction (Atmospheric Correction)
The atmospheric correction dial of the EDM instrument was set for all observations. Therefore the observed distances have already been corrected for atmospheric effects.
To obtain a regulation 13 Certificate for the purpose of legal traceability to the Australian standard of length contact the Verifying Authority responsible for length measurements in your State or Territory.
The calibration of the EDM Instrument has been carried out according to DNRM Work Instructions as
described
in the latest version of CBD.041230.EDME_Comparison_Procedure.
Data entry by: ……………………………..... Results checked by: …………………….
Position: ……………………………………… Position: ………………………………...
Signature: …………………………………… Approved Signatory: ……………………
Date: ………………………………………… Date: ……………………………………..
..
© Western Australian Land Information Authority 2007
12/08/2015 2:58:52 PM

P a g e | 48
Appendix D
Page 1 of 2
Job Identification: Topcon ES 103
EDM Calibration Certificate
This report has been generated by program Baseline Version 6.1.0.3, developed by the Western Australian Land Information Agency.
Use of this application elsewhere should rely on baseline distances certified by the relevant authority.
Observation Date: 10/06/2015 Computation Date: 12/08/2015
Instrument Operator: Rhys Pescod Computation Time: 3:14:09 PM
Equipment Details
Instrument Owner: MBRC
Owner Address: Strathpine Office Reflector Make: Sokkia
EDM Instrument Make: Topcon Reflector Model: Zero Const
EDM Instrument Model: ES103 Serial Number:
EDM Serial Number: BR0236 Reflector Constant: 0 mm
Baseline Details
Name CABOOLTURE Location: Dances Rd
Authority: DNRM Last calibration Date: 28/08/2013
Authority Address: Level 4, 33 King St, CABOOLTURE, QLD, 4510 This baseline consists of known lengths, which are the certified distances between the pillars of the baseline. All certified distances are on the same horizontal plane and on the same vertical plane running through the first and last stations.
Instrument Correction (IC) in mm (to be added to the instrument reading)
IC = -3.76 - 0.00307 L
Where L = distance in metres
The reflector constant has been entered into the instrument
CYCLIC ERRORS ARE INSIGNIFICANT
Calibration Parameters Value Uncertainty (95%)
Index -3.76 mm ± 1.15 mm
Scale -3.07 ppm ± 2.64 ppm
The instrument correction has been determined from measurements in the range of 65 to 1149metres
© Western Australian Land Information Authority 2007
12/08/2015 3:14:09 PM

P a g e | 49
Page 2 of 2
Job Identification: Topcon ES 103
EDM Calibration Certificate This report has been generated by program Baseline Version 6.1.0.3, developed by the Western Australian Land Information Agency.
Use of this application elsewhere should rely on baseline distances certified by the relevant authority.
Uncertainty of the Instrument Correction Minimum standard for the uncertainty of calibration of an EDM instrument is ± ( 4.00 mm + 20.00 ppm) as described in terms of Recommendation No.8 of the Working Party of the National Standards Commission on the calibration of EDM Equipment of 1 February, 1983. All uncertainties are specified at the 95% confidence level. A coverage factor of 2 has been used for the uncertainty computations.
Uncertainty of instrument correction: ± ( 1.15 mm + 2.64 ppm)
Instrument Minimum
Distance Uncertainty Standard
(metres) (mm) (mm) Comparison Test
50 ±1.30 ±5.00 PASS
100 ±1.43 ±6.00 PASS
300 ±1.96 ±10.00 PASS
500 ±2.49 ±14.00 PASS
800 ±3.29 ±20.00 PASS
1100 ±4.09 ±26.00 PASS
This instrument satisfies the National Standards Commission standards.
First Velocity Correction (Atmospheric Correction)
The atmospheric correction dial of the EDM instrument was set for all observations. Therefore the observed distances have already been corrected for atmospheric effects.
To obtain a regulation 13 Certificate for the purpose of legal traceability to the Australian standard of length contact the Verifying Authority responsible for length measurements in your State or Territory.
The calibration of the EDM Instrument has been carried out according to DNRM Work Instructions as
described
in the latest version of CBD.041230.EDME_Comparison_Procedure.
Data entry by: ……………………………..... Results checked by: …………………….
Position: ……………………………………… Position: ………………………………...
Signature: …………………………………… Approved Signatory: ……………………
Date: ………………………………………… Date: ……………………………………..
..
© Western Australian Land Information Authority 2007
12/08/2015 3:14:09 PM

P a g e | 50
Appendix E
Page 1 of 2
Job Identification: Topcon ES 103
EDM Calibration Certificate
This report has been generated by program Baseline Version 6.1.0.3, developed by the Western Australian Land Information Agency.
Use of this application elsewhere should rely on baseline distances certified by the relevant authority.
Observation Date: 10/06/2015 Computation Date: 12/08/2015
Instrument Operator: Rhys Pescod Computation Time: 3:41:15 PM
Equipment Details
Instrument Owner: MBRC
Owner Address: Strathpine Office Reflector Make: Sokkia
EDM Instrument Make: Topcon Reflector Model: Zero Const
EDM Instrument Model: ES103 Serial Number:
EDM Serial Number: BR0236 Reflector Constant: 0 mm
Baseline Details
Name CABOOLTURE Location: Dances Rd
Authority: DNRM Last calibration Date: 28/08/2013
Authority Address: Level 4, 33 King St, CABOOLTURE, QLD, 4510 This baseline consists of known lengths, which are the certified distances between the pillars of the baseline. All certified distances are on the same horizontal plane and on the same vertical plane running through the first and last stations.
Instrument Correction (IC) in mm (to be added to the instrument reading)
IC = -3.62 - 0.00344 L
Where L = distance in metres
The reflector constant has been entered into the instrument
CYCLIC ERRORS ARE INSIGNIFICANT
Calibration Parameters Value Uncertainty (95%)
Index -3.62 mm ± 1.93 mm
Scale -3.44 ppm ± 3.80 ppm
The instrument correction has been determined from measurements in the range of 65 to 1149metres
© Western Australian Land Information Authority 2007
12/08/2015 3:41:15 PM
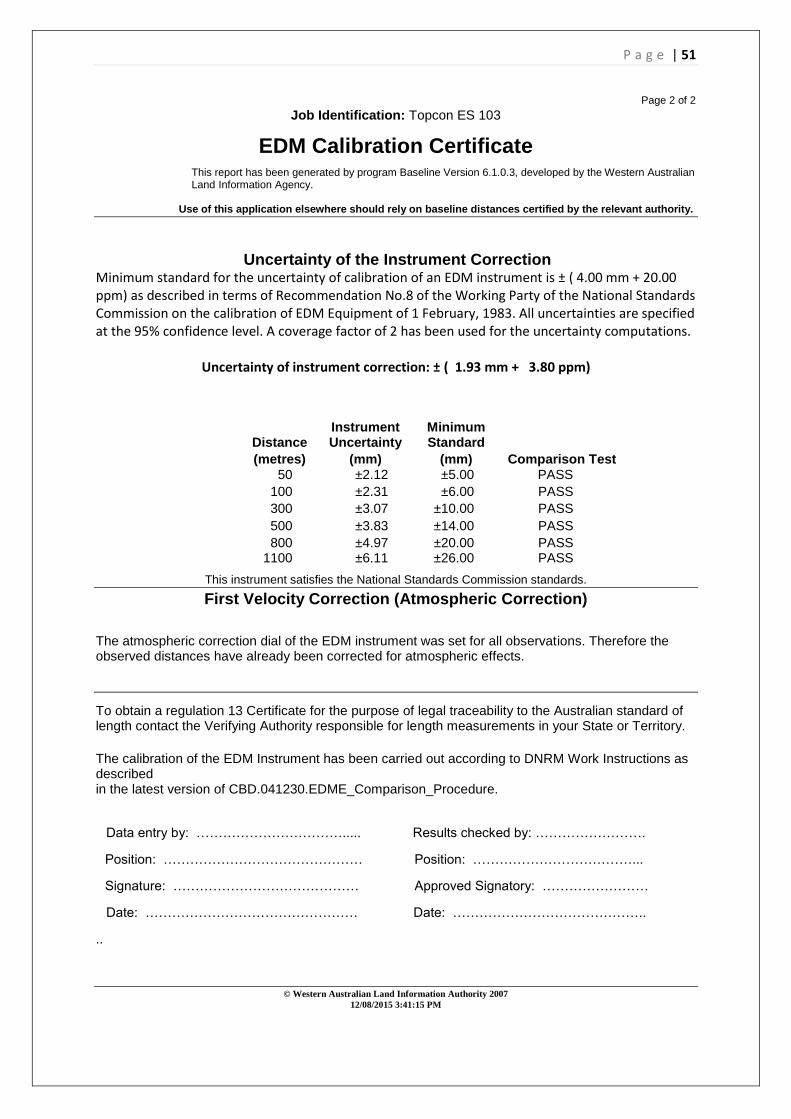
P a g e | 51
Page 2 of 2
Job Identification: Topcon ES 103
EDM Calibration Certificate This report has been generated by program Baseline Version 6.1.0.3, developed by the Western Australian Land Information Agency.
Use of this application elsewhere should rely on baseline distances certified by the relevant authority.
Uncertainty of the Instrument Correction Minimum standard for the uncertainty of calibration of an EDM instrument is ± ( 4.00 mm + 20.00 ppm) as described in terms of Recommendation No.8 of the Working Party of the National Standards Commission on the calibration of EDM Equipment of 1 February, 1983. All uncertainties are specified at the 95% confidence level. A coverage factor of 2 has been used for the uncertainty computations.
Uncertainty of instrument correction: ± ( 1.93 mm + 3.80 ppm)
Instrument Minimum
Distance Uncertainty Standard
(metres) (mm) (mm) Comparison Test
50 ±2.12 ±5.00 PASS
100 ±2.31 ±6.00 PASS
300 ±3.07 ±10.00 PASS
500 ±3.83 ±14.00 PASS
800 ±4.97 ±20.00 PASS
1100 ±6.11 ±26.00 PASS
This instrument satisfies the National Standards Commission standards.
First Velocity Correction (Atmospheric Correction)
The atmospheric correction dial of the EDM instrument was set for all observations. Therefore the observed distances have already been corrected for atmospheric effects.
To obtain a regulation 13 Certificate for the purpose of legal traceability to the Australian standard of length contact the Verifying Authority responsible for length measurements in your State or Territory.
The calibration of the EDM Instrument has been carried out according to DNRM Work Instructions as
described
in the latest version of CBD.041230.EDME_Comparison_Procedure.
Data entry by: ……………………………..... Results checked by: …………………….
Position: ……………………………………… Position: ………………………………...
Signature: …………………………………… Approved Signatory: ……………………
Date: ………………………………………… Date: ……………………………………..
..
© Western Australian Land Information Authority 2007
12/08/2015 3:41:15 PM

P a g e | 52
Appendix F
Page 1 of 2
Job Identification: Topcon ES 103
EDM Calibration Certificate
This report has been generated by program Baseline Version 6.1.0.3, developed by the Western Australian Land Information Agency.
Use of this application elsewhere should rely on baseline distances certified by the relevant authority.
Observation Date: 10/06/2015 Computation Date: 12/08/2015
Instrument Operator: Rhys Pescod Computation Time: 4:02:54 PM
Equipment Details
Instrument Owner: MBRC
Owner Address: Strathpine Office Reflector Make: Sokkia
EDM Instrument Make: Topcon Reflector Model: Zero Const
EDM Instrument Model: ES103 Serial Number:
EDM Serial Number: BR0236 Reflector Constant: 0 mm
Baseline Details
Name CABOOLTURE Location: Dances Rd
Authority: DNRM Last calibration Date: 28/08/2013
Authority Address: Level 4, 33 King St, CABOOLTURE, QLD, 4510 This baseline consists of known lengths, which are the certified distances between the pillars of the baseline. All certified distances are on the same horizontal plane and on the same vertical plane running through the first and last stations.
Instrument Correction (IC) in mm (to be added to the instrument reading)
IC = -2.09 - 0.00606 L
Where L = distance in metres
The reflector constant has been entered into the instrument
CYCLIC ERRORS ARE INSIGNIFICANT
Calibration Parameters Value Uncertainty (95%)
Index -2.09 mm ± 3.00 mm
Scale -3.16 ppm ± 5.07 ppm
The instrument correction has been determined from measurements in the range of 65 to 1149metres
© Western Australian Land Information Authority 2007
12/08/2015 4:02:54 PM

P a g e | 53
Page 2 of 2
Job Identification: Topcon ES 103
EDM Calibration Certificate This report has been generated by program Baseline Version 6.1.0.3, developed by the Western Australian Land Information Agency.
Use of this application elsewhere should rely on baseline distances certified by the relevant authority.
Uncertainty of the Instrument Correction Minimum standard for the uncertainty of calibration of an EDM instrument is ± ( 4.00 mm + 20.00 ppm) as described in terms of Recommendation No.8 of the Working Party of the National Standards Commission on the calibration of EDM Equipment of 1 February, 1983. All uncertainties are specified at the 95% confidence level. A coverage factor of 2 has been used for the uncertainty computations.
Uncertainty of instrument correction: ± ( 1.58 mm + 3.34 ppm)
Instrument Minimum
Distance Uncertainty Standard
(metres) (mm) (mm) Comparison Test
50 ±3.26 ±5.00 PASS
100 ±3.51 ±6.00 PASS
300 ±4.53 ±10.00 PASS
500 ±5.54 ±14.00 PASS
800 ±7.06 ±20.00 PASS
1100 ±8.58 ±26.00 PASS
This instrument satisfies the National Standards Commission standards.
First Velocity Correction (Atmospheric Correction)
The atmospheric correction dial of the EDM instrument was set for all observations. Therefore the observed distances have already been corrected for atmospheric effects.
To obtain a regulation 13 Certificate for the purpose of legal traceability to the Australian standard of length contact the Verifying Authority responsible for length measurements in your State or Territory.
The calibration of the EDM Instrument has been carried out according to DNRM Work Instructions as
described
in the latest version of CBD.041230.EDME_Comparison_Procedure.
Data entry by: ……………………………..... Results checked by: …………………….
Position: ……………………………………… Position: ………………………………...
Signature: …………………………………… Approved Signatory: ……………………
Date: ………………………………………… Date: ……………………………………..
..
© Western Australian Land Information Authority 2007
12/08/2015 4:02:54PM

P a g e | 54
Appendix G
Page 1 of 2
Job Identification: Nikon NPR-362
EDM Calibration Certificate
This report has been generated by program Baseline Version 6.1.0.3, developed by the Western Australian Land Information Agency.
Use of this application elsewhere should rely on baseline distances certified by the relevant authority.
Observation Date: 10/06/2015 Computation Date: 13/08/2015
Instrument Operator: Rhys Pescod Computation Time: 3:31:54 PM
Equipment Details
Instrument Owner: MBRC
Owner Address: Strathpine Office Reflector Make: Sokkia
EDM Instrument Make: Nikon Reflector Model: Zero Const
EDM Instrument Model: NPR-362 Serial Number:
EDM Serial Number: 030031 Reflector Constant: 0 mm
Baseline Details
Name CABOOLTURE Location: Dances Rd
Authority: DNRM Last calibration Date: 28/08/2013
Authority Address: Level 4, 33 King St, CABOOLTURE, QLD, 4510 This baseline consists of known lengths, which are the certified distances between the pillars of the baseline. All certified distances are on the same horizontal plane and on the same vertical plane running through the first and last stations.
Instrument Correction (IC) in mm (to be added to the instrument reading)
IC = -0.90 - 0.00188 L
Where L = distance in metres
The reflector constant has been entered into the instrument
CYCLIC ERRORS ARE INSIGNIFICANT
Calibration Parameters Value Uncertainty (95%)
Index -0.90 mm ± 1.00 mm
Scale -1.88ppm ± 2.00 ppm
The instrument correction has been determined from measurements in the range of 65 to 1149metres
© Western Australian Land Information Authority 2007
13/08/2015 3:31:54 PM
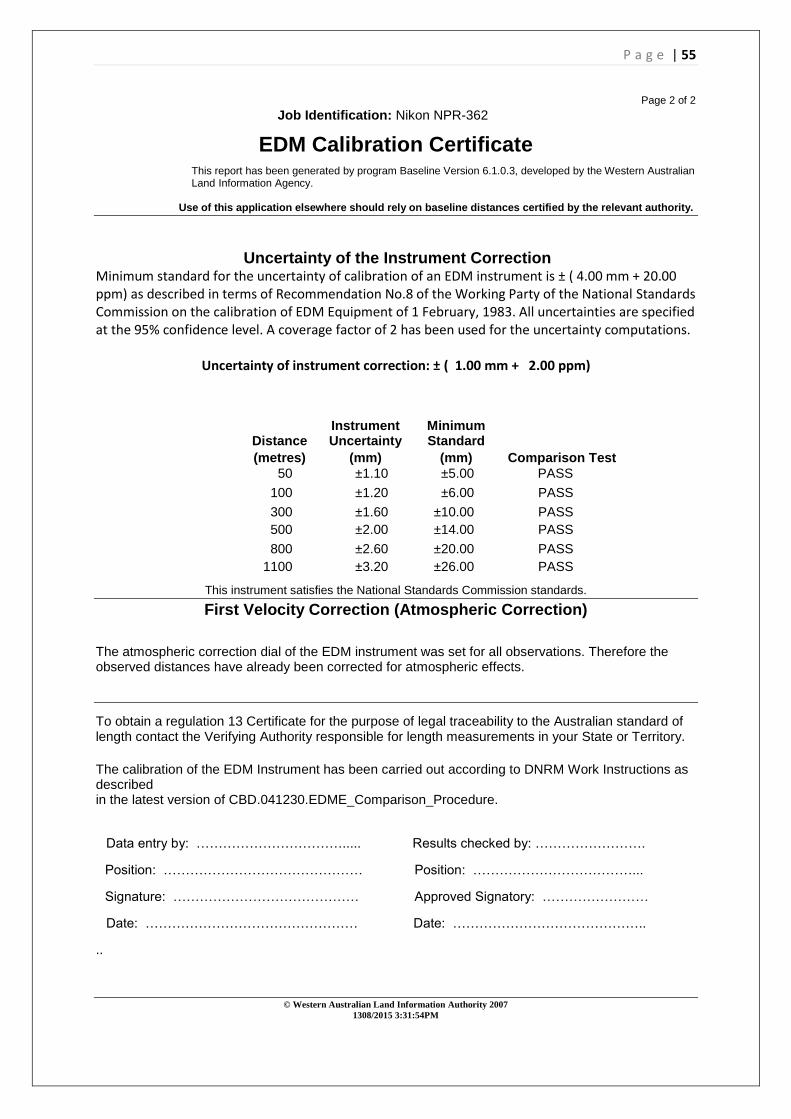
P a g e | 55
Page 2 of 2
Job Identification: Nikon NPR-362
EDM Calibration Certificate This report has been generated by program Baseline Version 6.1.0.3, developed by the Western Australian Land Information Agency.
Use of this application elsewhere should rely on baseline distances certified by the relevant authority.
Uncertainty of the Instrument Correction Minimum standard for the uncertainty of calibration of an EDM instrument is ± ( 4.00 mm + 20.00 ppm) as described in terms of Recommendation No.8 of the Working Party of the National Standards Commission on the calibration of EDM Equipment of 1 February, 1983. All uncertainties are specified at the 95% confidence level. A coverage factor of 2 has been used for the uncertainty computations.
Uncertainty of instrument correction: ± ( 1.00 mm + 2.00 ppm)
Instrument Minimum
Distance Uncertainty Standard
(metres) (mm) (mm) Comparison Test
50 ±1.10 ±5.00 PASS
100 ±1.20 ±6.00 PASS
300 ±1.60 ±10.00 PASS
500 ±2.00 ±14.00 PASS
800 ±2.60 ±20.00 PASS
1100 ±3.20 ±26.00 PASS
This instrument satisfies the National Standards Commission standards.
First Velocity Correction (Atmospheric Correction)
The atmospheric correction dial of the EDM instrument was set for all observations. Therefore the observed distances have already been corrected for atmospheric effects.
To obtain a regulation 13 Certificate for the purpose of legal traceability to the Australian standard of length contact the Verifying Authority responsible for length measurements in your State or Territory.
The calibration of the EDM Instrument has been carried out according to DNRM Work Instructions as
described
in the latest version of CBD.041230.EDME_Comparison_Procedure.
Data entry by: ……………………………..... Results checked by: …………………….
Position: ……………………………………… Position: ………………………………...
Signature: …………………………………… Approved Signatory: ……………………
Date: ………………………………………… Date: ……………………………………..
..
© Western Australian Land Information Authority 2007
1308/2015 3:31:54PM

P a g e | 56
Appendix H
Page 1 of 2
Job Identification: Nikon NPR-362
EDM Calibration Certificate
This report has been generated by program Baseline Version 6.1.0.3, developed by the Western Australian Land Information Agency.
Use of this application elsewhere should rely on baseline distances certified by the relevant authority.
Observation Date: 10/06/2015 Computation Date: 13/08/2015
Instrument Operator: Rhys Pescod Computation Time: 3:38:44 PM
Equipment Details
Instrument Owner: MBRC
Owner Address: Strathpine Office Reflector Make: Sokkia
EDM Instrument Make: Nikon Reflector Model: Zero Const
EDM Instrument Model: NPR-362 Serial Number:
EDM Serial Number: 030031 Reflector Constant: 0 mm
Baseline Details
Name CABOOLTURE Location: Dances Rd
Authority: DNRM Last calibration Date: 28/08/2013
Authority Address: Level 4, 33 King St, CABOOLTURE, QLD, 4510 This baseline consists of known lengths, which are the certified distances between the pillars of the baseline. All certified distances are on the same horizontal plane and on the same vertical plane running through the first and last stations.
Instrument Correction (IC) in mm (to be added to the instrument reading)
IC = -0.79 - 0.00160 L
Where L = distance in metres
The reflector constant has been entered into the instrument
CYCLIC ERRORS ARE INSIGNIFICANT
Calibration Parameters Value Uncertainty (95%)
Index -0.79 mm ± 1.00 mm
Scale -1.60ppm ± 2.00 ppm
The instrument correction has been determined from measurements in the range of 65 to 1149metres
© Western Australian Land Information Authority 2007
13/08/2015 3:38:44 PM

P a g e | 57
Page 2 of 2
Job Identification: Nikon NPR-362
EDM Calibration Certificate This report has been generated by program Baseline Version 6.1.0.3, developed by the Western Australian Land Information Agency.
Use of this application elsewhere should rely on baseline distances certified by the relevant authority.
Uncertainty of the Instrument Correction Minimum standard for the uncertainty of calibration of an EDM instrument is ± ( 4.00 mm + 20.00 ppm) as described in terms of Recommendation No.8 of the Working Party of the National Standards Commission on the calibration of EDM Equipment of 1 February, 1983. All uncertainties are specified at the 95% confidence level. A coverage factor of 2 has been used for the uncertainty computations.
Uncertainty of instrument correction: ± ( 1.00 mm + 2.00 ppm)
Instrument Minimum
Distance Uncertainty Standard
(metres) (mm) (mm) Comparison Test
50 ±1.10 ±5.00 PASS
100 ±1.20 ±6.00 PASS
300 ±1.60 ±10.00 PASS
500 ±2.00 ±14.00 PASS
800 ±2.60 ±20.00 PASS
1100 ±3.20 ±26.00 PASS
This instrument satisfies the National Standards Commission standards.
First Velocity Correction (Atmospheric Correction)
The atmospheric correction dial of the EDM instrument was set for all observations. Therefore the observed distances have already been corrected for atmospheric effects.
To obtain a regulation 13 Certificate for the purpose of legal traceability to the Australian standard of length contact the Verifying Authority responsible for length measurements in your State or Territory.
The calibration of the EDM Instrument has been carried out according to DNRM Work Instructions as
described
in the latest version of CBD.041230.EDME_Comparison_Procedure.
Data entry by: ……………………………..... Results checked by: …………………….
Position: ……………………………………… Position: ………………………………...
Signature: …………………………………… Approved Signatory: ……………………
Date: ………………………………………… Date: ……………………………………..
..
© Western Australian Land Information Authority 2007
1308/2015 3:38:44PM

P a g e | 58
Appendix I
Page 1 of 2
Job Identification: Nikon NPR-362
EDM Calibration Certificate
This report has been generated by program Baseline Version 6.1.0.3, developed by the Western Australian Land Information Agency.
Use of this application elsewhere should rely on baseline distances certified by the relevant authority.
Observation Date: 10/06/2015 Computation Date: 13/08/2015
Instrument Operator: Rhys Pescod Computation Time: 3:51:51 PM
Equipment Details
Instrument Owner: MBRC
Owner Address: Strathpine Office Reflector Make: Sokkia
EDM Instrument Make: Nikon Reflector Model: Zero Const
EDM Instrument Model: NPR-362 Serial Number:
EDM Serial Number: 030031 Reflector Constant: 0 mm
Baseline Details
Name CABOOLTURE Location: Dances Rd
Authority: DNRM Last calibration Date: 28/08/2013
Authority Address: Level 4, 33 King St, CABOOLTURE, QLD, 4510 This baseline consists of known lengths, which are the certified distances between the pillars of the baseline. All certified distances are on the same horizontal plane and on the same vertical plane running through the first and last stations.
Instrument Correction (IC) in mm (to be added to the instrument reading)
IC = -0.66 - 0.00230 L
Where L = distance in metres
The reflector constant has been entered into the instrument
CYCLIC ERRORS ARE INSIGNIFICANT
Calibration Parameters Value Uncertainty (95%)
Index -0.66 mm ± 1.31 mm
Scale -2.30ppm ± 2.57 ppm
The instrument correction has been determined from measurements in the range of 65 to 1149metres
© Western Australian Land Information Authority 2007
13/08/2015 3:51:51 PM

P a g e | 59
Page 2 of 2
Job Identification: Nikon NPR-362
EDM Calibration Certificate This report has been generated by program Baseline Version 6.1.0.3, developed by the Western Australian Land Information Agency.
Use of this application elsewhere should rely on baseline distances certified by the relevant authority.
Uncertainty of the Instrument Correction Minimum standard for the uncertainty of calibration of an EDM instrument is ± ( 4.00 mm + 20.00 ppm) as described in terms of Recommendation No.8 of the Working Party of the National Standards Commission on the calibration of EDM Equipment of 1 February, 1983. All uncertainties are specified at the 95% confidence level. A coverage factor of 2 has been used for the uncertainty computations.
Uncertainty of instrument correction: ± ( 1.31 mm + 2.57 ppm)
Instrument Minimum
Distance Uncertainty Standard
(metres) (mm) (mm) Comparison Test
50 ±1.44 ±5.00 PASS
100 ±1.56 ±6.00 PASS
300 ±2.08 ±10.00 PASS
500 ±2.59 ±14.00 PASS
800 ±3.36 ±20.00 PASS
1100 ±4.13 ±26.00 PASS
This instrument satisfies the National Standards Commission standards.
First Velocity Correction (Atmospheric Correction)
The atmospheric correction dial of the EDM instrument was set for all observations. Therefore the observed distances have already been corrected for atmospheric effects.
To obtain a regulation 13 Certificate for the purpose of legal traceability to the Australian standard of length contact the Verifying Authority responsible for length measurements in your State or Territory.
The calibration of the EDM Instrument has been carried out according to DNRM Work Instructions as
described
in the latest version of CBD.041230.EDME_Comparison_Procedure.
Data entry by: ……………………………..... Results checked by: …………………….
Position: ……………………………………… Position: ………………………………...
Signature: …………………………………… Approved Signatory: ……………………
Date: ………………………………………… Date: ……………………………………..
..
© Western Australian Land Information Authority 2007
1308/2015 3:51:51PM

P a g e | 60
Appendix J
Page 1 of 2
Job Identification: Nikon NPR-362
EDM Calibration Certificate
This report has been generated by program Baseline Version 6.1.0.3, developed by the Western Australian Land Information Agency.
Use of this application elsewhere should rely on baseline distances certified by the relevant authority.
Observation Date: 10/06/2015 Computation Date: 13/08/2015
Instrument Operator: Rhys Pescod Computation Time: 4:14:19 PM
Equipment Details
Instrument Owner: MBRC
Owner Address: Strathpine Office Reflector Make: Sokkia
EDM Instrument Make: Nikon Reflector Model: Zero Const
EDM Instrument Model: NPR-362 Serial Number:
EDM Serial Number: 030031 Reflector Constant: 0 mm
Baseline Details
Name CABOOLTURE Location: Dances Rd
Authority: DNRM Last calibration Date: 28/08/2013
Authority Address: Level 4, 33 King St, CABOOLTURE, QLD, 4510 This baseline consists of known lengths, which are the certified distances between the pillars of the baseline. All certified distances are on the same horizontal plane and on the same vertical plane running through the first and last stations.
Instrument Correction (IC) in mm (to be added to the instrument reading)
IC = -0.34 - 0.00248 L
Where L = distance in metres
The reflector constant has been entered into the instrument
CYCLIC ERRORS ARE INSIGNIFICANT
Calibration Parameters Value Uncertainty (95%)
Index -0.34 mm ± 2.26 mm
Scale -2.48ppm ± 3.82 ppm
The instrument correction has been determined from measurements in the range of 65 to 1149metres
© Western Australian Land Information Authority 2007
13/08/2015 4:14:19 PM

P a g e | 61
Page 2 of 2
Job Identification: Nikon NPR-362
EDM Calibration Certificate This report has been generated by program Baseline Version 6.1.0.3, developed by the Western Australian Land Information Agency.
Use of this application elsewhere should rely on baseline distances certified by the relevant authority.
Uncertainty of the Instrument Correction Minimum standard for the uncertainty of calibration of an EDM instrument is ± ( 4.00 mm + 20.00 ppm) as described in terms of Recommendation No.8 of the Working Party of the National Standards Commission on the calibration of EDM Equipment of 1 February, 1983. All uncertainties are specified at the 95% confidence level. A coverage factor of 2 has been used for the uncertainty computations.
Uncertainty of instrument correction: ± ( 2.26 mm + 3.82 ppm)
Instrument Minimum
Distance Uncertainty Standard
(metres) (mm) (mm) Comparison Test
50 ±1.44 ±5.00 PASS
100 ±1.56 ±6.00 PASS
300 ±2.08 ±10.00 PASS
500 ±2.59 ±14.00 PASS
800 ±3.36 ±20.00 PASS
1100 ±4.13 ±26.00 PASS
This instrument satisfies the National Standards Commission standards.
First Velocity Correction (Atmospheric Correction)
The atmospheric correction dial of the EDM instrument was set for all observations. Therefore the observed distances have already been corrected for atmospheric effects.
To obtain a regulation 13 Certificate for the purpose of legal traceability to the Australian standard of length contact the Verifying Authority responsible for length measurements in your State or Territory.
The calibration of the EDM Instrument has been carried out according to DNRM Work Instructions as
described
in the latest version of CBD.041230.EDME_Comparison_Procedure.
Data entry by: ……………………………..... Results checked by: …………………….
Position: ……………………………………… Position: ………………………………...
Signature: …………………………………… Approved Signatory: ……………………
Date: ………………………………………… Date: ……………………………………..
..
© Western Australian Land Information Authority 2007
1308/2015 4:14:19PM

P a g e | 62
Appendix K
Page 1 of 2
Job Identification: Leica TS-15
EDM Calibration Certificate
This report has been generated by program Baseline Version 6.1.0.3, developed by the Western Australian Land Information Agency.
Use of this application elsewhere should rely on baseline distances certified by the relevant authority.
Observation Date: 10/06/2015 Computation Date: 14/08/2015
Instrument Operator: Rhys Pescod Computation Time: 2:20:41 PM
Equipment Details
Instrument Owner: MBRC
Owner Address: Strathpine Office Reflector Make: Sokkia
EDM Instrument Make: Leica Reflector Model: Zero Const
EDM Instrument Model: TS-15 Serial Number:
EDM Serial Number: 360168 Reflector Constant: 0 mm
Baseline Details
Name CABOOLTURE Location: Dances Rd
Authority: DNRM Last calibration Date: 28/08/2013
Authority Address: Level 4, 33 King St, CABOOLTURE, QLD, 4510 This baseline consists of known lengths, which are the certified distances between the pillars of the baseline. All certified distances are on the same horizontal plane and on the same vertical plane running through the first and last stations.
Instrument Correction (IC) in mm (to be added to the instrument reading)
IC = -3.25- 0.00043 L
Where L = distance in metres
The reflector constant has been entered into the instrument
CYCLIC ERRORS ARE INSIGNIFICANT
Calibration Parameters Value Uncertainty (95%)
Index -3.25 mm ± 1.00 mm
Scale -0.43ppm ± 2.00 ppm
The instrument correction has been determined from measurements in the range of 65 to 1149metres
© Western Australian Land Information Authority 2007
13/08/2015 2:20:41 PM

P a g e | 63
Page 2 of 2
Job Identification: Leica TS-15
EDM Calibration Certificate This report has been generated by program Baseline Version 6.1.0.3, developed by the Western Australian Land Information Agency.
Use of this application elsewhere should rely on baseline distances certified by the relevant authority.
Uncertainty of the Instrument Correction Minimum standard for the uncertainty of calibration of an EDM instrument is ± ( 4.00 mm + 20.00 ppm) as described in terms of Recommendation No.8 of the Working Party of the National Standards Commission on the calibration of EDM Equipment of 1 February, 1983. All uncertainties are specified at the 95% confidence level. A coverage factor of 2 has been used for the uncertainty computations.
Uncertainty of instrument correction: ± ( 1.00 mm + 2.00 ppm)
Instrument Minimum
Distance Uncertainty Standard
(metres) (mm) (mm) Comparison Test
50 ±1.10 ±5.00 PASS
100 ±1.20 ±6.00 PASS
300 ±1.60 ±10.00 PASS
500 ±2.00 ±14.00 PASS
800 ±2.60 ±20.00 PASS
1100 ±3.20 ±26.00 PASS
This instrument satisfies the National Standards Commission standards.
First Velocity Correction (Atmospheric Correction)
The atmospheric correction dial of the EDM instrument was set for all observations. Therefore the observed distances have already been corrected for atmospheric effects.
To obtain a regulation 13 Certificate for the purpose of legal traceability to the Australian standard of length contact the Verifying Authority responsible for length measurements in your State or Territory.
The calibration of the EDM Instrument has been carried out according to DNRM Work Instructions as
described
in the latest version of CBD.041230.EDME_Comparison_Procedure.
Data entry by: ……………………………..... Results checked by: …………………….
Position: ……………………………………… Position: ………………………………...
Signature: …………………………………… Approved Signatory: ……………………
Date: ………………………………………… Date: ……………………………………..
..
© Western Australian Land Information Authority 2007
1308/2015 2:20:41PM

P a g e | 64
Appendix L
Page 1 of 2
Job Identification: Leica TS-15
EDM Calibration Certificate
This report has been generated by program Baseline Version 6.1.0.3, developed by the Western Australian Land Information Agency.
Use of this application elsewhere should rely on baseline distances certified by the relevant authority.
Observation Date: 10/06/2015 Computation Date: 14/08/2015
Instrument Operator: Rhys Pescod Computation Time: 2:44:18 PM
Equipment Details
Instrument Owner: MBRC
Owner Address: Strathpine Office Reflector Make: Sokkia
EDM Instrument Make: Leica Reflector Model: Zero Const
EDM Instrument Model: TS-15 Serial Number:
EDM Serial Number: 360168 Reflector Constant: 0 mm
Baseline Details
Name CABOOLTURE Location: Dances Rd
Authority: DNRM Last calibration Date: 28/08/2013
Authority Address: Level 4, 33 King St, CABOOLTURE, QLD, 4510 This baseline consists of known lengths, which are the certified distances between the pillars of the baseline. All certified distances are on the same horizontal plane and on the same vertical plane running through the first and last stations.
Instrument Correction (IC) in mm (to be added to the instrument reading)
IC = -3.24- 0.00098 L
Where L = distance in metres
The reflector constant has been entered into the instrument
CYCLIC ERRORS ARE INSIGNIFICANT
Calibration Parameters Value Uncertainty (95%)
Index -3.24 mm ± 1.00 mm
Scale -0.98ppm ± 2.00 ppm
The instrument correction has been determined from measurements in the range of 65 to 1149metres
© Western Australian Land Information Authority 2007
13/08/2015 2:44:18 PM

P a g e | 65
Page 2 of 2
Job Identification: Leica TS-15
EDM Calibration Certificate This report has been generated by program Baseline Version 6.1.0.3, developed by the Western Australian Land Information Agency.
Use of this application elsewhere should rely on baseline distances certified by the relevant authority.
Uncertainty of the Instrument Correction Minimum standard for the uncertainty of calibration of an EDM instrument is ± ( 4.00 mm + 20.00 ppm) as described in terms of Recommendation No.8 of the Working Party of the National Standards Commission on the calibration of EDM Equipment of 1 February, 1983. All uncertainties are specified at the 95% confidence level. A coverage factor of 2 has been used for the uncertainty computations.
Uncertainty of instrument correction: ± ( 1.00 mm + 2.00 ppm)
Instrument Minimum
Distance Uncertainty Standard
(metres) (mm) (mm) Comparison Test
50 ±1.10 ±5.00 PASS
100 ±1.20 ±6.00 PASS
300 ±1.60 ±10.00 PASS
500 ±2.00 ±14.00 PASS
800 ±2.60 ±20.00 PASS
1100 ±3.20 ±26.00 PASS
This instrument satisfies the National Standards Commission standards.
First Velocity Correction (Atmospheric Correction)
The atmospheric correction dial of the EDM instrument was set for all observations. Therefore the observed distances have already been corrected for atmospheric effects.
To obtain a regulation 13 Certificate for the purpose of legal traceability to the Australian standard of length contact the Verifying Authority responsible for length measurements in your State or Territory.
The calibration of the EDM Instrument has been carried out according to DNRM Work Instructions as
described
in the latest version of CBD.041230.EDME_Comparison_Procedure.
Data entry by: ……………………………..... Results checked by: …………………….
Position: ……………………………………… Position: ………………………………...
Signature: …………………………………… Approved Signatory: ……………………
Date: ………………………………………… Date: ……………………………………..
..
© Western Australian Land Information Authority 2007
1308/2015 2:44:18PM

P a g e | 66
Appendix M
Page 1 of 2
Job Identification: Leica TS-15
EDM Calibration Certificate
This report has been generated by program Baseline Version 6.1.0.3, developed by the Western Australian Land Information Agency.
Use of this application elsewhere should rely on baseline distances certified by the relevant authority.
Observation Date: 10/06/2015 Computation Date: 14/08/2015
Instrument Operator: Rhys Pescod Computation Time: 3:11:30 PM
Equipment Details
Instrument Owner: MBRC
Owner Address: Strathpine Office Reflector Make: Sokkia
EDM Instrument Make: Leica Reflector Model: Zero Const
EDM Instrument Model: TS-15 Serial Number:
EDM Serial Number: 360168 Reflector Constant: 0 mm
Baseline Details
Name CABOOLTURE Location: Dances Rd
Authority: DNRM Last calibration Date: 28/08/2013
Authority Address: Level 4, 33 King St, CABOOLTURE, QLD, 4510 This baseline consists of known lengths, which are the certified distances between the pillars of the baseline. All certified distances are on the same horizontal plane and on the same vertical plane running through the first and last stations.
Instrument Correction (IC) in mm (to be added to the instrument reading)
IC = -3.43- 0.00043 L
Where L = distance in metres
The reflector constant has been entered into the instrument
CYCLIC ERRORS ARE INSIGNIFICANT
Calibration Parameters Value Uncertainty (95%)
Index -3.43 mm ± 1.14 mm
Scale -0.43ppm ± 2.25 ppm
The instrument correction has been determined from measurements in the range of 65 to 1149metres
© Western Australian Land Information Authority 2007
13/08/2015 3:11:30 PM

P a g e | 67
Page 2 of 2
Job Identification: Leica TS-15
EDM Calibration Certificate This report has been generated by program Baseline Version 6.1.0.3, developed by the Western Australian Land Information Agency.
Use of this application elsewhere should rely on baseline distances certified by the relevant authority.
Uncertainty of the Instrument Correction Minimum standard for the uncertainty of calibration of an EDM instrument is ± ( 4.00 mm + 20.00 ppm) as described in terms of Recommendation No.8 of the Working Party of the National Standards Commission on the calibration of EDM Equipment of 1 February, 1983. All uncertainties are specified at the 95% confidence level. A coverage factor of 2 has been used for the uncertainty computations.
Uncertainty of instrument correction: ± ( 1.14mm + 2.25 ppm)
Instrument Minimum
Distance Uncertainty Standard
(metres) (mm) (mm) Comparison Test
50 ±1.26 ±5.00 PASS
100 ±1.37 ±6.00 PASS
300 ±1.82 ±10.00 PASS
500 ±2.27 ±14.00 PASS
800 ±2.94 ±20.00 PASS
1100 ±3.61 ±26.00 PASS
This instrument satisfies the National Standards Commission standards.
First Velocity Correction (Atmospheric Correction)
The atmospheric correction dial of the EDM instrument was set for all observations. Therefore the observed distances have already been corrected for atmospheric effects.
To obtain a regulation 13 Certificate for the purpose of legal traceability to the Australian standard of length contact the Verifying Authority responsible for length measurements in your State or Territory.
The calibration of the EDM Instrument has been carried out according to DNRM Work Instructions as
described
in the latest version of CBD.041230.EDME_Comparison_Procedure.
Data entry by: ……………………………..... Results checked by: …………………….
Position: ……………………………………… Position: ………………………………...
Signature: …………………………………… Approved Signatory: ……………………
Date: ………………………………………… Date: ……………………………………..
..
© Western Australian Land Information Authority 2007
1308/2015 3:11:30PM

P a g e | 68
Appendix N
Page 1 of 2
Job Identification: Leica TS-15
EDM Calibration Certificate
This report has been generated by program Baseline Version 6.1.0.3, developed by the Western Australian Land Information Agency.
Use of this application elsewhere should rely on baseline distances certified by the relevant authority.
Observation Date: 10/06/2015 Computation Date: 14/08/2015
Instrument Operator: Rhys Pescod Computation Time: 3:38:20 PM
Equipment Details
Instrument Owner: MBRC
Owner Address: Strathpine Office Reflector Make: Sokkia
EDM Instrument Make: Leica Reflector Model: Zero Const
EDM Instrument Model: TS-15 Serial Number:
EDM Serial Number: 360168 Reflector Constant: 0 mm
Baseline Details
Name CABOOLTURE Location: Dances Rd
Authority: DNRM Last calibration Date: 28/08/2013
Authority Address: Level 4, 33 King St, CABOOLTURE, QLD, 4510 This baseline consists of known lengths, which are the certified distances between the pillars of the baseline. All certified distances are on the same horizontal plane and on the same vertical plane running through the first and last stations.
Instrument Correction (IC) in mm (to be added to the instrument reading)
IC = -2.81- 0.00035 L
Where L = distance in metres
The reflector constant has been entered into the instrument
CYCLIC ERRORS ARE INSIGNIFICANT
Calibration Parameters Value Uncertainty (95%)
Index -2.81 mm ± 2.01 mm
Scale -0.65pm ± 3.40 ppm
The instrument correction has been determined from measurements in the range of 65 to 1149metres
© Western Australian Land Information Authority 2007
13/08/2015 3:38:20 PM

P a g e | 69
Page 2 of 2
Job Identification: Leica TS-15
EDM Calibration Certificate This report has been generated by program Baseline Version 6.1.0.3, developed by the Western Australian Land Information Agency.
Use of this application elsewhere should rely on baseline distances certified by the relevant authority.
Uncertainty of the Instrument Correction Minimum standard for the uncertainty of calibration of an EDM instrument is ± ( 4.00 mm + 20.00 ppm) as described in terms of Recommendation No.8 of the Working Party of the National Standards Commission on the calibration of EDM Equipment of 1 February, 1983. All uncertainties are specified at the 95% confidence level. A coverage factor of 2 has been used for the uncertainty computations.
Uncertainty of instrument correction: ± ( 1.14mm + 2.25 ppm)
Instrument Minimum
Distance Uncertainty Standard
(metres) (mm) (mm) Comparison Test
50 ±1.26 ±5.00 PASS
100 ±1.37 ±6.00 PASS
300 ±1.82 ±10.00 PASS
500 ±2.27 ±14.00 PASS
800 ±2.94 ±20.00 PASS
1100 ±3.61 ±26.00 PASS
This instrument satisfies the National Standards Commission standards.
First Velocity Correction (Atmospheric Correction)
The atmospheric correction dial of the EDM instrument was set for all observations. Therefore the observed distances have already been corrected for atmospheric effects.
To obtain a regulation 13 Certificate for the purpose of legal traceability to the Australian standard of length contact the Verifying Authority responsible for length measurements in your State or Territory.
The calibration of the EDM Instrument has been carried out according to DNRM Work Instructions as
described
in the latest version of CBD.041230.EDME_Comparison_Procedure.
Data entry by: ……………………………..... Results checked by: …………………….
Position: ……………………………………… Position: ………………………………...
Signature: …………………………………… Approved Signatory: ……………………
Date: ………………………………………… Date: ……………………………………..
..
© Western Australian Land Information Authority 2007
1308/2015 3:38:20PM

P a g e | 70
Appendix O
Page 1 of 2
Job Identification: Leica TS-15
EDM Calibration Certificate
This report has been generated by program Baseline Version 6.1.0.3, developed by the Western Australian Land Information Agency.
Use of this application elsewhere should rely on baseline distances certified by the relevant authority.
Observation Date: 10/06/2015 Computation Date: 12/09/2015
Instrument Operator: Rhys Pescod Computation Time: 2:15:20 PM
Equipment Details
Instrument Owner: MBRC
Owner Address: Strathpine Office Reflector Make: Sokkia
EDM Instrument Make: Leica Reflector Model: Zero Const
EDM Instrument Model: TS-15 Serial Number:
EDM Serial Number: 360168 Reflector Constant: 0 mm
Baseline Details
Name CABOOLTURE Location: Dances Rd
Authority: DNRM Last calibration Date: 28/08/2013
Authority Address: Level 4, 33 King St, CABOOLTURE, QLD, 4510 This baseline consists of known lengths, which are the certified distances between the pillars of the baseline. All certified distances are on the same horizontal plane and on the same vertical plane running through the first and last stations.
Instrument Correction (IC) in mm (to be added to the instrument reading)
IC = -3.36- 0.00568 L
Where L = distance in metres
The reflector constant has been entered into the instrument
CYCLIC ERRORS ARE INSIGNIFICANT
Calibration Parameters Value Uncertainty (95%)
Index -3.36 mm ± 1.13 mm
Scale -0.65pm ± 3.05 ppm
The instrument correction has been determined from measurements in the range of 65 to 1149metres
© Western Australian Land Information Authority 2007
12/09/2015 2:15:20 PM

P a g e | 71
Page 2 of 2
Job Identification: Topcon ES 103
EDM Calibration Certificate This report has been generated by program Baseline Version 6.1.0.3, developed by the Western Australian Land Information Agency.
Use of this application elsewhere should rely on baseline distances certified by the relevant authority.
Uncertainty of the Instrument Correction Minimum standard for the uncertainty of calibration of an EDM instrument is ± ( 4.00 mm + 20.00 ppm) as described in terms of Recommendation No.8 of the Working Party of the National Standards Commission on the calibration of EDM Equipment of 1 February, 1983. All uncertainties are specified at the 95% confidence level. A coverage factor of 2 has been used for the uncertainty computations.
Uncertainty of instrument correction: ± ( 1.14mm + 2.25 ppm)
Instrument Minimum
Distance Uncertainty Standard
(metres) (mm) (mm) Comparison Test
50 ±1.28 ±5.00 PASS
100 ±1.43 ±6.00 PASS
300 ±2.04 ±10.00 PASS
500 ±2.65 ±14.00 PASS
800 ±3.57 ±20.00 PASS
1100 ±4.48 ±26.00 PASS
This instrument satisfies the National Standards Commission standards.
First Velocity Correction (Atmospheric Correction)
The atmospheric correction dial of the EDM instrument was set for all observations. Therefore the observed distances have already been corrected for atmospheric effects.
To obtain a regulation 13 Certificate for the purpose of legal traceability to the Australian standard of length contact the Verifying Authority responsible for length measurements in your State or Territory.
The calibration of the EDM Instrument has been carried out according to DNRM Work Instructions as
described
in the latest version of CBD.041230.EDME_Comparison_Procedure.
Data entry by: ……………………………..... Results checked by: …………………….
Position: ……………………………………… Position: ………………………………...
Signature: …………………………………… Approved Signatory: ……………………
Date: ………………………………………… Date: ……………………………………..
..
© Western Australian Land Information Authority 2007
12/09/2015 2:15:20PM

P a g e | 72
Appendix P
Page 1 of 2
Job Identification: Nikon NPR-362
EDM Calibration Certificate
This report has been generated by program Baseline Version 6.1.0.3, developed by the Western Australian Land Information Agency.
Use of this application elsewhere should rely on baseline distances certified by the relevant authority.
Observation Date: 10/06/2015 Computation Date: 12/09/2015
Instrument Operator: Rhys Pescod Computation Time: 2:31:40 PM
Equipment Details
Instrument Owner: MBRC
Owner Address: Strathpine Office Reflector Make: Sokkia
EDM Instrument Make: Nikon Reflector Model: Zero Const
EDM Instrument Model: NPR-362 Serial Number:
EDM Serial Number: 030031 Reflector Constant: 0 mm
Baseline Details
Name CABOOLTURE Location: Dances Rd
Authority: DNRM Last calibration Date: 28/08/2013
Authority Address: Level 4, 33 King St, CABOOLTURE, QLD, 4510 This baseline consists of known lengths, which are the certified distances between the pillars of the baseline. All certified distances are on the same horizontal plane and on the same vertical plane running through the first and last stations.
Instrument Correction (IC) in mm (to be added to the instrument reading)
IC = -0.26- 0.00504 L
Where L = distance in metres
The reflector constant has been entered into the instrument
CYCLIC ERRORS ARE INSIGNIFICANT
Calibration Parameters Value Uncertainty (95%)
Index -0.26 mm ± 1.01 mm
Scale -5.04 ppm ± 2.92 ppm
The instrument correction has been determined from measurements in the range of 65 to 1149metres
© Western Australian Land Information Authority 2007
12/09/2015 2:31:40 PM
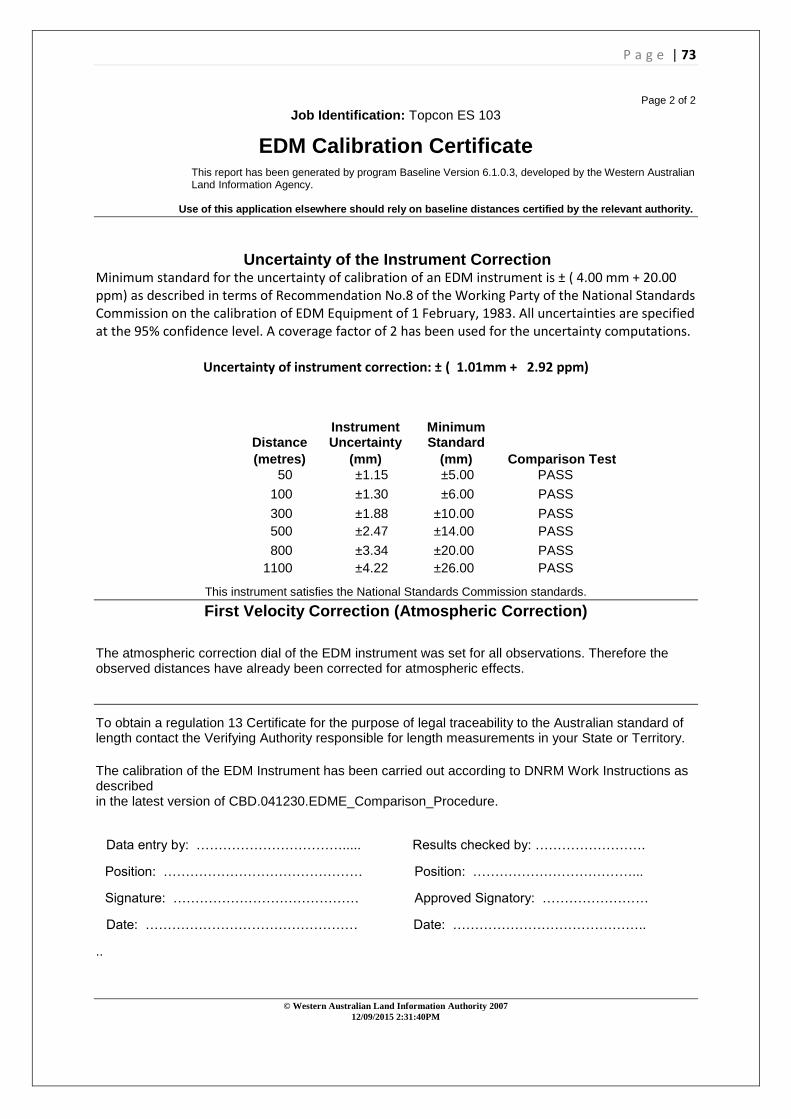
P a g e | 73
Page 2 of 2
Job Identification: Topcon ES 103
EDM Calibration Certificate This report has been generated by program Baseline Version 6.1.0.3, developed by the Western Australian Land Information Agency.
Use of this application elsewhere should rely on baseline distances certified by the relevant authority.
Uncertainty of the Instrument Correction Minimum standard for the uncertainty of calibration of an EDM instrument is ± ( 4.00 mm + 20.00 ppm) as described in terms of Recommendation No.8 of the Working Party of the National Standards Commission on the calibration of EDM Equipment of 1 February, 1983. All uncertainties are specified at the 95% confidence level. A coverage factor of 2 has been used for the uncertainty computations.
Uncertainty of instrument correction: ± ( 1.01mm + 2.92 ppm)
Instrument Minimum
Distance Uncertainty Standard
(metres) (mm) (mm) Comparison Test
50 ±1.15 ±5.00 PASS
100 ±1.30 ±6.00 PASS
300 ±1.88 ±10.00 PASS
500 ±2.47 ±14.00 PASS
800 ±3.34 ±20.00 PASS
1100 ±4.22 ±26.00 PASS
This instrument satisfies the National Standards Commission standards.
First Velocity Correction (Atmospheric Correction)
The atmospheric correction dial of the EDM instrument was set for all observations. Therefore the observed distances have already been corrected for atmospheric effects.
To obtain a regulation 13 Certificate for the purpose of legal traceability to the Australian standard of length contact the Verifying Authority responsible for length measurements in your State or Territory.
The calibration of the EDM Instrument has been carried out according to DNRM Work Instructions as
described
in the latest version of CBD.041230.EDME_Comparison_Procedure.
Data entry by: ……………………………..... Results checked by: …………………….
Position: ……………………………………… Position: ………………………………...
Signature: …………………………………… Approved Signatory: ……………………
Date: ………………………………………… Date: ……………………………………..
..
© Western Australian Land Information Authority 2007
12/09/2015 2:31:40PM
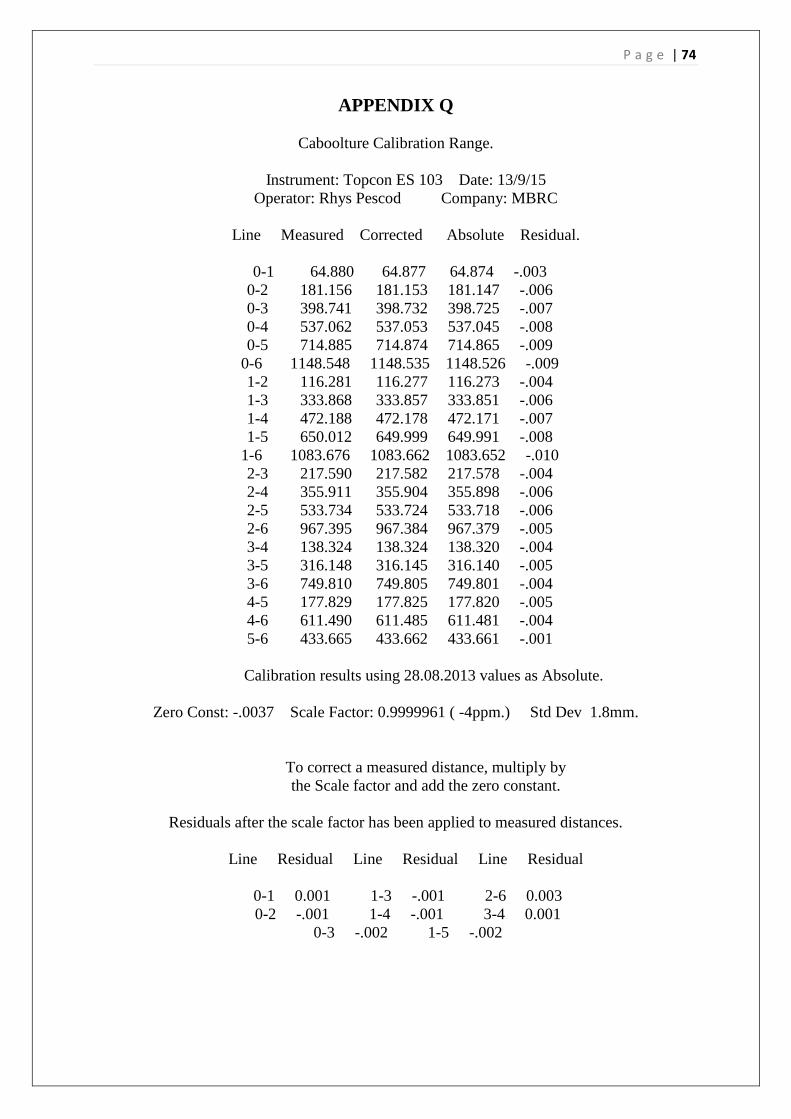
P a g e | 74
APPENDIX Q
Caboolture Calibration Range.
Instrument: Topcon ES 103 Date: 13/9/15
Operator: Rhys Pescod Company: MBRC
Line Measured Corrected Absolute Residual.
0-1 64.880 64.877 64.874 -.003
0-2 181.156 181.153 181.147 -.006
0-3 398.741 398.732 398.725 -.007
0-4 537.062 537.053 537.045 -.008
0-5 714.885 714.874 714.865 -.009
0-6 1148.548 1148.535 1148.526 -.009
1-2 116.281 116.277 116.273 -.004
1-3 333.868 333.857 333.851 -.006
1-4 472.188 472.178 472.171 -.007
1-5 650.012 649.999 649.991 -.008
1-6 1083.676 1083.662 1083.652 -.010
2-3 217.590 217.582 217.578 -.004
2-4 355.911 355.904 355.898 -.006
2-5 533.734 533.724 533.718 -.006
2-6 967.395 967.384 967.379 -.005
3-4 138.324 138.324 138.320 -.004
3-5 316.148 316.145 316.140 -.005
3-6 749.810 749.805 749.801 -.004
4-5 177.829 177.825 177.820 -.005
4-6 611.490 611.485 611.481 -.004
5-6 433.665 433.662 433.661 -.001
Calibration results using 28.08.2013 values as Absolute.
Zero Const: -.0037 Scale Factor: 0.9999961 ( -4ppm.) Std Dev 1.8mm.
To correct a measured distance, multiply by
the Scale factor and add the zero constant.
Residuals after the scale factor has been applied to measured distances.
Line Residual Line Residual Line Residual
0-1 0.001 1-3 -.001 2-6 0.003
0-2 -.001 1-4 -.001 3-4 0.001
0-3 -.002 1-5 -.002

P a g e | 75
APPENDIX R
Caboolture Calibration Range.
Instrument: Nikon NPR-362 Date: 13/9/15
Operator: Rhys Pescod Company: MBRC
Line Measured Corrected Absolute Residual.
0-1 64.877 64.875 64.874 -.001
0-2 181.152 181.149 181.147 -.002
0-3 398.737 398.729 398.725 -.004
0-4 537.057 537.049 537.045 -.004
0-5 714.880 714.869 714.865 -.004
0-6 1148.542 1148.529 1148.526 -.003
1-2 116.277 116.273 116.273 -.000
1-3 333.863 333.852 333.851 -.001
1-4 472.183 472.173 472.171 -.002
1-5 650.009 649.996 649.991 -.005
1-6 1083.669 1083.655 1083.652 -.003
2-3 217.588 217.580 217.578 -.002
2-4 355.907 355.900 355.898 -.002
2-5 533.733 533.722 533.718 -.004
2-6 967.393 967.382 967.379 -.003
3-4 138.322 138.321 138.320 -.001
3-5 316.146 316.142 316.140 -.003
3-6 749.808 749.803 749.801 -.002
4-5 177.827 177.822 177.820 -.002
4-6 611.487 611.482 611.481 -.001
5-6 433.663 433.660 433.661 0.001
Calibration results using 28.08.2013 values as Absolute.
Zero Const: -.0013 Scale Factor: 0.9999980 ( -2ppm.) Std Dev 1.3mm.
To correct a measured distance, multiply by
the Scale factor and add the zero constant.
Residuals after the scale factor has been applied to measured distances.
Line Residual Line Residual Line Residual
0-1 0.000 1-3 0.001 2-6 0.000
0-2 -.000 1-4 0.000 3-4 0.000
0-3 -.002 1-5 -.002 3-5 -.001
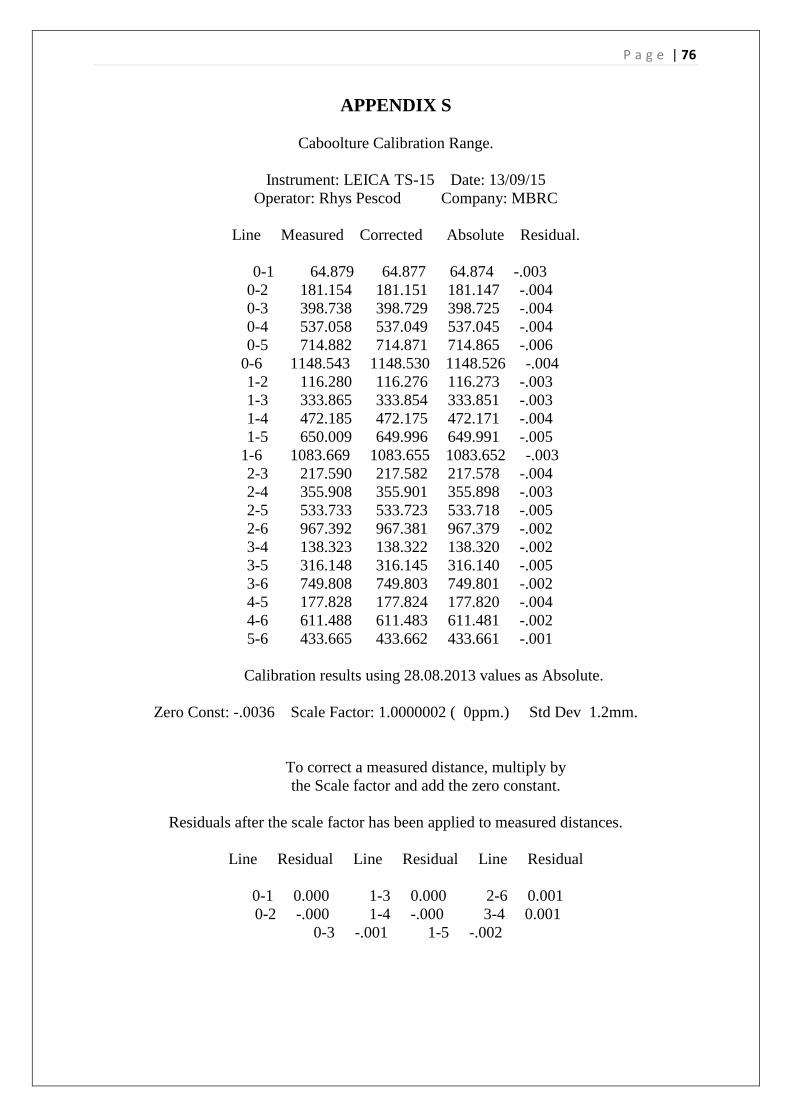
P a g e | 76
APPENDIX S
Caboolture Calibration Range.
Instrument: LEICA TS-15 Date: 13/09/15
Operator: Rhys Pescod Company: MBRC
Line Measured Corrected Absolute Residual.
0-1 64.879 64.877 64.874 -.003
0-2 181.154 181.151 181.147 -.004
0-3 398.738 398.729 398.725 -.004
0-4 537.058 537.049 537.045 -.004
0-5 714.882 714.871 714.865 -.006
0-6 1148.543 1148.530 1148.526 -.004
1-2 116.280 116.276 116.273 -.003
1-3 333.865 333.854 333.851 -.003
1-4 472.185 472.175 472.171 -.004
1-5 650.009 649.996 649.991 -.005
1-6 1083.669 1083.655 1083.652 -.003
2-3 217.590 217.582 217.578 -.004
2-4 355.908 355.901 355.898 -.003
2-5 533.733 533.723 533.718 -.005
2-6 967.392 967.381 967.379 -.002
3-4 138.323 138.322 138.320 -.002
3-5 316.148 316.145 316.140 -.005
3-6 749.808 749.803 749.801 -.002
4-5 177.828 177.824 177.820 -.004
4-6 611.488 611.483 611.481 -.002
5-6 433.665 433.662 433.661 -.001
Calibration results using 28.08.2013 values as Absolute.
Zero Const: -.0036 Scale Factor: 1.0000002 ( 0ppm.) Std Dev 1.2mm.
To correct a measured distance, multiply by
the Scale factor and add the zero constant.
Residuals after the scale factor has been applied to measured distances.
Line Residual Line Residual Line Residual
0-1 0.000 1-3 0.000 2-6 0.001
0-2 -.000 1-4 -.000 3-4 0.001
0-3 -.001 1-5 -.002