Improvements To Progressive Wave Tube …mln/ltrs-pdfs/NASA-2000-tm210623.pdfImprovements To...
55
October 2000 NASA/TM-2000-210623 Improvements To Progressive Wave Tube Performance Through Closed-Loop Control Stephen A. Rizzi Langley Research Center, Hampton, Virginia
Transcript of Improvements To Progressive Wave Tube …mln/ltrs-pdfs/NASA-2000-tm210623.pdfImprovements To...

October 2000
NASA/TM-2000-210623
Improvements To Progressive Wave Tube Performance Through Closed-Loop Control Stephen A. Rizzi Langley Research Center, Hampton, Virginia

The NASA STI Program Office ... in Profile
Since its founding, NASA has been dedicated to the advancement of aeronautics and space science. The NASA Scientific and Technical Information (STI) Program Office plays a key part in helping NASA maintain this important role.
The NASA STI Program Office is operated by Langley Research Center, the lead center for NASA’s scientific and technical information. The NASA STI Program Office provides access to the NASA STI Database, the largest collection of aeronautical and space science STI in the world. The Program Office is also NASA’s institutional mechanism for disseminating the results of its research and development activities. These results are published by NASA in the NASA STI Report Series, which includes the following report types:
•= TECHNICAL PUBLICATION. Reports of
completed research or a major significant phase of research that present the results of NASA programs and include extensive data or theoretical analysis. Includes compilations of significant scientific and technical data and information deemed to be of continuing reference value. NASA counter-part of peer reviewed formal professional papers, but having less stringent limitations on manuscript length and extent of graphic presentations.
•= TECHNICAL MEMORANDUM. Scientific
and technical findings that are preliminary or of specialized interest, e.g., quick release reports, working papers, and bibliographies that contain minimal annotation. Does not contain extensive analysis.
•= CONTRACTOR REPORT. Scientific and
technical findings by NASA-sponsored contractors and grantees.
• CONFERENCE PUBLICATION. Collected papers from scientific and technical conferences, symposia, seminars, or other meetings sponsored or co-sponsored by NASA.
•= SPECIAL PUBLICATION. Scientific,
technical, or historical information from NASA programs, projects, and missions, often concerned with subjects having substantial public interest.
•= TECHNICAL TRANSLATION. English-
language translations of foreign scientific and technical material pertinent to NASA’s mission.
Specialized services that help round out the STI Program Office’s diverse offerings include creating custom thesauri, building customized databases, organizing and publishing research results ... even providing videos. For more information about the NASA STI Program Office, see the following: •= Access the NASA STI Program Home
Page at http://www.sti.nasa.gov •= E-mail your question via the Internet to
[email protected] •= Fax your question to the NASA Access Help
Desk at (301) 621-0134 •= Phone the NASA Access Help Desk at (301)
621-0390 •= Write to:
NASA Access Help Desk NASA Center for AeroSpace Information 7121 Standard Drive Hanover, MD 21076-1320

National Aeronautics and Space Administration Langley Research Center Hampton, Virginia 23681-2199
October 2000
NASA/TM-2000-210623
Improvements To Progressive Wave Tube Performance Through Closed-Loop Control Stephen A. Rizzi Langley Research Center, Hampton, Virginia

Acknowledgments
The author wishes to acknowledge the efforts of Mr. John Swartzbaugh and Mr. Donald Smith of the Gas, Fluid & Acoustics Research Support Branch at the NASA Langley Research Center for their work in configuring and operating the Thermal Acoustic Fatigue Apparatus during this activity. He also wishes to thank Mr. Carl Davis of Wyle Laboratories, Hampton for various instrumentation support and Mr. Troy Manglicmot of Wyle Laboratories, Hampton for programming the temperature control and thermocouple data acquisition software in LabView.
The use of trademarks or names of manufacturers in the report is for accurate reporting and does not constitute an official endorsement, either expressed or implied, of such products or manufacturers by the National Aeronautics
Available from the following: NASA Center for AeroSpace Information (CASI) National Technical Information Service (NTIS) 7121 Standard Drive 5285 Port Royal Road Hanover, MD 21076-1320 Springfield, VA 22161-2171 (301) 621-0390 (703) 487-4650
and Space Administration.

i
Abstract This report documents recent improvements to the acoustic and thermal control systems of the Thermal Acoustic Fatigue Apparatus (TAFA), a progressive wave tube test facility at the NASA Langley Research Center, Hampton, Virginia. A brief summary of past acoustic performance is given first to serve as a basis for comparison with the new performance data using a multiple-input, closed-loop, narrow-band controller. Performance data in the form of test section acoustic power spectral densities and coherence are presented in three of six facility configurations for a variety of input spectra. Tested spectra include uniform, two cases of pink noise, three cases of narrow-band random, a simulated launch payload bay environment for an expendable launch vehicle, and a simulated external acoustic load for the aft section of a reusable launch vehicle. In addition, a new closed-loop temperature controller and thermocouple data acquisition system are described.

ii
Table of Contents 1. Facility History.................................................................................................................................. 1-1
1.1. Pre-1995 Facility Performance.................................................................................................. 1-1 1.2. Post-1995 Facility Performance ................................................................................................ 1-3
2. Narrow Band Acoustic Control ......................................................................................................... 2-1 2.1. Controller Description............................................................................................................... 2-1 2.2. Uniform Spectra Results ........................................................................................................... 2-3
2.2.1. Two-Modulator Reduced Configuration ........................................................................... 2-3 2.2.2. Four-Modulator Reduced Configuration........................................................................... 2-3 2.2.3. Eight-Modulator Reduced Configuration.......................................................................... 2-3
2.3. Non-uniform Spectra Results .................................................................................................. 2-13 2.3.1. Pink Noise Spectra .......................................................................................................... 2-13
2.3.1.1 Constant Slope............................................................................................................. 2-13 2.3.1.2 Constant Step............................................................................................................... 2-13
2.3.2. Band-Limited Random Spectra ....................................................................................... 2-19 2.3.2.1 Baseline Band-Limited Random ................................................................................. 2-19 2.3.2.2 Band-Limited Random with Sloped Notch ................................................................. 2-19 2.3.2.3 Band-Limited Random with Sharp Notch................................................................... 2-19
2.3.3. Expendable Launch Vehicle Payload Bay ...................................................................... 2-28 2.3.4. Reusable Launch Vehicle Lift-Off .................................................................................. 2-28
3. Temperature Control and Thermocouple Data Acquisition .............................................................. 3-1 3.1. Hardware Description................................................................................................................ 3-1 3.2. Software Description................................................................................................................. 3-1
3.2.1. Thermocouple Data Acquisition........................................................................................ 3-2 3.2.2. Closed-Loop Temperature Control.................................................................................... 3-2
4. Summary ........................................................................................................................................... 4-1 5. References ......................................................................................................................................... 5-1
iii
List of Figures Figure 1: Schematic of the pre-1995 TAFA facility. ............................................................................... 1-1 Figure 2: Photograph of the quartz lamp bank of the TAFA facility. ...................................................... 1-2 Figure 3: Test section acoustic pressure PSD of the pre-1995 TAFA facility. ........................................ 1-2 Figure 4: Test section coherence of the pre-1995 TAFA facility............................................................. 1-3 Figure 5: Photograph of the post-1995 TAFA facility in the four-modulator reduced configuration...... 1-4 Figure 6: Schematic of the TAFA facility in the two-modulator reduced configuration. ........................ 1-4 Figure 7: Schematic of the TAFA facility in the four-modulator reduced configuration. ....................... 1-5 Figure 8: Schematic of the TAFA facility in the eight-modulator reduced configuration. ...................... 1-5 Figure 9: Average test section pressure PSD of post-1995 TAFA facility in the eight-modulator reduced
configuration. .................................................................................................................................... 1-7 Figure 10: Upstream pressure PSD of post-1995 TAFA facility in the eight-modulator reduced
configuration. .................................................................................................................................... 1-7 Figure 11: Downsteam pressure PSD of the post-1995 TAFA facility in the eight-modulator reduced
configuration. .................................................................................................................................... 1-8 Figure 12: Coherence between the upstream and downsteam pressures of the post-1995 TAFA facility in
the eight-modulator reduced configuration. ...................................................................................... 1-8 Figure 13: Control pressure PSD for two-modulator reduced configuration at 165 dB........................... 2-4 Figure 14: Upstream pressure PSD for two-modulator reduced configuration at 165 dB. ...................... 2-4 Figure 15: Downstream pressure PSD for two-modulator reduced configuration at 165 dB. ................. 2-5 Figure 16: Coherence between upstream and downstream locations for two-modulator reduced
configuration at 165 dB..................................................................................................................... 2-5 Figure 17: Drive signal PSD for two-modulator reduced configuration at 165 dB. ................................ 2-6 Figure 18: Comparison of control spectra at various levels for two-modulator reduced configuration... 2-6 Figure 19: Control pressure PSD for four-modulator reduced configuration at 169 dB. ......................... 2-7 Figure 20: Upstream pressure PSD for four-modulator reduced configuration at 169 dB....................... 2-7 Figure 21: Downstream pressure PSD for four-modulator reduced configuration at 169 dB.................. 2-8 Figure 22: Coherence between upstream and downstream locations for four-modulator reduced
configuration at 169 dB..................................................................................................................... 2-8 Figure 23: Drive signal PSD for four-modulator reduced configuration at 169 dB................................. 2-9 Figure 24: Comparison of control spectra at various levels for four-modulator reduced configuration. . 2-9 Figure 25: Control pressure PSD for eight-modulator reduced configuration at 171 dB....................... 2-10 Figure 26: Upstream pressure PSD for eight-modulator reduced configuration at 171 dB. .................. 2-10 Figure 27: Downstream pressure PSD for eight-modulator reduced configuration at 171 dB. ............. 2-11 Figure 28: Coherence between upstream and downstream locations for eight-modulator reduced
configuration at 171 dB................................................................................................................... 2-11
iv
Figure 29: Drive signal PSD for eight-modulator reduced configuration at 171 dB.............................. 2-12 Figure 30: Comparison of control spectra at various levels for eight-modulator reduced configuration.….
......................................................................................................................................................... 2-12 Figure 31: Control pressure PSD for pink noise spectrum with constant slope. .................................... 2-14 Figure 32: Upstream pressure PSD for pink noise spectrum with constant slope.................................. 2-14 Figure 33: Downstream pressure PSD for pink noise spectrum with constant slope............................. 2-15 Figure 34: Coherence between upstream and downstream locations for pink noise spectrum with constant
slope. ............................................................................................................................................... 2-15 Figure 35: Drive signal PSD for pink noise spectrum with constant slope............................................ 2-16 Figure 36: Control pressure PSD for pink noise spectrum with stepwise slope..................................... 2-16 Figure 37: Upstream pressure PSD for pink noise spectrum with stepwise slope. ................................ 2-17 Figure 38: Downstream pressure PSD for pink noise spectrum with stepwise slope. ........................... 2-17 Figure 39: Coherence between upstream and downstream locations for pink noise spectrum with stepwise
slope. ............................................................................................................................................... 2-18 Figure 40: Drive signal PSD for pink noise spectrum with stepwise slope. .......................................... 2-18 Figure 41: Control pressure PSD for band limited random spectrum. ................................................... 2-20 Figure 42: Upstream pressure PSD for band limited random spectrum................................................. 2-20 Figure 43: Downstream pressure PSD for band limited random spectrum............................................ 2-21 Figure 44: Coherence between upstream and downstream locations for band limited random spectrum….
......................................................................................................................................................... 2-21 Figure 45: Drive signal PSD for band limited random spectrum........................................................... 2-22 Figure 46: Control pressure PSD for band limited random spectrum with sloped notch....................... 2-22 Figure 47: Upstream pressure PSD for band limited random spectrum with sloped notch. .................. 2-23 Figure 48: Downsteam pressure PSD for band limited random spectrum with sloped notch................ 2-23 Figure 49: Coherence between upstream and downstream locations for band limited random spectrum
with sloped notch. ........................................................................................................................... 2-24 Figure 50: Drive signal PSD for band limited random spectrum with sloped notch.............................. 2-24 Figure 51: Control pressure PSD for band limited random spectrum with sharp notch......................... 2-25 Figure 52: Upstream pressure PSD for band limited random spectrum with sharp notch. .................... 2-25 Figure 53: Downstream pressure PSD for band limited random spectrum with sharp notch. ............... 2-26 Figure 54: Coherence between upstream and downstream locations for band limited random spectrum
with sharp notch. ............................................................................................................................. 2-26 Figure 55: Drive signal PSD for band limited random spectrum with sharp notch. .............................. 2-27 Figure 56: Control pressure PSD for launch vehicle payload bay spectrum.......................................... 2-29 Figure 57: Upstream pressure PSD for launch vehicle payload bay spectrum. ..................................... 2-29 Figure 58: Downstream pressure PSD for launch vehicle payload bay spectrum.................................. 2-30

v
Figure 59: Coherence between upstream and downstream locations for launch vehicle payload bay spectrum. ......................................................................................................................................... 2-30
Figure 60: Drive signal PSD for launch vehicle payload bay spectrum................................................. 2-31 Figure 61: Control pressure PSD for RLV lift-off spectrum.................................................................. 2-31 Figure 62: Upstream pressure PSD for RLV lift-off spectrum. ............................................................. 2-32 Figure 63: Downstream pressure PSD for RLV lift-off spectrum.......................................................... 2-32 Figure 64: Coherence between upstream and downstream locations for RLV lift-off spectrum. .......... 2-33 Figure 65: Drive signal PSD from RLV lift-off spectrum. .................................................................... 2-33

1-1
1. Facility History
The progressive wave tube (PWT) facility at NASA Langley Research Center, known as the Thermal Acoustic Fatigue Apparatus (TAFA), is used to test structures for dynamic response and sonic fatigue due to combined, high-intensity thermal acoustic environments. Prior to 1994, it was used to support development of the thermal protection system for the Space Shuttle and the National Aerospace Plane, and various generic hypersonic vehicle structures [1-3]. During the period 1994-1995, the facility underwent significant modifications through the NASA minor Construction of Facilities program to improve its performance. These are briefly described in Section 1.2 of this report. Following these enhancements, the facility was used for sonic fatigue studies of the wing strake subcomponents on the High Speed Civil Transport. Most recently, and the subject of this report, are enhancements to the acoustic and thermal control systems. A description of these systems and their characteristics are provided in Sections 2 and 3.
1.1. Pre-1995 Facility Performance The capabilities of the TAFA facility prior to the 1995 modifications were previously documented by Clevenson and Daniels [4]. A schematic of the facility is shown in Figure 1. The system was driven by two Wyle WAS 3000 airstream modulators, which provided an overall sound pressure level range of 125 to 165 dB overall sound pressure level (OASPL) and a useful frequency range of 50-200 Hz. Manual control of the acoustic level was performed by adjusting the output of a white noise signal generator and gain on the amplifiers driving the air modulators. Typically, there were no attempts to adjust the acoustic spectrum shape in the test section. A 360 kW quartz lamp bank provided radiant heat with a peak heat flux of 54 W/cm2. The lamp bank consisted of ten-36kW lamps units, each having six-6kW quartz lamps behind a 2.54 cm thick quartz window, as shown in Figure 2. A closed-loop temperature controller having a single reference thermocouple was used to control the resulting test article temperature, with all lamp units receiving the same power.
A typical test section acoustic pressure power spectral density (PSD) is shown in Figure 3 for a 160 dB OASPL. Also shown in this and in subsequent PSD plots are the specified narrow-band spectrum levels ( ), ± 1.5 dB levels ( ) , and ± 6 dB levels ( ). A plot of coherence in Figure 4 helps to explain the quoted useful frequency range.
Figure 1: Schematic of the pre-1995 TAFA facility.
Terminationsection
Testsection Exponential
horn
Conicalhorn
Wyle WAS 3000air modulators

1-2
Figure 2: Photograph of the quartz lamp bank of the TAFA facility.
Figure 3: Test section acoustic pressure PSD of the pre-1995 TAFA facility.
Frequency (Hz)
Pres
sure
PSD
(Pa2 /H
z)
100 200 300 400 500101
102
103
104
105

1-3
Figure 4: Test section coherence of the pre-1995 TAFA facility.
1.2. Post-1995 Facility Performance In order to meet future testing requirements, extensive modifications were made to the sound generation system and to the wave tube itself. The quartz lamp bank and its control system were left unchanged. A theoretical increase of 6 dB OASPL was projected by designing the system to utilize eight WAS 3000 air modulators compared to the two used in the previous system. A further increase of nearly 5 dB was expected by designing the test section to accommodate removable water-cooled insert channels, which reduced its cross-sectional area from 1.9m x 0.33m to 0.66m x 0.33m. The frequency range was increased through the use of a longer horn design with a lower (15 Hz vs. 27 Hz in the old facility) cut-off frequency, use of insert channels in the test section to shift the frequency of significant standing waves above 500 Hz, and design of facility sidewall structures with resonances above 1000 Hz. The uniformity of the sound pressure field in the test section was improved through several means. A new, smooth exponential horn was designed to avoid the impedance mismatches of the old design. To minimize the effect of uncorrelated, broadband noise (which develops as a byproduct of the sound generation system), a unique design was adopted which allows for the use of either two-, four-, or eight-modulators. When testing at the lower excitation levels for example, a two-modulator configuration might be used to achieve a lower background level over that of the four- or eight-modulator configurations. In doing so, the dynamic range is extended. Lastly, a catenoidal design for the termination section was used to smoothly expand from the test section. A photograph of the facility following the modifications is shown in Figure 5. Schematics of the three reduced-test-section configurations are shown in Figure 6 - Figure 8. These configurations were used to benchmark the performance of the new acoustic controller.
Frequency (Hz)
Coh
eren
ce
100 200 300 400 5000
0.1
0.2
0.3
0.4
0.5
0.6
0.7
0.8
0.9
1

1-4
Figure 5: Photograph of the post-1995 TAFA facility in the four-modulator reduced configuration.
Figure 6: Schematic of the TAFA facility in the two-modulator reduced configuration.

1-5
Figure 7: Schematic of the TAFA facility in the four-modulator reduced configuration.
Figure 8: Schematic of the TAFA facility in the eight-modulator reduced configuration.

1-6
The only substantial change to the acoustic control system was the addition of a bank of four 1/3 -octave band equalizers in series between the output of the white noise signal generator and amplifiers driving the air modulators. Level control was still performed by manually adjusting the output of the signal generator and gain on the amplifiers. The process of adjusting the test section spectrum shape was both time consuming and error prone. The effect of adjusting the level of a single 1/3-octave band was carried over to the neighboring 1/3-octave bands within one equalizer, and within the same band across equalizers. Thus, a non-unique and iterative process was required to provide a flat spectrum. The time required to adjust the equalizers could be on the order of 10-15 minutes; too long for testing a high levels where fatigue life may be short. In such cases, settings were established apriori using a dummy panel, but were still subject to day-to-day changes. Narrow-band control was not possible using this approach. Lastly, spectrum shaping was based on the spectrum at one point in the test section (typically at the upstream microphone). There was thus no way to control the spectrum across the extent of the test article. Even with all of these limitations, a reasonably flat and coherent spectrum could still be achieved with some effort.
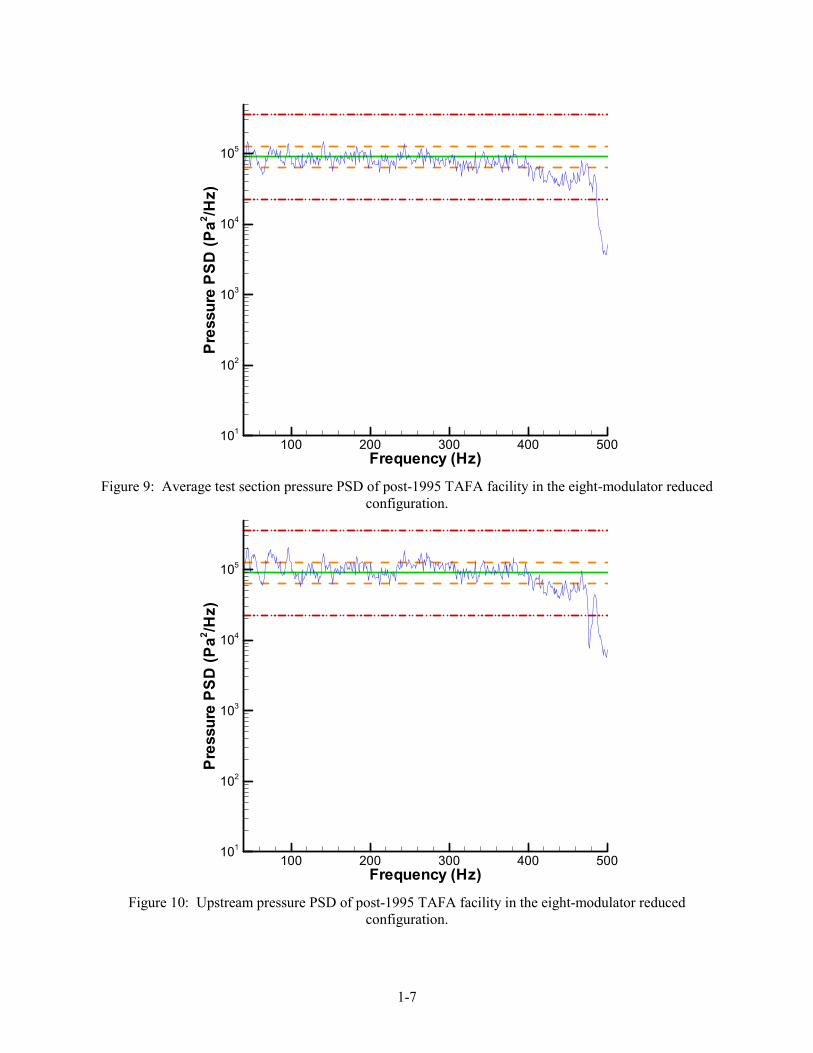
The performance of the facility in all of its configurations was previously documented by Rizzi and Turner [5]. The modifications indicated above resulted in an increase in the maximum OASPL by over 6 dB relative to the pre-1995 performance and an expansion of the frequency range to 40-480Hz for the reduced configurations. A few results are included in this report to assist in the performance evaluation of the new acoustic controller. The average test section PSD in the eight-modulator reduced configuration is shown in Figure 9, for a 170 dB OASPL. In this case, the upstream test section pressure was used for control, as shown in Figure 10. A relatively flat spectrum was achieved up to about 400 Hz. The pressure at the downstream test section location is approximately 1.5 dB or more lower than the upstream location across the frequency range, as shown in Figure 11. The coherence between upstream and downstream locations, shown in Figure 12, is nearly unity to about 460 Hz.
1-7
Figure 9: Average test section pressure PSD of post-1995 TAFA facility in the eight-modulator reduced configuration.
Figure 10: Upstream pressure PSD of post-1995 TAFA facility in the eight-modulator reduced configuration.
Frequency (Hz)
Pres
sure
PSD
(Pa2 /H
z)
100 200 300 400 500101
102
103
104
105
Frequency (Hz)
Pres
sure
PSD
(Pa2 /H
z)
100 200 300 400 500101
102
103
104
105

1-8
Figure 11: Downsteam pressure PSD of the post-1995 TAFA facility in the eight-modulator reduced configuration.
Figure 12: Coherence between the upstream and downsteam pressures of the post-1995 TAFA facility in the eight-modulator reduced configuration.
Frequency (Hz)
Pres
sure
PSD
(Pa2 /H
z)
100 200 300 400 500101
102
103
104
105
Frequency (Hz)
Coh
eren
ce
100 200 300 400 5000
0.1
0.2
0.3
0.4
0.5
0.6
0.7
0.8
0.9
1

2-1
2. Narrow Band Acoustic Control
2.1. Controller Description
During the fiscal year 2000, a new acoustic control system was installed and tested to enhance the capabilities of TAFA and to prepare the facility for future testing. Of paramount importance was the need to have an automated means of shaping a wide variety of spectrum shapes in a fast and efficient manner. An existing closed-loop shaker control system was selected and modified to allow its use in acoustic environments having high background noise levels. The system procured was the M+P International “Vib2000 VibControl System,” heretofore referred to as the VibControl system [6]. The features of the baseline system include:
• Narrow band closed-loop random control
• Multiple control transducers (limited by the number of input channels) in either averaged, maximal, or minimal control strategies
• Test spectrum specification with up to 99 breakpoints, sigma clipping (1.42-8), low and high alarm and abort limits for each frequency range
• Automated measurement and level scheduling
• Runs on a host PC computer under Windows NT
• Watchdog channels to limit the drive signal on an overall basis (in the tolerance mode) or on a narrow-band basis (in the notch/tolerance mode)
The watchdog feature is useful in PWT testing to ensure the integrity of the facility and test article. In the tolerance mode, it can be used to limit amplifier output to less than 12 amperes RMS, as required for the Wyle WAS 3000 air modulators. It can also be used to limit test article structural response in either an RMS (tolerance mode) or narrow-band (notch/tolerance mode) basis.
As with any other feedback controller, the VibControl software compares the specified level with the actual level (referred to as the control signal) and adjusts the drive signal to minimize the error between the two. The manner in which the control signal is computed has some bearing on the responsiveness of the control. This is briefly summarized here. For each control loop i and control channel, an averaged PSD is computed from several instantaneous PSDs using the usual formula
( )
1
1
Ki
jKj
PSD PSD=
� �
where K is the number of averages per control loop. For example,
� �� �
(1)1
1 2 3 4 55
(2)1
6 7 8 9 105
PSD PSD PSD PSD PSD PSD
PSD PSD PSD PSD PSD PSD
� � � � �
� � � � ��
Note that no overlap is used in computing the averaged PSD. The control signal PSD is built by using a weighted average of the averaged PSDs as
( ) ( 1)1( )
1
( )
1
i ii N control
controlN
PSD PSDPSD
-���

2-2
where N is the average weighting factor. It is clear from the above equation that it takes two loops to get the controller going. For example,
(2) (1)1(2)
1
(3) (2)1(3)
1
( )1
( )1
Ncontrol
N
N controlcontrol
N
PSD PSDPSD
PSD PSDPSD
HZ
H
HZ
H
If more than one channel is used for control, then the total control signal PSD is either the average, maximum, or minimum of the individual control PSDs depending on the control strategy selected. Note that while not a feature of the VibControl software, a weighted average in which some control channels are more important than others can be made possible by scaling the input sensitivities of the control channels. The reader is referred to [6] for additional information.
Several changes were specified by the author and were made to the baseline VibControl software by M+P International to facilitate its use in PWT testing. These included:
•= Modification of the “open channel” algorithm to allow for low signal/noise ratios during the start of a test
•= Specification of test spectrum breakpoints in Pa2/Hz, and display of RMS levels in dB
•= A “last drive” capability, which allows the use of a pre-stored drive signal to enable quick start up and equalization of a test that has previously been run. This feature allows, for example, the simulation of blast or launch loads
•= Retention of support for both the Hewlett-Packard 3565S and VXI front-ends
The modifications were implemented in the standard software package so that new features would be available in subsequent releases of the software.
The particular implementation in TAFA is a dual-processor PC running Windows NT 4.0, an HP 3565S front-end with 32 input channels, and up to 8 watchdog channels for each of the amplifier outputs. The control channels typically consist of two fluctuating pressure measurements in the test section located upstream and downstream of the test article. Note that an averaged control strategy of this type is best for PWT testing as is ensures a good acoustic spectra across the test article. It does come, however, at the expense of the ability to maintain the specified spectra for any particular channel. The same drive signal served as input to each of up to 8 air modulators, as it was the aggregate test section acoustic environment being controlled as opposed to the noise being generated by each modulator individually.
In the following cases, acoustic pressure was controlled using two Kulite model MIC-190-HT pressure transducers in the “averaged” control strategy across the facility frequency range of 40-500 Hz. The transducers were flush mounted in a rigid panel and were located 0.3048m upstream and 0.3048m downstream of the test section vertical centerline, along the horizontal centerline. In the VibControl software, the following parameters were set:
•= A frequency resolution of 1 Hz
•= Sigma clipping set to three
•= High and low alarm limits set to ±1.5 dB for each frequency range
•= High and low abort limits set to ±6 dB for each frequency range. Note that for each test case, the high and low abort limits were never exceeded. Thus, these limits could probably be tightened considerably.
2-3
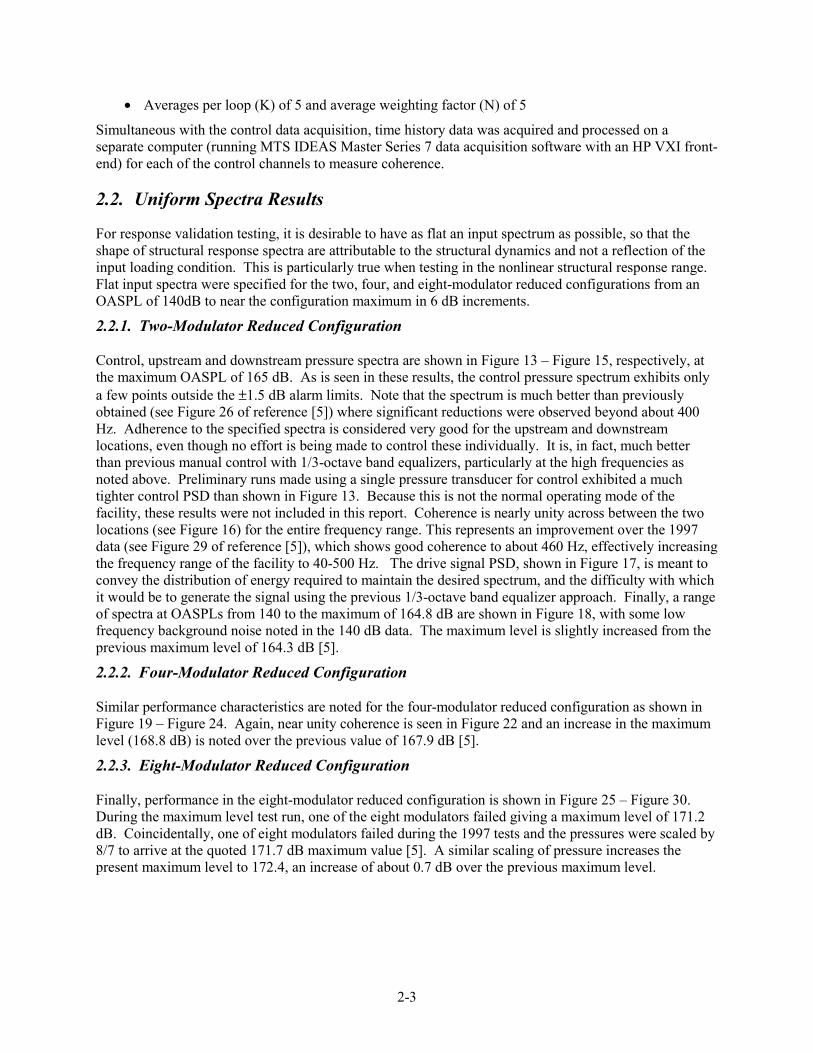
•= Averages per loop (K) of 5 and average weighting factor (N) of 5
Simultaneous with the control data acquisition, time history data was acquired and processed on a separate computer (running MTS IDEAS Master Series 7 data acquisition software with an HP VXI front-end) for each of the control channels to measure coherence.
2.2. Uniform Spectra Results
For response validation testing, it is desirable to have as flat an input spectrum as possible, so that the shape of structural response spectra are attributable to the structural dynamics and not a reflection of the input loading condition. This is particularly true when testing in the nonlinear structural response range. Flat input spectra were specified for the two, four, and eight-modulator reduced configurations from an OASPL of 140dB to near the configuration maximum in 6 dB increments.
2.2.1. Two-Modulator Reduced Configuration
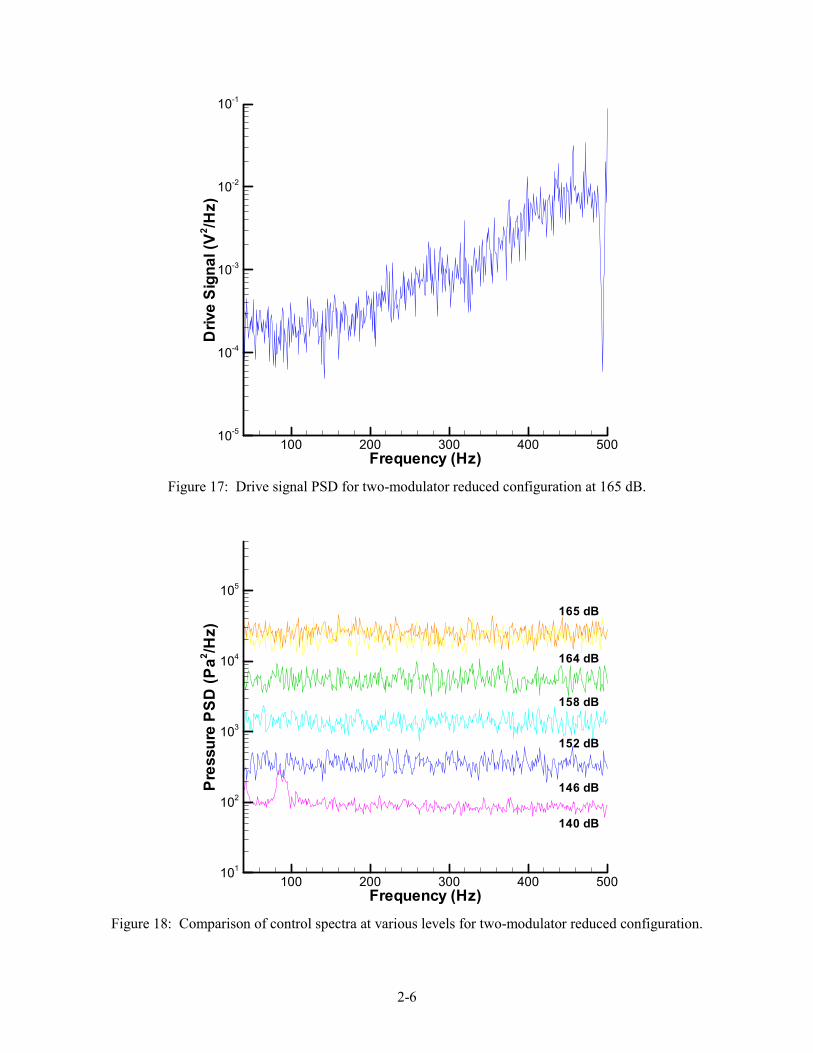
Control, upstream and downstream pressure spectra are shown in Figure 13 – Figure 15, respectively, at the maximum OASPL of 165 dB. As is seen in these results, the control pressure spectrum exhibits only a few points outside the ±1.5 dB alarm limits. Note that the spectrum is much better than previously obtained (see Figure 26 of reference [5]) where significant reductions were observed beyond about 400 Hz. Adherence to the specified spectra is considered very good for the upstream and downstream locations, even though no effort is being made to control these individually. It is, in fact, much better than previous manual control with 1/3-octave band equalizers, particularly at the high frequencies as noted above. Preliminary runs made using a single pressure transducer for control exhibited a much tighter control PSD than shown in Figure 13. Because this is not the normal operating mode of the facility, these results were not included in this report. Coherence is nearly unity across between the two locations (see Figure 16) for the entire frequency range. This represents an improvement over the 1997 data (see Figure 29 of reference [5]), which shows good coherence to about 460 Hz, effectively increasing the frequency range of the facility to 40-500 Hz. The drive signal PSD, shown in Figure 17, is meant to convey the distribution of energy required to maintain the desired spectrum, and the difficulty with which it would be to generate the signal using the previous 1/3-octave band equalizer approach. Finally, a range of spectra at OASPLs from 140 to the maximum of 164.8 dB are shown in Figure 18, with some low frequency background noise noted in the 140 dB data. The maximum level is slightly increased from the previous maximum level of 164.3 dB [5].
2.2.2. Four-Modulator Reduced Configuration
Similar performance characteristics are noted for the four-modulator reduced configuration as shown in Figure 19 – Figure 24. Again, near unity coherence is seen in Figure 22 and an increase in the maximum level (168.8 dB) is noted over the previous value of 167.9 dB [5].
2.2.3. Eight-Modulator Reduced Configuration
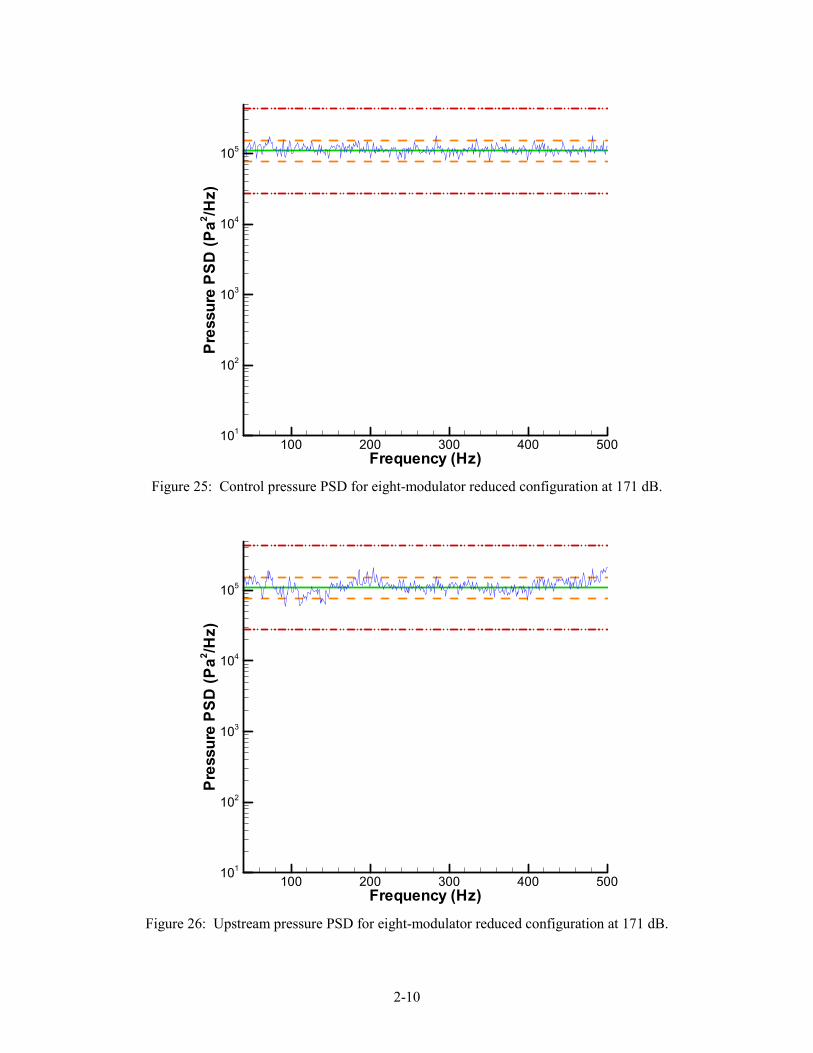
Finally, performance in the eight-modulator reduced configuration is shown in Figure 25 – Figure 30. During the maximum level test run, one of the eight modulators failed giving a maximum level of 171.2 dB. Coincidentally, one of eight modulators failed during the 1997 tests and the pressures were scaled by 8/7 to arrive at the quoted 171.7 dB maximum value [5]. A similar scaling of pressure increases the present maximum level to 172.4, an increase of about 0.7 dB over the previous maximum level.

2-4
Figure 13: Control pressure PSD for two-modulator reduced configuration at 165 dB.
Figure 14: Upstream pressure PSD for two-modulator reduced configuration at 165 dB.
Frequency (Hz)
Pres
sure
PSD
(Pa2 /H
z)
100 200 300 400 500101
102
103
104
105
Frequency (Hz)
Pres
sure
PSD
(Pa2 /H
z)
100 200 300 400 500101
102
103
104
105

2-5
Figure 15: Downstream pressure PSD for two-modulator reduced configuration at 165 dB.
Figure 16: Coherence between upstream and downstream locations for two-modulator reduced configuration at 165 dB.
Frequency (Hz)
Pres
sure
PSD
(Pa2 /H
z)
100 200 300 400 500101
102
103
104
105
Frequency (Hz)
Coh
eren
ce
100 200 300 400 5000
0.1
0.2
0.3
0.4
0.5
0.6
0.7
0.8
0.9
1
2-6
Figure 17: Drive signal PSD for two-modulator reduced configuration at 165 dB.
Figure 18: Comparison of control spectra at various levels for two-modulator reduced configuration.
Frequency (Hz)
Driv
eSi
gnal
(V2 /H
z)
100 200 300 400 50010-5
10-4
10-3
10-2
10-1
Frequency (Hz)
Pres
sure
PSD
(Pa2 /H
z)
100 200 300 400 500101
102
103
104
105
140 dB
146 dB
152 dB
158 dB
164 dB
165 dB

2-7
Figure 19: Control pressure PSD for four-modulator reduced configuration at 169 dB.
Figure 20: Upstream pressure PSD for four-modulator reduced configuration at 169 dB.
Frequency (Hz)
Pres
sure
PSD
(Pa2 /H
z)
100 200 300 400 500101
102
103
104
105
Frequency (Hz)
Pres
sure
PSD
(Pa2 /H
z)
100 200 300 400 500101
102
103
104
105

2-8
Figure 21: Downstream pressure PSD for four-modulator reduced configuration at 169 dB.
Figure 22: Coherence between upstream and downstream locations for four-modulator reduced configuration at 169 dB.
Frequency (Hz)
Pres
sure
PSD
(Pa2 /H
z)
100 200 300 400 500101
102
103
104
105
Frequency (Hz)
Coh
eren
ce
100 200 300 400 5000
0.1
0.2
0.3
0.4
0.5
0.6
0.7
0.8
0.9
1

2-9
Figure 23: Drive signal PSD for four-modulator reduced configuration at 169 dB.
Figure 24: Comparison of control spectra at various levels for four-modulator reduced configuration.
Frequency (Hz)
Driv
eSi
gnal
(V2 /H
z)
100 200 300 400 50010-5
10-4
10-3
10-2
10-1
Frequency (Hz)
Pres
sure
PSD
(Pa2 /H
z)
100 200 300 400 500101
102
103
104
105
140 dB
146 dB
152 dB
158 dB
164 dB
169 dB
2-10
Figure 25: Control pressure PSD for eight-modulator reduced configuration at 171 dB.
Figure 26: Upstream pressure PSD for eight-modulator reduced configuration at 171 dB.
Frequency (Hz)
Pres
sure
PSD
(Pa2 /H
z)
100 200 300 400 500101
102
103
104
105
Frequency (Hz)
Pres
sure
PSD
(Pa2 /H
z)
100 200 300 400 500101
102
103
104
105

2-11
Figure 27: Downstream pressure PSD for eight-modulator reduced configuration at 171 dB.
Figure 28: Coherence between upstream and downstream locations for eight-modulator reduced configuration at 171 dB.
Frequency (Hz)
Pres
sure
PSD
(Pa2 /H
z)
100 200 300 400 500101
102
103
104
105
Frequency (Hz)
Coh
eren
ce
100 200 300 400 5000
0.1
0.2
0.3
0.4
0.5
0.6
0.7
0.8
0.9
1

2-12
Figure 29: Drive signal PSD for eight-modulator reduced configuration at 171 dB.
Figure 30: Comparison of control spectra at various levels for eight-modulator reduced configuration.
Frequency (Hz)
Driv
eSi
gnal
(V2 /H
z)
100 200 300 400 50010-5
10-4
10-3
10-2
10-1
Frequency (Hz)
Pres
sure
PSD
(Pa2 /H
z)
100 200 300 400 500101
102
103
104
105
140 dB
146 dB
152 dB
158 dB
164 dB
171 dB
170 dB

2-13
2.3. Non-uniform Spectra Results A series of non-uniform spectra were run in the two-modulator reduced configuration to explore the versatility of the new controller. These included varieties of pink and band-limited random noise, an expendable launch vehicle payload bay launch environment, and a simulated reusable launch vehicle external lift-off environment.
2.3.1. Pink Noise Spectra
Two varieties of pink noise spectra were tested. One, referred to as constant slope, was based on the pink noise definition of broadband noise whose energy content is inversely proportional to frequency (-3 dB/octave). This results in constant 1/3-octave band levels. The second variation, referred to as constant step, also gives constant 1/3-octave band levels, but additionally specifies a constant narrow-band loading within each 1/3-octave band. These variations were of interest because the added within-band control of the constant step implementation may be advantageous in some validation testing where only the 1/3-octave band levels are specified. Both variations were run at 155 dB OASPL.
2.3.1.1 Constant Slope
Results of the constant slope variation are shown in Figure 31 – Figure 35. The control pressure PSD adheres well to the specified level throughout the frequency range. The upstream and downstream levels appear to cross the ±1.5 dB alarm limit more frequently than the previous uniform case, although this may appear accentuated by the choice of a logarithmic frequency scale. The coherence is nearly unity across the frequency range and the drive signal shows less high frequency content than the uniform spectra, as expected.
2.3.1.2 Constant Step
Figure 36 – Figure 40 shows results from the constant step variation. The control pressure PSD again adheres well to the specified level throughout the frequency range. The flatness of the control spectrum within band is easily observed, particularly at the higher frequencies, and coherence across the frequency range is excellent.

2-14
Figure 31: Control pressure PSD for pink noise spectrum with constant slope.
Figure 32: Upstream pressure PSD for pink noise spectrum with constant slope.
Frequency (Hz)
Pres
sure
PSD
(Pa2 /H
z)
100 200 300 400 500102
103
104
105
Frequency (Hz)
Pres
sure
PSD
(Pa2 /H
z)
100 200 300 400 500102
103
104
105

2-15
Figure 33: Downstream pressure PSD for pink noise spectrum with constant slope.
Figure 34: Coherence between upstream and downstream locations for pink noise spectrum with constant slope.
Frequency (Hz)
Pres
sure
PSD
(Pa2 /H
z)
100 200 300 400 500102
103
104
105
Frequency (Hz)
Coh
eren
ce
100 200 300 400 5000
0.1
0.2
0.3
0.4
0.5
0.6
0.7
0.8
0.9
1

2-16
Figure 35: Drive signal PSD for pink noise spectrum with constant slope.
Figure 36: Control pressure PSD for pink noise spectrum with stepwise slope.
Frequency (Hz)
Driv
eSi
gnal
(V2 /H
z)
100 200 300 400 50010-6
10-5
10-4
10-3
Frequency (Hz)
Pres
sure
PSD
(Pa2 /H
z)
100 200 300 400 500102
103
104
105

2-17
Figure 37: Upstream pressure PSD for pink noise spectrum with stepwise slope.
Figure 38: Downstream pressure PSD for pink noise spectrum with stepwise slope.
Frequency (Hz)
Pres
sure
PSD
(Pa2 /H
z)
100 200 300 400 500102
103
104
105
Frequency (Hz)
Pres
sure
PSD
(Pa2 /H
z)
100 200 300 400 500102
103
104
105

2-18
Figure 39: Coherence between upstream and downstream locations for pink noise spectrum with stepwise slope.
Figure 40: Drive signal PSD for pink noise spectrum with stepwise slope.
Frequency (Hz)
Coh
eren
ce
100 200 300 400 5000
0.1
0.2
0.3
0.4
0.5
0.6
0.7
0.8
0.9
1
Frequency (Hz)
Driv
eSi
gnal
(V2 /H
z)
100 200 300 400 50010-6
10-5
10-4
10-3
2-19
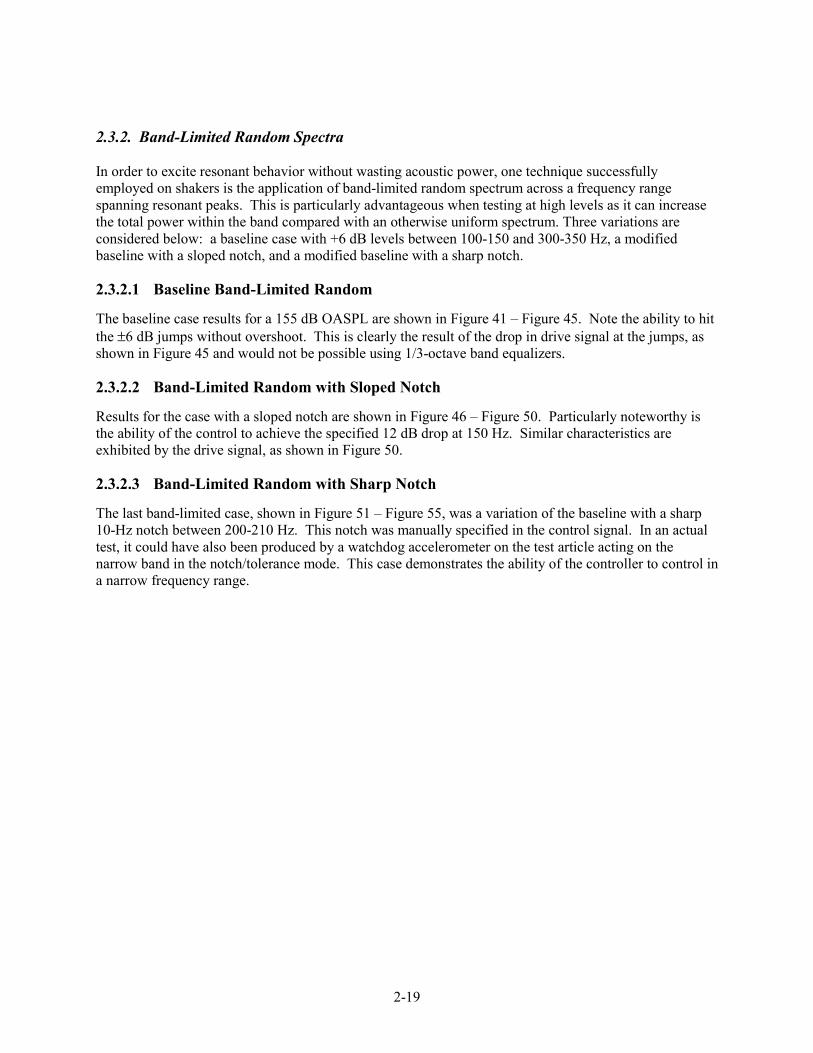
2.3.2. Band-Limited Random Spectra
In order to excite resonant behavior without wasting acoustic power, one technique successfully employed on shakers is the application of band-limited random spectrum across a frequency range spanning resonant peaks. This is particularly advantageous when testing at high levels as it can increase the total power within the band compared with an otherwise uniform spectrum. Three variations are considered below: a baseline case with +6 dB levels between 100-150 and 300-350 Hz, a modified baseline with a sloped notch, and a modified baseline with a sharp notch.
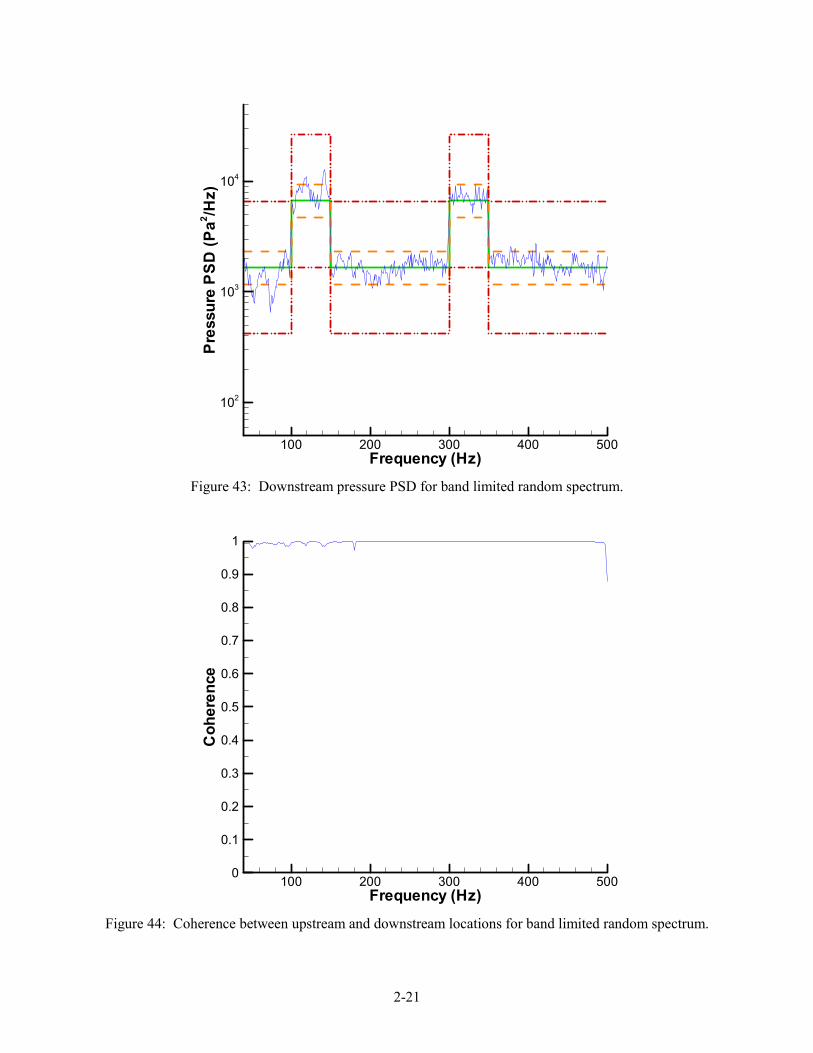
2.3.2.1 Baseline Band-Limited Random
The baseline case results for a 155 dB OASPL are shown in Figure 41 – Figure 45. Note the ability to hit the ±6 dB jumps without overshoot. This is clearly the result of the drop in drive signal at the jumps, as shown in Figure 45 and would not be possible using 1/3-octave band equalizers.
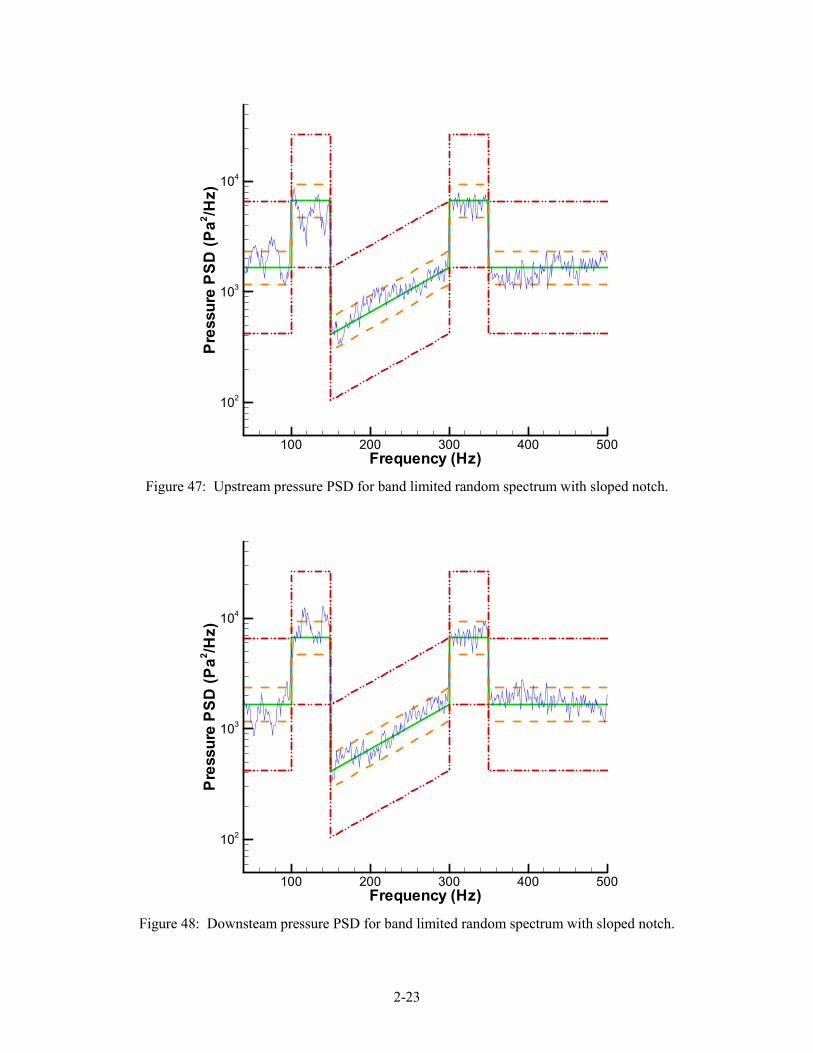
2.3.2.2 Band-Limited Random with Sloped Notch
Results for the case with a sloped notch are shown in Figure 46 – Figure 50. Particularly noteworthy is the ability of the control to achieve the specified 12 dB drop at 150 Hz. Similar characteristics are exhibited by the drive signal, as shown in Figure 50.
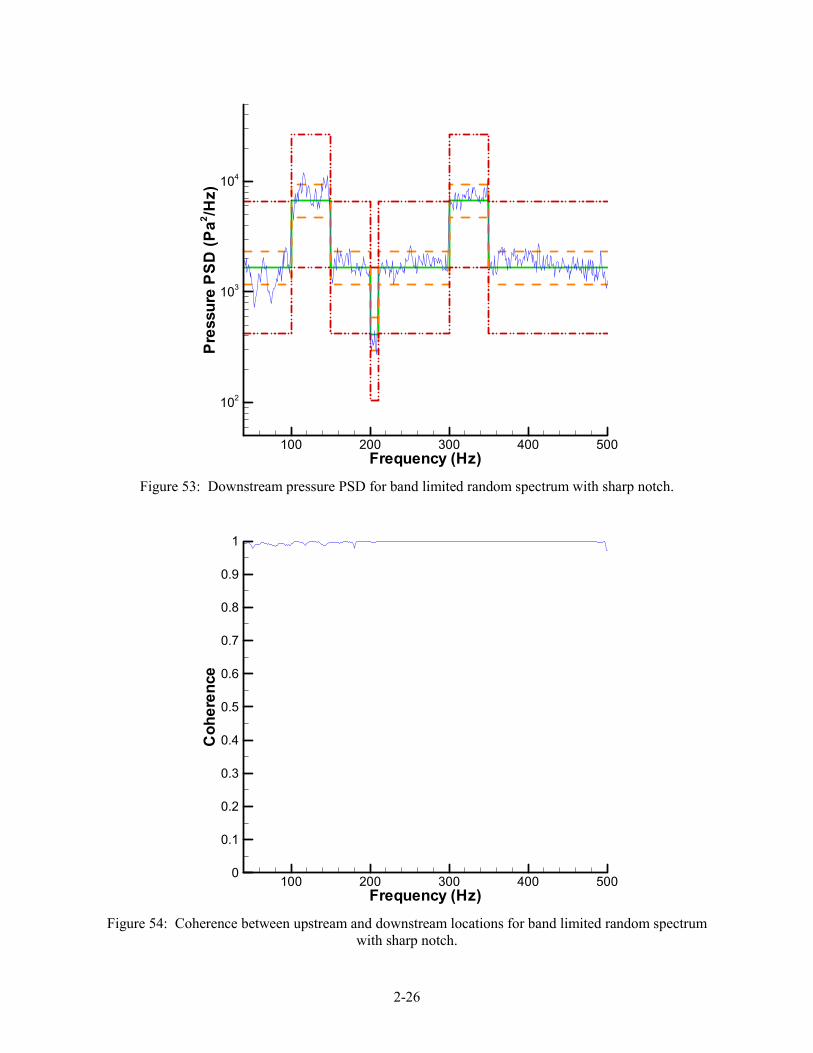
2.3.2.3 Band-Limited Random with Sharp Notch
The last band-limited case, shown in Figure 51 – Figure 55, was a variation of the baseline with a sharp 10-Hz notch between 200-210 Hz. This notch was manually specified in the control signal. In an actual test, it could have also been produced by a watchdog accelerometer on the test article acting on the narrow band in the notch/tolerance mode. This case demonstrates the ability of the controller to control in a narrow frequency range.

2-20
Figure 41: Control pressure PSD for band limited random spectrum.
Figure 42: Upstream pressure PSD for band limited random spectrum.
Frequency (Hz)
Pres
sure
PSD
(Pa2 /H
z)
100 200 300 400 500
102
103
104
Frequency (Hz)
Pres
sure
PSD
(Pa2 /H
z)
100 200 300 400 500
102
103
104
2-21
Figure 43: Downstream pressure PSD for band limited random spectrum.
Figure 44: Coherence between upstream and downstream locations for band limited random spectrum.
Frequency (Hz)
Pres
sure
PSD
(Pa2 /H
z)
100 200 300 400 500
102
103
104
Frequency (Hz)
Coh
eren
ce
100 200 300 400 5000
0.1
0.2
0.3
0.4
0.5
0.6
0.7
0.8
0.9
1

2-22
Figure 45: Drive signal PSD for band limited random spectrum.
Figure 46: Control pressure PSD for band limited random spectrum with sloped notch.
Frequency (Hz)
Driv
eSi
gnal
(V2 /H
z)
100 200 300 400 50010-8
10-7
10-6
10-5
10-4
10-3
Frequency (Hz)
Pres
sure
PSD
(Pa2 /H
z)
100 200 300 400 500
102
103
104
2-23
Figure 47: Upstream pressure PSD for band limited random spectrum with sloped notch.
Figure 48: Downsteam pressure PSD for band limited random spectrum with sloped notch.
Frequency (Hz)
Pres
sure
PSD
(Pa2 /H
z)
100 200 300 400 500
102
103
104
Frequency (Hz)
Pres
sure
PSD
(Pa2 /H
z)
100 200 300 400 500
102
103
104

2-24
Figure 49: Coherence between upstream and downstream locations for band limited random spectrum with sloped notch.
Figure 50: Drive signal PSD for band limited random spectrum with sloped notch.
Frequency (Hz)
Coh
eren
ce
100 200 300 400 5000
0.1
0.2
0.3
0.4
0.5
0.6
0.7
0.8
0.9
1
Frequency (Hz)
Driv
eSi
gnal
(V2 /H
z)
100 200 300 400 50010-8
10-7
10-6
10-5
10-4
10-3

2-25
Figure 51: Control pressure PSD for band limited random spectrum with sharp notch.
Figure 52: Upstream pressure PSD for band limited random spectrum with sharp notch.
Frequency (Hz)
Pres
sure
PSD
(Pa2 /H
z)
100 200 300 400 500
102
103
104
Frequency (Hz)
Pres
sure
PSD
(Pa2 /H
z)
100 200 300 400 500
102
103
104
2-26
Figure 53: Downstream pressure PSD for band limited random spectrum with sharp notch.
Figure 54: Coherence between upstream and downstream locations for band limited random spectrum with sharp notch.
Frequency (Hz)
Pres
sure
PSD
(Pa2 /H
z)
100 200 300 400 500
102
103
104
Frequency (Hz)
Coh
eren
ce
100 200 300 400 5000
0.1
0.2
0.3
0.4
0.5
0.6
0.7
0.8
0.9
1

2-27
Figure 55: Drive signal PSD for band limited random spectrum with sharp notch.
Frequency (Hz)
Driv
eSi
gnal
(V2 /H
z)
100 200 300 400 50010-8
10-7
10-6
10-5
10-4
10-3

2-28
2.3.3. Expendable Launch Vehicle Payload Bay
The interior acoustic environment of an expendable launch vehicle payload bay during launch was simulated to demonstrate the ability of the controller to generate an actual loading spectrum. The spectrum level was specified on an octave band basis and these levels were converted to narrow band for use by the controller. As is shown in Figure 56 – Figure 60, the controller does a good job of maintaining the specified spectra with excellent coherence across the frequency range. Note again the ability of the controller not to overshoot the jumps.
2.3.4. Reusable Launch Vehicle Lift-Off
Another relevant simulation performed was the external acoustic environment at the aft end of a reusable launch vehicle during lift-off. As seen in Figure 61 – Figure 65, the controller does a good job of maintaining the specified spectrum. Note that even though the spectrum shape does not vary widely within the frequency range of the facility, the test demonstrates the ability to simulate the low frequency content, which typically drives the low order vibration modes responsible for fatigue.

2-29
Figure 56: Control pressure PSD for launch vehicle payload bay spectrum.
Figure 57: Upstream pressure PSD for launch vehicle payload bay spectrum.
Frequency (Hz)
Pres
sure
PSD
(Pa2 /H
z)
100 200 300 400 500
102
103
104
Frequency (Hz)
Pres
sure
PSD
(Pa2 /H
z)
100 200 300 400 500
102
103
104

2-30
Figure 58: Downstream pressure PSD for launch vehicle payload bay spectrum.
Figure 59: Coherence between upstream and downstream locations for launch vehicle payload bay spectrum.
Frequency (Hz)
Pres
sure
PSD
(Pa2 /H
z)
100 200 300 400 500
102
103
104
Frequency (Hz)
Coh
eren
ce
100 200 300 400 5000
0.1
0.2
0.3
0.4
0.5
0.6
0.7
0.8
0.9
1

2-31
Figure 60: Drive signal PSD for launch vehicle payload bay spectrum.
Figure 61: Control pressure PSD for RLV lift-off spectrum.
Frequency (Hz)
Driv
eSi
gnal
(V2 /H
z)
100 200 300 400 50010-10
10-9
10-8
10-7
10-6
10-5
10-4
10-3
Frequency (Hz)
Pres
sure
PSD
(Pa2 /H
z)
100 200 300 400 500102
103
104
105

2-32
Figure 62: Upstream pressure PSD for RLV lift-off spectrum.
Figure 63: Downstream pressure PSD for RLV lift-off spectrum.
Frequency (Hz)
Pres
sure
PSD
(Pa2 /H
z)
100 200 300 400 500102
103
104
105
Frequency (Hz)
Pres
sure
PSD
(Pa2 /H
z)
100 200 300 400 500102
103
104
105

2-33
Figure 64: Coherence between upstream and downstream locations for RLV lift-off spectrum.
Figure 65: Drive signal PSD from RLV lift-off spectrum.
Frequency (Hz)
Coh
eren
ce
100 200 300 400 5000
0.1
0.2
0.3
0.4
0.5
0.6
0.7
0.8
0.9
1
Frequency (Hz)
Driv
eSi
gnal
(V2 /H
z)
100 200 300 400 50010-6
10-5
10-4
10-3

3-1
3. Temperature Control and Thermocouple Data Acquisition
During the summer of 2000, a new closed-loop temperature controller and thermocouple data acquisition system was developed to replace an existing system (see Section 1.1). The system was installed and tested on a dummy test article, but no attempt was made to characterize its performance. A brief description of the system, however, is provided below.
3.1. Hardware Description The system hardware is comprised of the following pieces of equipment:
•= Host PC computer with National Instruments PCI-MIO-16XE-10 I/O board
•= Dual 4-slot National Instruments SCXI-1000 chassis with (1) SCXI-1346 shielded multi-chassis adapter interface, (2) National Instruments SCXI-1102 32-channel thermocouple input modules, (1) National Instruments SCXI-1126 8-channel isolated frequency input module, and (2) National Instruments SCXI-1124 6-channel isolated analog output modules.
Hardware inputs are comprised of the following:
•= SCXI-1102 Unit 1: (32) Type-K thermocouples
•= SCXI-1102 Unit 2: (31) Type-J thermocouples (1) Lamp bank cooling air pressure
•= SCXI-1126: (1) Global cooling water flow rate (1) Test section wall upstream cooling water rate (1) Test section wall downstream cooling water rate (1) Lamp bank wall upstream cooling water rate (1) Lamp bank wall downstream cooling water rate (1) Upper test section insert cooling water rate (1) Lower test section insert cooling water rate (1) Lamp bank cooling water rate
Hardware outputs are comprised of the following:
•= SCXI-1124 Unit 1: (6) 0-5 VDC outputs for each SCR channel providing power to lamp banks 1-6
•= SCXI-1124 Unit 2: (4) 0-5 VDC outputs for each SCR channel providing power to lamp banks 7-10 (1) 0-5 VDC output for SCR permissive relay
A detailed description of the electrical wiring, flow and pressure meters, etc. may be found in the facility Configuration Management documentation.
3.2. Software Description A customized National Instruments LabView 5.1 application was written for the host PC running the Microsoft Windows 98 Second Edition operating system. The functional specification was developed by the author and the software was written under contract by Wyle Laboratories, Hampton. The software performs both temperature control and thermocouple data acquisition functions.
3-2
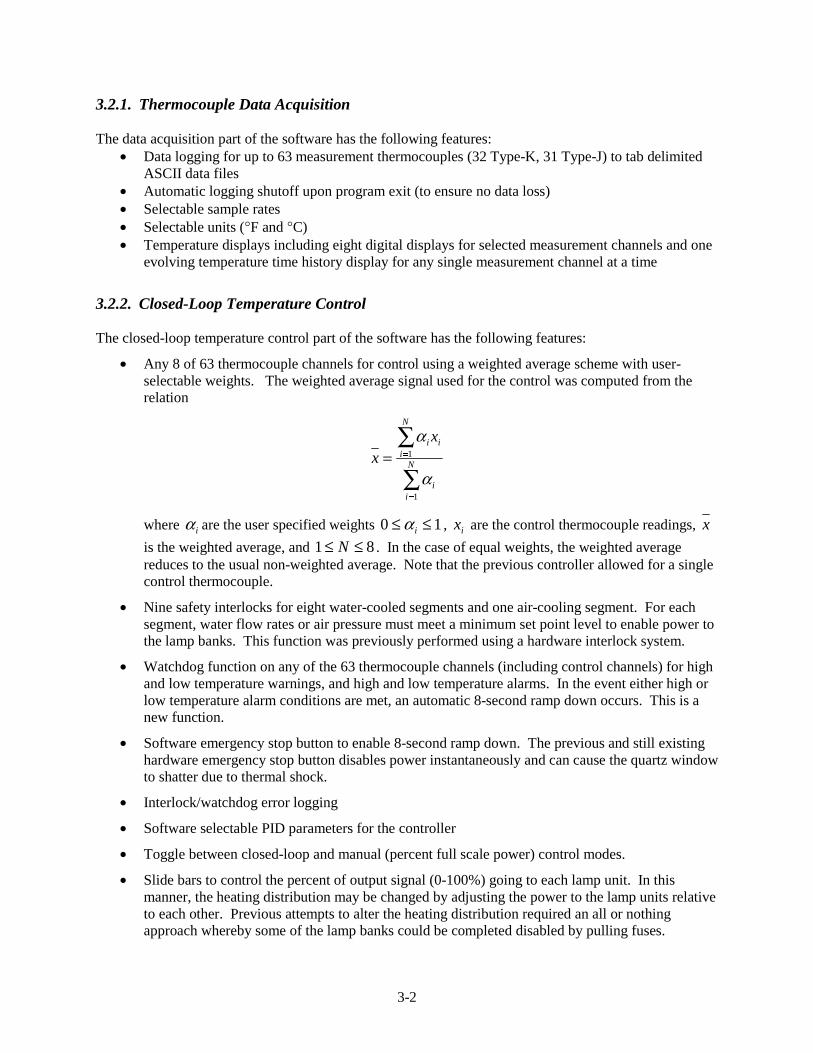
3.2.1. Thermocouple Data Acquisition
The data acquisition part of the software has the following features: • Data logging for up to 63 measurement thermocouples (32 Type-K, 31 Type-J) to tab delimited
ASCII data files • Automatic logging shutoff upon program exit (to ensure no data loss) • Selectable sample rates • Selectable units (°F and °C) • Temperature displays including eight digital displays for selected measurement channels and one
evolving temperature time history display for any single measurement channel at a time
3.2.2. Closed-Loop Temperature Control
The closed-loop temperature control part of the software has the following features:
• Any 8 of 63 thermocouple channels for control using a weighted average scheme with user-selectable weights. The weighted average signal used for the control was computed from the relation
1
1
N
i ii
N
ii
xx
�
�
=
=
��
�
where i� are the user specified weights 0 1i�� � , ix are the control thermocouple readings, x
is the weighted average, and 1 8N� � . In the case of equal weights, the weighted average reduces to the usual non-weighted average. Note that the previous controller allowed for a single control thermocouple.
• Nine safety interlocks for eight water-cooled segments and one air-cooling segment. For each segment, water flow rates or air pressure must meet a minimum set point level to enable power to the lamp banks. This function was previously performed using a hardware interlock system.
• Watchdog function on any of the 63 thermocouple channels (including control channels) for high and low temperature warnings, and high and low temperature alarms. In the event either high or low temperature alarm conditions are met, an automatic 8-second ramp down occurs. This is a new function.
• Software emergency stop button to enable 8-second ramp down. The previous and still existing hardware emergency stop button disables power instantaneously and can cause the quartz window to shatter due to thermal shock.
• Interlock/watchdog error logging
• Software selectable PID parameters for the controller
• Toggle between closed-loop and manual (percent full scale power) control modes.
• Slide bars to control the percent of output signal (0-100%) going to each lamp unit. In this manner, the heating distribution may be changed by adjusting the power to the lamp units relative to each other. Previous attempts to alter the heating distribution required an all or nothing approach whereby some of the lamp banks could be completed disabled by pulling fuses.

4-1
4. Summary
Substantial improvements to the performance of the TAFA progressive wave tube facility were made through the addition of new closed-loop acoustic and thermal controllers. Acoustic control was improved in spectrum shaping ability, test section coherence, the addition of multiple inputs to the control, and the time required to attain control. These improvements make possible the generation of a wide variety of test spectra, including blast or transient loadings using the “last drive” feature. In addition, the frequency range of the facility was extended to 40-500 Hz from the previous 40-480 Hz and increases of up to nearly 1 dB were noted in OASPL. Facility safety can also be enhanced through the watchdog feature of limiting output power to the air modulators, and notching can be utilized to limit energy to the test article within specified frequency bands. Thermal control was improved through the addition of multiple inputs to the control system, the ability to change the distribution of power to the individual lamp banks, and integrated thermocouple data acquisition. Safety was improved through the addition of watchdog channels with hi/low alarm and abort limits, and a ramp down of power on shutdown to avoid thermal shock.
5-1
5. References
[1] Rizzi, S.A., "Recent Sonic Fatigue Activities at NASA Langley Research Center," Workshop on Dynamics of Composite Aerospace Structures in Severe Environments, Southampton, England, July, 1991.
[2] Rizzi, S.A., "Experimental Research Activities in Dynamic Response and Sonic Fatigue Analysis of Hypersonic Vehicle Structures at NASA Langley Research Center," Proceedings of the AIAA 31st Aerospace Sciences Meeting, AIAA-93-0383, Reno, NV, 1993.
[3] Rizzi, S.A., Clevenson, S.A., and Daniels, E.F., "Acoustic Fatigue Characterization of Carbon/Carbon Panels," Proceedings of the VII International Congress on Experimental Mechanics, Vol. 2, pp. 1348-1355, Las Vegas, NV, 1992.
[4] Clevenson, S.A. and Daniels, E.F., "Capabilities of the Thermal Acoustic Fatigue Apparatus,", NASA TM 104106, February 1992 1992.
[5] Rizzi, S.A. and Turner, T.L., "Enhanced Capabilities of the NASA Langley Thermal Acoustic Fatigue Apparatus," Structural Dynamics: Recent Advances, Proceedings of the 6th International Conference, Vol. 2, pp. 919-933, Southampton, England, 1997.
[6] "VibControl/NT, Revision 2.4.0 Manual," M+P International, Inc., 1999.
REPORT DOCUMENTATION PAGE Form Approved OMB No. 0704-0188
Public reporting burden for this collection of information is estimated to average 1 hour per response, including the time for reviewing instructions, searching existing data sources, gathering and maintaining the data needed, and completing and reviewing the collection of information. Send comments regarding this burden estimate or any other aspect of this collection of information, including suggestions for reducing this burden, to Washington Headquarters Services, Directorate for Information Operations and Reports, 1215 Jefferson Davis Highway, Suite 1204, Arlington, VA 22202-4302, and to the Office of Management and Budget, Paperwork Reduction Project (0704-0188), Washington, DC 20503. 1. AGENCY USE ONLY (Leave blank)
2. REPORT DATE
October 2000 3. REPORT TYPE AND DATES COVERED
Technical Memorandum 4. TITLE AND SUBTITLE
Improvements To Progressive Wave Tube Performance Through Closed-Loop Control
5. FUNDING NUMBERS 522-63-11-03
6. AUTHOR(S) Stephen A. Rizzi
7. PERFORMING ORGANIZATION NAME(S) AND ADDRESS(ES)
National Aeronautics and Space Administration Langley Research Center Hampton, VA 23681-2199
8. PERFORMING ORGANIZATION REPORT NUMBER
L-18040
9. SPONSORING/MONITORING AGENCY NAME(S) AND ADDRESS(ES)
National Aeronautics and Space Administration Langley Research Center Hampton, VA 23681-2199
10. SPONSORING/MONITORING AGENCY REPORT NUMBER
NASA/TM-2000-210623
11. SUPPLEMENTARY NOTES
12a. DISTRIBUTION/AVAILABILITY STATEMENT Unclassified-Unlimited Subject Category 09 Distribution: Nonstandard Availability: NASA CASI (301) 621-0390
12b. DISTRIBUTION CODE
13. ABSTRACT (Maximum 200 words) This report documents recent improvements to the acoustic and thermal control systems of the Thermal Acoustic Fatigue Apparatus (TAFA), a progressive wave tube test facility at the NASA Langley Research Center, Hampton, Virginia. A brief summary of past acoustic performance is given first to serve as a basis for comparison with the new performance data using a multiple-input, closed-loop, narrow-band controller. Performance data in the form of test section acoustic power spectral densities and coherence are presented in three of six facility configurations for a variety of input spectra. Tested spectra include uniform, two cases of pink noise, three cases of narrow-band random, a simulated launch payload bay environment for an expendable launch vehicle, and a simulated external acoustic load for the aft section of a reusable launch vehicle. In addition, a new closed-loop temperature controller and thermocouple data acquisition system are described.
15. NUMBER OF PAGES 55
14. SUBJECT TERMS Ground testing, progressive wave tube, sonic fatigue, acoustic fatigue, acoustic control, narrow-band acoustic control, thermal control, quartz lamp heating 16. PRICE CODE
A04 17. SECURITY CLASSIFICATION
OF REPORT Unclassified
18. SECURITY CLASSIFICATION OF THIS PAGE Unclassified
19. SECURITY CLASSIFICATION OF ABSTRACT Unclassified
20. LIMITATION OF ABSTRACT UL
NSN 7540-01-280-5500 Standard Form 298 (Rev. 2-89) Prescribed by ANSI Std. Z-39-18 298-102