Improvement of varietal aroma in grape and tropical fruit wines by optimal choice of yeasts and
295
Faculty of Agricultural Sciences, Nutritional Sciences and Environmental Management Justus-Liebig-University Giessen, Germany and Department of Microbiology and Biochemistry Geisenheim Research Center, Germany Improvement of varietal aroma in grape and tropical fruit wines by optimal choice of yeasts and nutrient supplements Thesis submitted in partial fulfilment of the requirements for the degree of Doctor agriculturae (Dr. agr.) Submitted by Pattharaporn Srisamatthakarn Lampang/Thailand 2011
Transcript of Improvement of varietal aroma in grape and tropical fruit wines by optimal choice of yeasts and

Faculty of Agricultural Sciences, Nutritional Sciences
and Environmental Management
Justus-Liebig-University Giessen, Germany
and
Department of Microbiology and Biochemistry
Geisenheim Research Center, Germany
Improvement of varietal aroma in grape and tropical fruit wines by optimal choice of yeasts
and nutrient supplements
Thesis submitted in partial fulfilment of
the requirements for the degree of
Doctor agriculturae
(Dr. agr.)
Submitted by Pattharaporn Srisamatthakarn
Lampang/Thailand 2011
This Ph.D. work was approved by the committee (Faculty 09: Agricultural Sciences, Nutritional Sciences, and Environmental Management) of Justus-Liebig-University Giessen, as a thesis to award the Doctor degree of agriculturae (Dr. agr.)
1. Supervisor: Professor Dr. Hans Brückner 2. Supervisor: Professor Dr. Doris Rauhut 3. Supervisor: Professor Dr. Sylvia Schnell Date of disputation: 24 January 2011

ABSTRACT
The main objective of this study was to improve fermentation of yellow passion fruit (YPF)
juice by an adequate choice of commercial Saccharomyces yeast strains and nutrient
supplements.
Comprehensive information has been gathered on the basis of the experimental results
obtained from the research on grape wines of the varieties Scheurebe and Sauvignon blanc.
The study showed that under laboratory conditions, the optimal commercial yeast strains for
the fermentation of Scheurebe wine are strains VIN13, AWRI R2, EC1118, QA23, VL3, X5
and X16 and the most effective nutrients are diammonium hydrogen phosphate (DAP),
Fermaid E blanc (DAP, thiamine, yeast cell walls and ammonium sulphate) and Superstart
(inactivated yeast and yeast cell walls) at 0.3 g L-1. Yeast strains X5, Alchemy I and II,
EC1118 and VL3 and/or the nutrient sources of 0.4 g L-1 Fermaid E blanc, 0.5 g L-1 DAP and
0.3 g L-1 Superstart seemed to be the most effective for the fermentation of Sauvignon blanc
wine.
The optimal choice of commercial Saccharomyces yeast strains and nutrient
supplementations in YPF juice was studied in detail based on the results, which were
obtained from grape wines.
YPF puree was used for fermentation trials. The puree has a high acidity (4.0-5.5 % citric
acid). Therefore, it was diluted by the addition of water, thus this prepared YPF juice showed
a lower amino nitrogen level. Consequently, there is a need for nutrient supplementation,
because nitrogen deficiencies are linked to slow and sluggish fermentations and the
formation of SO2-binding compounds and reduced sulphur compounds.
The prepared YPF juices were fermented at 20 0C under controlled conditions and the
fermentation characteristics, fermentation-derived and varietal aromas which impact YPF
wine quality were investigated. In order to select adequate commercial yeast strains for the
improvement of YPF wine, five Saccharomyces cerevisiae var. bayanus strains (EC1118,
AWRI R2, LittoLevure, QA23 and Freddo), seven Saccharomyces cerevisiae strains
(Sauvignon, VL3, X5, X16, VIN13, 4F9 and LVCB) and two Saccharomyces spp. strains
(Alchemy I and II) were examined. The results revealed that when 0.5 g L-1 DAP was added
as sole source of nitrogen in the YPF juice, strains QA23, LittoLevure, EC1118, X5, VL3 and
Alchemy I and II seemed to be an optimal choice for the YPF wine production.
Yeast strains EC1118, VL3, X5, Sauvignon, Alchemy I and LittoLevure were then selected to
study the yeast fermentation behaviour and the production of metabolic compounds as well
as the volatile thiols in YPF wines. In addition, different nutrient supplements were tested to
select an appropriate nitrogen source and concentration. The results clearly showed that
nutrient supplements like Vitamon Combi (DAP and thiamine) and Vitamon Ultra (DAP,

thiamine and yeast cell walls) at the levels normally recommended for grape wine production
(0.4-0.5 g L-1) were the best nutrient condition to improve the fermentation characteristics
and the formation of desirable non-volatile and volatile compounds in the YPF wines for most
yeast strains mentioned above.
The results also showed that the EC1118 with the addition of 0.25 g L-1 DAP and 0.5 g L-1
Vitamon Combi appeared to be a high producer of varietal volatile thiols, 3-sulphanylhexanol
(3SH) and acetic acid 3-sulphanylhexyl ester (3SHA). Nevertheless, it has to be taken into
account that DAP addition resulted in excessive formation of keto acids by strain X5. Strain
LittoLevure also formed the highest amounts of 3SHA in the 0.5 g L-1 Vitamon Combi
treatment. Yeast strain X5 with the addition of Vitamon Combi and Vitamon Ultra at 0.4 g L-1
also produced the YPF wine having the greatest concentration of 3SH. Neither the yeast
strains (EC1118 and X5) nor the nutrient sources (Vitamon Combi and Vitamon Ultra)
influenced the level of 3SHA in YPF wines. Concentrations of 3SH and 3SHA were quite
beyond their aroma threshold contributing to typical and varietal aromas.
It can be concluded that certain yeast strains and optimal nutrient supplementations had a
great impact on successful YPF wine fermentation, minimizing the formation of SO2-binding
and undesirable volatile sulphur compounds and improving desirable aroma compounds in
final YPF wine products. Nevertheless, the choice of nutrient supplements and their
concentrations is yeast strain-dependent.
This study has an important implication for the YPF wine as well as for the tropical fruit
winemaking industry, particularly in Thailand, where a better understanding of the nutritional
requirements of Saccharomyces yeast is necessary to reduce fermentation problems and to
improve the final product quality. It is worthwhile pointing out that this work is an interesting
new observation for the YPF wine fermentation, although the fermentation trials were only
done in the laboratory scale. Thus, some different fermentation parameters as well as volatile
compounds might be achieved under industrial conditions. Nevertheless, a better
understanding of the effect of nutrient supplementation on yeast metabolic products as well
as sensory properties is still required in further work in both the laboratory and pilot scale.

Contents
1. INTRODUCTION 1
1.1 Statement and significance of the study 1
1.2 Objectives 5
2. LITERATURE REVIEW 6
2.1 Yeasts
- Nomenclature of enological yeasts
- The origin and importance of enological yeasts
- Impact of enological yeasts on wine fermentation
6
2.2 Nitrogen-containing compounds in winemaking 12
2.3 Odour-active compounds involved in varietal aromas in grape and wines 26
2.4 Sulphur containing compounds in winemaking 38
2.5 Passion fruit (Passiflora edulis Sims) 47
3. MATERIALS AND METHODS 53
3.1 Raw materials 53
3.2 Yeast strains employed for winemaking in industry 53
3.3 Yeast nutrients 56
3.4 Chemical reagents and enzymes 57
3.5 Fermentation kinetics 58
3.6 Analytical methods
3.6.1 Physico-chemical analytical methods
3.6.2 Organic acids using a high performance liquid chromatographic method
3.6.3 Gas chromatographic methods
58
3.7 Fermentation trials of Scheurebe grape juice 64
3.8 Fermentation trials of Sauvignon blanc grape juice 66
3.9 Fermentation trials of yellow passion fruit juice 70

Contents 4. RESULTS 76
4.1 Effects of commercial Sacchromyces yeast strains and nutrient supplements
on wine fermentative characteristics and quality of Scheurebe grape wines
76
4.1.1 Effect of two commercial Saccharomyces yeast strains and four nutrient
sources on fermentative characteristics, metabolic compounds and wine
aromas of Scheurebe grape wines
76
4.1.2 Effect of thirteen commercial Saccharomyces yeast strains on fermentative
characteristics, metabolic compounds and wine aromas of Scheurebe grape
wines
88
4.2 Effects of yeast strains and/or nutrient supplements on wine fermentation and
quality of Sauvignon blanc grape wines
99
4.2.1 Effect of nine commercial Saccharomyces yeast strains and two nutrient
sources on fermentative characteristics, metabolic compounds and wine
aromas of Sauvignon blanc grape wines
99
4.2.2 Impact of five commercial yeast strains and four nutrient sources on
fermentative characteristics, metabolic compounds and wine aroma of
Sauvignon blanc grape wines
111
4.3 Effects of yeast strains and nutrient supplement on wine fermentation and
quality of yellow passion fruit wines
124
4.3.1 Effect of fourteen commercial Saccharomyces yeast strains on fermentative
characteristics, metabolic compounds and aromas of yellow passion fruit
wines
124
4.3.2 Effect of three commercial Saccharomyces strains and five different
commercial nutrient sources on growth kinetics, fermentative characteristics,
metabolic compounds and aromas of yellow passion fruit wines
134
4.3.3 Effect of five commercial Saccharomyces yeast strains and two different
commercial nutrient sources at different concentrations on growth kinetics,
fermentative characteristics, metabolic compounds and aromas of yellow
passion fruit wines
146
4.3.4 Effect of three commercial Saccharomyces yeast strains and four different
nutrient sources at two different concentrations on growth kinetics,
fermentative characteristics, metabolic compounds and aromas of yellow
passion fruit wines
161

Contents 4.4 Volatile thiols involved in varietal aromas of yellow passion fruit wines 178
5. DISCUSSION 182
5.1 Effects of commercial Saccharomyces yeast strains and nutrient supplements
on wine fermentative characteristics and quality of Scheurebe grape wines
182
5.1.1 Effect of commercial Saccharomyces yeast strains and nutrient sources on
fermentative characteristics, metabolic compounds and wine aroma of Scheurebe
grape wines
182
5.1.2 Effect of thirteen commercial Saccharomyces yeast strains on fermentative
characteristics, metabolic compounds and wine aroma of Scheurebe grape wines
185
5.2 Effects of yeast strains and/or nutrient supplements on wine fermentation and
quality of Sauvignon blanc grape wines
188
5.2.1 Effect of nine commercial Saccharomyces yeast strains and two nutrient
sources on fermentative characteristics, metabolic compounds and wine aroma of
Sauvignon blanc grape wines
188
5.2.2 Impact of five commercial yeast strains and four nutrient sources on
fermentative characteristics, metabolic compounds and wine aromas of Sauvignon
blanc grape wines
190
5.3 Effects of yeast strains and nutrient supplements on wine fermentation and
quality of yellow passion fruit wines
193
5.3.1 Effect of fourteen commercial Saccharomyces yeast strains on fermentative
characteristics, metabolic compounds and aromas of yellow passion fruit wines
194
5.3.2 Effect of three commercial Saccharomyces yeast strains and five different
commercial nutrient sources on growth kinetics, fermentative characteristics,
metabolic compounds and aromas of yellow passion fruit wines
197
5.3.3 Effect of five commercial Saccharomyces yeast strains and two different
commercial nutrient sources at different concentrations on growth kinetics,
fermentative characteristics, metabolic and aroma compounds of yellow passion
fruit wines
200
5.3.4 Effect of three commercial Saccharomyces yeast strains and four different
nutrient sources at two different concentrations on growth kinetics, fermentative
characteristics, metabolic compounds and aroma of yellow passion fruit wines
204

Contents
6. CONCLUSION AND PERSPECTIVES 211
7. REFERENCES 216
8. ADDENDUM 267

List of Tables
Table 2-1 List of the Saccharomyces yeasts, with their teleomorphic and
anamorphic names
8
Table 2-2 The identity and concentration of amino acids found in the whole
grape and/or juice at harvest
17
Table 2-3 Concentration of nitrogen containing compounds found in grape juice
and wine
21
Table 2-4 The odour-active compounds involved in the varietal aromas in wine 29
Table 2-5 The sulphur containing compounds, including thiols, commonly found
in wine
46
Table 2-6 The chemical compositions of the yellow passion fruit (per 100 g of
edible portion)
49
Table 2-7 Quantities of amino acid (AA) enantiomers in yellow passion fruit 50
Table 3-1 List of the commercial yeast strains used in the study 54
Table 3-2 Enological properties of eighteen commercial yeast strains used in
the study
55
Table 3-3 List of the commercial yeast nutrients used in the study 56
Table 3-4 Chromatographic parameters for the analysis of esters, fatty acids
and monoterpenes in juice and wine by GC-MS as described in
3.6.3.1
61
Table 3-5 Chromatographic parameters for the analysis of low boiling point
sulphur containing compounds in wine samples by GC-PFPD as
described in 3.6.3.2
62
Table 3-6 Chromatographic parameters for the analysis of aroma compounds in
wine samples by GC-MSD as described in 3.6.3.3
64
Table 3-7 Experimental design of yeast inoculation and nutrient
supplementation
65
Table 3-8 Experimental design of yeast inoculation and nutrient
supplementation in fresh Sauvignon blanc grape juice from the 2008
harvest season
67
Table 3-9 Experimental design of yeast inoculation and nutrient
supplementation in Sauvignon blanc grape juice fermentation
69
List of Tables
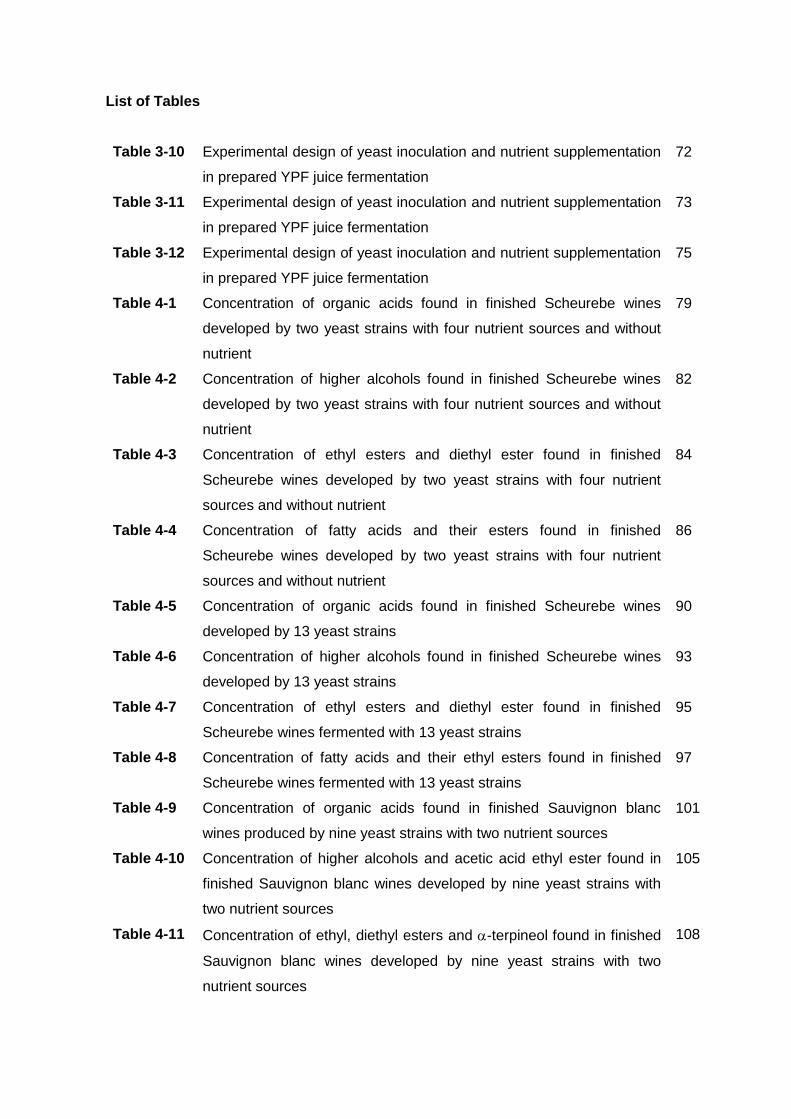
Table 3-10 Experimental design of yeast inoculation and nutrient supplementation
in prepared YPF juice fermentation
72
Table 3-11 Experimental design of yeast inoculation and nutrient supplementation
in prepared YPF juice fermentation
73
Table 3-12 Experimental design of yeast inoculation and nutrient supplementation
in prepared YPF juice fermentation
75
Table 4-1 Concentration of organic acids found in finished Scheurebe wines
developed by two yeast strains with four nutrient sources and without
nutrient
79
Table 4-2 Concentration of higher alcohols found in finished Scheurebe wines
developed by two yeast strains with four nutrient sources and without
nutrient
82
Table 4-3 Concentration of ethyl esters and diethyl ester found in finished
Scheurebe wines developed by two yeast strains with four nutrient
sources and without nutrient
84
Table 4-4 Concentration of fatty acids and their esters found in finished
Scheurebe wines developed by two yeast strains with four nutrient
sources and without nutrient
86
Table 4-5 Concentration of organic acids found in finished Scheurebe wines
developed by 13 yeast strains
90
Table 4-6 Concentration of higher alcohols found in finished Scheurebe wines
developed by 13 yeast strains
93
Table 4-7 Concentration of ethyl esters and diethyl ester found in finished
Scheurebe wines fermented with 13 yeast strains
95
Table 4-8 Concentration of fatty acids and their ethyl esters found in finished
Scheurebe wines fermented with 13 yeast strains
97
Table 4-9 Concentration of organic acids found in finished Sauvignon blanc
wines produced by nine yeast strains with two nutrient sources
101
Table 4-10 Concentration of higher alcohols and acetic acid ethyl ester found in
finished Sauvignon blanc wines developed by nine yeast strains with
two nutrient sources
105
Table 4-11 Concentration of ethyl, diethyl esters and -terpineol found in finished
Sauvignon blanc wines developed by nine yeast strains with two
nutrient sources
108

List of Tables
Table 4-12 Concentration of fatty acids found in finished Sauvignon blanc wines
developed by nine yeast strains with two nutrient sources
109
Table 4-13 Chemical composition of finished wines obtained from fresh
Sauvignon blanc grape juices fermented with five yeast strains and
four nutrient sources
113
Table 4-14 Concentration of organic acids found in finished Sauvignon blanc wines
produced by five yeast strains with four nutrient sources
114
Table 4-15 Concentration of ethyl esters found in finished Sauvignon blanc grape
wines developed by five yeast strains with four nutrient sources
121
Table 4-16 Concentration of medium-chain fatty acids found in finished
Sauvignon blanc wines developed by five yeast strains with four
nutrient sources
122
Table 4-17 Concentration of organic acids found in finished YPF wines produced
by 14 yeast strains
126
Table 4-18 Concentration of fatty acids found in finished YPF wines developed
by 14 yeast strains
133
Table 4-19 Chemical composition of finished YPF wines obtained from frozen
YPF juices fermented with three different yeast strains and five
nutrient sources
136
Table 4-20 Concentration of organic acids found in finished YPF wines produced
by three different yeast strains with five nutrient sources
137
Table 4-21 Concentration of ethyl esters found in finished YPF wines produced
by three different yeast strains with five nutrient sources
143
Table 4-22 Concentration of fatty acids and their ethyl esters found in finished
YPF wines produced by three different yeast strains with five nutrient
sources
145
Table 4-23 Physico-chemical composition and some aromas of YPF puree and
prepared YPF juice used in this fermentation trial
147
Table 4-24 Chemical composition of finished YPF wines obtained from YPF
juices fermented with five different yeast strains with two nutrient
sources at two different concentrations
150
Table 4-25 Concentration of organic acids found in finished YPF wines produced
by five different yeast strains with two nutrient sources at two different
concentrations
151

List of Tables
Table 4-26 Concentration of ethyl and diethyl esters found in finished YPF wines
produced by five different yeast strains with two nutrient sources at
two different concentrations
158
Table 4-27 Concentration of fatty acids and their ethyl esters found in finished YPF
wines produced by five different yeast strains with two nutrient sources at
two different concentrations
160
Table 4-28 Chemical compositions of YPF puree and prepared YPF juice used in
this fermentation trial
162
Table 4-29 Chemical composition of final YPF wines obtained from YPF juices
fermented with three different yeast strains with four nutrient sources
at two different concentrations
165
Table 4-30 Concentration of organic acids found in finished YPF wines produced
by three different yeast strains with four nutrient sources at two
different concentrations
166
Table 4-31 Concentration of butanoic and isobutanoic acid ethyl esters present in
finished YPF wines developed by three different yeast strains with
four nutrient sources at two different concentrations
173
Table 4-32 Concentration of ethyl esters and diethyl ester present in finished
YPF wines developed by three different yeast strains with four
nutrient sources at two different concentrations
174
Table 4-33 Concentration of fatty acids present in finished YPF wines developed
by three different yeast strains with four nutrient sources at two
different concentrations
176
Table 4-34 Concentration of fatty acid ethyl esters present in finished YPF wines
developed by three different yeast strains with four nutrient sources at
two different concentrations
177
Table A-1 Concentration of amino acids in Scheurebe grape juice used in trials
described in chapter 3.7.1 to 3.7.2
267
Table A-2 Concentration of amino acids in fresh Sauvignon blanc grape juice
used in trials described in chapter 3.8.1 to 3.8.2
268
Table A-3 Concentration of amino acids in prepared YPF juice used in YPF
trials described in chapter 3.9.1 to 3.9.4
269

List of Figures
Figure 2-1 A schematic representation of derivation and synthesis of flavour-
active compounds from sugar, amino acids and sulphur metabolism
by wine yeast
10
Figure 2-2 Central pathways for nitrogen metabolism 24
Figure 2-3 Formation of higher alcohols from sugar and amino acids by the
Ehrlich pathway
26
Figure 2-4 Odour-active volatile thiols identified in Sauvignon blanc wine 32
Figure 2-5 The sulphur-cysteine conjugates 33
Figure 2-6 Release of 4-MSP from the corresponding sulphur–cysteine-
conjugate
34
Figure 2-7 The cysteine conjugate form of 3SH, which revealed by a specific -
lyase
35
Figure 2-8 Metabolism of sulphur amino acids in of Saccharomyces cervisiae 41
Figure 4-1 Growth kinetics of fresh Scheurebe grape juice fermentations with
two yeast strains and four nutrient sources
77
Figure 4-2 Concentration of residual sugar and glycerol in finished Scheurebe
grape wines fermented with two yeast strains, four nutrient sources
and without nutrient
78
Figure 4-3 Concentration of SO2-binding compounds in finished Scheurebe
grape wines produced by two yeast strains with four nutrient sources
and without nutrient
80
Figure 4-4 Formation of hydrogen sulphide and dimethyl sulphide in finished
Scheurebe grape wines produced by two yeast strains with four
nutrient sources and without nutrient
81
Figure 4-5 Formation of 2-phenyl ethanol and acetic acid ethyl ester in finished
Scheurebe grape wines developed by two yeast strains with four
nutrient sources and without nutrient
82
Figure 4-6 Formation of acetic acid esters in finished Scheurebe grape wines
developed by two yeast strains with four nutrient sources and without
nutrient (*10 = concentration of compound times 10)
85

List of Figures
Figure 4-7 Formation of monoterpenes in finished Scheurebe grape wines
developed by two yeast strains with four nutrient sources and without
nutrient
87
Figure 4-8 Growth kinetics of fresh Scheurebe grape juice fermentations with 13
different commercial yeast strains
89
Figure 4-9 Concentration of residual sugar and glycerol in finished Scheurebe
grape wines produced by 13 different yeast strains
89
Figure 4-10 Concentration of SO2-binding compounds in finished Scheurebe
grape wines produced by 13 different yeast strains
91
Figure 4-11 Formation of hydrogen sulphide, dimethyl sulphide and carbon
disulphide in finished Scheurebe grape wines produced by 13
different yeast strains
92
Figure 4-12 Formation of 2-phenyl ethanol and acetic acid ethyl ester in finished
Scheurebe grape wines produced by 13 different yeast strains
94
Figure 4-13 Formation of acetic acid esters found in finished Scheurebe grape
wines developed by 13 different yeast strains (*10 = concentration of
compound times 10)
94
Figure 4-14 Formation of monoterpenes found in finished Scheurebe grape wines
developed by 13 different yeast strains
98
Figure 4-15 Fermentation kinetics of fresh Sauvignon blanc grape juice
fermentations with nine different commercial yeast strains and two
nutrient sources
100
Figure 4-16 Concentration of residual sugar and glycerol found in finished
Sauvignon blanc grape wines fermented with nine yeast strains and
two nutrient sources
100
Figure 4-17 Concentration of SO2-binding compounds in finished Sauvignon blanc
grape wines fermented with nine yeast strains and two nutrient
sources
103
Figure 4-18 Concentration of dimethyl sulphide, carbon disulphide and dimethyl
disulphide found in finished Sauvignon blanc grape wines produced
by nine yeast strains and two nutrient sources
103
Figure 4-19 Concentration of acetic acid esters found in finished Sauvignon blanc
wines developed by nine yeast strains with two nutrient sources
106

List of Figures
Figure 4-20 Concentration of fatty acid esters found in finished Sauvignon blanc
wines developed by nine yeast strains with two nutrient sources
110
Figure 4-21 Fermentation kinetics of fresh Sauvignon blanc grape juice
fermentations with five commercial yeast strains and four commercial
nutrient sources
112
Figure 4-22 Concentration of SO2-binding compounds found in finished
Sauvignon blanc grape wines produced by five yeast strains with four
nutrient sources
115
Figure 4-23 Concentration of total sulphur dioxide found in finished Sauvignon
blanc grape wines produced by five yeast strains with four nutrient
sources
116
Figure 4-24 Concentration of sulphur containing compounds found in finished
Sauvignon blanc grape wines produced by five yeast strains with four
nutrient sources
117
Figure 4-25 Concentration of higher alcohols found in finished Sauvignon blanc
grape wines produced by five yeast strain with four nutrient sources
(*10 = concentration of compound times 10)
118
Figure 4-26 Concentration of acetic acid esters found in finished Sauvignon blanc
grape wines produced by five yeast strains with four nutrient sources
(*10 = concentration of compound times 10)
120
Figure 4-27 Concentration of fatty acid ethyl esters found in finished Sauvignon
blanc grape wines produced by five yeast strains with four nutrient
sources
123
Figure 4-28 Growth kinetics of YPF juice fermentations with 14 different
commercial yeast strains
125
Figure 4-29 Concentration of residual sugar and glycerol in finished YPF wines
produced by 14 different yeast strains
125
Figure 4-30 Concentration of SO2-binding compounds in finished YPF wines
produced by 14 different yeast strains
127
Figure 4-31 Concentration of carbon disulphide and thioacetic acid S-methylester
found in finished YPF wines produced by 14 different yeast strains
128
Figure 4-32 Concentration of higher alcohols found in finished YPF wines
developed by 14 different yeast strains
129

List of Figures
Figure 4-33 Concentration of acetic acid esters found in finished YPF wines
developed by 14 different yeast strains (*10 = concentration of
compound times 10, whereas /10 = concentration of compound
divides by 10)
130
Figure 4-34 Concentration of ethyl esters found in finished YPF wines developed
by 14 different yeast strains ( /1000 = concentration of compound
divides by 1000)
131
Figure 4-35 Concentration of linalool and -terpineol found in finished YPF wines
developed by 14 different yeast strains
132
Figure 4-36 Concentration of fatty acid ethyl esters found in finished YPF wines
developed by 14 different yeast strains
133
Figure 4-37 Fermentation kinetics of YPF juice fermentations with three different
commercial yeast strains and four different nutrient sources
134
Figure 4-38 Concentration of SO2-binding compounds found in finished YPF
wines produced by three different yeast strains with five nutrient
sources
138
Figure 4-39 Concentration of carbon disulphide and thioacetic acid S-methylester
found in finished YPF wines produced by three different yeast strains
with five nutrient sources
139
Figure 4-40 Concentration of higher alcohols found in finished YPF wines
developed by three different yeast strains with five nutrient sources
140
Figure 4-41 Concentration of acetic acid esters found in finished YPF wines
developed by three different yeast strains with five nutrient sources
(*10 = concentration of compound times 10)
141
Figure 4-42 Concentration of linalool and -terpineol found in finished YPF wines
developed by three different yeast strains with five nutrient sources
144
Figure 4-43 Growth kinetics of YPF juice fermentations with five different
commercial yeast strains and two different nutrient sources at two
different concentrations
148
Figure 4-44 Concentration of SO2-binding compounds found in finished YPF
wines produced by five different yeast strains with two nutrient
sources at two different concentrations
152

List of Figures
Figure 4-45 Concentration of hydrogen sulphide, carbon disulphide, methanethiol
and MeSAc found in finished YPF wines produced by five different
yeast strains with two nutrient sources at two different concentrations
153
Figure 4-46 Concentration of higher alcohols found in finished YPF wines
developed by five different yeast strains with two nutrient sources at
two different concentrations
155
Figure 4-47 Concentration of acetic acid esters found in finished YPF wines
developed by five different yeast strains with two nutrient sources at
two different concentrations (*10 = concentration of compound times
10)
156
Figure 4-48 Concentration of linalool and -terpineol found in finished YPF wines
developed by five different yeast strains with two nutrient sources at
two different concentrations
159
Figure 4-49 Growth kinetics of YPF juice fermentations with three different
commercial yeast strains and four different nutrient mixtures at two
different concentrations
163
Figure 4-50 Concentration of SO2-binding compounds present in finished YPF
wines produced by three different yeast strains with four nutrient
sources at two different concentrations
168
Figure 4-51 Concentration of hydrogen sulphide, carbon disulphide and
methanethiol detected in finished YPF wines produced by three
different yeast strains with four nutrient sources at two different
concentrations
169
Figure 4-52 Concentration of higher alcohols present in finished YPF wines
developed by three different yeast strains with four nutrient sources at
two different concentrations
170
Figure 4-53 Concentration of acetic acid esters present in finished YPF wines
developed by three different yeast strains with four nutrient sources at
two different concentrations (*10 = concentration of compound times
10)
172
Figure 4-54 Concentration of -terpineol present in finished YPF wines developed
by three different yeast strains with four nutrient sources at two
different concentrations
175

List of Figures
Figure 4-55 Concentration of 3SH and 3SHA detected in prepared YPF juice and
finished YPF wines produced by five different yeast strains with the
addition of VCombi at the high level
179
Figure 4-56 Concentration of 3SH and 3SHA detected in YPF wines produced by
two yeast strains with the addition of two nutrient sources at two
levels
180
Figure 4-57 Concentration of 3SH and 3SHA detected in finished YPF wines
produced by two different yeast strains with the addition of VCombi
and VUltra at 0.4 g L-1
181
Figure A-1 Retention time windows of selected ion chromatograms showing the
quantifier ion peaks of the four thiols obtained in the analysis of the
dearomatized wine sample spiked with different levels of the analytes
270
Figure A-2 Experimental outline for the fermentation trials of Scheurebe and
Sauvignon blanc grape juices and YPF juices
271

Abbreviations and symbols
BzEtAc Benzene acetic acid ethyl ester
BuEtE Butanoic acid ethyl ester
iBuEtE Isobutanoic acid ethyl ester
CS2 Carbon disulphide
d Day
DAEtE Decanoic acid ethyl ester
DAP Diammonium hydrogen phosphate
DEDS Diethyl disulphide
DMDC Dimethyl dicarbonate
DMDS Dimethyl disulphide
DMS Dimethyl sulphide
DMTS Dimethyl trisulphide
oC Degree celsius
CO2 Carbon dioxide
EC Enzyme Commission
EMS Ethyl methyl sulphide
EtAc Acetic acid ethyl ester
EtSAc Thioacetic acid S- ethyl ester
EtSH Ethanethiol
FAN Free alpha amino nitrogen
FTIR Fourier transform infrared spectroscopy
g Gram
g Microgram
GC-MS Gas chromatography-mass spectrometry
HexAc Acetic acid hexyl ester
HAEtE Hexanoic acid ethyl ester
H2S Hydrogen Sulphide
i.d. Internal diameter
IDY Inactive dry yeast
Kg Kilogram
KMS Potassium metabisulphite
L Litre
L-1 per Litre
L Microlitre
LAEtE Lactic acid ethyl ester

Abbreviations and symbols (continued)
2MeBuAc Acetic acid 2-methylbutyl ester
3MeBuAc Acetic acid 3-methylbutyl ester
m Metre
mg Milligram
min Minute
min-1 per minute
ml Millilitre
mm Millimetre
m Micrometre
MCFA(s) Medium-chain fatty acid(s)
MeSAc Thioacetic acid S-methyl ester
MeSH Methanethiol
4,2,2MSB 4-Methoxy-2-methyl-2-sulphanylbutane
4MSP 4-Methyl-4-sulphanylpentan-2-one
N Nitrogen
NCR Nitrogen catabolite repression
n.d. not detectable
ng Nanogram
n.q. not quantifiable/ trace
NOPA o-Phthaldialdehyde/N-acetyl-L-cysteine spectrometric assay
OAEtE Octanoic acid ethyl ester
2PheEtAc Acetic acid 2-phenyl ethyl ester
PrEtE Propionic acid ethyl ester
sec-1 per second
3SH 3-Sulphanylhexanol
3SHA Acetic acid 3-sulphanylhexyl ester
SO2 Sulphur dioxide
SAdiEtE Succinic acid diethyl ester
TA Total acidity
TSS Total soluble solid
v/v volume by volume
YPF Yellow passion fruit

1
1. INTRODUCTION
1.1 Statement and significance of the study
Grape wine flavour is formed from up to several hundreds of volatile compounds at
concentrations ranging from mg L-1 to a few ng L-1 or even less. The olfactory impact
depends on the concentration type and perception value. There are diverse mechanisms
involved in the development of the aroma compounds. Varietal aromas have a very high
impact and are formed by grape metabolism, depending on the variety, as well as soil,
climate and vineyard management techniques. These compounds occur mainly as non-
volatile precursors in grapes. Glycosylated forms are much more common than free forms,
especially among the monoterpenes. The bound aroma compounds were released by the
activity of -glucosidases that occur in grapes and yeasts during the wine making process
(Rapp, 1998; Ribéreau-Gayon et al., 2006 b).
Other key varietal compounds are volatile thiols (thiol referring to the SH functional group)
that derive from non-volatile precursors during the alcoholic process due to the
bioconservation of yeasts. The volatile thiols, 4-methyl-4-sulphanylpentan-2-one (4MSP) (so-
called 4-mercapto-4-methylpentan-2-one, 4MMP), 4-methyl-4-sulphanylpentan-2-ol
(4MSPOH) (so-called 4-mercapto-4-methylpentan-2-ol, 4MMPOH), 3-sulphanylhexanol (3SH)
(so-called 3-mercaptohexanol, 3MH) and acetic acid 3-sulphanylhexyl ester (3SHA) (so-
called acetic acid 3-mercaptohexyl ester, 3MHA) are of particular importance to the wine
aroma. 4MSP, 4MSPOH and 3SH are released from S-cysteine conjugates (Bouchilloux et al,
1998; Tominaga et al., 1998 a, 1998 b; Dubourdieu et al., 2006). Swiegers et al. (2005 b)
reported that 3SHA is formed by yeast from 3SH by the action of the ester forming alcohol
acetyltransferase during alcoholic fermentation. Volatile thiols have extremely low odour
thresholds in model solution, e.g. 0.8 ng L-1 4MSP, 55 ng L-1 4MSPOH, 60 ng L-1 3SH and
4 ng L-1 3SHA (Swiegers et al., 2005 a, 2005 b; Dubourdieu et al., 2006). These thiols occur
in nearly all varieties, but they are so-called character impact compounds in Sauvignon blanc,
Viognier, Scheurebe, Kerner, etc. The 4MSP thiol contributes to flavours in wine that were
described as blackcurrant, box tree and broom aromas (e.g. in Sauvignon blanc, Muscat d‘
Alsace and also sometimes in Riesling). 3SH is mainly responsible for grapefruit and tropical
fruit nuances and contributes intensively to the bouquet of Gewürztraminer, Muscat d‘Alsace,
Pinot gris, Riesling, Manseng and botrytized Sémillon (Dubourdieu et al., 2006; Ribéreau-
Gayon et al., 2006 b). 3SHA contributes to boxwood, grapefruit zest and passion fruit aromas
(Bouchilloux et al, 1998; Dubourdieu et al., 2006; Ribéreau-Gayon et al., 2006 b; King et al.,
2008).

2
Tominaga et al. (1998 a, 1998 b) and Tominaga & Dubourdieu (2000) demonstrated that
cysteine-S-conjugate -lyases are responsible for the release of the volatile thiols during
alcoholic fermentation. Research work of Murat et al. (2001 a) and Dubourdieu et al. (2006)
indicated that yeast strains vary in the ability to release 4MSP, 3SH and 4MSPOH. It could
be also demonstrated that commercial yeast strains have different enzyme activities for the
release of thiols. Therefore, specific yeast strains are selected to enhance the varietal
flavours during wine production.
S-(Sulphur-)containing compounds, especially volatile thiols, belong to the most important
aroma compounds in food. They are biosynthesised in various plants, especially in tropical
fruits, but they are also generated during the fermentation process of alcoholic beverages
and in the course of the thermal treatment of food. Yellow passion fruit is a typical example of
a fruit, of which the flavour is established by S-containing compounds (Winter et al., 1976;
Weber et al., 1994, 1995; Engel, 1999; Blank, 2002; Wakabayashi, 2004). 3SH was firstly
identified in passion fruit by Engel & Tressl (1991). Thiols and other S-compounds also
contribute to the flavour of pineapple, lychee fruit, blackcurrant, mango, citrus peel, etc. (Brat
et al., 2004; Tokitomo et al., 2005). The interest in the biogenesis of these compounds, their
release from non-volatile precursors by enzymes and their preservation during food
processing and alcoholic fermentation makes the research on thiols and other S-compounds
to optimise food quality to one of the most interesting flavour research areas.
In Thailand, purple, yellow and hybrid variety passion fruits are grown commercially. They
easily grow at all climate conditions of Thailand. There is a high yield and passion fruits are
resistant to diseases. The yellow passion fruit is the most cultivated and has some
advantages in comparison to the purple passion fruit like larger fruits, greater yield, more
attractive colouring, unique flavour properties and much higher acidity (Vera et al., 2003;
www.gpo.or.th/rdi/html/passionfruit.html, 2009; www.moac.go.th/builder/bhad/passionfruit.
php, 2009; www.stou.ac.th/study/sumrit/12-51(500)/page1-12-51(500).html, 2009). Frozen
juice can be kept without deterioration for one year at 0 ºF (-17.78 ºC) remaining a very
appealing product (www.hort.purdue.edu/newcrop/morton/passionfruit.html#Storage, 2009).
Passion fruit is a good source of pro-vitamin A, ascorbic acid, riboflavin and niacin and has
also a high mineral content. Its distinctive aroma and flavour make it a popular additive to
many tropical fruit beverages and food blends, especially pineapple wine and juice. Now,
passion fruit is considered to be the high potential fruit for the food and beverage industry
with a growing demand, not only as an exotic aroma enhancer but also because of its natural
and healthy nutritional value.
It is well-known that S-compounds can also be responsible for certain off-flavours in wine.
Various research groups tried to detect undesired S-compounds for off-flavours in grape
wines that mainly occur through yeast metabolism during the fermentation process or in the

3
bottled wines during storage (Rauhut, 1996, 2003; Rauhut et al., 2005 a; Ribéreau-Gayon et
al., 2006 a, 2006 b; Fedrizzi et al., 2007). Intensive research work demonstrated that one of
the main causes for off-flavours occurring after fermentation is the chosen yeast strain
(Saccharomyces cerevisiae) and its nutrient requirements and also the nutrient content in the
grape musts (Henschke & Jiranek, 1991; Rauhut & Kürbel, 1994; Jiranek et al., 1995 a, 1995
b; Rauhut, 1996; Rauhut et al., 1995, 2000 a, 2000 b). Under nutritionally sufficient
conditions, hydrogen sulphide (H2S) production is normally matched to biosynthetic demand
through tight metabolic regulation. A nitrogen deficiency leads to an overproduction of H2S,
which is reminiscent of rotten eggs, and also other disagreeable volatile S-compounds. The
intensity and the sensory impression of the resulting off-flavours depend on the qualitative
and quantitative compositions of the volatile S-substances in the wines. The formation of S-
compounds is also influenced by different requirements of commercial yeast strains for
certain amino acids and their capability to produce aroma-active S-substances. It could be
demonstrated that yeast strains differ in their formation of volatile S-compounds (Rauhut &
Kürbel, 1994; Rauhut et al., 1995, 1997, 2000 a, 2000 b; Rauhut, 2003; Wang et al., 2003;
Howell et al., 2005; Edwards & Bohlscheid, 2007; Rauhut, 2009).
Different research groups observed a decrease of nutrients in grape musts due to global
climate change and lack of water at specific phases during the vegetation period. This is the
main cause for stuck fermentations and off-flavours due to an accelerated formation of S-
compounds (methanthiol, ethanthiol, dimethyl sulphide, diethyl disulphide and dimethyl
trisulphide, thioacetic acid methyl ester and thioacetic acid ethyl ester etc.) during the last
twenty years (Rauhut & Kürbel, 1994; Rauhut et al., 1995, 2005 b; Rauhut, 2009).
The wine makers are allowed to compensate nutrient deficiencies by the addition of
ammonium salts, thiamine, yeast cell hulls and inactive dry yeast. Inactive yeasts are more
and more used to add micronutrients in a yeast-available form. The additions help to avoid
and to reduce off-flavours, but the additions are not often well-balanced and managed (Pozo-
Bayón et al., 2009 a, 2009 b). Therefore, a lot of research is being conducted to optimize the
supplementation of nutrients. The addition of nutrients is also effecting the formation of
higher alcohols and esters that are produced by yeasts during fermentation. These
compounds are responsible for the fermentation bouquet and the overall flavour of wines.
For that reason an optimised management for the choice of the yeast strains and the addition
of nutrient supplements has to be developed to improve also the varietal aroma that can be
covered and masked by off-flavour S-compounds or by extreme production of unpleasant
higher alcohols or large amounts of esters like acetic acid ethyl ester (Wang et al., 2003;
Hernández-Orte et al., 2005, 2006 a; Swiegers et al., 2005 a, 2005 b). A reoccurrence of off-
flavours in wines during storage after treatment and bottling is related to a release of
unpleasant volatile compounds from non-volatile or volatile precursors like the hydrolysis of

4
thioacetic acid esters to thiols and acetic acid. Rauhut (1996) also reported that an
accelerated formation of H2S leads to an increase of thioacetic acid esters, which have
aroma threshold values > 40 mg L-1 (Rauhut, 1993, 1996, 2003; Fedrizzi et al., 2007; Rauhut,
2009).
It is a long tradition in grape wine production getting rid of an off-flavour that is caused by
volatile sulphur-compounds by using aeration or by adding of copper sulphate. In the
presence of oxygen, H2S and thiols can be oxidised. Thiols (mercaptans) are oxidised to
disulphides which are also odour active S-compounds. Therefore, the aeration can only be
used for weak off-flavours. For stronger off-flavours a treatment with copper ions (addition of
copper sulphate) is a common practice. Unfortunately, copper ions only react with H2S and
thiols, other S-compounds will remain. Those wines are reduced in their quality causing an
economic loss for wine producers. An unsolved problem for wine makers is the removal of
undesirable S-substances in wines, because an aeration or a treatment with copper ions will
also eliminate or reduce the desirable thiols, which will also be oxidised or react with the
added copper ions (Rauhut, 1993, 1996, 2003, 2009). Furthermore, there is a tendency to
avoid additions of fining compounds as much as possible and to force minimal processing in
wine making (Rauhut, 2003, 2009).
Finally, it could be pointed out that volatile thiols play a major role in the varietal aroma of
certain grape varieties as well as in tropical fruits, their juices and wines. It could be also
indicated that there is an intensive research going on to release thiols in grapes from certain
varieties, but there is nearly no information about optimising the release of thiols in tropical
fruit wines. The production of tropical fruit wines will be more and more important for fruit
wine industry in Thailand, especially the use of passion fruit should be optimised and
increased. Furthermore, there is a lack of knowledge about how the thiols can be conserved
after fermentation and how off-flavours caused by undesirable S-compounds can be avoided
or removed without diminishing the varietal thiols. The optimisation has to be in line with the
treatments that are allowed by the government for the production of fruit wines in Thailand.
For example, it is not allowed to use copper sulphate as a fining agent to remove off-flavours
caused by S-compounds in fruit wines. Therefore, it is extremely important to improve the
release of thiols and the fermentation conditions to avoid off-flavours in tropical fruit wines,
especially if further treatments with fining agents are not allowed.

5
1.2 Objectives
The overall objective of this study is focused on the improvement of varietal and important
aromas in grape wines as well as in yellow passion fruit wine by an optimal choice of yeasts
and nutrient supplements.
In particular the improvement of aromas in grape wine and yellow passion fruit wine the
following objectives are aimed:
Improving desirable aroma compounds in grape wines from two varieties of
Sauvignon blanc and Scheurebe by an optimal choice of Saccharomyces
yeast strains and nutrient supplements to avoid off-flavours by undesired
thiols due to yeast metabolism under nutrient deficiencies
The fermentation of passion fruit wine at laboratory scale on the basis of the
experimental results which were obtained from the research on grape wines
Recommendations for an adequate choice of commercial yeast strains and/or
nutrient supplements to improve fermentation characteristics and varietal
aromas in yellow passion fruit wine

6
2. LITERATURE REVIEW
2.1 Yeasts
Yeasts are defined as unicellular microorganisms classified in the kingdom of fungi, although
some species with yeast forms may become multicellular through the formation of a string of
connected budding cells known as pseudohyphae, or false hyphae as seen in most molds
(Kurtzman & Fell, 2006; Fugelsang & Edwards, 2007). According to the phylogenetic
diversity, yeasts are shown by their placement in both divisions Ascomycota and
Basidiomycota, they mostly reproduce asexually by budding, although in a few cases by
binary fission (Barnett et al., 2000; http://lfbisson.ucdavis.edu/PDF/VEN124%20Section%
203.pdf, 2001; Boekhout & Phaff, 2003; Jay et al., 2005; Kurtzman & Fell, 2006; Ribéreau-
Gayon et al., 2006 a). They are capable of forming sexual states that are not enclosed in a
fruiting body (Boekhout & Kurtzman, 1996). From the 100 yeast genera representing
approximately 678 (Barnett et al., 2000) and 1,500 species, (Kurtzman & Fell, 2006) that
have been described, 15 species are associated with winemaking (Kurtzman, 1998).
Regarding the morphology, yeasts can be differentiated from bacteria by their larger cell size
and their oval, elongated, elliptical, or spherical cell shapes. Typical yeast cells range from 5
to 8 μm in diameter, although some yeasts can reach over 40 μm. Older yeast cell cultures
tend to have smaller cells (Barnett et al., 2000; Walker et al., 2002; Jay et al., 2005). Yeasts
produce many colours of colonies, ranging from creamy, to pink, to red (Jay et al., 2005).
Yeasts can grow over a temperature range of 10 to 37 °C, with an optimal temperature range
from 30 to 37 °C, depending on the type of species (S. cerevisiae works best at about 30 °C).
At temperatures above 37 °C yeast cells become stressed and will not divide properly (Jay et
al., 2005). They can also grow over wide ranges of acid pH and in up to 21 % ethanol and
also in the presence of 55-60 % sucrose (Thomas & Ingledew, 1992; Barnett et al., 2000).
Yeasts are chemoorganotrophs as they use organic compounds as a source of energy and
do not require sunlight to grow. The main source of carbon is obtained by hexose sugars
such as glucose and fructose, or disaccharides such as sucrose and maltose (Fugelsang &
Edwards, 2007). Some species can metabolize pentose sugars like ribose (Barnett, 1975),
alcohols, and organic acids maltose (Dequin et al., 2003; Jay et al., 2005; Fugelsang &
Edwards, 2007). Yeasts are very versatile and some are suitable for industrial purposes.
Furthermore, yeasts are easier and cheaper to harvest than bacteria and large-production is
not usually liable to evoke the same concern for problems of public health (Barnett et al.,
2000).

7
Yeasts are the most important microorganisms ever exploited by man, because they have
been used during several thousands of years for the production of a wide range of food
(Fröhlich-Wyder, 2003). In addition to baking and traditional alcoholic fermentations, yeasts
are already being used for diverse industrial purposes. Yeasts have been used in several
applications: (i) the fermentation of lactose to ethanol, to produce lactose-free milk for
sufferers from lactose intolerance; (ii) the production of various alditols, such as glycerol or
D-glucitol; (iii) the production of protein from alkanes and paper-pulp waste; (iv) the providing
of enzymes, such as β-fructofuranosidase (invertase), α- and β-galactosidase and lipase
(Barnett et al., 2000); (v) the production of compounds for research purposes, such as, novel
carbon-carbon bonds (Itoh et al., 1989) and methyldiols from aldehydes (Fuganti & Grasselli,
1985) and (vi) as biocontrol agents because of their antifungal activity (Barnett et al., 2000;
Fleet, 2007). Cell biomass (food and fodder yeasts) (Boze et al., 1992; Buzzini & Vaughan-
Martini, 2006), production of ingredients, additives and processing aids for food processing,
such as antioxidants, aromas, colours, flavours and vitamins (Abbas, 2006), yeast probiotics
(Fleet, 2006), yeast biocatalysts (Strehaiano et al., 2006), are other applications of yeasts.
On the other hand, the presence and metabolism of yeasts can also have some detrimental
aspects, such as food and beverage spoilage, food allergens, food safety and yeast-related
health (Fleet, 1992, 1993; Caruso et al., 2002; Fleet, 2006).
Nomenclature of enological yeasts
The classification and taxonomies of approximately 678 yeasts and 1,500 species have
currently been recognized and described by Barnett et al. (2000) and Kurtzman & Fell (2006).
Those versatile yeasts, 15 genus of Saccharomyces and 19 genera of non-Saccharomyces,
are associated with winemaking (Fleet, 1998; Kurtzman, 1998; Dittrich & Großmann, 2005;
Jolly et al., 2006). Yeasts that are present in uninoculated grape juice are named by different
terms such as natural, native, wild, wine or indigenous yeasts (Soden et al., 1999). S.
cerevisiae is prevalent on the surface of winery equipment, whereas the indigenous wine
yeasts on grapes are considered to be non-Saccharomyces species (Fleet & Heard, 1993;
von Wallbrunn, 2007). Therefore, in wine production, yeast species may be divided into two
broad groups, i.e. Saccharomyces and non-Saccharomyces groups (Jolly et al., 2006; von
Wallbrunn, 2007).
Saccharomyces yeasts are unicellular, globose, and ellipsoid to elongated in shape.
Multilateral (multipolar) budding is typical for vegetative reproduction (Vaughan-Martini &
Martini, 1998; Ribéreau-Gayon et al., 2006 a). A number of 16 species is characterized
under the genus Saccharomyces as excellently proposed by Barnett et al. (2000).
Nomenclature of Saccharomyces yeasts according to Barnett et al. (2000) with the
teleomorphic (perfect) names and two anamorphic (imperfect) names is given in Table 2-1.

8
Table 2-1 List of the Saccharomyces yeasts, with their teleomorphic and anamorphic names
Teleomorphic name (sexual state) Anamorphic name (asexual state)
Saccharomyces barnettii
Saccharomyces bayanus
Saccharomyces castellii
Saccharomyces cerevisiae Candida robusta
Saccharomyces dairenensis
Saccharomyces exiguus Candida holmii
Saccharomyces kluyveri
Saccharomyces kunashirensis
Saccharomyces martiniae
Saccharomyces paradoxus
Saccharomyces pastorianus
Saccharomyces rosinii
Saccharomyces servazzii
Saccharomyces spencerorum
Saccharomyces transvaalensis
Saccharomyces unisporus
The origin and importance of enological yeasts
Originally, all wine was made by taking advantage of natural microflora for spontaneous
fermentation and no deliberate inoculation was made to start the process (Pretorius, 2000).
At present, it is recognized that wine fermentation involves the development and activity of a
number of different yeast species that originate from grape. Also the indigenous microbiota
associated with winery environment participates in these natural wine fermentations (Fleet &
Heard, 1993; Heard, 1999). Although, grapes have long been considered the primary source
of indigenous wine yeasts (Fleet & Heard, 1993) and are relatively complete in nutrient
content, but having a low pH and high sugar content, they exert a strong selective pressure
on the microbial species such that only a few yeast species and other microorganisms can
proliferate (Henschke, 1997; Dequin et al., 2003).
In alcoholic processes, yeasts are responsible for the biotransformation of fermentable
sugars like glucose, fructose and sucrose into alcohol and carbon dioxide via the process of
fermentation. They have an enormous impact on wine production (Fleet, 1993; Barnett et al.,
2000; Pretorius, 2000; http://lfbisson.ucdavis.edu/PDF/VEN124%20Section%203.pdf, 2001)
because: (i) they conduct the alcoholic fermentation; (ii) they can spoil wines during storage
in the cellar and after packaging and (iii) they affect wine quality through autolysis. During

9
wine fermentation not only hexoses are converted by yeasts to ethanol and carbon dioxide,
but many compounds are removed from the medium and a large set of by-products are
formed that influence the sensory properties of wines (Dequin et al., 2003). The fermentation
of wine is mainly conducted by yeast of the genus Saccharomyces, of which the two
common species mostly involved are S. cerevisiae and S. bayanus (Pretorius, 2000;
http://lfbisson.ucdavis.edu/PDF/VEN124%20Section%203.pdf, 2001; Dequin et al., 2003;
Ribéreau-Gayon et al., 2006 a; Fugelsang & Edwards, 2007). In addition to S. cerevisiae and
S. bayanus, it is now well established that various species of non-Saccharomyces, such as
Hanseniaspora (Kloeckera), Candida, Pichia, Metschnikowia, Kluyveromyces,
Schizosaccharomyces and Issatchenkia can make positive contributions to the fermentation
of wine from grapes (Fleet, 1998; Pretorius, 2000; Fleet, 2003; Clemente-Jimenez et al.,
2005; Mendoza et al., 2007; Chomsri, 2008; Moreira et al., 2008).
In traditional winemaking, spontaneous fermentation of grape must is performed by a
sequential development of different yeast species that originate from the grape and the
winery equipment, such as Hanseniaspora (Kloeckera) spp., Candida (e.g. C. stellata and C.
pulcherrima), Brettanomyces (B. anomalus and B. bruxellensis), Cryptococcus,
Kluyveromyces, Metschnikowia (M. pulcherrima, the perfect form of C. pulcherrima), Pichia
(P. membranifaciens) as well as species previously assigned to the Hansenula genus, e.g. H.
anomala, the pink yeast Rhodotorula (Rh. minuta) (Fleet & Heard, 1993; Pretorius, 2000;
Romano et al., 2006). However, their growth is generally limited to the first three or four days
of fermentation, after which they die. Subsequently, the most strongly fermenting and more
ethanol tolerant species of Saccharomyces take over and finish the fermentation process
(Fleet & Heard, 1993; Martini, 1993). Recently, there has been a re-evaluation of the role of
non-Saccharomyces yeasts in winemaking (Fleet & Heard, 1993; Ciani & Maccarelli, 1998;
Heard, 1999). In fact, spontaneous fermentations usually take longer than most winemakers
are willing to accept and the outcome is always not what was anticipated, because it
depends not only on the number and diversity of yeasts present in must, but also upon grape
chemistry and processing protocol (Fugelsang & Edwards, 2007). At one extreme are those
who continue to use solely indigeneous yeasts, believing that unique contributions of diverse
yeast species confer a complexity to the wine not seen in inoculated and controlled
fermentations. Others prefer to begin with native yeasts and later inoculate with a
commercial yeast starter because the wines produced by inoculation were of consistent
acceptable quality (Fleet & Heard, 1993; Pretorius, 2000). In the last 30 years, most of the
wine industry has tended to move away from spontaneous fermentations towards controlled
fermentations initiated by inoculation that are more reliable and facilitate wine production
(Dequin et al., 2003; Sablayrolles, 2009).

10
Impact of enological yeasts on wine fermentation
When must is used as a culture medium, selective pressures always favour the yeasts with
the most efficient fermentative catabolism, particulary strains of S. cerevisiae and perhaps
strains of closely related species such as S. bayanus (Henschke, 1997; Pretorius, 2000). For
this reason, S. cerevisiae is the almost universally preferred yeast for initiating alcoholic
fermentation and is often designed as the ―wine yeast‖ (Fleet & Heard, 1993; Martini, 1993;
Dequin et al., 2003; Pretorius, 2000). The primary role of wine yeast is to catalyse not only
the rapid complete and efficient conversion of grape sugars to ethanol, carbon dioxide and
other minor, but also sensorially important metabolites without the development of off-
flavours (Figure 2-1) (Pretorius, 2000; Swiegers et al., 2005 a). A secondary role concerns
the modification and/or release of grape-derived components, such as glyco- and cysteine-
conjugate precursors, which enhance the wines‘ varietal character (Howell et al., 2004, 2005;
Swiegers et al., 2005 a, 2005 b).
Figure 2-1 A schematic representation of derivation and synthesis of flavour-active
compounds from sugar, amino acids and sulphur metabolism by wine yeast
Source: Adapted from Pretorius (2000) and Swiegers et al. (2005 a) and modified
Fatty acid CoA
Acetaldehyde
Sugar
Pyruvate
Glycerol
Sugar
Ethanol Ethanol
Fatty acids Higher alcohols
-Acetallactate
Diacetyl
Acetic acid
Acetic acid Acetyl CoA
Tricarboxylic acid cycle
Diacetyl
Fatty acids
Keto acids
Sulphate Sulphite
Monoterpenes
Monoterpenes
Keto acids
H2S
Esters
Amino acids
Yeast protein
Amino acids
Esters
Aldehydes Aldehydes
Higher
alcohols
Succinic
acid

11
Overall, the goal of using a starter culture is to initiate fermentation as quickly as possible
while limiting the potential for spoilage by establishment of numerical dominancy over native
species (Fugelsang & Edwards, 2007). The assignment of most of the traditional wine yeast
strains to a single species does not, however, imply that all strains of S. cerevisiae are
equally suitable for the various wine fermentations, they differ significantly in their
fermentation performance and their contribution to the final bouquet as well as production of
H2S and quality of wine (Jiranek et al., 1995 b; Pretorius et al., 1999; Swiegers et al., 2005 a).
Sablayrolles (2009) reported that more than 200 different S. cerevisiae strains are currently
commercially available, with highly diverse fermentation properties.
Fermentation predictability and wine quality are directly dependent on wine yeast attributes
that assist in the rapid establishment of numerical and metabolic dominance in the early
phase of wine fermentation, and that determine the ability to conduct an even and efficient
fermentation with a desirable residual sugar level. A wide range of factors affect the
fermentation performance of wine yeasts. Apart from a successful inoculation with the
appropriate starter culture strain, the physiological condition of such an active dried wine
yeast, and its ability to adapt to and cope with nutritional deficiency and the presence of
inhibitory substances, are of vital importance to the fermentation performance (Pretorius,
2000). The choice of yeast strain used by the winemaker is increasingly motivated by the
potential impact of that strain on the wine characteristics. The very large number of strains
commercially available, and many complex mechanisms of interaction between strains, must
and fermentation conditions make this choice difficult. The potential of yeast strains to
increase the geographical typicity of a wine remains a matter of debate, but specific strains
are now widely recognised to be useful: (i) for increasing the fruity character (Torija et al.,
2003 a; Sablayrolles, 2009), (ii) for improving some varietal characters in some wines
(Delcroix et al., 1994; Murat et al., 2001 a; Swiegers et al., 2005 b, 2006, 2007; King et al.,
2008), (iii) for limiting the production of organic acids or increasing the production of glycerol
(Scanes et al., 1998), and (iv) for limiting off-flavours, including those due to sulphur (Rauhut,
1993; Rauhut et al., 1996, 1997) and volatile phenols (Shinohara et al., 2000). The use of
different Saccharomyces strains for wine fermentations resulted in wines with different
volatile profiles, through varied relative concentration of acetic acid esters, fatty acid ethyl
esters, higher alcohols and wine compositions (Henick-Kling et al., 1998; Antonelli et al. 1999;
Heard, 1999; Howell et al., 2006; Chomsri, 2008; King et al., 2008; Swiegers et al., 2009) as
well as volatile thiols (Howell et al., 2005; King et al., 2008; Swiegers et al., 2009). Studies
have also investigated the effect of simultaneous inoculation and coinoculation with yeast
strains to conduct fermentations of wines ( Großmann et al., 1996; Howell et al., 2005, 2006;
Chomsri, 2008; King et al., 2008; Viana et al., 2009).

12
2.2 Nitrogen containing compounds in winemaking
Nitrogen containing compounds, e.g. ammonia, amino acids, peptides, polypeptides and
proteins, are commonly found in living organisms and are important constituents of food.
They supply the required building blocks for protein biosynthesis. In addition, they directly
contribute to the flavour of food and are precursors for aroma compounds and colours
formed during thermal or enzymatic reactions in production, processing and storage of food
(Belitz et al., 2004). Many microorganisms have the ability to use a variety of nitrogen
containing compounds as the sole source of all cellular nitrogen (Cooper, 1982).
Sacchromyces cerevisiae can grow in a wide variety of nitrogen-containing substrates
(Cooper, 1982; Large, 1986). It preferentially uses simple nitrogen sources such as
ammonium ions and free alpha amino acids (Cooper, 1982; Henschke & Jiranek, 1993;
Jiranek et al., 1995 a; Valero et al., 2003). However, the secondary amino acids, such as
proline and hydroxyproline, are not metabolized to any great extent under usual winemaking
conditions (Duteurtre et al., 1971; Ingledew et al., 1987). Low molecular weight peptides can
also be used but grape proteins cannot be used as a source of nitrogen since S. cerevisiae
lacks significantly of extracellular proteolytic activity. Therefore, the usable nitrogen fraction is
often referred to as yeast assimilable nitrogen (YAN). The remaining compounds of total
nitrogen, which includes proline and hydroxyproline, larger molecular weight peptides and
protein, will be reffered to as yeast non-assimilable nitrogen (YNAN) (Bell & Henschke, 2005).
The consumption rate and metabolism of nitrogenous compounds depend on the yeast strain,
its physiological state and the physicochemical properties of the must or wine. S. cerevisiae
can either directly incorporate amino acids into the proteins, or use them as a source of
nitrogen by oxidative deamination (except lysine and histidine); alternatively, an amino acid is
degraded by liberating nitrogen for the biosynthesis of other nitrogenous cell constituents,
and its carbon structure can be excreted to the wine or be used as a carbon source for the
biosynthesis of other compounds (Large, 1986).
Wine is a complex mixture of organic molecules that are present in an extremely wide range
of concentrations. Of those molecules, nitrogen containing compounds are of great interest
(Valero et al., 2003). Quantitatively, next to sugars, nitrogenous compounds are the most
important nutrient substances found in grape must (particularly ammonium ion, amino acids,
peptides, and small polypeptides) that can be used as nitrogen sources by yeasts (Mauricio
et al., 1995; Dharmadhikari, 2001; Torija et al., 2003 b). On a dry weight basis, about 10 % of
yeast weight consists of nitrogen. All the nitrogen used in building cellular material
(population 108 cells ml-1) during fermentation is taken from the must. It is therefore important
that the must contains sufficient amounts of nitrogen to support a healthy yeast population
during fermentation (Dharmadhikari, 2001). Nitrogen containing compounds in must and

13
juice play important roles in fermentations of wine as it is a necessary nutrient for yeast
growth and metabolism. Nitrogen deficiencies in grape must and juices is one of the principal
factors limiting growth and sugar attenuation (Hernández-Orte et al., 2006 a), and may result
in sluggish or stuck fermentations (Salmon, 1989; Kunkee, 1991; Blateyron & Sablayrolles,
2001; Mendes-Ferreira et al., 2007 a, 2007 b). These compounds are known to be essential
to the vinification process, not only because they influence growth and metabolic activity of
the yeasts but also because they affect the formation of higher alcohols, which contribute to
the aroma of wine and hence to its quality (Mauricio et al., 1995; Valero et al., 2003). Like
proteins, they also influence clarification, microbial instability (Bell & Henschke, 2005) and
wine stability, particularly in white wines (Dharmadhikari, 2001). Low levels of yeast
assimilable nitrogenous compounds have been related to lower fermentation rates, longer
fermentations (Bely et al., 1990) and cellular activity. Others consider this condition as a
cause for low resultant biomass concentrations (Bisson, 1991; Cramer et al., 2002;
Ribéreau-Gayon et al., 2006 a). These compounds are also important fermentation activators,
since upon their depletion the rate of fermentation can substantially diminish and even cease
(Lagunas et al., 1982; Salmon, 1989; Manginot et al., 1998). Limiting YAN is thought to affect
yeast by reducing yeast cell multiplication and by decreasing indirectly the rate of glycolysis
(Bely et al., 1990). These effects also depend on the nitrogen source, since growth on good
nitrogen sources such as ammonia, glutamine and asparagine seems to yield relatively
higher growth rates than on poor ones such as proline and urea (ter Schure et al., 2000).
Furthermore, numerous studies about the roles of yeast in the development of wine aroma,
flavour and mouth-feel are becoming more clearly defined, as well as the impact of nitrogen
on the flavour metabolism of yeasts (Henschke & Jiranek, 1993; Rapp & Versini, 1996;
Albers et al., 1996; Bell & Henschke, 2005; Hernández-Orte et al., 2005; Swiegers et al.,
2005 a). The limitation of nitrogen can also influence the formation of reduced sulphur
compounds, such as hydrogen sulphide (Henschke & Jiranek, 1991; Giudici & Kunkee, 1994;
Jiranek et al., 1995 b; Ugliano et al., 2009) and volatile sulphur compounds (Moreira et al.,
2002). On the other hand, the degradation of some nitrogen compounds contributes to the
formation of a carcinogenic compound, biogenic amines and ethyl carbamate, which are
considered to be detrimental to health (Monteiro et al., 1989; Ough, 1991; Zoecklein et al.,
1999; Bell & Henschke, 2005). The influence of the nitrogen source (Bisson, 1991; Monteiro
& Bisson, 1991; Ough et al., 1991; Monteiro & Bisson, 1992 a, 1992 b; Albers et al., 1996;
Torija et al., 2003 b; Wang et al., 2003; Hernández-Orte et al., 2006 a, 2006 b), the amount
and timing of nitrogen addition on wine fermentation and volatile compounds has recently
been the subject of several studies (Beltran et al., 2005; Rosi et al., 2008). The biological
aging process has also received some attention in this respect (Mauricio & Ortega, 1997;
Valero et al., 1999). More recently, a research conducted by Osborne & Edwards (2006)

14
indicated that many yeast strains inhibited the bacteria during fermentation under high
nitrogen conditions. Some research also demonstrated the impact of different nitrogen
sources on the varietal aroma release, production of 3SH increases when urea is substituted
for diammonium phosphate (DAP) as the sole nitrogen source on the synthetic media and
grape must complementation with the DAP induces a decrease of 3SH as well (Subileau et
al., 2008).
Nitrogen containing compounds in grape juice and wine are consist of an ammonia
component and a more complex amino-acid based nitrogen component, e.g. amino acids,
oligopeptides, polypeptides, proteins, amide nitrogen, bioamines, nucleic acids, amino sugar
nitrogen, pyrazines, vitamins and nitrate (Ough, et al., 1991; Henschke & Jiranek, 1993;
Mauricio et al., 1995; Zoecklein et al., 1999; Cramer et al., 2002; Dharmadhikari, 2001; Torija
et al., 2003 b). In grape must and wine, concentrations and compositions of these
compounds are found in a wide range according to grape variety, rootstock, environment,
site, seasonal and growing conditions, level of maturity and juice extraction (Huang & Ough,
1989; Sponholz, 1991; Gockowiak & Henschke, 1992; Monterio & Bisson, 1992 a, 1992 b;
Spayd & Andersen-Bagge, 1996; Hernández-Orte et al., 1999; Stines et al., 2000; Swiegers
et al., 2005 a). Table 2-2 lists the individual amino acids commonly found in the whole grape
and grape juice and Table 2-3 lists concentrations of various nitrogen compounds found in
grape juice and wine.
Some research reported that the total nitrogen content of grape juice ranges 40-fold from 60-
2400 mg L-1 and can therefore be growth-limiting (Henschke & Jiranek, 1993; Ribéreau-
Gayon et al., 2006 b). A minimum requirement for nitrogen of 120-140 mg N L-1 has been
widely reported (Bely et al., 1990; Bisson, 1991; Henschke & Jiranek, 1993; Bell & Henschke,
2005). Grape juices with yeast assimilable nitrogen (YAN) concentration below 140 mg N L-1
have a high probability of becoming problem ferments due to inadequate yeast growth and
poor fermentation activity while a concentration above 400 mg N L-1 YAN leads to increased
biomass, yeast growth and fermentation performance (Henschke & Jiranek, 1993; Zoecklein
et al., 1999; Bell & Henschke, 2005). An inadequacy of nitrogen-containing compounds of
grape juices and must for wine fermentation has often been reported. Ribéreau-Gayon et al.
(2006 b) described that analytical findings on the extent and frequency of nitrogen
deficiencies in Bordeaux grape musts from 1996-2006 vintages were 22 % in white must, 49 %
in red must, 60 % in rosé must and 89 % in botrytized musts. Hence, the assessment of the
nitrogen requirement for wine yeast should be controlled because it can have an impact on
yeast growth, fermentation kinetics and the resulting wine. Regarding the variety of these
nitrogen containing compounds, only some compounds found in musts and wines are
presented in this review.

15
Ammonium
The ammonium ion is an important component of must YAN and is one of the most preferred
yeast nitrogen sources because it is readily assimilated by the yeasts, and serves as the
primary form of available nitrogen for yeast metabolism (up to 40 %) in grape juice (Cooper,
1982; Bisson, 1991; Monteiro & Bisson, 1992 a, 1992 b; Henschke & Jiranek, 1993; Bell,
1994; Ayestarán et al., 1995; Beltran et al., 2004; Vilanova et al., 2007; Boulton et al., 2009).
It can influence amino acid metabolism by reducing catabolic enzyme levels and transport
activity through various mechanisms, such as nitrogen catabolic repression (Cooper &
Sumrada, 1983). It is rapidly consumed at the beginning of the fermentation process.
Addition of ammonium salt has a significant effect not only on cell population, the
fermentation rate, the production of alcohol, volatile acidity and pH (Monteiro & Bisson, 1992
a; Ayestarán et al., 1995; Bely et al., 2003; Mendes-Ferreira et al., 2004; Taillandier et al.,
2007), but also on the formation of metabolic compounds, esters, higher alcohols and volatile
sulphur compounds (Ayestarán et al., 1995; Bell & Henschke, 2005; Miller et al., 2007;
Ugliano et al., 2007; Vilanova et al., 2007; Rosi et al., 2008; Ugliano et al., 2009; Boulton et
al., 2009). Ugliano et al. (2007) reported that overuse of DAP can also stimulate
overproduction of acetic acid esters, especially acetic acid ethyl ester, resulting in the
perception of volatile acidity and suppression of varietal character. The ammonium
concentration of grape berries declines during ripening with an increase in amino acid
nitrogen, peptide nitrogen and protein (Bell, 1994; Zoecklein et al., 1999; Bell & Henschke,
2005). The concentration of ammonium widely ranges from 5 to 325 mg N L-1 in grapes (Bely
et al., 1991; Henschke & Jiranek, 1993; Butzke, 1998; Zoecklein et al., 1999; Carnevillier et
al., 2000) and from a few mg L-1 to 50 mg L-1 in wine.
Amino acids
The primary amino acids constitute a major source of YAN for yeast, however, they vary in
their efficiency as nitrogen sources (Cooper, 1982; Jiranek et al., 1995 a). Most of the 20
commonly occurring amino acids are found in grapes and musts (Table 2-2). Their
concentration and composition can vary according to grape variety, cultivation, rootstock,
region and seasonal conditions, level of maturity and processing techniques. L-arginine and
L-proline are generally predominant amino acids found in grape and must (Huang & Ough,
1989; Sponholz, 1991; Gockowiak & Henschke, 1992; Spayd & Andersen-Bagge, 1996;
Hernández-Orte et al., 1999; Stines et al., 2000; Soufleros et al., 2003; Herbert et al., 2005;
Boulton et al., 2009). Many studies of amino acids in must and wine have commonly
presented the L-amino acids. D-amino acids have only been examined in a few studies as
they have been considered as unnatural amino acids (Brückner & Westhauser, 2003;
Brückner & Pätzold, 2006; Pätzold & Brückner, 2007).

16
The amino acids in grape juice and must are generally present in the range of 170-4000
mg L-1, while in wines in the range of 3-4000 mg L-1 (Carnevillier et al., 2000; Ribéreau-
Gayon et al., 2006 b; Boulton et al., 2009). The individual amino acid commonly found in the
whole grape and grape juice varies significantly (Table 2-2). Arginine is quantitatively the
most important amino acid utilizable by Saccharomyces in grapes (Monteiro & Bisson, 1992
a; Henschke & Jiranek, 1993; Bell, 1994; Jiranek et al., 1995 a; Stines et al., 2000; Bell &
Henschke; 2005; Boulton et al., 2009), due to its catabolism by arginase to form L-ornithine
and urea, which under appropriate conditions ultimately form glutamate and ammonium,
respectively, the latter two compounds are precursors for general amino acid biosynthesis in
yeast (Large, 1986). Arginine is rapidly incorporated by yeast at the start of fermentation and
subsequently released back into the wine during autolytic cycles (Fugelsang & Edwards,
2007). L-proline was also found at high concentrations, at 750-2257 mg L-1 of most cultivars
(Huang & Ough, 1989; Spayd & Andersen-Bagge, 1996; Boulton et al., 2009). However, it is
only utilised to a limited extent by yeast to the normal anaerobic environment of alcoholic
fermentation (Duteurtre et al., 1971; Ingledew et al., 1987), therefore it is referred to as yeast
non assimilable nitrogen (YNAN) (Bell & Henschke, 2005).
Regarding the metabolism of yeast, a supplement of amino acids in grape juice could
influence the synthesis of cellular protein and, in turn, affect the biomass and fermentation
rates (Albers et al., 1998; Salmon & Barre, 1998; Boulton et al., 2009), and shorten
fermentation time, leading to high alcohol production (Hernández-Orte et al., 2006 a). Jiranek
et al. (1995 a) demonstrated that the kinetics of the utilization of individual amino acids varied
between yeast strains. However, arginine, serine, glutamate, threonine, aspartate and lysine
typically comprised the bulk of the nitrogen consumed. Miller et al. (2007) reported that the
effect of the amino acid addition in Chardonnay juice on amino acid utilization by yeast varied
depending on the specific amino acid. The more concentration of amino acid addition in juice
leads to the greater utilization of leucine, isoleucine, methionine, phenylalnine, tryptophan,
tyrosine and valine, but the less utilization of histidine, glutamine and alanine by yeast. In
addition to regulating growth, amino acid availability can also affect many aspects of yeast
metabolism, including the formation of volatile and non-volatile compounds that are important
for the organoleptic qualities of wine (Albers et al., 1996; Bell & Henschke, 2005; Garde-
Cerdán & Ancín-Aypilicueta, 2007).

17
Table 2-2 The identity and concentration of amino acids found in the whole grape and/or juice at harvest
Amino acid Concentration range (mg L-1)
Alanine 10 - 227
Arginine 20 - 2322
Asparagine 1 - 171
Aspartic acid 10 - 138
Citrulline 0.1 - 83
Cysteine 1 - 8.2
Glutamine 9 - 4499
Glutamic acid 27 - 454
Glycine 1 - 20
Histidine 5 - 197
Isoleucine 1 - 117
Leucine 2 - 160
Lysine 0.7 - 45
Methionine 1 - 33
Ornithine 0.1 - 27.2
Phenylalanine 2.8 - 138
Proline 9 - 2257
Serine 13 - 330
Threonine 9 - 284
Tryptophan 0.2 - 11
Tyrosine 2 - 33
Valine 7 - 116
Source: Huang & Ough (1989), Sponholz (1991), Henschke & Jiranek (1993), Spayd &
Andersen-Bagge (1996), Hernández-Orte et al. (1999), Bell & Henschke (2005),
Boulton et al. (2009)
The non-volatile compounds, glycerol, malic acid and -ketoglutarate have been reported to
vary according to amino acid, nitrogen source and concentration (Radler, 1993; Albers et al.,
1996). The amino acid uptake of yeast influences the aroma generation during alcoholic
fermentation (Swiegers et al., 2005 a; Miller et al., 2007). The most aroma compounds
include higher alcohols, short to medium-chain fatty acids and their ethyl esters and acetic
acid esters (Lambrechts & Pretorius, 2000; Francis & Newton, 2005). Wines obtained from

18
musts supplemented with amino acids have higher levels of -butyrolactone, isobutanol and
isobutyric acid (Hernández-Orte et al., 2005). Furthermore, some research showed that the
presence of methionine in synthetic medium caused no formation of hydrogen sulphide
(Eschenbruch, 1974; Giudici & Kunkee, 1994), but this compound was formed in the
presence of cysteine. On the other hand, an experiment carried out by Moreira et al. (2002)
suggested that the addition of methionine to grape musts enhanced the production of sulphur
compounds and yeast strains also influence the effect of amino addition.
Peptides
Peptides are short polymers formed by binding amino acids together through an amide
linkage or peptide linkage and their hydrolysis results in free amino acids. Peptides are
denoted by the number of amino acid residues as di-, tri-, tetrapeptides, etc. The term
―oligopeptides‖ is used for those with 10 or less amino acids. Higher molecular weight
peptides are called polypeptides and are referred to have molecular weight below 10 kDa
(Fukui & Yokotsuka, 2003). Peptides can be substances of great biological importance. They
exhibit multiple interesting functional properties, e.g. as antioxidants, antimicrobial agents,
surfactants with foaming and emulsifying capabilities (Desportes et al., 2000; Brückner &
Koza, 2003; Belitz et al., 2004). It is well established that they contribute to bitter, sweet and
umami tastes, such as bitter peptides in cheese or aspartame and a sweet peptide, which is
180 times sweeter than sucrose (Ishibashi et al., 1987, 1988; Polo et al., 1992; Turgeon et al.,
1992; Bumberger & Belitz, 1993). They also play a role in the development of some physico-
chemical characteristics, flavours and organoleptic properties of wine, like in other foodstuff
(Acedo et al., 1994; Desportes et al., 2000).
Peptides are widespread in nature including in grape must and wines. They are major
compounds representing together with amino acids the main nitrogen fraction in wines
(Desportes et al., 2000). Polypeptides constitute a significant proportion of the total nitrogen
content in wine between 20 % and 90 % (Zoecklein et al., 1999). Analyses carried out by
Monteiro et al. (2001) revealed that wines contain a large number of distinct polypeptides.
Yokotsuka et al. (1975) demonstrated that the peptides in the Koshu Japanese juice mainly
consisted of aspartic acid and glutamic acid, which were about 65 % of all the amino acids
constituting the peptides. On the other hand, the major amino acids constituting the peptides
in the wine were glutamic acid, aspartic acid, glycine and proline. Up to now, most of the
studies conducted on wine peptides have been restricted to the determination of the total
amino acid composition of wine peptides, the results have been simply obtained by
investigating the difference between the amino acid content before and after peptides
hydrolysis. Peptides have been rarely studied because their isolation from wine is quite

19
difficult (Poux & Ournac, 1970; Yokotsuka et al., 1975; Usseglio-Tomasset & Bosia, 1990;
Moreno-Arribas et al., 1998 a, 1998 b).
During the first stage of wine fermentation, peptides are assimilated by the yeast together
with free amino acids. At the end of fermentation, there is an excretion of free amino acids
and small peptides from the yeast to the wine (Ough et al., 1991; Dizy & Polo, 1996).
Yokotsuka et al. (1975) showed that compositional changes in peptides occurred during wine
making, especially fermentation. Some researches demonstrated that peptides could be
released by yeast during base wine preparation and second fermentation of sparkling wine
(Martínez-Rodríguez et al., 2002; Moreno-Arribas et al., 1996). The enrichment of wine with
short peptides and proteins can be made through addition of yeast autolysate which gives
rounder and fuller wines (Feuillat, 2005). Furthermore, Oganesjanz et al. (2007) briefly noted
that an increase of nitrogen containing compounds, peptides included, through the addition
of yeast lysate in wine improves the organoleptic quality, particularly its complexity and
harmony is enhanced. In wine technology, some peptides have shown to be very effective
fining agents, at least at the same level as gelatin or soluble poly(vinylpyrrolidone) (PVP)
(Yokotsuka & Singleton, 1995).
Among the great number of peptides found in wines, glutathione, a tripeptide -L-glutamyl-L-
cystinylglycine is perhaps the most intensively studied (Duncan & Derek, 1996; Penninckx,
2002; Roussis et al., 2007). Glutathione is a polypeptide produced by the grapevine and by
wine yeast at the end of fermentation. It is a strong antioxidant and helps to stabilize aroma
components and plays an important role as an oxidative buffer, thus impacting wine longevity
(Zoecklein, 2007). Therefore, it can prevent oxidation of white grape musts (Cheynier et al.,
1986; Singleton, 1987; Cheynier et al., 1989). It is also discussed as an anticarcinogenic
molecule due to its ready oxidation (Roussis et al., 2007). Cheynier et al. (1989) showed that
glutathione ranged from 14-102 mg L-1 in grape musts from different varieties. Park et al.
(2000 a, 2000 b) found this compound up to 1.3 mg L-1 in grape musts and up to 5.1 mg L-1 in
wines. Du Toit et al. (2007) also detected up to about 35 mg L-1 in wines. Final concentration
of glutathione in wine was correlated with both total nitrogen and assimilable amino acid
concentration and an increase of glutathione towards the end of fermentation was observed.
Lavigne et al. (2007) investigated that glutathione in the wine can be increased through the
choice of an adequate yeast strain and when the wine is stored on lees. Dubourdieu &
Lavigne-Cruège (2002) proposed that glutathione seems to play an important role in
protecting volatile thiols that are responsible for the varietal flavours of wines during the
ageing of bottled white wines. However, the supplementation of must with glutathione to a
concentration of more than 50 mg L-1 can lead to unpleasant volatile sulphur compounds
under certain conditions (Rauhut et al., 2001; Rauhut, 2003).

20
In recent years, the organic nitrogen sources, such as commercial preparations that contain
yeast derivative products, which also contain lipids and sometimes other nutrients like yeast
cell wall, yeast extract, have become commercially available (Munoz & Ingledew, 1990;
Belviso et al., 2004). Inactive yeasts, yeast autolysates, yeast extracts and yeast hulls or
walls can be included under the generic name of inactive dry yeast (IDY) preparations. Some
of the compounds released during yeast autolysis like peptides, amino acids and
mannoproteins, seem to be responsible for the great number of applications attributed to
these preparations. They can be used as alcoholic fermentation enhancers (Lafon-
Lafourcade et al., 1984; Feuillat & Guerreau, 1996; Pozo-Bayón et al., 2009 a, 2009 b), as
protective agents to improve active dry yeast rehydration (Caridi et al., 1999; Caridi, 2002) or
as organoleptic enhancers stabilizing the colour of red wines by using mannoprotein-rich IDY
preparations (Escot et al., 2001; Doco et al., 2003). In fact, yeast derivatives, particularly
autolysates, are not completely soluble, and the presence of particulates can be observed
when they are added to wines. It is composed of yeast cell wall residues that remain in the
growth medium after the lysis treatment, and their ability to bind aroma compounds is well
reported in literature (Lubbers et al., 1994 a). Moreover, yeast macromolecules and colloids,
released in wine during autolysis, can also determine different sensory effects, interacting
with aroma compounds and modulating their volatility and perception (Lubbers et al., 1994 b).
Thus, yeast derivatives are used as a source of mannoproteins in winemaking and could
affect the aroma intensity, wine oxidation, colour and fruity flavours of treated wines.
Comuzzo et al. (2005) found that the lowest addition of yeast derivatives showed an increase
in the fruity and flowery perception of some volatile compounds (e.g. esters), while for higher
amounts the release of some carboxylic acids characterized by cheese-like and unpleasant
odours was observed.
Despite the fact that many of these preparations are currently on the market under different
brands, claiming different wine improvements, scientific information about the chemistry
behind their use and their action mode is still scarce. Therefore, scientific studies for a better
characterization of the changes that these preparations induce in wines are required for the
establishment of better criteria for their enological use. For these reasons, the olfactory
examination of commercial formulates (to select less odourous and soluble products) and
preliminary laboratory tests on small scale could be useful tools to control the effects of the
treatment (Comuzzo et al., 2005). Particular problems are associated with attempts to
measure peptide in yeasts. Furthermore, wine is a complex matrix and thus many methods
for the determination of peptides have to be specifically developed for wine analysis. These
methods and extraction techniques are necessary to remove interfering compounds. The
applicability, advantages and disadvantages of these methods should be considerably
appropriate for grape juice and wine (Chomsri, 2008).

21
Table 2-3 Concentration of nitrogen containing compounds found in grape juice and wine
Components
Concentration (mg L
-1)
References
Amides in must and wine
10 - 40, 8 - 35
Carnevillier et al. (2000)
Amino acids - grape must and juice
1 - 1130
Boulton et al. (2009), Ferreira et al. (2002)
- grape and wine 1000 - 4000 Ribéreau-Gayon et al. (2006 b) - wine - Japanese wine
130 - 590 405 - 1559
Carnevillier et al. (2000) Yokotsuka et al. (1977)
Assimilable amino acids in musts 331 - 1375 Fukui & Yokotsuka (2003)
Free amino acids in must
32.5 Bell & Henschke (2005)
Free amino nitrogen (FAN) 15 - 230 Zoecklein et al. (1999)
Ammonium - grape and must - wine
5 - 325, 10 - 120 3 - 30
Henschke & Jiranek (1993), Carnevillier et al. (2000)
Peptides - Chardonnay must - Chardonnay wine - Japanese wine
7.6 - 20.3 mg g
-1
104.8 - 139 137 - 904
Nakopoulou et al. (2006) Yokotsuka et al. (1977)
Glutathione - grape must - wine
1.3 - 104 1 - 35
Cheynier et al. (1989), Park et al. (2000 a, 2000 b), Du Toit et al. (2007)
Nitrogen compounds - soluble nitrogen compounds
in must - grape - wine
100 - 1000 mg N L
-1
600 - 2400 mg Kg
-1
200 -1400
Ribéreau-Gayon et al. (2006 b) Radler (1993)
Total nitrogen - white wine - red wine
70 - 700 77 - 377
Ribéreau-Gayon et al. (2006 b)
Protein - soluble proteins in must - soluble protein in grape juice - grape juice - wine
93.5 118 - 800 1.5 - 100 8 - 1000
Bell & Henschke (2005) Wigan & Decker (2007) Ribéreau-Gayon et al. (2006 b) Bisson (1991), Monteiro et al. (2001), Ribéreau-Gayon et al. (2006 b)
Ethyl carbamate in wine
1 - 7.7 g L-1
Zoecklein et al. (1999), Ribéreau-Gayon et al. (2006 b)
Urea in wine < 1
Ribéreau-Gayon et al. (2006 b)
Histamine in wine 0 - 11.3
Zoecklein et al. (1999), Ribéreau-Gayon et al. (2006 b)

22
Other nitrogen-containing components
Nitrates (NO3-) and nitrites (NO2
-) are present in wines at low levels, usually less than 0.3 %
of the total nitrogen. White table wines were found to have 2.1-53.7 mg L-1 nitrate, while red
wine had 0.9-41.4 mg L-1 (Ough & Crowell, 1980). Ough & Amerine (1988) found in German
wines nitrate levels less than 7 mg L-1, and 1.65 mg L-1 in Italian white wines. Field nitrogen
fertilization of the vines has little effect on the residual nitrate in the grape. Fermentation does
not alter the nitrate content significantly (Ough & Crowell, 1980). Saccharomyces yeast is
incapable of utilizing nitrate as a nitrogen source, there are a couple of other yeast species,
such as Candida and Hansenula, that have this capability (http://biochemie.web.med.uni-
muenchen.de/Yeast_Biol/03%20Yeast%20Metabolism.pdf, 2009).
Another group of nitrogen compounds present in wines are biogenic amines, which are
undesirable compounds produced in food mainly through bacterial decarboxylase activity
(Leitão et al., 2000). It is well known that consumption of food containing high amounts of
biogenic amines may cause headaches, nausea, cardiac palpitations and digestive problems
(Silla-Santos, 1996; Anli et al., 2004). These amines more commonly found in wine are 2-
phenylethylamine, putrescine, spermidine, spermine, histamine, tyramine, cadaverine,
mercaptoethylamine, ethanolamine and serotonin (Lehtonen, 1996; Leitão et al., 2000;
Lonvaud-Funel, 2001; Caruso et al., 2002; Gardini et al., 2005; Ansorge, 2007). They are
derived from microbial decarboxylation of the corresponding amino acids or by
transamination of aldehydes and ketone by amino acid transaminases (Zolou et al., 2003).
Biogenic amines in wines may come from two different sources, i.e. raw materials and
fermentation processes (Gardini et al., 2005; Marques et al., 2008). In general, low levels of
biogenic amines were found in musts and wines, in comparison to other food, however,
biogenic amines can occur in much higher concentrations (Herbert et al., 2005).
Nitrogen-containing flavour compounds are also important in enology. For example, ortho-
aminoacetophenone (O-AAP), the taint compound is responsible for the atypical or untypical
ageing (UTA) off-flavour observed in some white wines (Rapp et al., 1993). UTA wines lose
their varietal character and begin to exhibit atypical flavours such as ―acacia blossom‖, ―floor
polish‖, ―naphthalene‖ (mothballs) and‖ wet towel‖ (Sponholz et al., 2000; Winter, 2003; Bell
& Henschke, 2005). Methyl anthranilate, also known as methyl 2-aminobenzoate or
carbomethoxyaniline, is a methyl ester of anthranilic acid or -aminobenzoic acid, which is
related to the ―foxy‖ taste of labrusca grapes and related hybrids (Rapp & Versini, 1996;
Rapp, 1998). Additionally, methoxypyrazines, cyclic nitrogen-containing compounds, are
reported to be responsible for the vegetative, herbaceous, capsicum-like aromas frequently
noted in wines produced from Cabernet Sauvignon and Sauvignon blanc (Sala et al., 2004 a,
2004 b; Bell & Henschke, 2005). The nitrogen containing flavour compounds formed during
fermentation may influence the fermentation bouquet (Ough & Amerine, 1988).

23
Utilization of nitrogen containing compounds by yeasts
A broad range of nitrogenous compounds, e.g. amino acids, ammonium, amines, polyamines,
amides, S-adenosylmethionine, nucleotides and nucleic acid derivatives, vitamins, peptides,
proteins and trace amounts of nitrates found in grape juice can be metabolized by yeasts
(Henschke & Jiranek, 1993; Fugelsang & Edwards, 2007). It is well established that yeasts
preferentially utilize certain nitrogen sources in a mixture and that the pattern of nitrogen
compounds such as ammonium (inorganic) and amino acids (organic) accumulated depends
on the nitrogen composition and concentration of the fermentation substrate (Bell &
Henschke, 2005). Within the complexity of nitrogenous components in must and wine, amino
acids and ammonium ions are the most important for yeast growth and metabolism (Bisson,
1991; Valero et al., 2003). These compounds are rapidly accumulated by yeast in the early
stages of fermentation, during which they fill the biosynthetic pools of amino acids needed for
protein synthesis and growth, while the surplus is stored in the cell vacuole (Bisson, 1991;
Salmon, 1996). Cooper (1982) also reported that the consumption rate and metabolism of
nitrogenous compounds depend on the yeast strain, its physiological state and the
physicochemical properties of the must or wine. S. cerevisiae can either incorporate amino
acids into the proteins directly, or use them as a source of nitrogen by oxidative deamination
(except lysine and histidine), alternatively, an amino acid is degraded by liberating nitrogen
for the biosynthesis of other nitrogenous cell constituents, and its carbon structure can be
excreted to the wine or be used as a carbon source for the biosynthesis of other compounds.
Although, the S. cerevisiae wine yeast is able to assimilate various nitrogen containing
substrates, the preferred nitrogen sources are ammonium, glutamine and asparagine
classified as good nitrogen sources (Cooper, 1982; Large, 1986; Henschke & Jiranek, 1993;
Beltran et al., 2004; Bell & Henschke, 2005). In general, nitrogen sources that favour high
growth rates are preferentially assimilated because their metabolism readily yields ammonia,
glutamate or glutamine, which play a central role in nitrogen metabolism (Dickinson, 2004;
Bell & Henschke, 2005). Yeasts use a mechanism called nitrogen catabolite repression
(NCR), which mediates the selection of good nitrogen sources by the expression of
appropriate transport systems (permeases) and the degradation of non appropriate
permeases (ter Schure et al., 2000; Magasanik & Kaiser, 2002; Bell & Henschke, 2005).
Ammonia and ammonium serve as the primary form of available nitrogen in yeast
metabolism in grape juice (Bell & Henchke, 2005; Fugelsang & Edwards, 2007), either by
conversion of a non-preferred nitrogen source to ammonia or by growth on ammonia itself
(Grenson et al., 1974). The inorganic nitrogen can be fixed into organic forms through
reaction with -ketoglutarate to yield glutamate by glutamate dehydrogenase (Figure 2-2).
Glutamate can be further used by the cell to produce other amino acids important for
metabolism. As part of the metabolism, degradation of nitrogen-containing compounds as the

24
sole source of nitrogen for yeast growth, leads to the formation of two key nitrogen
compounds in yeast cell, ammonium and L-glutamate as summarized by Grenson et al.
(1974) and Large (1986). The reactions outlined in Figure 2-2 show the synthesis of
glutamate from α-ketoglutarate and ammonia and the synthesis of glutamine from glutamate
and ammonia. By using different sets of enzymes, these core reactions also allow glutamine
as the sole source of nitrogen to be converted into glutamate, and for glutamate as the sole
source of nitrogen to be converted into glutamine (Magasanik & Kaiser, 2002).
Figure 2-2 Central pathways for nitrogen metabolism
Source: Adapted from Magasanik & Kaiser (2002) and modified
Figure 2-2 showed that the nitrogenous compounds in the cell are synthesized from either
glutamate or glutamine. The major pathway for glutamate synthesis is through combination
of ammonia with α-ketoglutarate, which is synthesized from acetyl CoA and oxaloacetate
through the early steps of the citric acid cycle. Glutamine is synthesized by the combination
of ammonia with glutamate. The pathways for utilization of a variety of nitrogen sources,
including urea, proline and arginine, are also shown.
NAD+ α-Ketoglutarate
ATP + Pi NH4
+ ATP
Glutamine
GLN1
2
GLT1
4
NADH
Amino Acids Amino Acids, Purine,
Pyrymidine
NAD +
NH4+
Glutamate
GDH2
GDH1 Isocitrate
ACO1
NADP + NH4
+ NADPH
CIT1
Acetyl CoA
Citrate Oxaloacetate
Urea Arginine Proline
1
IDH1,2
α-Ketoglutarate
3
NADH

25
The metabolism of nitrogen-containing compounds, -amino acids, can also make up a
major group of wine aroma compounds. Several studies have indicated that both the total
available nitrogen and the balance of amino acids and ammonia can significantly affect the
production of fermentation-derived volatile compounds, such as higher alcohols or fusel
alcohol. They can be produced either by the catabolic conversion of the branched-chain
amino acids (valine, leucine, isoleucine, methionine, and phenylalanine) via the Ehrlich
pathway or by the anabolic formation of these amino acids de novo from a sugar substrate
as shown in Figure 2-3 (Äyräpää, 1971; Bell & Henschke, 2005; Ugliano et al., 2007;
Hazelwood et al., 2008; Ugliano & Henschke, 2009). Higher alcohols are characterized by
fusel-like odours, and generally thought to contribute to the complexity of wine fermentation
bouquet. However, when present in very high concentrations they can have a negative
impact on wine aroma, mainly because they mask fruity characters and can result in a strong,
pungent smell and taste (Lambrechts & Pretorius, 2000; Swiegers & Pretorius, 2005; Ugliano
et al., 2007). These alcohols together with acids form esters such as acetic acid ethyl ester,
acetic acid hexyl ester, acetic acid isoamyl ester (banana-like aroma), hexanoic acid ethyl
ester, octanoic acid ethyl ester (apple-like aroma), and acetic acid 2-phenylethyl ester (fruity
and flowery like aroma) during fermentation, which significantly contribute to the pleasant
fruity aroma of wines and other alcoholic beverages. At low levels, all these compounds
contribute to perceived wine aroma complexity. However, they have also been considered as
responsible for off-flavours when present in too high amounts (Romano et al., 2003; Bell &
Henschke, 2005; Swiegers & Pretorius, 2005; Mendes-Ferreira et al., 2009). Among other
factors, nitrogen content affects the pattern of both higher alcohols and esters formed during
fermentation, via regulation of the Erhlich, fatty acid, and ester synthesis pathways (Bell &
Henschke, 2005; Swiegers & Pretorius, 2005; Mendes-Ferreira et al., 2009)
However, nitrogen metabolism is depending on many factors. For example, temperature,
nitrogen deficiency in grape must and timing of nitrogen addition influence the quantity and
the quality of yeast nitrogen requirements (Beltran et al., 2005, 2007, 2008). S. cerevisiae
selects nitrogen sources that enable the best growth by the NCR pathway (Magasanik &
Kaiser, 2002; Bell & Henschke, 2005). Good nitrogen sources such as glutamine, asparagine
or ammonium decrease the level of enzymes required for utilization of poorer nitrogen
sources (ter Schure et al., 2000; Beltran et al., 2004). In addition, utilization of nitrogen-
containing compounds by yeasts is depended on not only the yeast strain, its physiological
state and the physicochemical properties of the must or wine, but also the fermentation
conditions, e.g. yeasts consume less nitrogen at low temperatures and ethanol inhibits the
uptake of most amino acids (Bisson, 1991; Valero et al., 2003; Beltran et al., 2007).

26
Figure 2-3 Formation of higher alcohols from sugar and amino acids by the Ehrlich pathway
Source: Adapted from Bell & Henschke (2005) and Ugliano & Henschke (2009) and modified
2.3 Odour-active compounds involved in varietal aromas in grape and wines
During the alcoholic fermentation, yeasts do not only convert sugars to ethanol and carbon
dioxide, they also produce and release a range of minor but sensorially important volatile
metabolites and aromas that give wine its vinous character, however there are diverse
mechanisms involved in the development of the aroma compounds. To date, over 700 aroma
compounds have been identified, an indication of the potential complexity of wine at
concentrations ranging from mg L-1 to a few ng L-1 or even less (Guth, 1998; Rapp, 1988,
1998; Lambrechts & Pretorius, 2000; Romano et al., 2003; Swiegers et al., 2005 a, 2005 b;
Ribéreau-Gayon et al., 2006 b; Fisher, 2007). Consequently, the olfactory impact of the wine
aroma depends on the concentration, type and perception value. Furthermore, the impact of
each component on the attractiveness of the wine aroma depends on its specific properties.
The odouriferous compounds from grapes play a more decisive role in the quality and
regional character of wines than any other aroma components. These compounds are
responsible for the varietal aroma of wines (Ribéreau-Gayon et al., 2006 b).
The varietal aromas are formed by grape metabolism and are depending on the grape
variety, soil, climate and vineyard management techniques. The glyco-conjugates and S-
cysteine-conjugates, upon hydrolysis by yeast enzymes, can strongly contribute to wine
varietal character (Strauss et al., 1986, Francis et al., 1992, 1996; Francis & Newton, 2005,
Swiegers et al. 2005 a, 2005 b; Thibon et al., 2008 b; Rauhut, 2009). Examples of grape-
Oxidation Ald1-6p
Ehrlich pathway Amino acid sufficiency
Biosynthesis pathway Amino acid deficiency
Acid
Transport
Bap2p, Tat2p,
Mup3p
Gap1p, Tat1p,
Mup1p
NAD(P)H H
+
NADH H
+
NAD+
R |
C ─ O
|
COOH
Deamination Bat1p, Bat2p, Aro8p, Aro9p
R |
H ─ C ─ NH2 |
COOH
Decarboxylation Reduction R |
H ─ C ─ OH |
H
NH3
R |
H ─ C ─ O
Pdc1p, Pdc5p, Pdc6p, Aro10p
CO2
Adh1-6p, Sfa1p
NAD+
Aldehyde α-Keto acid Amino acid
„Fusel alcohol‟
Glycolysis
Sugars Amino acid
Acid
Pdr12p
R |
C ─ O
|
OH

27
derived aroma compounds include hexyl derivatives that elicit fruity and floral aromas and
some monoterpenes, norisoprenoids, substituted methoxypyrazines and thiols as cysteine
conjugates as well as fatty acids, carotenoids and phenolic acids which are enzymatically
cleaved to powerful odour compounds, such as 3-cis-hexanol, -damascenone or 4-
vinylguaiacol, 4MSP, 3SH. The majority of varietal aroma compounds are present in bound
form, making them non-volatile and hence they have no odour. However, these bound
compounds can be released or derived during alcoholic fermentation due to bioconservation
of yeasts (Cole & Noble, 2003; Swiegers & Pretorius, 2005; Swiegers et al., 2005 a, 2005 b;
Fisher, 2007; Rauhut, 2009). Only a few compact substances, such as the monoterpene
linalool or the methoxypyrazines, are also present in their free form in the grape and in the
juice after pressing. The other source for varietal aroma is acid-catalyzed rearrangements of
odourless or barely volatile compounds yielding highly active odourants, such as cis-rose
oxide or trans-rose oxide of Gewürztraminer or 1,1,6-trimethyl-1,2-dihydronaphthaline of
aged Riesling wines (Fisher, 2007). Regarding the variety of varietal aroma compounds, only
some varietal aromas like monoterpenes and thiols with a pleasant odour are given in this
review. The odour-active compounds involved in varietal aroma of wines are shown in Table
2-4.
Monoterpenes
The monoterpenes are a diverse class of natural products, which are genuine compounds in
grape berries (Vitis vinifera) that contribute important floral and citrus characters to wines.
Usually the concentrations are below the thresholds, but sometimes in some varieties
monoterpenes may contribute to the varietal bouquet. They are regarded as key impact
compounds of several white wine varieties, such as Muscat of Alexandria, Morio Muscat,
Riesling, Scheurebe and Gewürztraminer, as well as are responsible for their characteristic
floral aroma (Mateo & Jiménez, 2000; Ebeler & Thorngate, 2009). Monoterpenes can be
divided into three different classes. The first class consists of the free aroma compounds,
commonly dominated by linalool, geraniol and nerol, together with the pyran and furan forms
of the linalool oxides. However, depending on how the juice has been treated and on factors,
which may include climate, many additional monoterpenes can be found in this group, e.g.
citronellol, α-terpineol, ho-trienol, nerol oxide, myrcenol, the ocimenols plus several other
oxides, aldehydes and hydrocarbons. In wines, several monoterpene ethyl ethers and acetic
acid esters have also been found among the free aroma compounds (Mateo & Jiménez,
2000). Secondly, there are the polyhydroxylated forms of the monoterpenes, or free
odourless polyols. The most significant features are the polyols. Although these original
compounds do not contribute to the aroma, some of them are reactive and can break down
with great ease to give pleasant and potent volatiles such as diendiol (3,7-dimethylocta-1,5-

28
diene-3,7-diol), which can give ho-trienol and nerol oxide (Williams et al., 1980; Mateo &
Jiménez, 2000). Finally, these monoterpenes are the glycosidally conjugated forms. While in
their glycoside forms, they offer no contribution to the wine‘s flavour. However, when these
compounds are hydrolyzed back to the sugar and corresponding alcohol, it is this process
that helps to contribute to the wine‘s flavour. Fisher (2007) reported that the release from
these glycosidic precursors can be achieved by acidic hydrolysis at low pH or by the
enzymatic hydrolysis, especially pectinase enzyme as well as yeast strain exhibiting a
specific -glucosidase side activity. Glycosides are, in most cases, more abundant than the
unglycosilated forms of individual monoterpenes and polyols (Mateo & Jiménez, 2000).
Improvements in separations of these compounds obtained with high-resolution capillary GC
columns in the 1970s and 1980s enabled the identification of over 50 monoterpenes in
grapes and wines, and the terpene composition is widely used for varietal characterization
(Schreier, 1979; Marais, 1983; Rapp, 1988, 1998).
In most cases, the most important compounds are the monoterpene diols, linalool, geraniol,
nerol, citronellol, ho-trienol and -terpineol (Strauss et al., 1986; Guth, 1997 a, 1997 b;
Fisher, 2007). Geraniol has an aroma described as rose-like, linalool‘s aroma is described as
camphorous and nerol oxides as vegetative (Simpson, 1979). The flavour threshold of nerol
and α-terpineol is three to four times higher than that of linalool (100 μg L-1). The linalool
oxides have flavour thresholds of 3000–5000 μg L-1 (Rapp, 1988). Besides these compounds,
several highly odouriferous cyclic ethers and lactones have been identified as key
compounds that are generated by cyclization of oxygenation products from these
monoterpene alcohols (Luan et al., 2004). They exist in berry, largely in the skins, principally
as glycoconjugates with only a small proportion present in the free form and are liberated
during alcoholic fermentation. Monoterpenes exist in grape juice and must principally as
mono- and disaccharide terpenes and are released by acidic hydrolysis and various
glycosidic enzymes of grape and exogenous origin, such as commercial enzyme
preparations added during the wine making process (Strauss et al., 1986). However, acidic
conditions present during alcoholic fermentation and storage can catalyze many
monoterpene rearrangements, yielding new compounds with different aroma quantities and
intensities (Rapp, 1988; Ebeler & Thorngate, 2009). For example, Rapp (1988) investigated
that linalool, which is an important floral aroma component of Muscat and Riesling varieties,
can be transformed to -terpineol, hydroxylinalool, geraniol, or nerol under aqueous and
acidic conditions. In addition, Da Porto & Battistutta (1995) investigated that the
concentrations of glycosidically bound linalool, geraniol, nerol and of free geraniol and -
citronellol can be highly correlated with maceration time.

29
Table 2-4 The odour-active compounds involved in the varietal aromas in wine
Varietal aromas
Concentration
in wine (g L-1
)
Aroma threshold
(g L-1
)
Aroma descriptor
Monoterpenes
cis-Rose oxide 3 - 21 0.2 green, grassy, lychee, rose
Citronella traces - 12 18 Citronella
Geraniol 0.91 - 506 30, 130 rose blossom, geranium
ho-Trienol traces - 127 110 Linden
Linalool 1.7 - 473 25.2, 50 flower, lavender, rose, lychee
Nerol 4 - 135 400 Rose
-Terpineol 3 - 87 400 lily of the valley
Wine lactone traces - 0.09 0.01 coconut-like, spice (lime)
C13-norisoprenoids
-Damascenone traces - 11.9 0.05 apple, rose, honey, lemon balm
-Ionone 0.032 - 1.95 0.09 violet, flower, raspberry, seaweed
Vitispriran (E)-6-methylene-2,
10,10-trimethyl-1-oxaspiro
[4.5]dec-7-en
20 -320
> 800 in port
wine
800 balsamic, resinous
1,1,6-Trimethyl-1,2-
dihydronapthalene
1 - 59 20 petroleum-like, kerosene-like
Methoxypyrazines
3-Isobutyl-2-methoxypyrazine traces - 0.042 0.002 in water green bell pepper, spice, earth
3-Isopropyl-2-methoxypyrazine 0.035 0.002 in water green bell pepper, earth, raw
potato, musty
3-sec-Butyl-2-methoxypyrazine 0.0005 0.001 in water green bell pepper
Source: Francis & Newton (2005), Ribéreau-Gayon et al. (2006 b), Fisher (2007)
More recently, several studies suggest that fermentation yeasts might play a significant role
in the monoterpene content of wine (Charoenchai et al., 1997; Bell & Henschke, 2005;
Carrau et al., 2005; Loscos et al., 2007; Ugliano & Henschke, 2009). In addition to -
glucosidase activities, glycosidic activities capable of hydrolysing disaccharide monoterpene
conjugates have also been identified in some fermentations and wine microorganisms (Bell &
Henschke, 2005). According to the release of volatile compounds by hydrolysis of non-
volatile glycoconjugates, various yeast species associated with fermentation can produce
monoterpenes from sugar metabolism, albeit at a low concentration (Carrau et al., 2005).
This group also revealed that some wine strains of Saccharomyces cerevisiae are capable of

30
significant production under certain conditions. Saccharomyces yeast can produce citronellol
from geraniol and nerol, the intensity of this transformation depends on the yeast strain used
(Dugelay et al., 1992; Fernández-González et al., 2003; Fernández-González & Di Stefano,
2004). Other authors propose a more complex scheme that geraniol was transformed by
these yeasts into geranyl acetate, citronellyl acetate and citronellol, while nerol was
transformed into neryl acetate; in addition, geraniol was transformed into linalool and nerol
was cyclized to α-terpineol at must pH (Di Stefano et al., 1992). Additionally, the YAN and
oxygen content of the fermentation medium influence monoterpene formation, that high YAN
(400 mg N L-1) stimulates monoterpene formation, except sesquiterpene (nerolidol and
farnesol). Bell & Henschke (2005) summarized that some strains of yeast, especially
Saccharomyces, might contribute to the floral aroma of wine by de novo synthesis of
monoterpenes, and this effect could be augmented by higher juice nitrogen in combination
with microaerobic fermentation.
Thiols involved in varietal flavour of wines
Thiol compounds (referring to the –SH functional group, the so-called mercaptan) are
generally viewed as being responsible for a range of off-flavours (Goniak & Noble, 1987;
Rauhut et al., 1995; Ribéreau-Gayon et al., 2006 b; Rauhut, 2009). However, their major
contribute to the aroma of certain fruits and aromatic plants has been clearly established.
Thus specific thiols are involved in the characteristic aromas of fruit such as blackcurrant
(Rigaud et al., 1986; Píry et al., 1995), grapefruit (Demole et al., 1982; Lehmann et al., 1994),
passion fruit (Engel & Tressl, 1991; Weber et al., 1994, 1995; Tominaga & Dubourdieu, 2000)
and guava (Idstein & Schreier, 1985; Steinhaus et al., 2008).
The first volatile thiol identified in Sauvignon blanc wines was 4MSP (Figure 2-4), which
elicits aromas like blackcurrant, box tree and broom. Its perception threshold is very low (0.1-
0.8 ng L-1 in water and model solution) (Darriet et al., 1991, 1993, 1995; Murat et al., 2001 a;
Howell et al., 2004). It is always present in Sauvignon blanc at concentrations higher than the
threshold (up to 120 ng L-1). However, high concentrations of 4MSP may cause a ―catty‖ note
in wines (Tominaga et al., 1998 a, 1998 b). Several other odouriferous volatile thiols (Figure
2-4), e.g. 3SH, 3SHA, 3-methyl-3-sulphanylbutan-1-ol (3MSB) and 4MSPOH have also been
identified as major contributors to the varietal aromas of Sauvignon blanc wines. The aroma
of 3SH is redolent of grapefruit and passion fruit as well as reminiscent of other tropical fruit
flavours, such as citrus zest, lychee and guava. The perception threshold is on the order of
60 ng L-1 and always present in Sauvignon blanc wine at concentrations of several hundred
ng L-1, and there may be as much as a few g L-1. The complex odour of 3MSHA is
reminiscent of boxwood, as well as grape fruit zest and passion fruit. It has a similar
threshold value like 4MSP at 4 ng L-1 and some Sauvignon blanc wines may contain several

31
hundred of ng L-1. Nevertheless, its concentrations decrease as the wine ages and 3SH is
formed (Darriet et al., 1995; Tominaga et al., 1998 a, 1998 b; Murat et al., 2001 a;
Dubourdieu et al., 2006; Ribéreau-Gayon et al., 2006 b). The thiols of 3SH and 3SHA were
previously identified in passion fruit by other research group as well (Engel & Tressl, 1991;
Weber et al., 1994, 1995; Tominaga & Dubourdieu, 2000).
The aroma of 4MSPOH, which is reminiscent of citrus zest, has a more limited organoleptic
role in wines because its concentrations in wine are rarely over the perception
threshold (55 ng L-1). However, its threshold can be reached in a few wines. The less
odouriferous 3-methyl-3-sulphanylbutan-1-ol (3MSB), which smells like cooked leeks, never
reaches the perception threshold of 1500 ng L-1 in wine (Dubourdieu et al., 2006; Ribéreau-
Gayon et al., 2006 b). In addition, 4MSP, 3SH, 3SHA and other related thiols have also been
identified in wines made from other varieties like Merlot, Cabernet Sauvignon (Murat et al.,
2001 b), Petite Arvine, Chenin blanc, Bacchus (Ribéreau-Gayon et al., 2006 b),
Gewürztraminer, Pinot gris, Riesling, Alsace Muscat, Sylvaner, Pinot blanc, Colombard,
Semillon, Petit and Grand Manseng (Tominaga et al., 2000), Scheurebe (Guth, 1997 a, 1997
b) in varying concentrations and can, therefore, have a potential impact on the aroma. In
Scheurebe wine, 4MSP was found to be the most potent aroma of 42 isolated odourants
analysed. When each of the 42 odourants were individually excluded from a model wine, the
absence of 4MSP produced a wine least like the original. Recently, Sarrazin et al. (2007)
indicated a contribution of the identified and quantified thiols, 2-methyl-3-sulphanylbutan-1-ol,
3-sulphanylpentan-1-ol, 3-sulphanylheptan-1-ol and probably 2-methyl-3-sulphanylpentan-1-
ol, to the overall aroma of sweet wines made from Botrytis-infected grapes. Table 2-5
specifies the organoleptic roles of these volatile thiols found in wines.
In contrast to many tropical fruits, the volatile thiols are not present in their free and odourous
form in the grape berries, like their odourless cysteine conjugate (Figure 2-5), therefore it
has been proposed that the wine yeast, Saccharomyces cerevisiae, is responsible for the
liberation of volatile thiols from the precursors (Darriet et al., 1993, 1995; Tominaga et al.,
1998 c). The precursors to Sauvignon blanc aroma compounds were identified at the
Bordeaux Faculty of Enology in the 1990s. Darriet et al. (1993) demonstrated that 4MSP was
released from an odourless must extract, either because of bioconversion by yeast during
alcoholic fermentation or chemically, in vitro, because of the action of ascorbic acid.
Tominaga et al. (1995, 1998 c) also identified odourless sulphur-cysteine conjugates as
precursors for the high odour-active thiols.

32
(a) (b) (c)
(d) (e)
Figure 2-4 Odour-active volatile thiols identified in Sauvignon blanc wine
(a) 4MSP, (b) 4MSPOH, (c) 3MSB, (d) 3SH, (e) 3SHA
Source: Adapted from Vermeulen et al. (2003), Ribéreau-Gayon et al. (2006 b) and Grant-
Preece et al. (2010) and modified
Some studies have enabled the identification of S-3-(hexan-1-ol)-glutathione for the first time
in juice of Sauvignon blanc. The identification of this compound suggests that the S-3-
(hexan-1-ol)-L-cysteine, the precursor of 3SH in grapes, is produced by the catabolism of S-
3-(hexan-1-ol)-glutathione (Peyrot des Gachons et al., 2000, 2002 a, 2002 b; Peyrot des
Gachons, 2002). It is assumed that S-glutathione transferase is involved in the synthesis of
the sulphur–glutathione-conjugates, which are probably transported with the help of a
glutathione-conjugate-pump to the cell vacuole. The sulphur–cysteine-conjugates are almost
certainly formed through the activity of a γ-glutamyl transpeptidase, which removes glutamic
acid, and a carboxypeptidase, which eliminates glycine (Wüst, 2003). Tominaga &
Dubourdieu (2000) suggested that the volatile thiol of 3SH in passion fruit juice is present in
both free and conjugate form and have also identifed the precursor of 3SH as S-(3-hexan-1-
ol)-L-cysteine, in the form of trimethylsilylated derivatives in passion fruit. These cysteine
conjugates are probably converted into free thiols either by acid hydrolysis, or by an
endogenous enzyme, such as a -lyase.
The 4MSP and 4MSPOH precursors are mainly located in the flesh of berry (approximately
80 %), while the skin and flesh contain equal amounts of 3SH precursor (Peyrot des
Gachons et al., 2002 a). Similarly, Murat et al. (2001 b) investigated that a majority (60 %) of
the 3SH precursor is located in the skins of Cabernet Sauvignon and Merlot grapes. In the
production of rosé wines made from Cabernet Sauvignon, Cabernet Franc and Merlot, it was
shown that increased skin contact time (from 0 to 24 hours) correlated with a higher
extraction of the 3SH precursor, as well as an increased concentration of volatile 3SH
following yeast fermentation. Additionally, this phenomenon was more marked at higher
temperatures. In the vinification of Sauvignon blanc, skin contact for 19 hours also increased

33
the concentration of the precursor in the pressed juice, e.g. Cys-4MSPOH content has
increased by 20 %, Cys-4MSP by 30 % and Cys-3SH by 50 % (Peyrot des Gachons, 2002).
Regardless of the skin contact temperature, maceration only slightly increases the
concentrations of Cys-4MSPOH and Cys-4MSP with respect to a non-macerated must
(pressed immediately off its skins). In addition, low maceration temperature limits the
increase in Cys-3SH, probably because it decreases extraction from the solids.
S-3-(hexan-1-ol)-L-cysteine S-4-(4-methylpentan-2-one)-L-cysteine S-4-(4-methylpentan-2-ol)-L-cysteine
(Cys-3SH) (Cys-4MSP) (Cys-4MSPOH)
Figure 2-5 The sulphur-cysteine conjugates
Source: Adapted from https://people.ok.ubc.ca/neggers/Chem422A/VARIETAL%20ARO
MA%20COMPOUNDS.pdf and modified
The release of the volatile thiols was investigated by the use of a cell-free enzyme extract of
the bacterium Eubacterium limosum that contains carbon-sulphur lyase enzymes. It could be
shown that carbon-sulphur lyase enzymes can release 4MSP and 4MSPOH from their
precursor S-4-(4-methlypentan-2-one)-L-cysteine (Cys-4MSP) and S-4-(4-methylpentan-2-
ol)-L-cysteine, respectively. Therefore, it was suggested that a yeast cysteine -lyase
releases a thiol, pyruvate and ammonium from the corresponding sulphur-cysteine
conjugates as shown in Figure 2-6 (Tominaga et al., 1995; Peyrot des Gachons et al., 2000,
2002 a, 2002 b; Peyrot des Gachons, 2002; Wakabayashi, 2004). Although the extraction of
the cysteine conjugated precursors into the juice appears to be correlated to the final
concentrations of the volatile thiols present in the wine, only a small and varying proportion of
the precursor is converted to the active aroma compound during fermentation. Where this
release has been studied, only 5 % of the potential 4MSP was released during fermentation
(Tominaga et al., 1995, 1998 c). Peyrot des Gachons (2002) also found that the percentages
of transformation (4MSP and 4MSPOH precursors into 4MSP and 4MSPOH aroma
compounds) are very low, e.g. mean values are 1.4 % for Cys-4MSP and 3.0 % for Cys-
4MSPOH. Studies of the formation of the free thiol have shown that a bacterial extract from
Eubacterium limosum or purified tryptophanase from Escherichia coli cleaves the Cys-3SH
precursor in vitro (Tominaga et al., 1998 c; Wakabayashi, 2004; Wakabayashi et al., 2004).

34
The bacteria extracts exhibit cysteine-S-conjugate β-lyase activity, therefore the wine yeast
Saccharomyces cerevisiae is proposed to cleave thiol precursors during grape juice
fermentation and to release 3SH by a similar mechanism (Figure 2-7) (Tominaga et al., 1998
c). It has been shown that β-lyase enzyme activity results in the formation of a free thiol and
an intermediate that spontaneously degrades to pyruvate and ammonia (Davis & Metzler,
1972). It has been shown that when the thiol precursor of Cys-3SH decreases in
concentration, 3SH increases during fermentation (Murat et al., 2001 a), however, 0–9 % of
3SH was released over the course of fermentation. Furthermore, in Cabernet Sauvignon and
Merlot musts, it was shown that the amount of 3SH released was proportional to the Cys-
3SH concentration present at the start of fermentation, although only 3.2 % of the original
precursor originally was released as volatile thiols in the must. Therefore, the higher the
concentration of the cysteine conjugate thiol precursors in the must, the higher the volatile
thiol concentration in the resulting wine (Murat et al., 2001 a, 2001 b). It has been confirmed
by Peyrot des Gachons (2002) that the percentage of transformation of 3SH precursor (Cys-
3SH) into 3SH aroma compound is very low, only 4.2 % of 3SH was released. Similarly,
Dubourdieu et al. (2006) also reported that only a small fraction (1.6 %) of the cysteine-
bound precursor originally present was released as 3SH.
S-4-(4-methylpentan-2-one)-L-cysteine Pyruvate 4-Methyl-4-sulphanylpentan-2-one
Figure 2-6 Release of 4-MSP from the corresponding sulphur–cysteine-conjugate
Source: Adapted from Rauhut (2009) and modified
It has been shown that, during fermentation, 3SHA is generally formed when acetic acid
esterifies the 3SH that has been released. Swiegers et al. (2005 b, 2007) investigated that
3SHA is formed from 3SH by the action of the yeast ester-forming alcohol acetyltransferase,
encoded by the ATF1 gene. The overexpression of the ATF1 gene in the VIN13 yeast strain
resulted in a significant increase in the amount of 3SHA produced. This established the link
between ester production and volatile thiol metabolism in yeast for the first time. On the other
hand, overexpression of the gene IAH1, which encodes an ester-degrading enzyme, resulted
in a reduction in the concentration of 3SHA. The ability of different commercial wine yeasts to
convert 3SH into 3SHA during fermentation was also investigated. Large variations in 3SHA
β-Lyase + NH3 +

35
concentrations were observed, and in most cases, this did not correspond with the ability of
the yeasts to release 4MSP. Therefore, it is clear that yeast strain selection is of extreme
importance in modulating volatile thiol-concentrations in wine. Lilly et al. (2006) also
suggested that the overexpression of ATF1 in a VIN13 yeast strain resulted in increased
3SHA concentrations.
S-3-(hexan-1-ol)-L-cysteine 3-Sulphanylhexanol Pyruvate
Figure 2-7 The cysteine conjugate form of 3SH, which revealed by a specific -lyase
Source: Adapted from https://people.ok.ubc.ca/neggers/Chem422A/VARIETAL%20AROMA%
20COMPOUNDS. pdf and modified
Recently, Roland et al. (2010) suggested that the production of the 3SH in wines seems to
have two different origins, the first one from precursors naturally occurring in grapes and the
second one linked to the winemaking technology (hexenal and G3SH pathways). The
hexenal pathway described by Schneider et al. (2006) implicated sulphur donors during
winemaking, and glutathione seemed to be one of the producing 3-S-glutathionylhexan-1-ol
(Glut-3SH) precursor. They demonstrated a new pathway leading to 3SH and 4MSP, starting
from conjugated carbonyl compounds, alternative to the already biogenetic route known
release from cysteinylated and gluthationylated precursors present in grapes. It was the first
demonstration that Glut-3SH can liberate 3SH under model fermentation conditions, where
the cysteine conjugate is also formed in the process. Therefore, it was suggested that this
might also occur during fermentation of a grape juice or must (Grant-Preece et al., 2010). It
was also investigated in the fermentation of Sauvignon blanc that the additions of glutathione
or hexenal induced significant increases in the production of 3SH and 3SHA of 25 % and
41 %, respectively (Roland et al., 2010).
Some research works indicated that yeast strains vary in the ability to release 4MSP, 3SH
and 4MSPOH. It could be also demonstrated that commercial yeast strains differ in the
release of the various volatile thiols (Murat et al., 2001 a; Howell et al., 2004; Curtin et al.,
2009; Swiegers et al., 2005 b, 2007, 2009). Therefore, the genetic and physiological
characteristics of the wine yeast strain have a significant effect on the amount of volatile
thiols released. In addition, the particular yeast‘s ability to release one thiol does not appear
+ NH3 +
β-Lyase
Fermentation

36
to be linked with its ability to release a second, different thiol. For example, the commercially
available S. cerevisiae wine strains VL3 and EG8 release more 4MSP and 4MSPOH, but not
3SH, than strains VL1 and 522d. It has been shown that strains of S. bayanus and their
hybrids created with S. cerevisiae released even higher concentrations of the thiols (Murat et
al., 2001 a). Similarly, Masneuf-Pomarède et al. (2002) investigated that S. bayanus var.
uvarum strains and hybrids S. cerevisiae x S. bayanus var. uvarum were shown to present a
high ability to release the volatile thiols from their natural precursors. These findings were
recently confirmed by showing that different commercial yeast strains have variable abilities
in releasing 4MSP from the Cys-4MSP precursor in model ferments (Howell et al., 2004).
Commercial wine yeast strains that release even more thiols than VL3 were recently
identified by Swiegers et al. (2005 b), e.g. the VIN7 strain produced the highest concentration
of 4MSP and 3MSA and the VIN13 strain produced the highest concentration of 3SH.
Therefore, these results indicate that the activity of the enzymes involved in the release of
the different thiols is strain dependent and that by using different strains. The variation of the
release of the enzymes and of the thiols can be achieved by the use of specific yeast strains.
Furthermore, separate yeast enzymes may be involved in the formation of different volatile
thiols, allowing the levels of the aroma compounds to be altered independently (Murat et al.,
2001 a; Dubourdieu et al., 2006). Post-fermentation practices could also affect the impact of
the thiol aromas, for example aroma intensity is reduced when copper is added to Sauvignon
blanc wine (Darriet et al., 1995).
In addition, King et al. (2008) investigated the impact of coinoculating commercial yeast
strains (VIN7, QA23, VIN13) on the volatile thiols and sensory profile of Sauvignon blanc
wines. It was indicated that the VIN7/QA23 coinoculated wines were higher in 3SH and
3SHA than the single-strain and blended wines, although this pattern was not observed for
the VIN7/VIN13 yeast combination. This demonstrates that coinoculated wines can result in
increased concentrations of the volatile thiols when certain yeast combinations are used to
conduct alcoholic fermentation. The ability of yeast to release 4MSP from Cys-4MSP when
genes encoding putative yeast carbon-sulphur lyases are deleted was recently investigated.
Four genes expressing putative carbon-sulphur lyase enzymes were involved in the release
of the volatile thiol 4MSP in a laboratory strain (Howell et al., 2005). This pointed out that the
mechanism of release probably involves multiple genes and the result showed that deletion
of the four putative carbon-sulphur lyase genes leads to a decrease in the amount of 4MSP
released. However, it was not indicated if overexpression of the genes resulted in an
increase in 4MSP release. Swiegers et al. (2007) demonstrated that the overexpression of
the Escherichia coli tnaA gene, encoding a tryptophanase with strong cysteine--lyase
activity, in a commercial wine yeast strain resulted in up to a 25-fold increased release of
4MSP and 3SH from the precursor in model ferments. In addition, Sauvignon blanc wine

37
made with this modified yeast displayed an intense passion-fruit aroma, compared with the
relatively neutral aromas produced by the control strain.
During the past decade, studies have clearly shown that volatile thiol levels decrease in the
presence of oxygen during wine ageing and after bottling (Blanchard et al., 2004; Brajkovich
et al., 2005). Aromatic degradation observed in wines is well documented. During aging, an
important decrease of 3SH occurs in wine due to the presence of dissolved oxygen. 3SH is
probably oxidized to its disulphide (Darriet, 2002). Consequently, this thiol could react with
reactive species present in wine such as polyphenols, e.g. the quinones of catechin and
epicatechin (Blanchard et al., 2004; Nikolantonaki et al., 2009). In contrast, 4MSP was less
reactive with these phenolics. Additionally, the presence of free sulphur dioxide enhances the
stabilization of 3SH and 4MSH in model wine. Recently, the impact of fermentation
temperature on the concentration of volatile thiols was determined in a model medium and in
grape juice. It was shown that the concentrations of 4MSP, 3SH, and 3SHA were higher
when the alcoholic fermentation was conducted at 20 °C compared to 13 °C, irrespective of
the yeast strain used (Masneuf-Pomarède et al., 2006). In contrast, Swiegers et al. (2006)
showed that, in model ferments, more 4MSP was released and more 3SH was converted to
3SHA at lower temperatures (18 °C) compared to higher temperatures (23 and 28 °C) at the
end of fermentation. However, at the start of fermentation, more volatile thiols were present
in the warmer ferments.
It has been shown that viticultural practices like nitrogen feeds (Choné et al., 2006) and
prefermentation operations such as skin contact (Peyrot des Gachons et al., 2002) modulate
the amount of thiol precursors in grape must. Fermentation conditions such as temperature
(Masneuf-Pomarède et al., 2006; Swiegers et al., 2006) also influence the final concentration
of these thiol aromas in wine. The impact of nitrogen levels during fermentation on the
release of volatile thiols has not yet been clearly elucidated. There have been little scientific
researches about the impact of yeast rehydration nutrient, DYNASTART, on the release of
volatile thiols. Initial results published by Swiegers et al. (2008) revealed that it had a
significant effect on both volatile thiol release and fermentation ester production. Similarly,
van der Westhuizen et al. (2008) investigated the impact of yeast strains and nutrition on the
thiol intensities. It was shown that the rehydration of the X5 yeast strain with yeast
rehydration nutrient, DYNASTART, can dramatically increase aromatic intensity of varietal
aromas, particularly the 3SHA (passion fruit), even better than a blend of two yeasts
commonly expressing high concentrations of volatile thiols. It has been confirmed by Bowyer
et al. (2008) that DYNASTART enhanced the expression of varietal aromas in Sauvignon
blanc by an average of 30 % for 4MSP, 55 % for 3SH, and 89 % for 3SHA. In addition,
Sauvignon blanc wine made with X5 and yeast rehydration nutrient, leaded to significantly
higher wine preference.

38
The research of Subileau et al. (2008) recently investigated the influence of nitrogen
catabolite repression (NCR) on the modulation of the production of aromatic thiols
characteristic for Sauvignon blanc wine fermentation. It was revealed that the production of
3SH is increased when urea is substituted to diammonium phosphate (DAP) as the sole
nitrogen source on a synthetic medium, similarly, on grape must, complementation with DAP
induces a decrease of 3SH production. Additionally, it could be concluded that on synthetic
medium, Cys-3SH enters the cell through at least one identified transporter, GAP1p, whose
activity is limiting the release of volatile thiols. On grape must, the uptake of the precursor
through GAP1p is not confirmed, but the effect of addition of DAP, eventually prolonging
NCR, is shown to decrease thiol production. More recently, Thibon et al. (2008 a)
investigated the role of NCR in the release of volatile thiols in an enological context. The role
of three yeast -lyases was revealed and it was demonstrated that Irc7p, a putative
cystathionine (-lyase), is one of the main proteins catalyzing the 4MSP and 3SH release
under enological conditions. Moreover, Ure2p/Gln3p proteins mainly control the
bioconversion of volatile thiols by the transcriptional regulation of the IRC7 gene through the
general mechanism of NCR. In addition, this finding suggested that the enantiomer balance
of 3SH may be modulated by activating specifically stereoselective enzymes such as Irc7p.
2.4 Sulphur containing compounds in winemaking
Sulphur (S)-containing compounds occur in a range of chemical combinations in the natural
environment. Sulphur is present in essential vitamins, coenzymes and amino acids such as
methionine and cysteine (Richmond, 1973; Rauhut, 1993). It is important for the growth of all
microorganisms due to the formation of sulphur containing amino acids. It can occur in an
oxidized state (sulphate) or a reduced form (sulphide). Sulphur is one of the most important
elements required for biological life, particularly as a component of the amino acids, cysteine
and methionine as well as a component of vital co-factors (Swiegers & Pretorius, 2005;
Rauhut, 2009). In S. cerevisiae, the sulphur content ranges from 0.2-0.9 % of the dry weight
(Maw, 1963 a, 1963 b). The most abundant S-compounds are the amino acids methionine
and cysteine, which are present in peptides, proteins, tripeptides and glutathione (Hartnell &
Spedding, 1979; Rauhut, 1993). Other S-compounds, such as thiamine, acetyl-CoA, biotin
and lipoic acid, represent only a small proportions of the total sulphur. In Sacchromyces spp.,
thiamine ranges from 29-90 g g-1 dry weight of the cells (Maw, 1965; Rauhut, 1993).
In recent years, the composition in sulphur compounds of wines has become a subject of
many studies concerning their identification and origin, as well as their character and impact
on wine quality, especially sensory characteristic of wine (Rauhut & Kürbel, 1994; Rauhut,
1996; Moreira et al., 2002; Rauhut, 2003; Fedrizzi et al., 2007; Ferreira et al., 2007; Swiegers

39
& Pretorius, 2005; Thibon et al., 2008 a, 2008 b; Rauhut, 2009). This is related to their high
volatility, reactivity and impact at very low concentrations (Rauhut, 2009). These compounds
are generally classified as detrimental to wine quality however, new developments in wine
research allowed the differentiation of a family of these compounds responsible for varietal
aromas of wines, such as passion fruit, grapefruit, gooseberry, guava, and box hedge
aromas in wine. Rauhut (1993, 2009) reported that some of these compounds are necessary
for wine quality, while others are the cause of strong objectionable flavours (rotten eggs,
cooked cabbage, cauliflower, burnt rubber etc.), even at extremely low concentrations (e.g.
H2S, methanethiol (MeSH), ethanethiol (EtSH), thioacetic acid-S-methyl ester (MeSAc),
thioacetic acid-S-ethyl ester (EtSAc). Several studies reported that during alcoholic
fermentation the wine yeast Saccharomyces cerevisiae is mainly responsible for the
production of various volatile sulphur compounds, which have an impact on the sensory
quality of wine (Rauhut, 1993, 1996; Rauhut et al., 1995, 1996; Moreira et al., 2002;
Swiegers & Pretorius, 2005; Ribéreau-Gayon et al., 2006 b; Swiegers et al., 2006; Rauhut,
2009). Sulphur compounds in wine can be classified into thiols (mercaptan), sulphides,
thioesters and heterocyclic compounds. Furthermore, these compounds can become less or
more attractive or repulsive depending on their absolute and relative concentrations. Sulphur
aroma compounds in wine were often separated in low and high volatile sulphur substances
due to the broad range of different boiling points and the need of different analytical methods
to enrich the sulphur compounds from wines (Rauhut et al., 2005 a, 2005 b; Swiegers &
Pretorius, 2005; Fedrizzi et al., 2007; Ferreira et al., 2007; Thibon et al., 2008 b).
Most sulphur containing compounds in wine are produced during alcoholic fermentation by
the Saccharomyces wine yeast (Rauhut, 2009). Volatile sulphur compounds are formed
through several pathways involving enzymatic and/or non-enzymatic processes. Yeast
fermentation biochemistry with sulphate-, sulphite-, sulphur-containing amino acids
(methionine and cysteine) and oligopeptides (e.g. glutathione) plays a crucial role among the
enzymatic processes. On the other hand, non-enzymatic processes involve chemical,
photochemical and thermal reactions during winemaking and storage. Mestres et al. (2000)
suggested that the development of various sulphur compounds by yeast include (i) the
degradation of sulphur containing amino acids, (ii) the degradation of sulphur containing
pesticides and (iii) the release and/or the metabolism of grape-derived sulphur-containing
precursors.
In accordance with the new rules for the international nomenclature of chemical compounds
(IUPAC), the prefix ‗methyl-sulphanyl‘ should replace the prefix ‗methylthio‘ and ‗ethyl-
sulphanyl‘ should replace the prefix ‗ethylthio‘, furthermore the prefix ‗sulphanyl‘ must replace
the prefix ‗mercapto‘ (Rauhut, 2009).

40
Utilization of sulphur containing compounds by yeasts
Yeast is able to use various sulphur containing compounds in contrast to many other
microorganisms due to the sulphur pathway in yeast, which allows it to use various organic
and inorganic S-compounds as sole sulphur source (Rauhut, 1993, 2009). A source of
assimilable sulphur is essential for yeast growth. Almost all yeasts utilize inorganic sulphate
(Maw, 1963 a, 1963 b, 1965). The main sulphur source for yeast during wine making is
inorganic sulphur as sulphate, which is presents in grape must in a range of 160-400 mg L-1
or even more (Lemperle & Lay, 1989), because the levels of methionine and cysteine are
normally very low in grape musts (less than 10 mg L-1) in comparison to other amino acids
(Henschke & Jiranek, 1991, 1993). Furthermore, sulphur dioxide and elemental sulphur from
residues of the application of wettable sulphur (fungicide) on grape are also the sulphur
sources for yeast during the winemaking process. Sulphur dioxide is commonly used due to
its antimicrobial and antioxidant effects as well as its reaction with ethanal (acetaldehyde) to
avoid an oxidative character and its inactivation of enzymes (Dittrich, 1987; Romano & Suzzi,
1993; Ribéreau-Gayon et al., 2006 a; Rauhut, 2009).
Saccharomyces can metabolize sulphur containing compounds by the sulphate assimilatory
reduction pathway or sulphate reduction sequence (SRS) pathway, during which sulphate is
taken up and is used for the biosynthesis of organic sulphur compounds, mostly cysteine,
methionine, and S-adenosylmethionine (AdoMet) (Thomas & Surdin-Kerjan, 1997; Surdin-
Kerjan, 2003). Research works to investigate sulphur metabolism in S. cerevisiae were done
by some research groups, which characterized more than 15 genes encoding enzymes of
the sulphur amino acid pathway (Thomas & Surdin-Kerjan, 1997; Henschke & Jiranek, 1993;
Surdin-Kerjan, 2003; Wang et al., 2003; Linderholm et al., 2008; Rauhut, 2009). The first
step of the SRS metabolic pathway involves the transport of sulphate from the medium into
the yeast cell by sulphate permease. Sulphate is then reduced to sulphide through a series
of steps using the enzymes ATP-sulphurylase (using two ATP molecules) and sulphite
reductase. The next step leads to the sequestering of the sulphide: O-acetylserine (from the
amino acid serine) combines with sulphide to form cysteine, and O-acetylhomoserine (from
the amino acid aspartate) combines with sulphide to form homocysteine, which can then be
converted to methionine (Yamagata, 1989; Rauhut, 1993; Jiranek et al., 1995 b; Spiropoulos
et al., 2000; Henschke & Jiranek, 1993; Rauhut, 2009). Figure 2-8 shows a simplified
overview on the metabolism of sulphur amino acids and glutathione in Saccharomyces
cerevisiae. Regarding the variety of sulphur containing compounds, only some compounds
found in musts and wines are presented in this review.

41
Figure 2-8 Metabolism of sulphur amino acids in Saccharomyces cervisiae
Source: Adapted from Spiropoulos et al. (2000) and Wang et al. (2003) and modified
(I) aspartate kinase; (II) aspartate semi-aldehyde dehydrogenase; (III) homoserine
dehydrogenase; (IV) homoserine kinase; (V) threonine synthase; (VI) homoserine O-
transacetylase; (VII) sulphate permeases; (VIII) ATP sulphurylase; (IX) APS kinase; (X)
PAPS reductase; (XI) sulphite reductase; (XII) serine acetyltransferase; (XIII) O-
acetylhomoserine and O-acetylserine sulphydrylase; (XIV) homocysteine methyltransferase;
(XV) S-adenosylmethionine synthetase; (XVI) S-adensylmethionine demethylase; (XVII)
adenosylhomocysteinase; (XVIII) methionyl-tRNA synthetase; (XIX) β-cystathionine synthase;
(XX) β-cystathionase; (XXI) cysteine synthase; (XXII) γ-cystathionine synthase; (XXIII) γ-
cystathionase; (XXIV) γ-glutamylcysteine synthetase; (XXV) glutathione synthetase; (XXVI)
γ-glutamyltranspeptidase; (XXVII) cysteinylglycine dipeptidase
I VII
Aspatic acid
β-Aspartyl phosphate
Sulphate (SO42─
, exogenous)
Sulphate (SO42─
, endogenous)
II VIII
β-Aspartate semialdehyde Adenylylsulphate (APS)
III IX
Homoserine Phosphoadenylylsulphate (PAPS)
VI
X
O-Acetylhomoserine
Sulphite (SO32─
)
XI
Sulphide (S2─
)
Homoserine phosphate
IV
V
Threonine CoA
Acetyl-CoA
XII
O-Acetylserine
Serine
CoA
Acetyl-CoA
-Glutamyl-cysteine
N5-methyltetra-hydrofolate
S-Adenosyl-methionine
(SAM)
S-Adenosyl-
homocysteine
XXVII Glutamate
Cysteine
XXIII
XXII
XX
Cystathionine
NH3 & pyruvate
XIII
Homo-cysteine
XXI
XIX
Serine
Glutamate &
-glutamyl peptides
O-Acetyl homoserine
XXIV
XIV
XVII
XVI
Methionine XV
VIII
Met-tRNA
Cysteinyl-glycine
XXVI
XXV Glycine
Glutathione

42
Hydrogen sulphide and related sulphur compounds
During wine fermentation, the assimilatory reduction in sulphate by Saccharomyces wine
yeast (to biosynthesize cysteine and methionine) can lead to the excessive production of the
HS- ion, which causes the formation of H2S in wine (Jiranek et al., 1995 b; Spiropoulos et al.,
2000; Mendes-Ferreira et al., 2002; Swiegers et al., 2005 a; Mendes-Ferreira et al.,
2009). It is generally agreed that H2S acts as an intermediate in the biosynthesis of sulphur-
containing amino acids by yeast during fermentation (Jiranek et al., 1995 b; Thomas &
Surdin-Kerjan, 1997; Surdin-Kerjan, 2003), but it is responsible for the ―reductive‖ off-flavours
often described as rotten egg and putrefaction in wine (Henschke & Jiranek, 1991, 1993;
Rauhut et al., 1995, 1997; Fedrizzi et al., 2007; Rauhut, 2009). Lower levels in young wines
contribute to the yeast flavour or fermentation bouquet (Monk, 1986; Dittrich, 1987). The
information on the threshold value for this compound is in the range of 11-80 g L−1 (Amoore
& Hautala, 1983; Henschke & Jiranek, 1991). Some studies investigated that deficiency of
nitrogen containing nutrients, especially assimilable amino acids, lead to an overproduction
of H2S and other undesirable volatile S-compounds (Rauhut et al., 1995; Rauhut, 1996;
Rauhut et al., 2000 a, 2000 b). The concentration of H2S produced during wine fermentation
depends on several environmental factors and on nutrients, namely (1) levels of elemental
sulphur (Schütz & Kunkee, 1977; Thomas et al., 1993) naturally available as sulphate at an
average concentration of 200 mg L−1 (Rauhut, 1993, 2009) and residues from wettable
sulpuhr treatment of the vines and other sulphur containing pesticides and their breakdown
products (Rauhut, 1993, 2003; Henschke & Jiranek, 1993; Bell & Henschke, 2005; Ribéreau-
Gayon et al., 2006 a, 2006 b; Rauhut, 2009), (2) presence of sulphur dioxide (Acree et al.,
1972; Romano & Suzzi, 1993; Ribéreau-Gayon et al., 2006 a) commonly added (50-200 mg
L−1) to grape must prior to wine fermentation, (3) presence of organic compounds containing
sulphur (Henschke & Jiranek, 1991; Giudici & Kunkee, 1994; Rauhut, 2009), (4) wine yeast
strain (Jiranek et al., 1995 b; Rauhut et al., 1995, 1996, 1997; Spiropoulos et al., 2000;
Mendes-Ferreira et al., 2002, 2009), (5) fermentation conditions, (6) the nutritional status of
the grape juice, (7) residues of copper ions and storage on lees (Henschke & Jiranek, 1991;
Rauhut, 1993; Rauhut et al., 1997, 2000 a, 2000 b, 2001; Rauhut, 2003; Bell & Henschke,
2005; Mendes-Ferreira et al., 2009) and (8) vitamin deficiency (Wainwright, 1971; Tokuyama
et al., 1973; Wang et al., 2003; Bohlscheid et al., 2007; Mendes-Ferreira et al., 2009).
However, some strains appear to produce H2S constitutively without being affected by the
environmental conditions, possibly indicating metabolic defects (Jiranek et al., 1995 b;
Spiropoulos et al., 2000; Mendes-Ferreira et al., 2002).
Accumulation of acetaldehyde and the elongator histone complex are suggested as two
cellular activities that have an impact on sulphide production during anaerobic fermentation
(Rauhut, 2009). Recent evidence suggests that intracellular glutathione can be degraded to

43
cysteine and ultimately H2S under nitrogen deficit conditions (Elskens et al., 1991, Hallinan et
al., 1999), this result is in accordance with Rauhut et al. (2001) and Rauhut (2003), who
investigated that the supplementation of must with a concentration of more than 50 mg L-1
can lead to unpleasant volatile sulphur compounds under certain conditions. On the contrary,
Dubourdieu & Lavigne-Cruège (2002) proposed that glutathione seems to play an important
role in protecting volatile thiols that are responsible for the varietal flavour of white wines
during the ageing of bottles. H2S is known to be produced directly from cysteine by cysteine
desulfhydrase when nitrogen is limited (Tokuyama et al., 1973). Insufficiencies in vitamins,
micronutrients (pantothenic) and vitamin B6 (pyridoxine), essential for the synthesis of
sulphur containing amino acids, may also contribute to H2S formation (Jiranek et al., 1995 b;
Spiropoulos et al. 2000; Mendes-Ferreira et al., 2002). Ammonium salts like diammonium
hydrogen phosphate (DAP) are widely used to compensate nitrogen deficiencies in grape
must and to practically control H2S formation (Hansen et al, 1994; Rauhut, 2009). However,
not in all cases its supplementation is effecting H2S production due to other factors, e.g.
methionine and other nitrogen sources that regulate amino acid transport into the yeast cell
and sulphur metabolism, especially SRS pathway, which generates H2S (Spiropoulos et al.,
2000; Spiropoulos & Bisson, 2000). Some studies have indicated that DAP is a powerful
modulator of H2S and other fermentation-derived volatiles, however, depending on yeast
strain (Jiranek et al., 1995 b; Wang et al., 2003; Hernández–Orte et al., 2006 a; Vilanova et
al., 2007; Ugliano et al., 2009). Furthermore, the problem of overproduction of H2S is
relatively easily dealt with through the use of copper, which result in the formation of copper
sulphide, or aeration resulting in oxidation of the sulphide (Monk, 1986; Rauhut, 2009).
In addition to hydrogen sulphide and related sulphur compounds, a variety of other thiols
exist in wine, which are though usually present in only very low concentrations. They
generally cause undesirable aromas, however, several confer pleasant fruity aromas (Rauhut,
1993; Darriet et al., 1995; Tominaga et al., 1998 a, 1998 b; Bell & Henschke, 2005;
Ribéreau-Gayon et al., 2006 b; Swiegers et al., 2005 b; Rauhut, 2009). Nevertheless, the
important varietal thiols are already reviewed in more details in 2.3 Thiols involved in
varietal flavour of wines. Many of these S-compounds are formed during fermentation and
respond to the nitrogen status of the must in a similar manner to H2S (Bell & Henschke,
2005). It has been well known that hydrogen sulphide is a highly reactive substances, which
can take part in a range of reactions to generate some sulphur compounds that have an
impact on the flavour of a wine, such as ethanethiol (ethyl mercaptan), dimethyl sulphide
(DMS) and polysulphides (dimethyl disulphide, DMDS), dimethyl trisulphide (DMTS) and
dimethyl tetrasulphide) (Rauhut, 1993; Vermeulen et al., 2003; Bartowsky & Pretorius, 2009;
Rauhut, 2009). One mechanism for the formation of the polysulphides is believed to involve
oxidation of the mercaptans. These compounds, which elicit a ―rubber‖ or ―garlic‖ odour

44
cannot be removed by copper fining (Swiegers et al., 2005 a). Goniak & Noble (1987)
suggested that the mercaptans, including methyl mercaptan (methanethiol, MeSH) and ethyl
mercaptan (ethanethiol, EtSH), are highly reactive compounds with low aroma thresholds
and very low boiling points. These mercaptans are observed to form during fermentation in
association with hydrogen sulphide. Their suppression by DAP suggests that they are
produced as by-products of yeast metabolism of methionine (Rauhut, 1993). Ethanethiol can
be formed by the reaction of hydrogen sulphide with ethanol or acetaldehyde, however, this
could not be confirmed up to now (Rankine, 1963, 1968 a; Amerine et al., 1980; Rauhut,
1993, 2003). The aroma of EtSH is described as ―onion‖ or ―rubber‖ with a threshold value of
1.1 µg L-1 in wine (Bartowsky & Pretorius, 2009). Fermentation studies suggest that MeSH,
which gives wines rotten egg or cabbage aromas, is derived from methionine, cysteine, S-
methylmethionine and sulphate (De Mora et al., 1986; Rauhut, 1993). The odour threshold of
MeSH is extremely low at 0.02-2 g L-1 in water (Bartowsky & Pretorius, 2009).
An accelerated high formation of H2S leads to an increase of thioacetic acid esters, MeSAc
formed in the early phase of fermentation, while EtSAc formed at the end (Rauhut, 2009).
These thioacetic acid esters were probably produced through the reaction of the thiols and
acetyl coenzyme A (Matsui & Amaha, 1981; Walker & Simpson, 1993). Rauhut (1996) found
that the addition of MeSH and EtSH during fermentation leads to the corresponding
thioacetic acid esters. Matsui & Amaha (1981) supposed that high concentration of
methanethiol and H2S can hinder the growth of yeasts. It is therefore assumed that the
formation of thioacetic acid esters is a detoxification process to transform sulphur
components with a free SH-group, which can inhibit enzymes, to non-affecting compounds
like the thioacetic acid esters. MeSAc can be detected in normal wine in a concentration up
to about 20 g L-1 (Leppänen et al., 1979, 1980). Rauhut (1996) demonstrated that more
than 130 g L-1 could be detected in off-flavour wines. These thioacetic acid esters can
hydrolyze during wine storage like other acetic acid esters after fermentation due to the
chemical equilibrium (Rapp, 1998) and leads to free thiols (e.g. MeSH and EtSH) and acetic
acid. A treatment of wine with copper sulphate has no effect on the concentration of the
thioacetic acid esters as it mainly reacts with H2S and thiols (Rauhut, 1996, 2003). However,
the formation of these thiols and their esters in conjunction with H2S has been observed and
it was noted that their production was suppressed by DAP in nitrogen responsive strains
(Rauhut et al., 1996).
The wine yeast Saccharomyces cerevisiae is mainly responsible for the production of several
volatile sulphur compounds during the alcoholic fermentation. Therefore, it could be
demonstrated that yeast strains differ in their formation of sulphur compounds (Rauhut &
Kürbel, 1994; Rauhut et al., 1996, 1997, 2000 b). The origin of DMS is not clear but it might
be formed by yeast from cysteine, cystine or glutathione or from dimethyl sulphoxide by a

45
yeast reductase (Rauhut, 1993; Ribéreau-Gayon et al., 2006 b). Some authors described
DMS as ―corn‖, ―molasses‖ or ―asparagus‖ (Rauhut, 1993; Mestres et al., 2000), others as
―quince‖ or ―truffle‖, when the concentration in wines is near the olfactory threshold; at higher
amounts the wine gains aromas related with metallic characteristic (Anocibar Beloqui, 1998).
It has been shown that DMS level increases during wine ageing and contributes to the
―ageing bouquet‖ and it could also enhance fruity character in low concentration (De Mora et
al., 1986, 1987; Rauhut, 1993). The concentration of DMS in wines ranges from 0-474 g L-1
or even higher, therefore it is well above the odour threshold of 25 g L-1 (white wine)
(Goniak & Noble, 1987) and 25 g L-1 (red wine) (De Mora et al., 1987).
Diethyl sulphide (DES) occurs in wine and has a reminiscent of ―cooked vegetables‖, ―onion‖
and ―garlic‖ (Goniak & Noble, 1987; Swiegers et al., 2005 a; Bartowsky & Pretorius, 2009).
Its flavour threshold is 0.92-0.93 g L-1, and its level in wines ranges from 4.1-31.8 g L-1
(Goniak & Noble, 1987; Swiegers et al., 2005 a). DMDS, which is characterized as cooked
and intensively onion-like, was determined in white wines at concentrations from traces
to 2 g L-1 and in red wines from 0.3-1.6 g L-1 (Leppänen et al., 1979, 1980; Swiegers et
al., 2005 a). These small concentrations of DMDS can be formed from MeSH by oxidation.
Higher amounts arising from pesticides can occur in sulphurous off-flavour wines. In addition,
yeasts have the ability to reduce disulphides, such as DMDS, to mercaptans (Swiegers et al.,
2005 a). Diethyl disulphide (DEDS), which was described as reminiscent of garlic and burnt
rubber, can be produced by the oxidation of two molecules of EtSH. It has a threshold
of 4.3 g L-1 in white wine and was determined in wine at concentrations from traces to 85
g L-1 (Goniak & Noble, 1987; Swiegers et al., 2005 a). Thiols can be also oxidized to
disulphides or trisulphides, which contribute to odours like ―rubber‖ or ―garlic‖. These
sulphides cannot be removed by copper fining (Maujean, 2001; Swiegers et al., 2005 a).
Carbon disulphide (CS2), which has a ―sweet‖ and ―ethereal‖ odour, was found from traces to
10 g L-1 in white wines (Leppänen et al., 1980). In the headspace of some white wines
levels up to 15-18.9 g L-1 of CS2 were reported. It has no significant influence on the flavour
of wine as the threshold value is above the level found in wines. Carbonyl sulphide (COS),
which is an odourless compound, was detected in wine from traces to 2.5 g L-1 (Spedding et
al., 1983; Mestres et al., 2000). This compound is also unlikely to have an influence on the
sensory quality of wines, because it is a colourless and odourless gas (Rauhut, 1993;
Mestres et al., 2000). It is though that both compounds can result from the degradation of
fungicides like ethylenebisdithiocarbamate and tetramethylthiuramdisulphide (Schmitt, 1987;
Rauhut, 1993). Additionally, it was postulated that COS can be formed by the reaction of SO2
and CO2 (Shaw & Nagy, 1981). Table 2-5 lists the sulphur containing compounds, including
thiols, commonly found in wine (Bell & Henschke, 2005).

46
Table 2-5 The sulphur containing compounds, including thiols, commonly found in wine
S-compounds
Concentration in
wine (g L-1
)
Aroma threshold
(g L-1
)
Aroma descriptor
Carbonyl sulphide Trace - 2.4 - Odourless
Carbon disulphide Trace - 18 > 37.8 rubber, chokingly repulsive, cabbage
Diethyl sulphide 4.1 - 31.8 0.93 cooked vegetables, onion, garlic
Diethyl disulphide Trace - 85 4.3 garlic, burnt rubber
Dimethyl sulphide Trace - 474 25 asparagus, corn, molasses
low concentration: quince, truffle
Dimethyl disulphide Trace - 85 20 - 45 cooked cabbage, intense onion
Hydrogen sulphide Trace - 80 10 - 80 rotten egg, yeast flavour
Benzothiazole 11 50 Rubber
Ethanethiol 1.9 -18.7 1.1 onion, rubber, natural gas
2-Furanmethanethiol 0 - 350 ng L-1
1 ng L-1
roasted coffee, burnt rubber
Methanethiol Trace - 16 0.02 - 0.3 cooked cabbage, onion,
putrefaction
4-Methylthiazole Trace - 11 55 green hazelnut
3-Methylthio-1-propanol 140 - 5000 500 cauliflower, cabbage, potato
4-Methyl-4-sulphanlypentan-
2-one (4MSP)
Trace - 40 ng L-1
0.8 - 3 cat urine, box tree, blackcurrant,
broom, passion fruit
4-Methyl-4-sulphanlypentan-
2-ol (4MSPOH)
18 - 22 ng L-1
55 ng L-1
citric, passion fruit, box tree,
broom
Acetic acid 3-sulphanylhexyl
-ester (3SHA)
1 - 724 ng L-1
4 ng L-1
passion fruit, grape fruit, citrus
zest. Riesling-type note
3-Sulphanylhexanol (3SH) 50 -12822 ng L-1
60 ng L-1
passion fruit, grape fruit
3-Sulphanyl-2-methylpropan-
1-ol
250 - 10000 ng L-1
3000 ng L-1
fruity, animal, sweat, broth
3-Sulphanyl-3-methylbutan-
1-ol
20 - 150 ng L-1
1500 ng L-1
cooked leeks
Thiophene-2-thiol 0 -11 0.8 burnt rubber, roasted coffee
Source: Mestres et al. (2000), Bell & Henschke (2005), Dubourdieu et al. (2006) and
Ribéreau-Gayon et al. (2006 b)
In addition, methionine can be metabolized by yeast through the Ehrlich pathway to form
sulphur-containing fusel alcohol, methionol or 3-methylthio-1-propanol, which has
―cauliflower‖ and ―cabbage‖ odours. It was detected in wines and range from 140-5000 µg L-1,
it and has a threshold of 500 µg L-1 in wines (Rauhut, 1996; Mestres et al., 2000; Bell &
Henschke, 2005). This compound can be converted further to 3-methylthiopropyl acetic acid

47
ester, which has a ―mushroom‖ or ―garlic‖ odour. It has also been proposed that 4-methylthio-
1-butanol with an ―onion‖ or ―garlic‖ odour and 2-mercapto-1-ethanol with a ―poultry‖ or
―farmyard‖ odour can be biosynthesised by yeast in the same way by using the amino acids
homocysteine and cysteine, respectively (Mestres et al., 2000). Some observations suggest
that concentrations in wine may be influenced by the level of methionone as well as the
assimilable nitrogen concentrations in the must (Rauhut, 1996; Moreira et al., 2002; Bell &
Henschke, 2005).
2.5 Passion fruit (Passiflora edulis Sims)
Passion fruit, Passiflora, is the most important genus in the family Passifloriaceae and it is
distributed within most of the tropical and sub-tropical regions of the world. Approximately
460 species of the genus Passiflora have already been described. From these, about 90 %
have originated from America and close to 150 species occur in Brazil and Ecuador
(Crochemore et al., 2003). The economical importance of some species is associated to the
quality of the fruits for consumption and medicinal properties (De Neira, 2003).
In the last ten years, there has been a great increase in the international consumption of
tropical fruits. According to FAO, the market for tropical fruit juices, including passion fruit, is
about US$ 1 billion. This consumption reflects a growing concern with more natural and
healthy nutrition mainly in Europe and the United States (Sandi et al., 2004). Hawaii, Brazil,
Colombia, Ecuador, Peru, Australia, Fiji Islands, Kenya, South Africa, Papua New Guinea,
New Zealand, Venezuela, India, Sri Lanka, Philippines, Taiwan, Brazil, Colombia, Ecuador
and Peru were the largest producers that supply the major part of the world market, while the
United States and European countries are the main importers, with a growing demand for the
products (Loeillet, 1995; Somogyi et al., 1996). There are two important commercial varieties
of Passiflora edulis Sims, e.g. purple passion fruit (Passiflora edulis) and yellow passion fruit
or maracuja (Passiflora edulis Sims f. flavicarpa Degner). Because of its more desirable
flavour and because it is sweeter, the former is preferred for consumption as fresh juice. The
latter has larger fruits, higher juice yield and more acidity, therefore it is considered better
suited for processing and is one of the most popular and best known tropical fruits (Martin &
Nakasone, 1970; Morton, 1987; Bora & Narain, 1997; Chassagne et al., 1999; Deliza et al.,
2005).
Yellow passion fruit (YPF) has round to oval shape, yellow skin at maturity and produces
generous amounts of juice or pulp (Muller et al., 1964). It is known for its natural attractive
colouring, unique flavour properties and medicinal purposes. It has not only high amounts of
vitamin A, vitamin C, niacin, riboflavin, potassium, dietary fibre, carotenoids and polyphenolic
compounds (Morton, 1987; De Neira, 2003), but also is the best tropical fruit having a floral,
fruity and estery aroma with an exotic tropical sulphury note (Engel & Tressl, 1991; Werkhoff

48
et al., 1998; Chassagne et al., 1999; Engel, 1999; Tominaga & Dubourdieu, 2000). It
contains also several non-nutritive phytochemicals that make it a tasteful and healthy
addition to the diet. However, its high acidity, especially yellow passion fruit, limits its use as
an ingredient in the formulation of various preparations such as beverages, ice cream,
marmalade and cocktails. Passion fruit can be recommended as raw material for production
of dessert and good quality fruit wine (Czyhrinciw, 1966; Fang et al., 1986; Somogyi et al.,
1996; Deliza et al., 2005; Srisamatthakarn et al., 2010). In addition, it has been used widely
in folk medicine in South America to treat anxiety, insomnia, asthma, bronchitis and urinary
infection (Zibadi & Watson, 2004)
Passion fruit juice is a high acidic food, pH 2.8-4 and total acidity 43-51.1 g L-1, which
contains the predominance of two organic acids, citric acid (46.3-55 g L-1) and malic acid
(6.5-10.5 g L-1). It also has total soluble solid 13-14.4 oBrix and contains about 145-152 g L-1
sugar, including glucose, fructose and sucrose (Jagtiani et al., 1988; Srisamatthakarn et al.,
2010; www.thainutri.com/juicelineframe.htm, 2009). Passion fruit juice provides a good
source of various nutrients (Table 2-6) such as vitamin C (182 mg Kg-1 of edible portion),
vitamin A (7000-24100 IU Kg-1 of edible portion) and potassium (2780 mg Kg-1 of edible
portion) (De Neira, 2003; www.hort.purdue.edu/newcrop/morton/passionfruit.html#Storage,
2009). Thirteen different carotenoids In passion fruit have been identified, e.g. phytoene,
phytofluene, δ-carotene (principal carotenoid), neurosporene, β-carotene, lycopene,
prolycopene, monoepoxy-β-carotene, β-cryptoxanthin, β-citraurin, antheraxanthin,
violaxanthin, and neoxanthin (Pruthi & Lal, 1958; Cecchi & Rodriguez-Amaya, 1981; Gross,
1987; Mercadante et al., 1998). Other non-nutritive phytochemicals found in passion fruit are
polyphenolic compounds, which have been found to have antioxidant activity (Salah et al.,
1995; Rice-Evans & Miller, 1996) as well as anticancer properties (Yoshida et al., 1992;
Kang & Liang, 1997), however, the flavonoids have not been reported (Talcott et al., 2003).
The total carotenoid concentration of passion fruit is 932 mg L-1, of which only three
individual carotenoids, α-carotene, β-carotene as well as β-cryptoxanthin (350, 5250
and 460 g Kg-1 of edible portion, respectively) had been quantified (De Neira, 2003). Other
phytochemicals conclusively identified include aroma compounds such as volatile thiols,
terpenes, fatty acid esters, alcohols, and various other aromatics (Engel and Tressl, 1991;
Werkhoff et al., 1998; Chassagne et al., 1999; Engel, 1999; Tominaga & Dubourdieu, 2000).

49
Table 2-6 The chemical compositions of the yellow passion fruit (per 100 g of edible portion)
Chemical compounds Concentration range (mg)
Protein 670
Total fat 180
Carbohydrate 14450
Sugar (g L-1
) 145 - 152
Total fibre 0.02
Calcium 4
Iron 0.36
Magnesium 17
Phosphorus 25
Potassium 278
Sodium 6
Zinc 0.06
Copper 0.05
Selenium 0.10
Vitamin C 18.20
Thiamine n.d.
Riboflavin 0.10
Niacin 2.24
Food - Folate (g) 8
Vitamin B6 0.06
Vitamin B12 (g) n.d.
Vitamin A (IU) 700 - 2410
Total carotenoids (mg L-1
) 932
-Carotene (g) 35
-Carotene (g) 525
Vitamin E n.d.
Vitamin K (g) n.d.
Saturated fat 10
Monounsaturated fat 20
Polyunsaturated fat 110
Cholesterol n.d.
Citric acid (g L-1
) 46.3 - 55.0
Malic acid (g L-1
) 6.5 - 10.5
n.d.: not detectable
Source: Jagtiani et al. (1988), De Neira (2003)
www.nutritionanalyser.com/food_composition/?fid=09233

50
Passion fruit is loaded with amino acids such as arginine, aspartic acid, glycine, leucine,
lysine, proline and threonine. Tyrosine and valine are all found in varying amounts in the
different varieties of the passion fruit (www.acai-natural-pain-free-health.com/passion-
constituents.html, 2010). It has been determined that passion fruit contains various free
amino acids (both L-amino acid and D-amino acid) as shown in Table 2-7 and it has been
reported that yellow passion fruit contained high concentrations of glutamine, glutamic acid,
aspartic acid, arginine, aspartic acid, glycine, serine and alanine (Brückner & Westhauser,
2003).
Table 2-7 Quantities of amino acid (AA) enantiomers in yellow passion fruit
Amino acids L-amino acid (mol L-1) D-amino acid (mol L-1)
Alanine 975 12.0
Arginine 752 5.9
Asparagine 195 n.d.
Aspartic acid 3,065 16.2
Glutamine 4,336 n.d.
Glutamic acid 3,558 17.1
Glycine 1,317 n.d.
Histidine 480 n.d.
Isoleucine 346 n.d.
Leucine 186 n.d.
Lysine 356 n.d.
Methionine 113 n.d.
Phenylalanine 344 n.d.
Serine 2,962 17.1
Threonine 297 n.d.
Tryptophan 92 n.d.
Tyrosine 142 n.d.
Valine 456 n.d.
n.d.: not detectable
Source: Brückner & Westhauser (2003)
The powerful volatile constituents of passion fruit have been investigated by several research
groups over the past decades. They have resulted in the characterization of a broad
spectrum of volatile constituents in comprehensive reviews (Pruthi & Lal, 1959; Winter & Klöti,
1972; Casimir et al., 1981; Whitfield & Last, 1986; Shibamoto & Tang, 1990; Werkhoff et al.,
1998). To date, more than 200 components have been identified as components of the

51
flavour in passion fruit like esters; terpenes and norisoprenoids, which are present in both
free and glycosylated form; glycosides of benzyl alcohol; 3-methyl-2-buten-1-ol, and
mandelonitrile (Parliament, 1972; Casimir et al., 1981; Chen et al., 1982; Whitfield & Last,
1986; Shibamoto & Tang, 1990; Chassagne et al., 1996 a, 1996 b, 1999; Winterhalter, 1990;
Engel & Tressl, 1983; Brat et al., 2000). Jordán et al. (2000) investigated the aromatic profile
of yellow passion fruit aqueous essence. Recently, Jordán et al. (2002) reported that the
most abundant compounds in yellow passion fruit juice and aqueous essence are linalool,
fatty acid ethyl ester (butanoic, octanol and hexanoic acid ethyl ester). These authors
reported a total of 62 compounds and some most abundant compounds were identified like
linalool, octanol, butanoic and hexanoic acid ethyl ester, 3-methyl-2-butanone; lactic acid
ethyl ester, malonic acid diethyl ester, 3-penten-2-ol, 1,3-dimethyl benzene, and hexanoic
acid 2-methylbutyl ester. More recently, the enantiomeric compositions of the acetic,
butanoic, hexanoic and octanoic acid esters of the secondary alcohols 2-pentanol, 2-
heptanol, and 2-nonanol were identified in yellow passion fruits (Passiflora edulis f. flavicarpa)
and the preparation of these ester via lipase-catalyzed esterification was also investigated
(Strohalm et al., 2007, 2010).
Sulphur containing compounds including volatile thiols also play important roles in the flavour
of yellow passion fruit. These sulphur-containing components possess high odour intensities
and low threshold values. To date, the presence of 47 sulphur-containing components in this
fruit has been reported (Werkhoff et al., 1998; Engel, 1999). The 3-(methylthio)hexanol and a
mixture of cis- and trans-2-methyl-4-propyl-1,3-oxathiane (MPO) were the first
representatives described as key odorants in the aroma of the yellow passion fruit (Winter et
al., 1976). Several approaches have been described to synthesize the optical isomers of 3-
(methylthio)hexanol and MPO and to describe their sensory properties in this fruit (Heusinger
& Mosandl, 1984; Mosandl & Heusinger, 1985; Singer et al., 1986) and it could be
demonstrated that odour quality of YPF is strongly influenced by chirality. Heusinger &
Mosandl (1984) investigated that only (S)-3-(methylthio)hexanol has an exotic, fruity odour,
while the (R)-enantiomer is described as herbaceous and weak. Later, Engel & Tressl (1991)
described for the first time the presence of 3SH and the esters of acetic, butanoic, and
hexanoic acid of both 3SH and 3-(methylthio) hexanol. Additionally, these compounds have
also been expected to be key aromas of the yellow variety.
In 1994, significant differences were revealed for the enantiomers of the sulphur-containing
esters (acetic, butanoic and hexanoic acid esters) of 3SH and 3-(methylthio)hexanol, only the
(R)-configurated esters of 3SH exhibit the tropical fruit notes of yellow passion fruit, whereas
for 3-(methylthio)hexanol the (S)-esters are more intensive with pronounced sulphury
character (Weber et al., 1994, 1995). In addition, acetic acid 3-sulphanylhexyl ester (3SHA)
and butanoic acid 3-sulphanylhexyl ester (3SBA) were shown to be present in yellow passion

52
fruits in almost optically pure form (> 95 % (S)-ester) (Weber et al., 1995). Recently, the other
35 sulphur-containing flavour components have been identified in yellow passion fruits for the
first time, such as acetic acid 3-(methylthio)propyl (acetic acid methionyl ester, which
contributes to herbaceous odour impressions and a typical vegetable-like character),
butanoic and hexanoic acid methionyl ester (odour threshold 10−20 and 500 g L-1 in water,
respectively), methyl and ethyl ester of 3-(methylthio)propionic acid (odour threshold 150 and
300 g L-1 in water, respectively) and the whole series of propyl, butyl, isobutyl, sec-butyl,
pentyl, 2-methylbutyl, 3-methylbutyl, hexyl, and (Z)-3-hexenyl esters of 3-(methylthio)-
propionic acid (Werkhoff et al., 1998). In general, the 3-(methylthio)propionic acid esters
have a sulphury, vegetable-like odour, and only hexyl 3-(methylthio)propionic ester with its
fruity and geranium-like odour note may contribute to the overall olfactory impression. In
addition, threshold values of 3-(methylthio) esters of propanoic acid in water are significantly
higher compared with other sulphur compounds. For example, butyl 3-(methylthio)propionic
acid ester has a taste threshold in water of 1−2 mg L-1. In 2000, 3MSB and acetic acid ester
of 3MSB (3SMBA) as well as the precursor of 3SH as trimethylsilylated S-3-(hexan-1-ol)-L-
cysteine have been identified in passion fruit for the first time (Tominaga & Dubourdieu,
2000). This research also suggested that 3SH in passion fruit juices is present in both free
and conjugate form, additionally both 3SH and 3MSB may be produced in vitro from
nonvolatile extracts of this fruit by the enzymatic action of a cell-free extract of Eubacterium
limosum, which has a β-lyase activity on S-cysteine conjugates. More recently, a new simple
route to (R)-3-sulphanylhexan-1-ol and its immediate derivative (1)-cis-2-methyl-4-propyl-1,3-
oxathiane, which are the main component procedure responsible of the passion fruit aroma,
has been investigated (Scafato et al., 2009).
It has been reported that a dry table wine prepared from yellow passion fruit contained
various volatile substances such as isobutyl alcohol, isoamyl alcohol, active amyl alcohol,
acetaldehyde, acetic acid ethyl ester and hexanoic acid ethyl ester, etc. (Muller et al., 1964).
The use of different Saccharomyces yeast strains for passion fruit wine fermentation has
been shown to result in wines with different fermentation kinetics and the formation of
secondary metabolites, such as SO2-binding compounds, some organic acids, acetic acid
esters, fatty acid ethyl esters and higher alcohols (Srisamatthakarn et al., 2010) However,
there is little research work on passion fruit wine production as well as improvement of its
quality, especially the compounds responsible for the typical passion fruit wine aroma still
need to be investigated. In addition, only little information is available on the improvement of
passion fruit wine quality by optimal choice of yeasts as well as nutrient supplementation,
additionally, nearly no information is available to optimize the release and preservation of
volatile flavours in passion fruit wine during alcoholic fermentation.

53
3. MATERIALS AND METHODS
Raw materials, yeast strains, yeast nutrients, media, chemical reagents, enzymes, devices
and equipments applied in this study are listed in this section. Yeast cultivation and
enumeration, analysis methods, and experimental designs are described in the following text.
3.1 Raw materials
3.1.1 Grape musts
White grape of Scheurebe or Seeding 88 (Vitis vinifera L. cultivar Scheurebe) and Sauvignon
blanc (Vitis vinifera L. cultivar Sauvignon blanc) were used in this study. It was long assumed
that Scheurebe was V. vinifera cultivar Silvaner x V. vinifera cultivar Riesling, but DNA
analysis in the late 1990s ruled out Silvaner as a parent, while confirming Riesling as the
father. It is widely grown in the Palatinate, Rhein-Hesse and Nahe regions of Germany
(www.vivc.de/datasheet/dataResult.php?data=10818, 2010).
Fresh Scheurebe and Sauvignon blanc grape juices were obtained from the Department of
Grapevine Breeding and Grafting, Geisenheim Research Center, Geisenheim, Germany
from 2007-2009 harvest seasons.
3.1.2 Passion fruit (Passiflora edulis Sims) puree
The frozen YPF puree employed for this study is the hybrid breeding variety of Passiflora
edulis Sims f. flavicarpa Degner. It was obtained from Thai Nutri-Juice Co., Ltd., Thailand
and kept at -18 oC until use.
3.2 Yeast strains employed for wine making in industry
Eighteen commercial Saccharomyces yeast strains were used in this study (Table 3-1). They
were obtained from Lallemand, Danstar Ferment AG, Zug, Switzerland; DSM Food
Specialities, Delft, The Netherlands; Laffort Oenologie, Bordeaux, France; Erbslöh
Geisenheim AG and La Littorale - Groupe Erbslöh, Geisenheim, Germany; Anchor-Bio
Technologies, Eppindust, South Africa and AB Mauri, Mauri Yeast Australia, Toowoomba,
Australia. The enological properties of the commercial yeast strains used in the study are
shown in Table 3-2.

54
Table 3-1 List of the commercial yeast strains used in the study
Strains Code*
Saccharomyces cerevisiae (var. bayanus), Lallemand – Lalvin EC-1118
(Prise de Mousse)TM
EC1118
Saccharomyces cerevisiae, Lallemand-Enoferm Simi WhiteTM Simi White
Saccharomyces cerevisiae (var. bayanus), Lallemand-Enoferm QA23TM
(YSEO® process)
QA23
Saccharomyces cerevisiae, Lallemand–Uvaferm SVGTM SVG
Saccharomyces cerevisiae (hybrid), Lallemand–Cross Evolution Cross Evolution
Saccharomyces cerevisiae, DSM-Collection Cépage Sauvignon® Sauvignon
Saccharomyces cerevisiae, DSM–Fermicru® 4F9 4F9
Saccharomyces cerevisiae, DSM–Fermicru® LVCB LVCB
Saccharomyces cerevisiae, Laffort–Zymaflore VL3 VL3
Saccharomyces cerevisiae (breeding), Laffort–Zymaflore X5 X5
Saccharomyces cerevisiae (breeding), Laffort–Zymaflore X16 X16
Saccharomyces cerevisiae (hybrid), Anchor-VIN7 VIN7
Saccharomyces cerevisiae (hybrid), Anchor-VIN13 VIN13
Saccharomyces spp. (blend), Anchor–Alchemy I Alchemy I
Saccharomyces spp. (blend), Anchor–Alchemy II Alchemy II
Saccharomyces cerevisiae (var. bayanus), MaurivinTM AWRI R2 AWRI R2
Saccharomyces cerevisiae (var. bayanus), La Littorale-LittoLevure
Sauvignon
LittoLevure
Saccharomyces cerevisiae (var. bayanus), Erbslöh-Oenoferm® Freddo Freddo
* Character abbreviation used throughout the text.

55
Table 3-2 Enological properties of eighteen commercial yeast strains used in the study
Yeasts Temperature (oC)
Nitrogen requirement
Ethanol tolerance (% v/v)
Volatile acidity (g L
-1)
Glycerol (g L
-1)
H2S
(g L-1
)
SO2 (mg L
-1)
References
EC1118 15 – 25 low 18 low to average - low average www.lalvinyeast.com/images/library/EC1118_Yeast.pdf
Simi White 15 – 30 15 - - low www.lallemandwine.us/products/yeast_chart.php
QA23 15 – 32 low 16 < 0.2 low very low low www.lallemandwine.com/catalog/img/catalog/description_activity_image_1209025085_QA23 eng.pdf
SVG 16 – 25 medium 15 low low low www.lallemandwine.com/catalog/products/view/61
Cross Evolution
10 – 20 low 16 - - - - www.lallemandwine.us/products/yeast_chart.php
Sauvignon 12 – 25 - 15 < 0.2 6 - 8 - medium www.dsm.com/en_US/downloads/oenology/CCSauvignon.pdf
4F9 15 – 25 - 15.5 < 0.15 5 - 7 low none www.dsm.com/en_US/downloads/oenology/Fermicru_4F9.pdf
LVCB 12 – 20 - 15 < 0.2 5 - 7 low none www.dsm.com/en_US/downloads/oenology/FermicruLVCB.pdf
VL3 15 – 21 high 14.5 low - low - www.laffort.com/en/quality-management/74
X5 13 – 20 medium 16 low - low - www.laffort.com/en/products/zymaflore-yeasts/70
X16 12 – 20 low 16 low - low - www.laffort.com/en/products/zymaflore-yeasts/71
VIN7 12 – 20 low 15 0.4 – 0.8 5 -7 - very low www.anchorwineyeast.com/envin7.html
VIN13 15 – 20 low 16.5 < 0.3 5 -7 - very low www.anchorwineyeast.com/envin13.html
Alchemy I 13 – 20 low to average
15.5 < 0.5 5 -7 - very low www.anchorwineyeast.com/enalch1.html
Alchemy II 13 – 20 average 15.5 < 0.5 5 -7 - very low www.anchorwineyeast.com/enalch2.html
AWRI R2 11 – 25 medium 15 < 0.3 - www.maurivinyeast.com/media/35.pdf
LittoLevure 13 – 21 - 15 < 0.25 5 - 8 - low www.lalittorale.com/en/oehefe_en.php
Freddo 13 – 17 low 15 - - - low www.erbsloeh.com/en/datenblatt/Saft/Oenoferm_Freddo.pdf

56
Yeast culture rehydration and preparation
Active dried yeasts were rehydrated in tap water (1 g per 5-10 ml water) at approximately 35-
40 oC for 10-30 min prior to inoculation at 0.02-0.30 % to the juice following the
recommendations of the manufacturer indicated on the package.
3.3 Yeast nutrients
Eight commercial yeast nutrients were used in this study (Table 3-3). They were obtained
from Lallemand, Danstar Ferment AG, Zug, Switzerland; Laffort Oenologie, Bordeaux,
France and Erbslöh Geisenheim AG, Geisenheim, Germany.
Table 3-3 List of the commercial yeast nutrients used in the study
Yeast nutrient Code*
Natural inactivated yeast with high glutathione, Lallemand-OptiWhite® OptiWhite
Blend of inactivated yeast fractions, Lallemand-Fermaid® O Fermaid O
Blend of diammonium hydrogen phosphate, thiamine, yeast cell walls and
ammonium sulphate, Lallemand-Fermaid® E blanc
Fermaid E
Blend of inactivated yeast and yeast cell walls, Laffort-Superstart® Superstart
Diammonium hydrogen phosphate [(NH4)2HPO4], Erbslöh-Vitamon® A DAP
Thiamine, Erbslöh-Vitamon® B Thiamine
Blend of diammonium hydrogen phosphate and thiamine, Erbslöh-
Vitamon® Combi
VCombi
Blend of diammonium hydrogen phosphate, thiamine, yeast cell walls and
yeast-stimulating cell parts, Erbslöh-Vitamon® Ultra
VUltra
* Character abbreviation used throughout the text.
Nutrient preparation
Each nutrient was dissolved in water (10-20 times) according to the concentration of each
experimental plan prior to its addition into juice. Exceptionally, Superstart was dissolved in
tap water (1 g per 15 ml water) at approximately 35-40 oC following the recommendations of
the manufacturer indicated on the package prior to its addition into a rehydrated yeast
suspension prepared before.

57
3.4 Chemical reagents and enzymes
Chemical reagents
Ammonium sulphate, ammonium, carbon disulphide (CS2), copper sulphate pentahydrate,
dihydrogen phosphate, disodium hydrogen phosphate dodecahydrate, ethylene diamine
tetraacetic acid disodium salt dihydrate (EDTA-Na2H2.2H2O), dichoromethane, glucose,
glycerine, HEPES (4-(2-hydroxyethyl)-1-piperazineethanesulfonic acid), hydrochloric acid, L-
cysteine hydrochloride anhydrous, magnesium sulphate heptahydrate, methylene blue,
potassium dihydrogen phosphate, potassium metabisulphite, sodium hydrogen carbonate,
sodium potassium tartrate, sodium thiosulphate, starch soluble, sulphuric acid and
triethanolamine hydrochloride were obtained from Merck KGaA, Darmstadt, Germany. Citric
acid monohydrate, dithiothreitol, glycine, glutamate dehydrogenase, dimethyl dicarbonate
(DMDC), 2-oxoglutaric acid disodium salt, phosphooenopyruvic acid monosodium salt
monohydrate and sodium -hydroxymercuribenzoate (-HMB) were from Sigma-Aldrich
Chemie GmbH, Schnelldorf, Germany. Acetic acid ethyl ester, acetic acid 2-phenyl ethyl
ester, benzene acetic acid ethyl ester, butyric acid ethyl ester, cumene, decanoic acid,
ethanethiol (EtSH), decanoic acid ethyl ester, hexanoic acid hexyl ester, 1-hexanol, lactic
acid ethyl ester, linalool, 2-methyl butanol, 3-methyl butanol, octanoic acid, 2-pheyl ethanol,
propionic acid ethyl ester, sodium hydroxide, sodium sulphate monohydrate, succinic acid
diethyl ester, α-terpineol, MeSAc, tran/cis-linalool oxide and BHA (3-tert-butyl-4-
hydroxyanisole) were from Fluka Chemie GmbH, Buchs, Switzerland.
2,6-Dimethyl-5-hepten-2-ol (DMH), D-fructose, ethyl alcohol (p.a.), methyl alcohol, sodium
acetate and Tris-(hydroxymethyl) aminomethane were obtained from Carl Roth GmbH,
Karlsruhe, Germany. Glycylglycine was from AppliChem GmbH, Darmstadt, Germany.
Potassium iodide and i-butanol were obtained from Riedel-de Haën, Sigma-Aldrich
Laborchemikalien GmbH, Seelze, Germany. Iso-butyric acid ethyl ester, acetic acid 3-methyl
butyl ester, acetic acid 2-methyl butyl ester, DEDS, ethyl methyl sulphide (EMS), hexanoic
acid ethyl ester, methanethiol sodium salt (MeSH), octanoic acid ethyl ester and thioacetic
acid S-propyl ester (PrSAc) were obtained from Aldrich Chemical Company Ltd., Gillingham,
England. DMDS, DMS, DMTS, and 3SH were obtained from Acros Organics, Geel, Belgium.
EtSAc was from Alfa Aesar GmbH & Co KG, Karlsruhe, Germany. Methyl isopropyl sulphide
was obtained from Alfa/Chemie Inc., Delaware, U.S.A. Butylmethyl sulphide (MBS), and
methyl-isopropyl sulphide (i-MPS) were obtained from Lancaster, Walkerburn, England.
3SHA, 4-methoxy-2-methyl-2-sulphanylbutane (4,2,2MSB) and 4MSP were obtained from
CHEMOS GmbH, Regenstauf, Germany.

58
Enzymes and media
Arginase, lactate dehydrogenase and pyruvate kinase were obtained from Fluka, Sigma-
Aldrich Chemie GmbH, Taufkirchen, Germany. Adenosine tripohosphate, glutamate
dehydrogenase, glycerokinase, L-lactate dehydrogenase, nicotinamide adenine dinucleotide
and nicotinamide adenine dinucleotide phosphate disodium salt were obtained from Roche
Diagnostics GmbH, Penzberg, Germany. Aldehyde dehydrogenase was obtained from VWR
International GmbH, Darmstadt, Germany. Urease was obtained from Serva Electrophoresis
GmbH, Heidelberg, Germany.
3.5 Fermentation kinetics
Fermentation kinetic was obtained by monitoring carbon dioxide production during yeast
growth. The amount of carbon dioxide released was determined by weight loss every 1-2
days.
3.6 Analytical methods
The analytical analyses which were used in the study are described as follows.
3.6.1 Physico-chemical analytical methods
pH: The pH was analysed by pH meter (pH 526 Multical®, Wissenschaftlich-Technische
Werkstätten, Weilheim, Germany).
Physico-chemical analytical method with FTIR spectrophotometry: Ethanol, reducing
sugar, glycerol, tartaric acid, malic acid, lactic acid, total acidity, volatile acidity and pH were
analyzed by FTIR spectrometry as described in Baumgartner et al. (2001) and Patz et al.
(1999). They were performed at the Department of Wine Analysis and Beverage Research,
Geisenheim Research Center, Germany.
Sugar: Residual sugar, reducing sugar and inverted sugar (as glucose) were analysed by
the Rebelein method according to Iland et al. (1993).
Sulphur dioxide: Free and total sulphur dioxide in wine were determined by the Ripper
titrametric method according to Zoecklein et al. (1999) and by FIAstarTM 5000 following the
instructions of the manufacturer. These analysis were performed at the Department of Wine
Analysis and Beverage Research, Geisenheim Research Center, Germany.

59
Amino nitrogen: A modified procedure from Wylie and Johnson (1961) was used to quantify
free alpha amino nitrogen (FAN, as mg L-1 glycine), which is assimilable nitrogen. NOPA is
an o-phthaldialdehyde/N-acetly-L-cysteine spectrometric assay described by Dukes & Butzke
(1998) and used to detect free α-amino nitrogen (as mg L-1 isoleucine).
Amino acids: They were determined by the Amino Acid Analyzer S433 (Sykam GmbH,
Eresing, Germany) following the instructions of the manufacturer and were performed at the
Department of Soil Science, Geisenheim Research Center, Germany.
Metabolic products and amino nitrogen by enzymatic method: Acetaldehyde, glycerol,
pyruvate, α-ketoglutarate and Ferm-N value (yeast-utilisable/assimilable nitrogen derived
from amino acids) were determined enzymatically by an UV/VS spectrometer Lambda 2
(Perkin Elmer GmbH, Überlingen, Germany) and wavelength at 340 nm equipped with a
refrigerated/heating circulator, Model F25-ME (JULABO Labortechnik GmbH, Seelbach,
Germany) and controlled at 25 oC isothermic condition according to instructions of
Boehringer Mannheim GmbH, Germany (1998).
3.6.2 Organic acids using a high performance liquid chromatographic method
Samples were centrifuged for 3 min at 1300 rpm and then a 5 μL sample was injected into
the high performance liquid chromatography (HPLC). In some cases, it was necessary to
dilute the samples 1:2 or 1:5 with ultrapure water (MilliQ, Millipore). Organic acids were
determined by Hewlett Packard (HP) Series 1100 HPLC (Agilent Technologies) equipped
with a multiwavelength detector (UV/Visible) according to a modified procedure from
Schneider et al. (1987). Organic acids were resolved on an Allure® Organic Acids column
(250 mm x 4.6 mm i.d., 5 μm particle sizes) with a security guard column cartridge C18 (4 x
3.0 mm, Fa. Phenomenex). The column was operated at a column temperature of 46 °C
with diluted sulphuric acid (0.0139 % in ultrapure water) or 0.5 % ethanol (v/v) as eluent at
the flow rate of 0.6 ml min-1. Eluting compounds were detected by UV absorbance at 210 nm.

60
3.6.3 Gas chromatographic methods
3.6.3.1 Analysis of esters, higher alcohols, fatty acids and monoterpenes
Samples were extracted according to the 'Kaltron' method by liquid-liquid extraction with
1,1,2-trifluorotrichloroethane according to a modified procedure from Rapp et al.
(1994). The 10 ml samples were extracted by shaking for 20 min with an addition of 2 g
NaCl for better extraction, 1188 g L-1 2,6-dimethyl-5-hepten-2-ol as quantification internal
standard, 112 g L-1 isopropylbenzene as internal standard control and 100 l 1,1,2-
trifluorotrichloroethan (Freon 113 or Kaltron) as extracting solution. The mixture was then
centrifuged for 8 min at 3000 rpm, dried over anhydrous sodium sulphate (50 mg on glass
wool) and the supernatant extract was injected into the gas chromatography/mass
spectrophotometry (GC-MS).
Aromatic compounds (esters, higher alcohols, fatty acids and terpenes) were analysed by
gas chromatograph (Hewlett-Packard, HP 5890 Series II) equipped with a cooled injection
system CIS-3 (Gerstel GmbH, Mülheim an der Ruhr, Germany) and detected by HP 5972
mass selective detector (MSD) operating in electron impact mode. The chromatographic
parameters for the analysis of aroma compounds by GC-MS are summarized in Table 3-4.
3.6.3.2 Low boiling point of volatile sulphur containing compounds
The wine samples are stored at 4 oC before sample preparation. The GC-vials were flushed
with argon gas and then cold wine samples were pipetted into the GC-vials
containing 1.7 g NaCl. Regular 10 ml GC-vials filled with 5 ml sample were used as
headspace sampling vials. Then, 5 l 2,6-di-tert-butyl-4-methyl-phenol (4 mg L-1) as
antioxidant, 20 l ethylenediamine tetraacetic acid (0.2 g L-1) and 10 l propanal (500 mg L-1)
as SO2-binding compounds and 10 l internal standard (6 g S L-1 i-MPS and 6 g S L-1 BMS)
were quickly added into the samples and then analysed by gas chromatography-pulse flame
photometric detector (GC-PFPD).
Low volatile sulphur compounds were analysed by an HP 6890 gas chromatograph equipped
with automatic headspace sampling (Multipurpose Sampler MPS 2) and a cooled injection
system CIS-4 (Gerstel GmbH, Mülheim an der Ruhr, Germany) then detected by an OI 5380
pulse flame photometric detector (PFPD) (OI Analytical, USA) according to Rauhut et al.
(2005 a, 2005 b). The chromatographic parameters for the analysis of low boiling point
volatile sulphur compounds by GC-PFPD are summarized in Table 3-5.
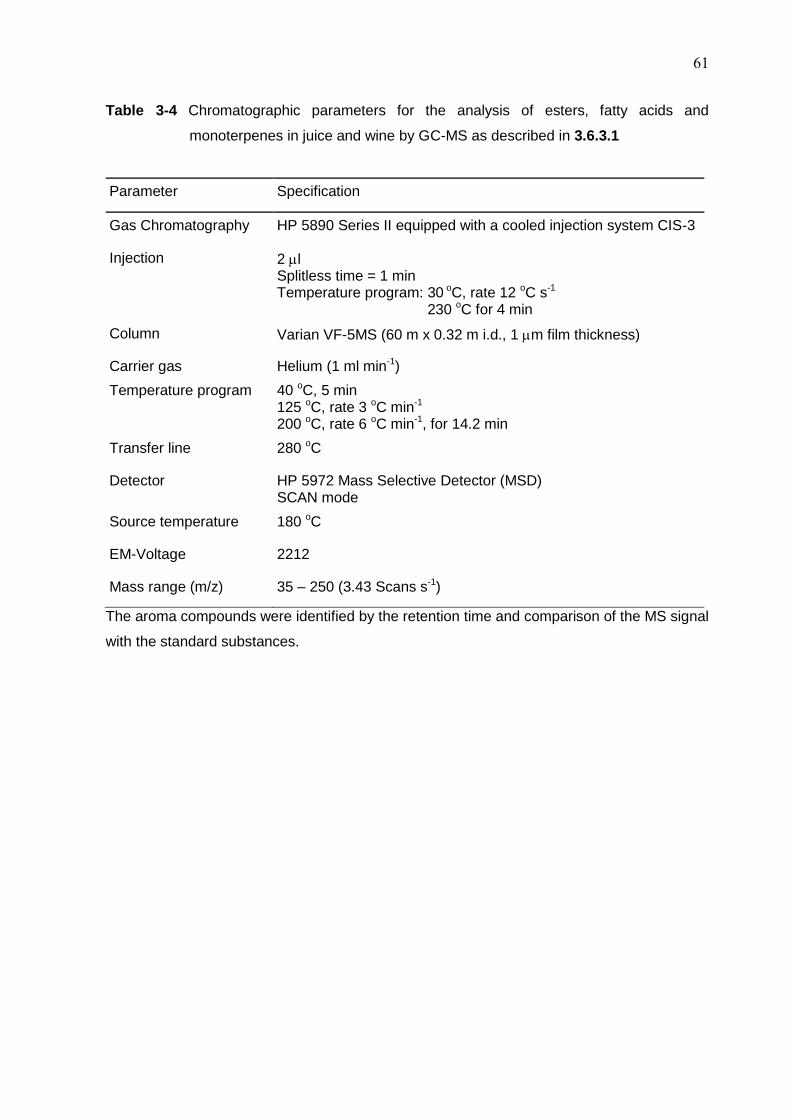
61
Table 3-4 Chromatographic parameters for the analysis of esters, fatty acids and
monoterpenes in juice and wine by GC-MS as described in 3.6.3.1
Parameter Specification
Gas Chromatography HP 5890 Series II equipped with a cooled injection system CIS-3
Injection 2 l Splitless time = 1 min Temperature program: 30 oC, rate 12 oC s-1 230 oC for 4 min
Column Varian VF-5MS (60 m x 0.32 m i.d., 1 m film thickness)
Carrier gas Helium (1 ml min-1)
Temperature program 40 oC, 5 min 125 oC, rate 3 oC min-1 200 oC, rate 6 oC min-1, for 14.2 min
Transfer line 280 oC
Detector HP 5972 Mass Selective Detector (MSD) SCAN mode
Source temperature 180 oC
EM-Voltage 2212
Mass range (m/z) 35 – 250 (3.43 Scans s-1)
The aroma compounds were identified by the retention time and comparison of the MS signal
with the standard substances.

62
Table 3-5 Chromatographic parameters for the analysis of low boiling point sulphur
containing compounds in wine samples by GC-PFPD as described in 3.6.3.2
Parameter Specification
Gas Chromatography HP 6890 gas chromatograph equipped with headspace sampler (Multipurpose Sampler MPS 2) and a cooled injection system CIS-4 (Inlet liner: w/wool deactivated)
Cooled injection system Temperature program: -100 oC, rate 12 oC s-1 40 oC, rate 12 oC s-1 180 oC for 8 min
Injection 1000 l Split-ratio = 10:1 Preheating 60 oC for 45 min Syringe 63 oC
Column SPB-1 Sulphur (Supelco 24158, Bellefonte, PEN, USA)
(30 m x 0.32 m i.d., 1 m film thickness)
Carrier gas Helium (Constant flow rate 1.1 ml min-1) Average velocity: 20 cm s-1 at 60 oC
Temperature program 29 oC for 7 min 180 oC, rate 10 oC min-1 180 oC for 10.5 min
Detector HP 5380 pulse flame photometric detector (PFPD)
Detector temperature 250 oC
Gas requirements Air: 420 kPa Hydrogen 420 kPa
3.6.3.3 Volatile thiols involved in varietal aromas
The volatile thiols were specifically extracted by the reversible combination of the thiols with
p-hydroxymercuribenzoate (p-HMB) and analyzed with gas chromatography coupled with
mass spectrometry (GC/MS) according to a modified Ferreira et al. (2007) method.
50 ml of wine containing 200 ng L-1 internal standard (4,2,2MSB) and 1.25 g L-1 BHA were
percolated through a LiChrolut EN 500mg SPE cartridge (Merck, Darmstadt, Germany) at a
maximum flow of 5 ml min-1. The sorbent was previously conditioned with 10 ml of
dichloromethane, 10 ml of methanol and 10 ml of 13 % ethanol (v/v). The cartridge was then
rinsed with 50 ml of an aqueous solution containing 40 % of methanol (v/v) buffered with
TRIS 0.2 M at pH 7.2 and after this, with 5 ml of ultrapure water (MilliQ, Millipore). The
sorbent was dried by forcing a stream of nitrogen (ca. 50 ml min−1) to pass through the bed
for 20 min. Thiols were eluted with a 10 ml solution containing 99 % dichloromethane and 1 %

63
methanol (v/v). The samples were purified with liquid-liquid extraction using 3 × 1 ml of an
aqueous solution of p-HMB (1 mM in a solution of HEPES 0.2 M at pH 10.7). The 3 aliquots
were combined and the pH of this aqueous phase was brought to 7.5 by the addition of 60 μl
of HCl 4.6 M. Complexes were then broken with the addition of 450 μl of dithioerythritol 10
mM in HEPES and free thiols were further extracted twice, with 750 μl of dichloromethane
each time. The organic phase was collected and dried on anhydrous sodium sulphate and
gently concentrated by evaporation in a water bath (47 °C) to a final volume of 25 μl.The
concentrated sample was transferred into a vial and it was analysed within 24 hours.
The analytical system comprised of a 6890N GC oven (Agilent Technologies, Böblingen,
Germany) equipped with a cold Injection system 4 (CIS4), a Multi Purpose Sampler 2 (MPS2)
both from Gerstel (Mülheim an der Ruhr) and a DB-WAX column 30 m x 0.32 mm x 0.25 µm
(Agilent Technologies, Böblingen, Germany). The detector used was a 5975C mass selective
detector (MSD) from Agilent Technologies (Böblingen, Germany). The Chromatographic
conditions are described in Table 3-6.
3SH, 3SHA, and 4MSP were detected in selected ion monitoring (SIM) mode and the
quantifier ions were m/z = 134, 116, and 132, respectively, whereas the internal standard
was detected with the ion m/z = 100 (Ferreira et al., 2007).
Calibration: Riesling wine was dearomatized according to a modified procedure described
from Fedrizzi et al. (2007). The following modifications were conducted: wine was treated two
times with 3 g L-1 activated charcoal to remove any sulphur compounds and other main
volatile compounds and then filtrated. The potassium metabisulphite (KMS) was added
corresponding to 100 mg L-1 free SO2. Calibration for the thiol analysis was done by adding
increasing quantities of the three volatile thiol reference compounds (3SH, 3SHA and 4MSP)
and internal standard (4,2,2MSB ) to the dearomatized wine. For each concentration, the
volatile thiols were extracted from the wine according to a modified Ferreira et al. (2007)
method. The retention time windows of selected ion chromatograms of the four thiols
obtained in the analysis of the dearomatized wine sample spiked with different levels of the
analytes are demonstrated in Figure A-1. Calibration range, limit of quantification and
standard deviation for each of the thiols are given below:
3SH 3SHA 4MSP
Calibration range (ng L-1) 0-5000 0-500 0-100
Limit of quantification (ng L-1) 300 50 10
% Standard deviation 17.5 % 33.0 % 12.2 %

64
Table 3-6 Chromatographic parameters for the analysis of aroma compounds in wine
samples by GC-MSD as described in 3.6.3.3
Parameter Specification
Gas Chromatography HP 6890 gas chromatograph (Agilent Technologies, Böblingen,
Germany)
Injection 3 l, splitless for 5 min in a CIS4 (Gerstel, Mülheim an der Ruhr)
CIS4 program Initial temperature: 40 °C
250 °C, rate 12 °C min-1, hold 5 min
Column DB-WAX capillary column (J&W, Agilent Technologies)
(30 m x 0.32 mm i.d., 0.25 μm film thickness)
Carrier gas Helium (flow rate 1.4 ml min-1)
Oven temperature
program
60 °C for 5 min
240 °C, rate 3 °C min-1, hold 20 min
Detector HP 5975C mass selective detector (MSD)
SIM Mode
Detector temperature Source 230 oC/ 150 oC
3.7 Fermentation trials of Scheurebe grape juice
The fermentation trials of Scheurebe grape juice were performed in two sequential trials as
follows.
3.7.1 Fermentation of fresh Scheurebe grape juice with two commercial
Saccharomyces yeast strains and four commercial nutrient sources
In 2008, fermentations were carried out in fresh Scheurebe grape juice. The properties of
initial grape juice were reducing sugar content 176 g L-1, pH 3.2, ammonium 0.09 g L-1,
NOPA 193 mg L-1 (as isoleucine), free alpha amino nitrogen 51.9 mg L-1, malic acid 6.1 g L-1,
tartaric acid 4.4 g L-1, shikimic acid 46 mg L-1, acetic acid 0.12 g L-1, citric acid 0.2 g L-1 and
total amino acids (without proline) 1314.6 mg L-1 (Table A-1). Two days before preparation of
grape must, 30 mg L-1 of sulphur dioxide were added into the grape juice as KMS. Duplicate

65
experimental fermentations were carried out in 2.5-liter bottles containing 2.2 L grape juice.
Two commercial Saccharomyces yeast strains and four different nutrient sources as well as
without nutrient addition (control) were used in this study, thus giving ten different treatment
combinations (Table 3-7). Nutrients were added into the grape juice according to an
experimental design. The yeast cultures were rehydrated following the method described in
3.2 prior to inoculation of each strain. The bottles were fitted with airlocks and the
fermentations were carried out at 20 oC in a controlled environment. The progress of
fermentation was followed by monitoring CO2 production, which was determined by weight
loss during fermentation. After the weight losses of the samples were constant, wines were
cold stabilized at below 10 oC for 7 days and racked into previously cleaned bottles. Then
potassium metabisulphite (KMS) was added corresponding to 80 mg L-1 free SO2 in finished
wine and bottled wines were stored at below 15 oC until need. After this, 150 ml wine
samples, without sulphur dioxide addition, were kept at -18 oC for analysis of SO2-binding
compounds, glycerol and residual sugar. The experimental plan is demonstrated in Table 3-7.
The ANOVA for factorial design and DMRT were performed using MSTATC statistical
program (www.msu.edu/~freed/disks.htm, 1994) to interpret mean differences in mean
values at the 95 % confidence level.
Table 3-7 Experimental design of yeast inoculation and nutrient supplementation
Saccharomyces yeast strain Nutrient source *
EC1118 Control (without nutrient)
OptiWhite
Superstart
DAP
Fermaid E
X5 Control (without nutrient)
OptiWhite
Superstart
DAP
Fermaid E
* All the nutrients were added at the concentration of 0.3 g L-1, except control treatment

66
3.7.2 Impact of thirteen commercial Saccharomyces yeast strains on fermentation
characteristics and quality of Scheurebe grape wine
In 2008, fermentation was carried out in fresh Scheurebe grape juice. The composition of
initial grape juice was reducing sugar content 175 g L-1, pH 3.18, ammonium 0.09 gL-1,
NOPA 194 mg L-1 (as isoleucine), free alpha amino nitrogen 84.8 mg L-1, malic acid 6.0 g L-1,
tartaric acid 4.4 g L-1, shikimic acid 46 mg L-1, acetic acid 0.12 g L-1, citric acid 0.20 g L-1 and
total amino acids (without proline) 1314.6 mg L-1 (Table A-1). Three days before the
preparation of grape must, 30 mg L-1 of sulphur dioxide were added in grape juice as KMS.
Experiments were performed in triplicate in 0.75-liter bottles filled with 650 ml of grape juice
without yeast nutrient addition. Thirteen commercial Saccharomyces yeast strains (EC1118,
Sauvignon, VL3, X5, X16, VIN13, Alchemy I, Alchemy II, 4F9, LVCB, LittoLevure, AWRI R2
and QA23) were used in this study. The yeast cultures were rehydrated following the method
described in 3.2 prior to inoculation. The bottles were fitted with airlocks that enable the
carbon dioxide to escape then the fermentations were carried out at 20 oC in an incubator.
The consequent methods were performed as described in 3.7.1. Then 150 ml wine samples
were kept at -18 oC for the analysis as describe in method 3.7.1.
The one way ANOVA and DMRT were performed using MSTATC statistical program
(www.msu.edu/~freed/disks.htm, 1994) to interpret mean differences in mean values at the
95 % confidence level.
3.8 Fermentation trials of Sauvignon blanc grape juice
The fermentation trials of Sauvignon blanc grape juice were performed in two sequential
trials as follows.
3.8.1 Fermentation of fresh grape juice with nine commercial Saccharomyces yeast
strains and two nutrient sources
The fermentation was carried out in fresh Sauvignon blanc grape juice from the 2008 harvest
season. Nine commercial Saccharomyces yeast strains and two commercial nutrient sources
were used in this study, thus giving 18 different fermentation treatments (Table 3-8).
Properties of initial grape juice were pH 3.10, total soluble solid 17.2 oBrix, reducing sugar
content 169 g L-1, total acidity 10.1 g L-1, tartaric acid 6.8 g L-1, malic acid 7.0 g L-1, shikimic
acid 38 mg L-1, citric acid 0.3 g L-1, glycerol 0.3 g L-1, ammonium 0.08 g L-1, free alpha amino
nitrogen 92.5 mg L-1 and total amino acids (without proline) 1264.6 mg L-1 (Table A-2). The
experimental fermentations were carried out in 0.75-liter bottles containing 650 ml grape

67
juice and all treatments were done in duplicate. Addition of nutrients was performed in the
grape juice according to an experimental design consisting of two different nutrient sources
prior to the alcoholic fermentation (Table 3-8). Then 25 mg L-1 of sulphur dioxide were added
into the grape juice by addition of KMS, and juice bottles were left approximately 12 hours
before inoculation. The yeast cultures were rehydrated following the preparation described in
3.2 prior to inoculation of each strain. The bottles were fitted with airlocks and the
fermentations were carried out at 20 oC in a controlled environment. The following methods
were performed as described before in 3.7.1. Consequently, 150 ml wine samples were kept
at -18 oC for the analysis as described in method 3.7.1. The experimental design is shown in
Table 3-8.
The ANOVA for factorial design and DMRT were performed using MSTATC statistical
program (www.msu.edu/~freed/disks.htm, 1994) to interpret mean differences in mean
values at the 95 % confidence level.
Table 3-8 Experimental design of yeast inoculation and nutrient supplementation in fresh
Sauvignon blanc grape juice from the 2008 harvest season
Saccharomyces yeast strain Initial nutrient source (0.3 g L-1)
EC1118 Fermaid E
OptiWhite
Sauvignon Fermaid E
OptiWhite
VL3 Fermaid E
OptiWhite
X5 Fermaid E
OptiWhite
VIN7 Fermaid E
OptiWhite
VIN13 Fermaid E
OptiWhite
4F9 Fermaid E
OptiWhite
LVCB Fermaid E
OptiWhite
AWRI R2 Fermaid E
OptiWhite

68
3.8.2 Fermentation of fresh grape juice with five commercial Saccharomyces yeast
strains and four nutrient sources
The fermentation was carried out in fresh Sauvignon blanc grape juice from the 2009 harvest
season. The properties of initial grape juice were total soluble solid 17.3 oBrix, reducing sugar
content 190 g L-1, pH 3.19, free sulphur dioxide 2.8 mg L-1, tartaric acid 5.1 g L-1, malic acid
4.0 g L-1, shikimic acid 22 mg L-1, citric acid 0.2 g L-1, glycerol 0.50 g L-1 , NOPA 164 mg L-1
(as isoleucine) and total amino acids (without proline) 1782.9 mg L-1 (Table A-2). Five
commercial Saccharomyces yeast strains and four commercial nutrient sources were used in
this study, thus giving 20 different fermentation treatments (Table 3-9). Triplicate
experimental fermentations were carried out in 0.75-liter bottles containing 620 ml grape
juice. Addition of nutrient was performed in the grape juice according to an experimental
design prior to the alcoholic fermentation. Then 25 mg L-1 of sulphur dioxide was added in
grape juice as KMS, and juice bottles were left approximately 12 hours before inoculation.
The yeast cultures were rehydrated following the method described in 3.2 prior to inoculation
of each strain. The bottles were fitted with airlocks and the fermentations were carried out at
20 oC in a controlled environment. The consequent methods were performed as described in
3.7.1. In addition, 150 ml wine samples were kept at -18 oC for the analysis of sulphur dioxide
produced by yeast and the other analysis as described in method 3.7.1. The experimental
design is shown in Table 3-9.
The ANOVA for factorial design and DMRT were performed using MSTATC statistical
program (www.msu.edu/~freed/disks.htm, 1994) to interpret mean differences in mean
values at the 95 % confidence level.

69
Table 3-9 Experimental design of yeast inoculation and nutrient supplementation in
Sauvignon blanc grape juice fermentation
Saccharomyces yeast strain Initial nutrient source
EC1118 Superstart 0.3 g L-1
Fermaid O 0.4 g L-1
Fermaid E 0.4 g L-1
VUltra 0.4 g L-1
X5 Superstart 0.3 g L-1
Fermaid O 0.4 g L-1
Fermaid E 0.4 g L-1
VUltra 0.4 g L-1
VIN7 Superstart 0.3 g L-1
Fermaid O 0.4 g L-1
Fermaid E 0.4 g L-1
VUltra 0.4 g L-1
Alchemy I Superstart 0.3 g L-1
Fermaid O 0.4 g L-1
Fermaid E 0.4 g L-1
VUltra 0.4 g L-1
LittoLevure Superstart 0.3 g L-1
Fermaid O 0.4 g L-1
Fermaid E 0.4 g L-1
VUltra 0.4 g L-1

70
3.9 Fermentation trials of yellow passion fruit juice
The fermentation trials of yellow passion fruit (Passiflora edulis Sims f. flavicarpa Degner)
juices obtained from frozen yellow passion fruit puree were performed in four sequential trials
as follows.
3.9.1 Influence of fourteen different commercial Saccharomyces yeast strains on
fermentation characteristics and quality of yellow passion fruit wine
The frozen yellow passion fruit (YPF) puree was used, and its properties are reducing sugar
content 61.5 g L-1, pH 2.8, NOPA 332 mg L-1 (as isoleucine), malic acid 5.4 g L-1, shikimic
acid 14 mg L-1, citric acid 38.4 g L-1 and total amino acid without proline 2491.0 mg L-1 (Table
A-3). The frozen YPF puree was thawed at ambient temperature and diluted by addition of
hot water until its pH was 3.1-3.2, therefore the reducing sugar content of diluted YPF juice
was 8.1 g L-1, NOPA was 46 mg L-1 (as isoleucine) and total amino acids (without proline)
were 207.1 mg L-1 (Table A-3). The sugar content was adjusted to provide sugar quantities of
200 g Kg-1 juice by addition of beet sugar (sucrose, Südzucker, Mannheim, Germany), and
0.5 g L-1 DAP was added for nutrient supplementation. The composition of prepared YPF
juice was inverted sugar content 207 g L-1, pH 3.22, malic acid 0.5 g L-1, citric acid 3.7 g L-1
and shikimic acid 1 mg L-1. Triplicate experiments were performed in 0.75-liter bottles filled
with 650 ml YPF juice, and 50 mg L-1 of sulphur dioxide as KMS was added. Juice bottles
were left approximately 12 hours to suppress undesirable microorganism growth as well as
to function as an antioxidant. Fourteen commercial Saccharomyces yeast strains (EC1118,
Sauvignon, VL3, X5, X16, VIN13, Alchemy I, Alchemy II, 4F9, LVCB, LittoLevure, AWRI R2,
QA23 and Freddo) were used in this study. The yeast cultures were rehydrated following the
method described in 3.2 prior to inoculation of each strain. The bottles were fitted with
airlocks that enable the carbon dioxide to escape then the fermentations were carried out at
20 oC in a controlled incubator. The progress of fermentation was followed by monitoring CO2
production, which was determined by weight loss during fermentation. After the weight loss
of the samples were constant, YPF wines were cold stabilized at below 10 oC for 7 days and
racked into previously cleaned bottles. Then 80 mg L-1 of SO2 was added as KMS in finished
YPF wine and bottled wines were stored at below 15 oC until need. Then 150 ml YPF wines
without sulphur dioxide addition, were kept at -18 oC for analysis of SO2-binding compounds,
glycerol and residual sugar.
The one way ANOVA and DMRT were performed using MSTATC statistical program
(www.msu.edu/~freed/disks.htm, 1994) to interpret mean differences in mean values at the
95 % confidence level.

71
3.9.2 Fermentation of yellow passion fruit juice with three commercial Saccharomyces
yeast strains and five commercial nutrient sources
The properties of frozen yellow passion fruit puree used in this study are reducing sugar
content 67.1 g L-1, pH 2.77, NOPA 317 mg L-1 (as isoleucine), malic acid 5.9 g L-1, citric acid
41.3 g L-1 and total amino acid without proline 2491.0 mg L-1 (Table A-3). The frozen YPF
puree was thawed at ambient temperature and diluted by addition of hot water until its pH
was 3.1-3.2, then reducing sugar content of diluted YPF juice was 10.7 g L-1, NOPA
was 43 mg L-1 (as isoleucine) and total amino acids (without proline) were 180.3 mg L-1
(Table A-3). Then the sugar content was adjusted to provide sugar quantities of 200 g Kg-1
juice by addition of beet sugar (sucrose, Südzucker, Mannheim, Germany). The composition
of prepared YPF juice was inverted sugar content 201 gL-1, pH 3.2, malic acid 0.5 g L-1 and
citric acid 3.8 g L-1. Triplicate experiments were performed in the 1.50-liter bottles filled with
1.20 L YPF juice. Three commercial Saccharomyces yeast strains and five commercial
nutrient sources were used in this study, thus giving 15 different fermentation treatments
(Table 3-10). Addition of nutrients was performed in the YPF juice according to an
experimental design prior to the alcoholic fermentation and 50 mg L-1 of sulphur dioxide as
KMS was added. Juice bottles were left approximately 12 hours to suppress undesirable
microorganism growth as well as to function as an antioxidant. The yeast cultures were
rehydrated following the method described in 3.2 prior to the inoculation of each strain. The
bottles were fitted with airlocks and the fermentations were carried out at 20 oC in a
controlled environment. The consequent methods were performed as described in 3.9.1.
Then 150 ml of YPF wine samples were kept at -18 oC for the analysis as described in
method 3.9.1. The experimental plan is shown in Table 3-10.
The ANOVA for factorial design and DMRT were performed using MSTATC statistical
program (www.msu.edu/~freed/disks.htm, 1994) to interpret mean differences in mean
values at the 95 % confidence level.

72
Table 3-10 Experimental design of yeast inoculation and nutrient supplementation in
prepared YPF juice fermentation
Saccharomyces yeast strain Initial nutrient source (0.4 g L-1)
EC1118 DAP
VCombi
VUltra
Fermaid E
OptiWhite
Sauvignon DAP
VCombi
VUltra
Fermaid E
OptiWhite
X5 DAP
VCombi
VUltra
Fermaid E
OptiWhite
3.9.3 Fermentation of yellow passion fruit juice with five commercial Saccharomyces
yeast strains and two commercial nutrient sources at two different concentrations
The frozen yellow passion fruit puree was used in this study, and its composition was
reducing sugar content 50.5 g L-1, pH 2.89, NOPA 296 mg L-1 (as isoleucine), malic
acid 5.2 g L-1, citric acid 40.5 g L-1 and total amino acid without proline 2491.0 mg L-1 (Table
A-3). The frozen YPF puree was thawed at ambient temperature and diluted by addition of
hot water until its pH was 3.1-3.2, therefore reducing sugar content of diluted YPF juice was
3.65 g L-1, NOPA was 24 mg L-1 (as isoleucine) and total amino acids (without
proline) 123.1 mg L-1 (Table 4-23 and A-3). Then the sugar content was adjusted to provide
sugar quantities of 200 g Kg-1 juice by addition of beet sugar (sucrose, Südzucker, Mannheim,
Germany). The composition of prepared YPF juice was inverted sugar content 170.5 g L-1,
pH 3.19, malic acid 0.5 g L-1 and citric acid 3.1 g L-1. Experiments were performed in triplicate
in 1.50-liter bottles filled with 1.20 L YPF juice. Five commercial Saccharomyces yeast
strains and two commercial nutrient sources at two different concentrations were used in this
study, thus giving 20 different fermentation treatments (Table 3-11). Addition of nutrients was

73
performed in the YPF juice according to an experimental design (Table 3-11) prior to the
alcoholic fermentation and 50 mg L-1 of sulphur dioxide as KMS were added. Juice bottles
were left to settle approximately 12 hours and the yeast cultures were rehydrated following
the method described in 3.2 prior to inoculation of each strain. The bottles were fitted with
airlocks and the fermentations were carried out at 20 oC in a controlled environment. The
consequent methods were performed as described in 3.9.1. 150 ml of YPF wine samples
were kept at -18 oC for the analysis as described in method 3.9.1. The experimental design is
shown in Table 3-11.
The ANOVA for factorial design and DMRT were performed using MSTATC statistical
program (www.msu.edu/~freed/disks.htm, 1994) to interpret mean differences in mean
values at the 95 % confidence level.
Table 3-11 Experimental design of yeast inoculation and nutrient supplementation in
prepared YPF juice fermentation
Saccharomyces yeast strain Initial nutrient source Nutrient concentration (g L-1)
EC1118 DAP 0.25
0.50
VCombi 0.25
0.50
VL3 DAP 0.25
0.50
VCombi 0.25
0.50
X5 DAP 0.25
0.50
VCombi 0.25
0.50
Alchemy I DAP 0.25
0.50
VCombi 0.25
0.50
LittoLevure DAP 0.25
0.50
VCombi 0.25
0.50

74
3.9.4 Fermentation of yellow passion fruit juice with three commercial Saccharomyces
yeast strains and four commercial nutrient sources at two different concentrations
The properties of frozen yellow passion fruit puree used in this study were reducing sugar
content 43 gL-1, pH 2.85, NOPA 296 mg L-1 (as isoleucine), malic acid 5.3 g L-1, citric acid
42.1 g L-1 and total amino acid without proline 2491.0 mg L-1 (Table A-3). The frozen YPF
puree was thawed at ambient temperature and diluted by addition of hot water until its pH
was 3.1-3.2, thus giving the reducing sugar content of diluted YPF juice of 4 g L-1, NOPA was
27 mg L-1 (as isoleucine) and total amino acids (without proline) 164.2 mg L-1 (Table 4-28 and
A-3). Then the sugar content was adjusted to provide sugar quantities of 200 g Kg-1 juice by
addition of beet sugar (sucrose, Südzucker, Mannheim, Germany). The composition of
prepared YPF juice was inverted sugar content 170 g L-1, pH 3.18, malic acid 0.5 g L-1 and
citric acid 2.8 g L-1. Triplicate experiments were performed in 0.75-liter bottles filled
with 650 ml YPF juice. Three commercial Saccharomyces yeast strains and four
commercial nutrient sources at two different concentrations were used in this study, thus
giving 24 different fermentation treatments (Table 3-12). Addition of commercial nutrients
was performed in the YPF juice according to an experimental design (Table 3-12) prior to the
alcoholic fermentation and 50 mg L-1 of sulphur dioxide as KMS were added. Juice bottles
were left approximately 12 hours to suppress undesirable microorganism growth as well as
to function as an antioxidant. The yeast cultures were rehydrated following the preparation of
yeast culture described in 3.2 prior to inoculation of each strain. The bottles were fitted with
airlocks and the fermentations were carried out at 20 oC in a controlled environment. The
following methods were performed as described in 3.9.1. In addition, 150 ml of YPF wine
samples were kept at -18 oC for the analysis as described in method 3.9.1. The experimental
plan is shown in Table 3-12.
The ANOVA for factorial design and DMRT were performed using MSTATC statistical
program (www.msu.edu/~freed/disks.htm, 1994) to interpret mean differences in mean
values at the 95 % confidence level.

75
Table 3-12 Experimental design of yeast inoculation and nutrient supplementation in
prepared YPF juice fermentation
Saccharomyces yeast strain Initial nutrient source Nutrient concentration (g L-1)
EC1118 VCombi 0.2
0.4
VUltra 0.2
0.4
Fermaid E 0.2
0.4
OptiWhite 0.2
0.4
VL3 VCombi 0.2
0.4
VUltra 0.2
0.4
Fermaid E 0.2
0.4
OptiWhite 0.2
0.4
X5 VCombi 0.2
0.4
VUltra 0.2
0.4
Fermaid E 0.2
0.4
OptiWhite 0.2
0.4
Investigation of volatile thiols in yellow passion fruit wine
YPF wine samples obtained from the fermentation trials of 3.9.3 and 3.9.4 were selected to
investigate for volatile thiols in finished products after fermentation. The volatile thiols in YPF
wine were specifically extracted by the reversible combination of the thiols with -
hydroxymercuribenzoate according to a modified Ferreira et al. (2007) method and analyzed
by gas chromatography/mass spectrophotometry (GC-MS) within 24 hours as described in
the method of 3.6.3.3 Volatile thiols involved in varietal aromas.

76
4. RESULTS
The following chapters give an overview on the conducted experiments and the obtained
results of each fermentation trial (see experimental outline for all fermentation trials in Figure
A-2). Firstly, investigations on the effects of commercial Saccharomyces strains and nutrient
supplements on wine fermentative characteristics and quality of Scheurebe grape wines are
demonstrated in chapter 4.1. Secondly, the obtained results of the growth kinetics, metabolic
products and wine aromas of Sauvignon blanc grape juice fermented with different
commercial Saccharomyces yeast strains and nutrient supplements are presented in
chapter 4.2. The improvement of fermentation kinetics, fermentative characteristics and
quality of yellow passion fruit wine by optimal choice of commercial Saccharomyces yeast
strains and nutrient supplements are reported in chapter 4.3. Finally, the results of the
volatile thiols involved in varietal aromas of finished YPF wine obtained from the experiment
3.9.3 and 3.9.4 will be reported in chapter 4.4. Each experiment was carried out in duplicate
or triplicate depending on the experimental plan.
4.1 Effects of commercial Sacchromyces yeast strains and nutrient supplements on
wine fermentative characteristics and quality of Scheurebe grape wines
The two experimental results that are described in the following chapters were obtained from
Scheurebe grape juice fermented with different commercial Saccharomyces yeast strains
and/or nutrient sources at different concentrations.
4.1.1 Effect of two commercial Saccharomyces yeast strains and four nutrient sources
on fermentative characteristics, metabolic compounds and wine aromas of Scheurebe
grape wines
Fermentation was performed in fresh Scheurebe grape juices from the 2008 harvest season.
Two commercial yeast strains, EC1118 and X5, were used to ferment grape juice
supplemented with four different nutrient sources; OptiWhite (natural inactivated yeast),
Superstart (blend of inactivated yeast and yeast cell walls), DAP and Fermaid E (blend of
diammonium hydrogen phosphate, thiamine, yeast cell walls and ammonium sulphate), and
no nutrient addition (control). The fermentation kinetics, some metabolic compounds and
wine aroma in finished wines were examined.

77
Figure 4-1 Growth kinetics of fresh Scheurebe grape juice fermentations with two yeast
strains and four nutrient sources
The growth kinetics: The result in Figure 4-1 shows that after the inoculation of the
EC1118 and X5 strains into fresh Scheurebe grape juices, the growth kinetics of the yeast
strains varied depending on the sources of nutrients added. The EC1118 strain seemed to
have a slightly longer lag phase than the X5 strain, but the addition of Fermaid E reduced the
fermentation time from 14 days to 11 days. The addition of Fermaid E also stimulated the X5
strain to have faster growth kinetics and fermentation time (12 days). All treatments
completed fermentation after 11-14 days depending on the nutrient source added.
Chemical composition: Figure 4-2 shows that significant differences existed between the
treatment combinations in term of residual sugar in final wines, but not in glycerol production.
Without nutrient addition to the juice (control), the EC1118 strain produced wine having high
residual sugar (1.2 + 0.0 g L-1). Whereas, fermentation with strain X5 in the presence of
Superstart resulted in the highest residual sugar in the final wine (1.0 + 0.0 g L-1). Addition of
any kind of nutrients led to decreased residual sugar in the final wine. Nevertheless, residual
sugar content in all wine treatments was below 2 g L-1 and the wines reached dryness. The
two yeast strains produced similar amounts of glycerol in wines treated with any source of
nutrient and in the control treatment ranging from 2.5 + 0.1 to 2.8 + 0.0 g L-1.
0
10
20
30
40
50
60
70
80
90
1 2 3 4 5 6 7 8 9 10 11 12 13 14
Fermentation day
Carb
on
dio
xid
e (
g L
-1)
EC1118-Control
EC1118-OptiWhite
EC1118-Superstart
EC1118-DAP
EC1118-Fermaid
X5-Control
X5-OptiWhite
X5-Superstart
X5-DAP
X5-Fermaid

78
Figure 4-2 Concentration of residual sugar and glycerol in finished Scheurebe grape wines
fermented with two yeast strains, four nutrient sources and without nutrient
Vertical bars represent standard deviations from two fermentation replicates. Means followed
by different letters on the top of the bar are significantly different (p<0.05) between treatment
combinations of each compound, whereas means followed by the same letters are not
significantly different (p>0.05) according to the DMRT test.
Organic acids: Table 4-1 shows the concentration of organic acids found in obtained wines
fermented with strains EC1118 and X5 with different nutrient sources and without nutrients.
The results indicate that both yeast strains and nutrient sources only affected the production
of acetic acid, while the other organic acids were similar among wine treatments. The two
yeast strains produced high concentrations of acetic acid in the control treatment (0.29 +
0.00 and 0.29 + 0.01 g L-1, respectively). However, when a nutrient was added they had
inverse patterns of acetic acid formation. The presence of OptiWhite stimulated the highest
formation of this acid by strain EC1118 (0.29 + 0.00 g L-1), while strain X5 produced the
highest amounts in the Superstart treatment (0.27 + 0.00 g L-1). The other organic acid
concentrations in all wine treatments showed no difference ranging from 1.16 + 0.22 to 1.41
+ 0.44 g L-1 tartaric acid, 5.04 + 0.17 to 5.25 + 0.35 g L-1 malic acid, 0.12 + 0.00 to 0.17 +
0.01 g L-1 lactic acid, 45.67 + 0.02 to 47.03 + 0.83 g L-1 shikimic acid 0.21 + 0.00 to 0.28 +
0.02 g L-1 citric acid.
0.8
b
1.2
a
2.5
a2.6
a
0.7
bc
0.7
bc
2.6
a
2.7
a
1.0
ab
0.8
b
2.7
a
2.6
a
0.4
c
0.9
b
2.7
a
2.7
a
0.8
b0.9
b
2.6
a
2.8
a
0
1
2
3
EC1118 X5 EC1118 X5
Glycerol Residual sugar
Co
nc
en
tra
tio
n (
g L
-1)
Control OptiWhite Superstart DAP Fermaid E

79
Table 4-1 Concentration of organic acids found in finished Scheurebe wines developed by two yeast strains with four nutrient sources and
without nutrient
Yeast Nutrient Tartaric acid
(g L-1)
Malic acid
(g L-1)
Lactic acid
(g L-1)
Shikimic acid
(mg L-1)
Acetic acid
(g L-1)
Citric acid
(g L-1)
EC1118 Control 1.19 + 0.13 a 5.22 + 0.18 a 0.12 + 0.00 a 47.03 + 0.83 a 0.29 + 0.00 a 0.24 + 0.03 a
OptiWhite 1.29 + 0.25 a 5.07 + 0.10 a 0.13 + 0.01 a 46.06 + 1.09 a 0.29 + 0.00 a 0.23 + 0.03 a
Superstart 1.30 + 0.16 a 5.15 + 0.05 a 0.14 + 0.00 a 46.51 + 0.15 a 0.22 + 0.02 cd 0.23 + 0.03 a
DAP 1.16 + 0.22 a 5.24 + 0.03 a 0.15 + 0.01 a 46.18 + 0.19 a 0.23 + 0.01 cd 0.23 + 0.03 a
Fermaid E 1.23 + 0.31 a 5.07 + 0.06 a 0.14 + 0.01 a 46.41 + 0.03 a 0.25 + 0.02 bc 0.26 + 0.03 a
X5 Control 1.16 + 0.23 a 5.06 + 0.10 a 0.12 + 0.02 a 45.67 + 0.02 a 0.29 + 0.01 a 0.21 + 0.00 a
OptiWhite 1.25 + 0.16 a 5.04 + 0.17 a 0.12 + 0.01 a 46.46 + 1.23 a 0.23 + 0.02 cd 0.25 + 0.05 a
Superstart 1.17 + 0.11 a 5.25 + 0.35 a 0.13 + 0.00 a 47.01 + 0.65 a 0.12 + 0.02 e 0.28 + 0.02 a
DAP 1.41 + 0.44 a 5.05 + 0.00 a 0.14 + 0.02 a 46.39 + 0.11 a 0.27 + 0.00 ab 0.23 + 0.01 a
Fermaid E 1.29 + 0.19 a 5.18 + 0.00 a 0.17 + 0.01 a 45.87 + 0.26 a 0.20 + 0.04 d 0.21 + 0.02 a
Each value shows the mean + standard deviation.
Values displaying the same letter (only ‗a‘) within the same column indicate no significant difference (p>0.05), whereas those displaying
different letters are significantly different (p<0.05) according to the DMRT test.

80
SO2-binding compounds: As shown in Figure 4-3, the results show that different
production of these compounds by the two yeast strains varied depending on the nutrient
sources, excluding acetaldehyde. Regarding -ketoglutarate, strain EC1118 produced the
highest amounts in the Superstart treatment (26.3 + 0.5 mg L-1), while the highest production
by strain X5 was present in the OptiWhite, Superstart and DAP treatments (23.3 + 3.4, 23.6
+ 1.8 and 24.0 + 2.6 mg L-1, respectively). Straine X5 was the low pyruvate producer (7.8 +
2.4 to 15.4 + 0.7 mg L-1). On the contrary, strain EC1118 was the high pyruvate producer
(20.8 + 1.0 to 27.6 + 1.3 mg L-1), but its formation tended to decrease with the addition of
nutrients, particularly in the Fermaid E treatment. These results show that the addition of
Fermaid E significantly reduced the formation of these keto acids. Levels of acetaldehyde
were similar among wine treatments ranging from 38.4 + 0.2 to 48.5 + 2.0 mg L-1.
Sulphur containing compounds: The data in Figure 4-4 indicate wines produced by strain
EC1118 did not reveal H2S under this trial condition, but the X5 strain produced high
amounts, particularly in the control and Superstart treatment (2.9 + 0.1 and 3.0 + 0.2 g L-1,
respectively). There was no statistical difference of dimethyl sulphide formations among
treatment combinations ranging from 1.1 + 0.1 to 1.9 + 0.5 g L-1. Under this trial condition,
the other sulphur compounds like ethanethiol, methanethiol, dimethyl disulphide, thioacetic
acid S-methylester and thioacetic acid S-ethylester were not detected in all wine treatments.
Figure 4-3 Concentration of SO2-binding compounds in finished Scheurebe grape wines
produced by two yeast strains with four nutrient sources and without nutrient
Vertical bars represent standard deviations from two fermentation replicates. Means followed by
different letters on the top of the bar are significantly different (p<0.05) between treatment
combinations of each S-binding compound, whereas means followed by the same letter are not
significantly different (p>0.05) according to the DMRT test.
47
.6 a
48
.5 a
14
.3 c
de
27
.6 a
21
.2 b
c
19
.4 b
cd
46
.3 a
46
.7 a
10
.9 d
e
24
.4 a
23
.3 a
bc
19
.4 b
cd
38
.4 a
39
.9 a
15
.4 b
cd
20
.8 a
bc
23
.6 a
b
26
.3 a
45
.6 a
42
.8 a
14
.2 c
de
21
.3 a
b
24
.0 a
b
18
.5 c
d
40
.9 a
42
.4 a
7.8
e13
.0 d
e19
.4 b
cd
16
.3 d
0
10
20
30
40
50
EC1118 X5 EC1118 X5 EC1118 X5
alpha-Ketoglutarate Pyruvate Acetaldehyde
Co
ncen
trati
on
(m
g L
-1)
Control OptiWhite Superstart DAP Fermaid E

81
Figure 4-4 Formation of hydrogen sulphide and dimethyl sulphide in finished Scheurebe
grape wines produced by two yeast strains with four nutrient sources and
without nutrient
Vertical bars represent standard deviations from two fermentation replicates. Means followed by
different letters on the top of the bar are significantly different (p<0.05) between treatment
combinations of each S-containing compound, whereas means followed by the same letter are
not significantly different (p>0.05) according to the DMRT test.
Higher alcohols: Commercial yeast strains and nutrient sources significantly affected only 2-
methyl propanol and 3-methyl butanol in the final wines (Table 4-2). The EC1118 strain
seemed to produce higher concentrations of these alcohols with less response to the nutrient
source than the X5 strain. However, 2-methyl propanol seemed to be most evident in the
Superstart and DAP treatments (24.0 + 1.4 and 24.0 + 3.2 mg L-1, respectively), whereas 3-
methyl butanol seemed to be the highest in the Feramid E treatment (164.0 + 5.1 mg L-1). On
the other hand, strain X5 developed the highest amounts of two alcohols in the Fermaid E
treatment (22.5 + 2.1 and 156.5 + 2.3 mg L-1, respectively). There were no significant
differences among wine treatments in respect to 2-methyl butanol and hexanol formations
ranging from 19.0 + 1.2 to 27.0 + 0.9 mg L-1 and 1627.5 + 161.9 to 2062.0 + 9.3 g L-1,
respectively. Figure 4-5 shows that both yeast strains and nutrient sources had no significant
effects on the production of 2-phenyl ethanol ranging from 16.4 + 1.0 to 24.4 + 1.4 mg L-1.
1.6
a
1.5
a
2.9
ab
1.2
a
1.2
a
2.1
c
1.7
a
3.0
a
1.1
a
n.d.
1.9
a
1.1
a
2.7
b
1.3
a
1.4
a
n.d
.
0
1
2
3
EC1118 X5 EC1118 X5
Hydrogen sulphide Dimethyl sulphide
Co
nce
ntr
atio
n (
g L
-1)
Control OptiWhite Superstart DAP Fermaid E

82
Table 4-2 Concentration of higher alcohols found in finished Scheurebe wines developed by
two yeast strains with four nutrient sources and without nutrient
Yeast
Nutrient
2-Methyl propanol
(mg L-1
)
Hexanol
(g L-1
)
3-Methyl butanol
(mg L-1
)
2-Methyl butanol
(mg L-1
)
EC1118 Control 22.5 + 3.9 ab 1991.0 + 83.1 a 134.0 + 12.5 bcd 20.5 + 2.2 a
OptiWhite 20.0 + 1.2 abc 2011.5 + 116.8 a 132.5 + 6.1 bcd 21.0 + 1.3 a
Superstart 24.0 + 1.4 a 1972.0 + 10.0 a 150.5 + 9.6 ab 24.0 + 1.3 a
DAP 24.0 + 3.2 a 2062.0 + 9.3 a 142.0 + 12.7 abc 21.0 + 1.5 a
Fermaid E 18.5 + 2.4 abc 2039.0 + 137.2 a 164.0 + 5.1 a 23.0 + 1.4 a
X5 Control 17.0 + 1.5 bc 1826.5 + 109.8 a 113.0 + 9.1 de 21.0 + 2.4 a
OptiWhite 17.0 + 2.4 bc 1778.5 + 2.7 a 110.0 + 7.1 de 21.5 + 2.4 a
Superstart 21.0 + 5.8 abc 1627.5 + 161.9 a 117.0 + 23.8 cde 22.5 + 5.1 a
DAP 15.5 + 0.9 c 1808.5 + 126.5 a 105.0 + 6.6 e 19.0 + 1.2 a
Fermaid E 22.5 + 2.1 ab 1913.0 + 10.8 a 156.5 + 2.3 ab 27.0 + 0.9 a
Each value shows the mean + standard deviation.
Values displaying the same letter (only ‗a‘) within the same column indicate no significant
difference (p>0.05), whereas those displaying different letters are significantly different
(p<0.05) according to the DMRT test.
Figure 4-5 Formation of 2-phenyl ethanol and acetic acid ethyl ester in finished Scheurebe
grape wines developed by two yeast strains with four nutrient sources and
without nutrient
Vertical bars represent standard deviations from two fermentation replicates. Means followed
by different letters on the top of the bar are significantly different (p<0.05) between treatment
combinations of each compound, whereas means followed by the same letters are not
significantly different (p>0.05) according to the DMRT test.
60
.5 a
bc
71
.1 a
b
17
.5 a
18
.9 a
23
.5 d
50
.3 a
bc
d
18
.4 a
24
.0 a
25
.1 c
d
59
.4 a
bc
22
.5 a
24
.4 a
35
.5 b
cd
79
.2 a
16
.4 a
17
.8 a
72
.7 a
b
80
.2 a
21
.7 a
22
.9 a
0
30
60
90
EC1118 X5 EC1118 X5
2-Phenyl ethanol Acetic acid ethyl ester
Co
nc
en
tra
tio
n (
mg
L-1
)
Control OptiWhite Superstart DAP Fermaid E

83
Acetic acid esters: As shown in Figure 4-5, the EC1118 strain seemed to produce higher
amounts of acetic acid ethyl ester (50.3 + 1.5 and 80.2 + 13.7 mg L-1) than the X5 strain and
was less response to the nutrient sources. In contrast, strain X5 developed high amounts of
this ester in the Fermaid E and control treatments (72.7 + 3.4 and 60.5 + 0.3 mg L-1).
Regarding the other acetic acid esters, the two yeast strains produced different amounts of
these esters depending on the nutrient source (Figure 4-6). Strain EC1118 seemed to
produce the highest amount of acetic acid 3-methylbutyl ester in the Fermaid E sample
(691.4 + 38.7 g L-1), followed by the DAP, Superstart and control treatments (637.3 + 135.9,
587.2 + 6.9 and 532.5 + 24.1 g L-1, respectively), and that of acetic acid 2-phenyl ethyl ester
in the control and Fermaid E sample (111.7 + 6.7 and 110.3 + 4.5 g L-1, respectively). The
X5 strain developed high amounts of these esters in the Superstart (571.4 + 58.9 and 106.2
+ 0.9 g L-1, respectively) and Fermaid E treatments (744.9 + 59.6 and 100.1 + 14.0 g L-1,
respectively). Nevertheless, addition of Fermaid E resulted in the highest formation of acetic
acid 2-methylbutyl ester by both strains (30.6 + 2.7 and 36.8 + 4.2 g L-1, respectively). Both
yeast strains produced similar amounts of acetic acid hexyl ester in wines ranging from 87.8
+ 14.9 to 110.3 + 3.7 g L-1.
Ethyl and diethyl esters: As shown in Table 4-3, the production of ethyl and diethyl esters
by the two strains varied significantly depending on the nitrogen sources, except isobutanoic
acid ethyl ester (iBuEtE). Concentrations of iBuEtE were similar ranging from 39.0 + 5.3 to
51.5 + 4.4 g L-1. Strain EC1118 seemed to be the high producer of propionic acid ethyl ester
(PrEtE), butanoic acid ethyl ester (BuEtE) and lactic acid ethyl ester (LAEtE) with less
response to the nutrient source. The EC1118 wines had 100.0 + 11.8 to 119.5 + 6.1 g L-1
PrEtE, 188.5 + 12.5 to 239.5 + 21.6 g L-1 BuEtE and 22.5 + 2.2 to 26.5 + 4.6 mg L-1 LAEtE.
Nevertheless, concentrations of these esters tended to be lower in the control and OptiWhite
samples. The highest concentration of LAEtE was produced by strain X5 in the presence of
Fermaid E (32.5 + 8.0 mg L-1), whereas PrEtE and BuEtE were most evident in the Fermaid
E as well (92.0 + 1.3 and 202.0 + 28.3 g L-1, respectively). Regarding the succinic acid
diethyl ester (SAdiEtE), the presence of Superstart promoted the highest formation of this
ester by both yeast strains (1388.5 + 240.2 and 1539.5 + 41.8 g L-1, respectively).

84
Table 4-3 Concentration of ethyl esters and diethyl ester found in finished Scheurebe wines developed by two yeast strains with four nutrient
sources and without nutrient
Yeast Nutrient PrEtE (g L-1) BuEtE (g L-1) iBuEtE (g L-1) LAEtE (mg L-1) SAdiEtE (g L-1)
EC1118 Control 100.0 + 11.8 a 223.0 + 18.5 abc 44.5 + 4.8 a 22.5 + 2.2 bc 818.0 + 170.8 d
OptiWhite 100.5 + 0.7 ab 188.5 + 12.5 bcd 41.5 + 2.3 a 23.0 + 1.8 bc 1149.0 + 80.7 bc
Superstart 111.5 + 9.1 a 237.0 + 5.7 ab 51.5 + 4.4 a 25.5 + 0.9 abc 1388.5 + 240.2 ab
DAP 119.5 + 6.1 a 239.5 + 21.6 a 47.5 + 3.5 a 26.5 + 4.6 ab 810.5 + 12.2 d
Fermaid E 114.5 + 0.5 a 222.0 + 5.4 abc 48.0 + 1.4 a 25.5 + 1.3 abc 846.5 + 45.5 d
X5 Control 71.0 + 13.7 c 162.5 + 6.1 d 40.0 + 7.1 a 18.5 + 0.6 c 1311.5 + 78.4 ab
OptiWhite 76.0 + 12.7 bc 164.5 + 13.5 d 44.0 + 6.5 a 20.0 + 1.3 bc 1271.5 + 16.3 b
Superstart 65.5 + 25.3 c 182.5 + 39.1 cd 48.5 + 13.4 a 21.5 + 2.2 bc 1529.5 + 41.8 a
DAP 73.0 + 12.7 bc 170.0 + 26.9 d 39.0 + 5.3 a 21.0 + 0.5 bc 944.0 + 93.1 cd
Fermaid E 92.0 + 1.3 abc 202.0 + 28.3 abcd 50.5 + 3.7 a 32.5 + 8.0 a 1269.0 + 4.2 b
Each value shows the mean + standard deviation. Values displaying the same letter (only ‗a‘) within the same column indicate no significant
difference (p>0.05), whereas those displaying different letters are significantly different (p<0.05) according to the DMRT test.

85
Figure 4-6 Formation of acetic acid esters in finished Scheurebe grape wines developed by
two yeast strains with four nutrient sources and without nutrient (*10 =
concentration of compound times 10)
Vertical bars represent standard deviations from two fermentation replicates. Means followed
by different letters on the top of the bar are significantly different (p<0.05) between treatment
combinations of each acetic acid ester, whereas means followed by the same letters are not
significantly different (p>0.05) according to the DMRT test.
Medium-chain fatty acids (MCFAs) and their ethyl esters: Table 4-4 shows that the yeast
strain and the nutrient supplementation significantly affected the formation of hexanoic acid
ethyl ester (HAEtE) only. The two yeast strains showed different patterns of HAEtE
production in response to the nitrogen source addition. The EC1118 strain produced the
highest amount of HAEtE in most treatments (685.5 + 8.0, 690.5 + 6.7, 714.5 + 5.3 and
724.0 + 9.6 g L-1, respectively), except in the OptiWhite sample. The wine treatments had
similar concentrations of MCFAs ranging from 7.5 + 0.7 to 9.5 + 0.4 mg L-1 hexanoic
acid, 7.5 + 0.6 to 9.5 + 0.3 mg L-1 octanoic acid and 1.6 + 0.5 to 2.1 + 0.2 mg L-1 decanoic
acid. Concentrations of octanoic acid ethyl ester (OAEtE) and decanoic acid ethyl ester
(DAEtE) were also similar among the wine samples that ranged from 1097.0 + 121.5 to
1325.0 + 1.3 g L-1 and 383.0 + 33.9 to 453.5 + 19.0 g L-1, respectively.
Monoterpenes: As shown in Figure 4-7, the results show that the two yeast strains and
nutrient sources did not affect the concentrations of all monoterpenes detected in wines.
Nevertheless, all monoterpenes tended to slightly increase with the addition of any nutrient
source. All wine treatments contained 124.4 + 3.4 to 134.2 + 4.0 g L-1 of trans-linalool oxide,
30.2 + 1.3 to 35.4 + 1.7 g L-1 of cis-linalool oxide, 34.2 + 1.5 to 40.7 + 3.0 g L-1 of linalool
and 70.0 + 0.8 to 73.1 + 0.2 g L-1 of -terpineol.
53
.2 a
b
39
.6 b
28
.7 b
c
23
.7 c
10
2.5
a
87
.8 a
11
1.7
a
85
.0 d
e
40
.8 b
41
.5 b
24
.9 b
c
27
.9 b
c
88
.8 a
90
.1 a
94
.2 c
de
79
.9 e
58
.7 a
b
57
.1 a
b
29
.0 b
c
29
.6 b
c
10
0.0
a
95
.7 a
10
6.3
ab
c
10
6.2
ab
c
63
.7 a
b
43
.5 b
28
.3 b
c
23
.9 c
11
0.3
a 99
.3 a
97
.1 b
cd
80
.8 e
69
.1 a
74
.5 a
30
.6 a
b
36
.8 a
10
0.7
a
10
5.0
a
11
0.3
ab
10
0.1
ab
c
0
35
70
105
140
EC1118 X5 EC1118 X5 EC1118 X5 EC1118 X5
Acetic acid 3-methylbutyl ester*10 Acetic acid 2-methylbutyl ester Acetic acid hexyl ester Acetic acid 2-phenyl ethyl ester
Co
nc
en
tra
tio
n (
g L
-1)
Control OptiWhite Superstart DAP Fermaid E

86
Table 4-4 Concentration of fatty acids and their esters found in finished Scheurebe wines developed by two yeast strains with four nutrient
sources and without nutrient
Yeast Nutrient Hexanoic acid
(mg L-1)
Octanoic acid
(mg L-1)
Decanoic acid
(mg L-1)
HAEtE
(g L-1)
OAEtE
(g L-1)
DAEtE
(g L-1)
EC1118 Control 9.0 + 0.2 a 9.0 + 0.3 a 2.1 + 0.2 a 685.5 + 8.0 a 1200.5 + 26.5 a 423.0 + 28.4 a
OptiWhite 8.5 + 0.6 a 8.0 + 0.0 a 1.7 + 0.1 a 617.0 + 16.7 b 1176.5 + 30.6 a 386.0 + 22.9 a
Superstart 8.5 + 0.6 a 8.5 + 0.8 a 1.6 + 0.5 a 690.5 + 6.7 a 1238.5 + 0.7 a 383.0 + 33.9 a
DAP 9.5 + 0.4 a 9.5 + 0.3 a 2.0 + 0.0 a 714.5 + 5.3 a 1272.5 + 37.6 a 409.0 + 16.6 a
Fermaid E 9.0 + 1.1 a 9.0 + 1.1 a 1.8 + 0.4 a 724.0 + 9.6 a 1325.0 + 1.3 a 428.5 + 52.1 a
X5 Control 8.0 + 0.2 a 8.0 + 0.0 a 1.7 + 0.1 a 547.0 + 12.2 cd 1127.0 + 2.8 a 453.5 + 19.0 a
OptiWhite 7.5 + 0.2 a 8.0 + 0.1 a 1.8 + 0.2 a 531.0 + 9.4 d 1097.0 + 121.5 a 396.0 + 35.8 a
Superstart 8.0 + 0.1 a 7.5 + 0.6 a 1.7 + 0.3 a 599.5 + 0.6 bc 1225.0 + 113.4 a 425.5 + 5.9 a
DAP 8.0 + 0.2 a 8.5 + 0.5 a 2.0 + 0.1 a 563.5 + 56.8 bcd 1123.5 + 3.6 a 442.0 + 8.4 a
Fermaid E 8.0 + 0.2 a 7.5 + 2.2 a 1.6 + 0.7 a 600.5 + 41.7 bc 1189.0 + 18.1 a 412.5 + 31.6 a
Each value shows the mean + standard deviation. Values displaying the same letter (only ‗a‘) within the same column indicate no significant
difference (p>0.05), whereas those displaying different letters are significantly different (p<0.05) according to the DMRT test.

87
Figure 4-7 Formation of monoterpenes in finished Scheurebe grape wines developed by two yeast strains with four nutrient sources and
without nutrient
Vertical bars represent standard deviations from two fermentation replicates. Monoterpenes displaying “(ns)” show no significant difference
(p>0.05) between treatment combinations of each monoterpene according to the DMRT test.
127.0
32.3
30.2 3
8.3
40.7
70.0
70.6
131.0
127.9
33.9
33.4
36.6
37.2
71.2
71.4
125.9 134.2
32.1
33.3 37.7
36.4
71.0
73.1
130.9
130.1
32.6
33.3
36.6
37.2
72.8
72.2
133.0
133.6
35.0
35.4
34.2
36.3
72.0
72.2
124.4
0
30
60
90
120
150
EC1118 X5 EC1118 X5 EC1118 X5 EC1118 X5
trans-Linalool oxide (ns) cis-Linalool oxide (ns) Linalool (ns) alpha-Terpineol (ns)
Co
ncen
trati
on
(
g L
-1)
Control OptiWhite Superstart DAP Fermaid E

88
4.1.2 Effect of thirteen commercial Saccharomyces yeast strains on fermentative
characteristics, metabolic compounds and wine aromas of Scheurebe grape wines
Fermentation was performed in fresh Scheurebe grape juices from the 2008. Thirteen
commercial yeast strains, EC1118, Sauvignon, VL3, X5, X16, VIN 13, Alchemy I, Alchemy II,
4F9, LVCB, LittoLevure, AWRI R2 and QA23 were used for the fermentation of this grape
juice. The investigated results of the fermentation kinetics, some metabolic and aroma
compounds of Scheurebe wines are described below.
Growth kinetics: The result in Figure 4-8 shows significantly different growth kinetics of
thirteen yeast fermentations. Sacchromyces strains EC1118, VIN13 and AWRI R2 were the
strongest and fastest yeast fermenters (13 days) followed by VL3 and X5 (20 days), whereas
the Alchemy II and QA23 strains were the slowest (35 days). The grape juice fermentations
with strains Sauvignon, Alchemy I, 4F9, LVCB and LittoLevure resulted in stuck
fermentations with long fermentation durations ranging from 25 to 35 days and high residual
sugar concentrations (Figure 4-9), while the other strains successfully completed
fermentations. Although the fermentation of strain QA23 was very slow, it was completed
within 35 days with low residual sugar in the final wine.
Chemical compositions: Figure 4-9 shows that the Sauvignon, LVCB and LittoLevure
strains produced wine having the highest residual sugar (26.3 + 3.3, 24.5 + 3.5 and 25.6 +
1.8 g L-1, respectively), followed by strains 4F9 and Alchemy I. While, wines obtained from
the other yeast strains had low amounts of residual sugar reaching dryness (1.2 + 0.2
to 4.9 + 0.5 g L-1). There was a statistical difference for the glycerol production by the
inoculated thirteen commercial yeast strains. The EC1118 and X16 strains were the highest
glycerol producers (4.3 + 0.1 and 4.4 + 0.2 g L-1, respectively) followed by strain VL3 (4.2 +
0.1 g L-1). In contrast, strains Sauvignon, 4F9 and LVCB were the lowest producers of this
compound (3.6 + 0.2, 3.7 + 0.2 and 3.7 + 0.1 g L-1, respectively).
Organic acids: Table 4-5 demonstrates that the wines produced by thirteen yeast strains
had similar concentrations of tartaric, malic and shikimic acids which ranged from 0.85 + 0.08
to 1.23 + 0.30 g L-1, 4.83 + 0.16 to 5.23 + 0.21 g L-1 and 42.79 + 0.40 to 45.19 + 1.38 mg L-1,
respectively. However, most yeast strains seemed to degrade approximately 13-20 % malic
acid from 6.03 g L-1 in initial grape juice. The EC1118 strain produced the highest amounts of
lactic acid (0.14 + 0.00 g L-1) followed by the AWRI R2, QA23 and VIN13 strains (0.12 + 0.00,
0.10 + 0.02 and 0.10 + 0.01 g L-1, respectively), whereas strain X16 produced the lowest

89
amount (0.06 + 0.01 g L-1). On the other hand, strain EC1118 and strain VIN13 produced
lower amount of acetic acid (0.24 + 0.01 and 0.20 + 0.02 g L-1) than the other strains.
Regarding citric acid, its level was most evident in the VL3 and QA23 wines (0.25 + 0.02 and
0.25 + 0.06 g L-1, respectively) followed by strains EC1118 and X16 (0.22 + 0.02 and 0.22 +
0.01 g L-1, respectively), while the other wines had similar low levels.
Figure 4-8 Growth kinetics of fresh Scheurebe grape juice fermentations with 13 different
commercial yeast strains
Figure 4-9 Concentration of residual sugar and glycerol in finished Scheurebe grape wines
produced by 13 different yeast strains
Vertical bars represent standard deviations from three fermentation replicates. Means
followed by different letters on the top of the bar are significantly different (p<0.05) among
yeast strains of each compound according to the DMRT test.
0
10
20
30
40
50
60
70
80
1 4 7 10 13 16 19 22 25 28 31 34
Fermentation days
carb
on
dio
xid
e (
g L
-1)
EC1118 DSM Sauvignon
VL3 X5
X16 VIN13
Alchemy I Alchemy II
DSM 4F9 DSM LVCB
LittoLevure AWRI R2
QA231
.2 d4
.3 a
26
.3 a
3.6
g
2.3
d
4.2
ab
1.9
d
4.1
bc
3.8
d
4.4
a
1.2
d3.9
cd
10
.3 c
3.8
de
f
4.9
d
3.8
de
f
18
.1 b
3.7
fg
24
.5 a
3.7
fg
25
.6 a
3.8
de
f
1.7
d
3.8
de
f
3.0
d
4.1
bc
0
10
20
30
Glycerol Residual sugar
Co
nc
en
tra
tio
n (
g L
-1)
EC1118 Sauvignon VL3 X5 X16 VIN13 Alchemy I
Alchemy II 4F9 DSM LVCB LittoLevure AWRI R2 QA23

90
Table 4-5 Concentration of organic acids found in finished Scheurebe wines developed by 13 yeast strains
Yeast Tartaric acid (g L-1) Malic acid (g L-1) Lactic acid (g L-1) Shikimic acid (mg L-1) Acetic acid (g L-1) Citric acid (g L-1)
EC1118 0.90 + 0.09 a 5.18 + 0.46 a 0.14 + 0.00 a 43.27 + 1.00 a 0.24 + 0.01 b 0.22 + 0.02 abc
Sauvignon 1.00+ 0.15 a 4.99 + 0.10 a 0.08 + 0.02 def 43.57 + 0.42 a 0.39 + 0.02 a 0.19 + 0.01 cd
VL3 1.00 + 0.18 a 5.01 + 0.06 a 0.08 + 0.02 def 44.52 + 0.77 a 0.37 + 0.01 a 0.25 + 0.02 a
X5 0.85 + 0.08 a 4.99 + 0.09 a 0.09 + 0.01 cde 42.79 + 0.40 a 0.36 + 0.03 a 0.21 + 0.01 bc
X16 1.01 + 0.12 a 4.90 + 0.10 a 0.06 + 0.01 f 43.88 + 0.93 a 0.38 + 0.02 a 0.22 + 0.01 abc
VIN13 0.91 + 0.08 a 5.02 + 0.11 a 0.10 + 0.01 bcd 43.91 + 0.62 a 0.20 + 0.02 b 0.18 + 0.01 d
Alchemy I 1.02 + 0.18 a 5.04 + 0.19 a 0.07 + 0.01 ef 43.80 + 0.17 a 0.34 + 0.01 a 0.18 + 0.00 d
Alchemy II 1.23 + 0.30 a 4.83 + 0.16 a 0.08 + 0.01 def 43.83 + 1.00 a 0.37 + 0.02 a 0.19 + 0.01 cd
4F9 1.20 + 0.24 a 5.03 + 0.21 a 0.08 + 0.01 def 44.00 + 2.25 a 0.36 + 0.04 a 0.19 + 0.00 cd
LVCB 0.93 + 0.10 a 5.23 + 0.01 a 0.08 + 0.01 def 43.47 + 0.30 a 0.37 + 0.04 a 0.19 + 0.00 cd
LittoLevure 1.06 + 0.26 a 5.13 + 0.13 a 0.08 + 0.01 def 43.54 + 0.32 a 0.38 + 0.01 a 0.19 + 0.00 cd
AWRI R2 0.88 + 0.07 a 5.00 + 0.18 a 0.12 + 0.00 b 44.23 + 0.13 a 0.34 + 0.03 a 0.19 + 0.00 cd
QA23 1.08 + 0.32 a 5.21 + 0.09 a 0.10 + 0.02 bc 45.19 + 1.38 a 0.34 + 0.06 a 0.25 + 0.06 a
Each value shows the mean + standard deviation.
Values displaying the same letter (only ‗a‘) within the same column indicate no significant difference (p>0.05) among yeast strains, whereas
those displaying different letters are significantly different (p<0.05) according to the DMRT test.

91
SO2-binding compounds: As shown in Figure 4-10, strains VL3, X5 and X16 were the
highest producers of not only -ketoglutarate (32.4 + 1.8, 32.8 + 1.4 and 26.3 + 1.3 mg L-1,
respectively), but also acetaldehyde (62.7 + 0.4, 65.1 + 3.7 and 62.0 + 7.7 mg L-1,
respectively), however produced low pyruvate. Strain EC1118 was the highest producer of -
ketoglutarate and pyruvate (27.7 + 1.8 and 29.0 + 3.4 mg L-1), but the lowest producer of
acetaldehyde (41.9 + 1.1 mg L-1). In addition, acetaldehyde concentration was also most
evident in the Sauvignon, Alchemy I, 4F9, LVCB and LittoLevure wines (63.1 + 1.4, 55.7 +
2.7, 56.6 + 6.4, 58.5 + 1.6 and 64.4 + 4.0 mg L-1, respectively). Interestingly, strain VIN13
seemed to be the lowest SO2-binding compound producer.
Sulphur containing compounds: Figure 4-11 displays some differences among the yeast
strains in terms of H2S, dimethyl sulphide (DMS) and carbon disulphide (CS2) in the
Scheurebe wines. The Sauvignon strain was the highest producer of H2S and CS2 (3.4 + 0.6
and 2.3 + 0.2 g L-1, respectively) followed by strains EC1118, X16 and VIN13, respectively.
The concentration of CS2 was also most evident in the QA23 wine (2.1 + 0.1 g L-1), but H2S
was not detectable in this wine. The thirteen yeast strains developed similar amounts of DMS
ranging from 1.1 + 0.1 to 1.7 + 0.2 g L-1). The other investigated sulphur compounds,
ethanethiol, methanethiol, dimethyl disulphide, thioacetic acid S-methylester and thioacetic
acid S-ethylester were not detected in all wine treatments.
Figure 4-10 Concentration of SO2-binding compounds in finished Scheurebe grape wines
produced by 13 different yeast strains
Vertical bars represent standard deviations from three fermentation replicates. Means
followed by different letters on the top of the bar are significantly different (p<0.05) among the
yeast strains of each compound according to the DMRT test.
41
.9 c
29
.0 a
27
.7 a
b
63
.1 a
22
.6 c
24
.4 b
62
.7 a
12
.9 d
e
32
.4 a
65
.1 a
15
.9 d
32
.8 a
62
.0 a
10
.4 e
26
.3 a
b
41
.5 c
13
.9 d
e
15
.6 c
55
.7 a
b
20
.7 c
22
.4 b
49
.1 b
c
23
.7 b
c
24
.3 b
56
.6 a
b
27
.4 a
b
25
.1 b
58
.5 a
23
.5 b
c
21
.2 b
c
64
.4 a
24
.7 b
c
22
.7 b
47
.7 b
c
14
.7 d
23
.2 b
49
.2 b
c
22
.2 c
21
.0 b
c
0
20
40
60
80
alpha-Ketoglutarate Pyruvate Acetaldehyde
Co
ncen
trati
on
(m
g L
-1)
EC1118 Sauvignon VL3 X5 X16 VIN13 Alchemy I
Alchemy II 4F9 DSM LVCB LittoLevure AWRI R2 QA23

92
Figure 4-11 Formation of hydrogen sulphide, dimethyl sulphide and carbon disulphide in
finished Scheurebe grape wines produced by 13 different yeast strains
Vertical bars represent standard deviations from three fermentation replicates. Means
followed by different letters on the top of the bar are significantly different (p<0.05) among
yeast strains of each compound, whereas means followed by the same letters are not
significantly different (p>0.05) according to the DMRT test.
Higher alcohols: As shown in Table 4-6, the production of 2-methyl propanol and 3-methyl
butanol slightly differed among the yeast strains used. Strain EC1118 seemed to be the
predominant producer of the last two alcohols (28.7 + 3.5 and 153.3 + 16.8 mg L-1,
respectively). The highest concentration of 2-methyl propanol was also produced by strain
Alchemy II (29.3 + 6.1 mg L-1), followed by strains X16, 4F9, LVCB and AWRI 2 (24.7 + 0.6,
25.0 + 6.2, 26.7 + 10.4 and 26.3 + 2.5 mg L-1, respectively). The formation of hexanol and 2-
methyl butanol behaved similarly across the thirteen yeast strains used. They produced
similar concentrations ranging from 1745.7 + 198.8 to 2187.3 + 126.5 mg L-1 of hexanol and
18.0 + 3.0 to 26.0 + 4.6 mg L-1 of 2-methyl butanol. Regarding the 2-phenyl ethanol, its
concentration was most evident in the VL3 wine (24.4 + 1.7 mg L-1) followed by the QA23,
EC1118 and X16 wines (23.8 + 0.5, 23.3 + 1.6, 23.3 + 1.6 and 23.4 + 0.7 mg L-1, respectively)
as shown in Figure 4-12.
Acetic acid esters: The results in Figure 4-12 and Figure 4-13 demonstrate significantly
different formation of acetic acid esters that varied among the commercial yeast strains used.
The VIN13 strain was the most predominant acetic acid ester producer, except for acetic acid
ethyl ester. It produced wine containing the highest amounts of acetic acid 3-methylbytyl
ester, acetic acid 2-methylbytyl ester, acetic acid 2-phenylethyl ester and acetic acid hexyl
ester ranging from 800.6 + 128.2 g L-1, 49.1 + 4.3 g L-1, 124.1 + 1.5 g L-1 and 136.3
+ 2.2 g L-1. Interestingly, strains 4F9 and LittoLevure developed only trace amounts of
2.5
b
1.2
a 1.6
c
3.4
a
1.6
a
2.3
a
n.d
.
1.4
a
n.d
.
n.d
.
1.4
a
n.d
.
2.2
b
1.6
a
1.1
d
1.6
c
1.2
a
0.8
e
n.d
.
1.7
a
n.d
.
n.d
.
1.3
a
n.d
.
1.1
d
1.5
a
0.3
g
n.d
.
1.6
a
n.d
.
1.4
c
1.5
a
0.4
f
n.d
.
1.1
a
n.d
.
n.d
.
1.7
a 2.1
a
0
1
2
3
4
Hydrogen sulphide Dimethyl sulphide Carbon disulphide
Co
ncen
trati
on
(
g L
-1)
EC1118 Sauvignon VL3 X5 X16 VIN13 Alchemy I
Alchemy II 4F9 DSM LVCB LittoLevure AWRI R2 QA23

93
acetic acid ethyl ester, while the remaining yeast strains (excluding VIN13) produced similar
high amounts ranging from 53.3 + 5.1 to 90.0 + 12.0 mg L-1 (Figure 4-12). Strain EC1118
also seemed to produce high amounts of most acetic acid esters, although slightly lower than
the formation by strain VIN13. High concentrations of acetic acid 2-phenylethyl ester were
also evident in the AWRI R2 and VL3 wines (107.4 + 7.2 and 104.1 + 3.4 g L-1, respectively).
It seemed that there was a positive correlation between the higher concentration of 2-phenyl
ethanol (Figure 4-12) and the greater acetic acid 2-phenyl ethyl ester formation by strains
EC1118 and VL3 (Figure 4-13).
Table 4-6 Concentration of higher alcohols found in finished Scheurebe wines developed by
13 yeast strains
Yeast 2-Methyl propanol
(mg L-1)
Hexanol
(g L-1)
3-Methyl butanol
(mg L-1)
2-Methyl butanol
(mg L-1)
EC1118 28.7 + 3.5 a 2187.3 + 126.5 a 153.3 + 16.8 a 25.3 + 3.1 a
Sauvignon 22.0 + 3.0 abc 1909.0 + 105.0 a 96.3 + 6.1 bc 22.0 + 1.7 a
VL3 20.7 + 2.3 abc 2033.7 + 108.2 a 113.3 + 11.5 bc 22.7 + 2.3 a
X5 14.7 + 2.5 c 1885.0 + 115.4 a 94.0 + 15.0 bc 18.0 + 3.0 a
X16 24.7 + 0.6 ab 2147.0 + 91.8 a 108.7 + 1.5 bc 25.3 + 0.6 a
VIN13 17.0 + 3.6 bc 1758.0 + 198.6 a 104.0 + 18.5 bc 21.0 + 3.0 a
Alchemy I 21.7 + 1.5 abc 2031.0 + 45.9 a 105.7 + 4.2 bc 21.3 + 1.1 a
Alchemy II 29.3 + 6.1 a 2039.3 + 167.3 a 119.7 + 17.6 bc 26.0 + 4.6 a
4F9 25.0 + 6.2 ab 1745.7 + 198.8 a 96.7 + 18.1 bc 22.3 + 4.7 a
LVCB 26.7 + 10.4 ab 1863.3 + 306.2 a 102.7 + 32.8 bc 23.7 + 8.4 a
LittoLevure 20.7 + 8.0 abc 1694.0 + 302.1 a 85.7 + 32.2 c 19.7 + 8.0 a
AWRI R2 26.3 + 2.5 ab 2088.7 + 113.8 a 118.7 + 11.9 bc 24.7 + 3.1 a
QA23 20.3 + 4.9 abc 1991.0 + 447.5 a 127.0 + 15.1 ab 22.0 + 4.6 a
Each value shows the mean + standard deviation.
Values displaying the same letter (only ‗a‘) within the same column indicate no significant
difference (p>0.05) among the yeast strains, whereas those displaying different letters are
significantly different (p<0.05) according to the DMRT test.

94
Figure 4-12 Formation of 2-phenyl ethanol and acetic acid ethyl ester in finished Scheurebe
grape wines produced by 13 different yeast strains
Vertical bars represent standard deviations from three fermentation replicates. Means
followed by different letters on the top of the bar are significantly different (p<0.05) among the
yeast strains of each compound according to the DMRT test.
n.q. denotes not quantified or traced
Figure 4-13 Formation of acetic acid esters found in finished Scheurebe grape wines
developed by 13 different yeast strains (*10 = concentration of compound
times 10)
Vertical bars represent standard deviations from three fermentation replicates. Means
followed by different letters on the top of the bar are significantly different (p<0.05) among
yeast strains of each compound according to the DMRT test.
81
.1 a
23
.3 a
bc
54
.8 a
21
.3 b
cd
90
.0 a
24
.4 a
55
.7 a
18
.5 e
f
74
.0 a
23
.4 a
bc
10
.0 b
17
.8 f
53
.3 a
20
.2 d
ef
83
.0 a
21
.7 b
cd
n.q
.
20
.8 d
e
79
.3 a
20
.8 d
e
n.q
.
21
.4 b
cd
64
.1 a
20
.8 c
de
88
.3 a
23
.8 a
b
0
20
40
60
80
100
2-Phenyl ethanol Acetic acid ethyl ester
Co
ncen
trati
on
(m
g L
-1)
EC1118 Sauvignon VL3 X5 X16 VIN13 Alchemy I
Alchemy II 4F9 DSM LVCB LittoLevure AWRI R2 QA23
55.6
b
29.3
bc
119.1
ab
104.3
ab
12.9
ef
19.6
ef
70.4
de
68.0
e
20.6
def
18.0
ef
80.3
cd
e 104.1
ab
15.4
def
14.1
f
76.9
cd
e
69.8
e
28.0
cd
e
28.3
bcd
86.9
cd
93.6
bc
80.1
a
49.1
a
136.3
a
124.1
a
22.0
def
21.5
def
93.0
c
72.1
e
24.8
cd
ef
21.9
de
83.9
cd
e
79.4
cd
e
15.6
def
20.2
ef
63.7
e
78.6
cd
e
16.6
def
21.9
de
74.5
cd
e
72.9
de
8.1
f
17.7
ef
66.2
de
70.6
e
40.6
c
29.8
b
114.7
b
107.4
ab
31.6
cd
22.7
cd
e
75.3
cd
e
92.1
bcd
0
35
70
105
140
Acetic acid 3-methylbutyl ester*10
Acetic acid 2-methylbutyl ester
Acetic acid hexyl ester Acetic acid 2-phenyl ethyl ester
Co
ncen
trati
on
(
g L
-1)
EC1118 Sauvignon VL3 X5 X16 VIN13 Alchemy IAlchemy II 4F9 DSM LVCB LittoLevure AWRI R2 QA23

95
Table 4-7 Concentration of ethyl esters and diethyl ester found in finished Scheurebe wines fermented with 13 yeast strains
Yeast PrEtE (g L-1) BuEtE (g L-1) iBuEtE (g L-1) LAEtE (mg L-1) SAdiEtE (g L-1)
EC1118 119.3 + 10.2 a 215.0 + 11.4 abc 58.3 + 5.1 bcd 25.7 + 1.5 a 1467.3 + 88.2 a
Sauvignon 30.0 + 2.7 cd 263.0 + 17.8 ab 42.7 + 4.2 efg 13.7 + 0.6 de 334.3 + 68.1 d
VL3 51.3 + 7.0 bc 143.0 + 10.5 de 74.7 + 7.1 a 15.0 + 1.0 cde 1577.7 + 140.0 a
X5 64.7 + 15.5 b 121.7 + 14.0 e 38.7 + 6.5 fg 15.3 + 0.6 cde 1562.0 + 20.3 a
X16 48.7 + 2.5 bc 240.3 + 17.0 abc 70.0 + 3.0 ab 14.0 + 0.0 de 1171.7 + 107.9 b
VIN13 53.3 + 5.5 bc 221.7 + 19.6 abc 33.0 + 3.6 g 16.0 + 2.0 cd 1238.0 + 11.8 b
Alchemy I 34.3 + 2.1 cd 229.7 + 9.0 abc 44.7 + 0.6 defg 14.3 + 0.6 cde 661.0 + 83.4 c
Alchemy II 39.7 + 8.5 cd 248.0 + 32.1 abc 56.3 + 7.1 cde 15.7 + 1.5 cde 714.0 + 26.5 c
4F9 30.3 + 10.2 cd 259.7 + 53.0 ab 46.3 + 11.6 defg 13.7 + 2.1 de 454.3 + 208.8 d
LVCB 31.0 + 14.8 cd 273.3 + 55.7 a 45.0 + 12.5 defg 14.0 + 2.6 de 377.3 + 121.1 d
LittoLevure 22.0 + 2.7 d 225.3 + 51.8 abc 35.0 + 12.1 fg 13.0 + 2.0 e 405.7 + 29.5 d
AWRI R2 52.0 + 6.0 bc 188.0 + 17.1 cd 67.7 + 5.5 abc 18.7 + 0.6 b 740.7 + 57.9 c
QA23 67.3 + 15.6 b 210.0 + 46.5 bc 48.3 + 6.8 def 17.0 + 1.0 bc 805.0 + 124.9 c
Each value shows the mean + standard deviation from three fermentation replicates.
Values displaying different letters within the same column are significantly different (p<0.05) according to the DMRT test.
96
Ethyl esters and diethyl ester: The results in Table 4-7 show the difference of these
compounds among the thirteen yeast strains inoculated. The EC1118 strain was the most
predominant strain of PrEtE, LAEtE and SAdiEtE productions (119.3 + 10.2 g L-1, 25.7
+ 1.5 mg L-1 and 1467.3 + 88.2 g L-1, respectively). Concentration of SAdiEtE was also
most obvious in the VL3 and X5 wines (1577.7 + 140.0 and 1562.0 + 20.3 g L-1,
respectively). Strain LVCB developed the highest amounts of BuEtE (273.3 + 55.7 g L-1)
followed by strains Sauvignon and 4F9 (263.0 + 17.8 and 259.7 + 53.0 g L-1, respectively),
while low amounts were produced by the VL3 and X5 strains. The highest concentration of
iBuEtE was present in the VL3 and X16 wines (74.7 + 7.1 and 70.0 + 3.0 g L-1, respectively)
followed by the AWRI R2 wine (67.7 + 5.5 g L-1).
Medium-chain fatty acids and their esters: Like the other aroma compounds,
concentrations of MCFAs and their ethyl esters were significantly influenced by the
commercial yeast strains inoculated, except for DAEtE as given in Table 4-8. The thirteen
yeast strains produced similar concentrations of DAEtE ranging from 403.7 + 158.2 to 565.0
+ 13.2 g L-1. The five strains of Alchemy I and II, 4F9, LVCB and LittoLevure similarly
developed the highest amounts of not only hexanoic, octanoic and decanoic acids (12.3 +
0.6 to 14.0 + 1.7 mg L-1, 11.0 + 0.0 to 13.0 + 1.0 mg L-1 and 2.6 + 0.1 to 2.9 + 0.3 mg L-1,
respectively) but also HAEtE and OAEtE ranging from 949.7 + 72.2 to 988.7 + 68.6 g L-1
and 1426.7 + 104.9 to 1590.0 + 58.8 g L-1, respectively. Strain Sauvignon also produced
high amounts of these compounds, except for decanoic acid. High amounts of decanoic acid
were also present in the VIN13 wine. On the contrary, the VL3 strain tended to be the low
producer of these compounds, excluding DAEtE.
Monoterpenes: Figure 4-14 demonstrates that the thirteen yeast strains significantly
affected only the liberation of linalool. The X5, VIN13, Alchemy II and VL3 strains similarly
released high amounts of linalool (42.6 + 1.7, 42.9 + 2.2, 42.6 + 2.1 and 41.3 + 0.7 g L-1,
respectively), on the contrary, strains EC1118 and Sauvignon seemed to liberate low
amounts (36.8 + 1.5 and 36.3 + 1.0 g L-1, respectively). Other monoterpenes, trans-linalool
oxide, cis-linalool oxide and -terpineol were liberated similarly among all yeast strains that
ranged from 127.0 + 5.5 to 136.8 + 5.9 g L-1, 31.8 + 2.4 to 34.3 + 0.6 g L-1 and 70.4 + 8.7
to 79.3 + 6.5 g L-1, respectively.

97
Table 4-8 Concentration of fatty acids and their ethyl esters found in finished Scheurebe wines fermented with 13 yeast strains
Yeast Hexanoic acid
(mg L-1)
Octanoic acid
(mg L-1)
Decanoic acid
(mg L-1)
HAEtE (g L-1) OAEtE (g L-1) DAEtE (g L-1)
EC1118 9.0 + 0.0 b 9.3 + 0.6 cd 2.0 + 0.1 abc 698.0 + 10.6 de 1343.0 + 32.0 ab 531.0 + 15.9 a
Sauvignon 12.7 + 1.5 a 11.0 + 2.0 abc 1.6 + 1.1 c 960.3 + 46.3 abc 1425.7 + 78.2 a 447.3 + 43.5 a
VL3 7.0 + 0.0 c 7.0 + 0.0 d 1.6 + 0.1 c 488.7 + 26.5 f 1011.7 + 47.1 b 427.0 + 7.2 a
X5 7.0 + 0.0 c 7.3 + 0.6 d 2.0 + 0.1 abc 482.7 + 37.5 f 1003.3 + 88.9 b 461.3 + 8.3 a
X16 10.0 + 1.0 b 8.7 + 1.5 cd 1.9 + 0.6 bc 827.3 + 61.0 bcd 1215.3 + 248.5 ab 403.7 + 158.2 a
VIN13 9.7 + 0.6 b 10.0 + 0.0 bc 2.5 + 0.1 ab 809.0 + 47.3 cde 1443.3 + 59.5 a 565.0 + 13.2 a
Alchemy I 12.3 + 0.6 a 11.0 + 0.0 abc 2.6 + 0.1 ab 973.0 + 41.6 ab 1440.3 + 137.1 a 432.7 + 50.9 a
Alchemy II 13.0 + 0.0 a 12.0 + 0.0 ab 2.7 + 0.2 ab 988.7 + 68.6 a 1590.0 + 58.8 a 513.7 + 13.6 a
4F9 13.3 + 0.6 a 12.7 + 0.6 a 2.9 + 0.3 a 949.7 + 72.2 abc 1433.7 + 262.5 a 513.7 + 84.7 a
LVCB 13.0 + 1.0 a 12.3 + 0.6 ab 2.7 + 0.3 ab 954.7 + 62.0 abc 1448.3 + 153.0 a 430.7 + 39.0 a
LittoLevure 14.0 + 1.7 a 13.0 + 1.0 a 2.8 + 0.5 ab 982.7 + 24.9 ab 1426.7 + 104.9 a 479.7 + 141.4 a
AWRI R2 8.3 + 0.6 bc 9.0 + 0.0 cd 2.0 + 0.1 abc 659.0 + 59.0 e 1260.7 + 9.0 ab 504.7 + 31.7 a
QA23 10.0 + 2.6 b 9.0 + 3.5 cd 1.9 + 0.9 bc 768.7 + 46.3 de 1276.7 + 135.7 ab 407.0 + 104.5 a
Each value shows the mean + standard deviation.
Values displaying the same letter (only ‗a‘) within the same column of each factor indicate no significant difference (p>0.05), whereas those
displaying different letters are significantly different (p<0.05) according to the DMRT test.

98
Figure 4-14 Formation of monoterpenes found in finished Scheurebe grape wines developed by 13 different yeast strains
Vertical bars represent standard deviations from three fermentation replicates. Means followed by different letters on the top of the bar are
significantly different (p<0.05) among yeast strains of each monoterpene, whereas means followed by the same letters are not significantly
different (p>0.05) according to the DMRT test.
74.8
a
36.8
cd
34.3
a
132.1
a
74.8
a
36.3
d
34.3
a
134.5
a
74.0
a
41.3
ab
33.0
a
132.6
a
74.7
a
42.6
a
32.2
a
133.1
a
74.2
a
41.4
ab
c
32.6
a
130.6
a
76.9
a
42.9
a
31.8
a
127.0
a
74.0
a
40.0
ab
cd
32.3
a
129.4
a
76.8
a
42.6
a
32.9
a
134.0
a
78.5
a
40.6
ab
c
32.9
a
134.6
a
76.5
a
38.2
bcd
33.8
a
134.8
a
79.3
a
40.0
ab
cd
33.6
a
136.8
a
73.6
a
40.3
ab
cd
32.1
a
127.9
a
70.4
a
39.2
ab
cd
32.2
a
129.0
a0
40
80
120
160
trans-Linalool oxide cis-Linalool oxide Linalool alpha-Terpineol
Co
ncen
trati
on
(
g L
-1)
EC1118 Sauvignon VL3 X5 X16 VIN13 Alchemy I Alchemy II 4F9 DSM LVCB LittoLevure AWRI R2 QA23

99
4.2 Effects of yeast strains and/or nutrient supplements on wine fermentation and
quality of Sauvignon blanc grape wines
The experimental results which are described in the following chapters were obtained from
Sauvignon blanc grape juice fermented with different commercial Saccharomyces yeast
strains and/or nutrient sources at different concentrations.
4.2.1 Effect of nine commercial Saccharomyces yeast strains and two nutrient sources
on fermentative characteristics, metabolic compounds and wine aromas of Sauvignon
blanc grape wines
In 2008, fermentation was performed in fresh Sauvignon blanc juices. Nine commercial yeast
strains; EC1118, Sauvignon, VL3, X5, VIN7, VIN13, 4F9, LVCB and AWRI R2 and two
nutrient sources; OptiWhite (natural inactivated yeast) and Fermaid E (blend of DAP,
thiamine, yeast cell walls and ammonium sulphate) at 0.3 g L-1 were used in the
fermentations. The fermentation kinetics, some metabolic compounds and wine aromas in
final wines were examined.
The fermentation kinetics: The result shows that all fermentation kinetics had a similar
pattern among nutrient sources but varied depending on the nine yeast strains used (Figure
4-15). Strains AWRI R2, X5, VIN13 and VL3 seemed to be the strongest strains and had
similarly faster growth kinetics and shorter fermentation times (11 days). While strains
EC1118, LVCB and 4F9 followed similar patterns, they had however a slightly longer lag
phase. On the other hand, the Sauvignon and VIN7 strains had slow growth kinetics and
fermentation times (16 days), particularly the latter strain seemed to obtain a sluggish
fermentation with four days of lag phase after inoculation. Nevertheless, all treatments
completely finished fermentation depending on the yeast strains. Overall, the addition of
Fermaid E tended to enhance more effective the fermentation kinetic than OptiWhite.
Chemical composition: Both yeast strain and nutrient source had no influence on the
concentrations of residual sugar and glycerol in final wines (Figure 4-16). The nine yeast
strains produced wines having similar amounts of residual sugar and glycerol ranging from
0.3 + 0.1 to 0.9 + 0.2 g L-1 and 4.5 + 0.0 to 6.3 + 0.1 g L-1, respectively. All yeast strains
consumed practically almost initial sugar provided and consequently resulted in low amounts
of residual sugar below 1 g L-1. Nonetheless, strains EC1118, VL3, VIN7 and VIN13 tended
to produce high amounts of glycerol.

100
Figure 4-15 Fermentation kinetics of fresh Sauvignon blanc grape juice fermentations with
nine different commercial yeast strains and two nutrient sources
Figure 4-16 Concentration of residual sugar and glycerol found in finished Sauvignon blanc
grape wines fermented with nine yeast strains and two nutrient sources
Vertical bars represent standard deviations from two fermentation replicates. Compounds
displaying “(ns)” show no significant difference (p>0.05) among treatment combinations of
each compound according to the DMRT test.
0
10
20
30
40
50
60
70
80
1 2 3 4 5 6 7 8 9 10 11 12 13 14 15 16
Carb
on
dio
xid
e (
g L
-1)
Fermentation day
EC1118-Fermaid E EC1118-OptiWhite
Sauvignon-Fermaid E Sauvignon-OptiWhite
VL3-Fermaid E VL3-OptiWhite
X5-Fermaid E X5-OptiWhite
VIN7-Fermaid E VIN7-OptiWhite
VIN13-Fermaid E VIN13-OptiWhite
4F9-Fermaid E 4F9-OptiWhite
LVCB-Fermaid E LVCB-OptiWhite
AWRI R2-Fermaid E AWRI R2-OptiWhite
6.0
5.6
4.5
4.8
5.1
5.2
6.0
5.1
6.3
0.7
0.7
0.7
0.7
0.7
0.7
0.40
.8
0.9
5.1
4.9
5.1
4.7
5.5
5.75.5
4.6
6.3
0.4
0.30
.7
0.6
0.50.7
0.60
.9
0.6
0
1
2
3
4
5
6
7
EC
11
18
Sa
uv
ign
on
VL
3
X5
VIN
7
VIN
13
4F
9
LV
CB
AW
RI
R2
EC
11
18
Sa
uv
ign
on
VL
3
X5
VIN
7
VIN
13
4F
9
LV
CB
AW
RI
R2
Residual sugar (ns) Glycerol (ns)
Co
ncen
trati
on
(g
L-1
)
Fermaid E
OptiWhite

101
Table 4-9 Concentration of organic acids found in finished Sauvignon blanc wines produced by nine yeast strains with two nutrient sources
Yeast Nutrient Tartaric acid
(g L-1)
Malic acid
(g L-1)
Lactic acid
(g L-1)
Shikimic acid
(mg L-1)
Acetic acid
(g L-1)
Citric acid
(g L-1)
EC1118 Fermaid E 3.34 + 0.08 a 5.29 + 0.05 bc 0.19 + 0.00 b 34.03 + 0.19 a 0.29 + 0.00 cde 0.27 + 0.00 b
OptiWhite 3.19 + 0.02 a 5.35 + 0.01 ab 0.16 + 0.00 ef 33.06 + 0.07 a 0.30 + 0.00 cde 0.27 + 0.00 b
Sauvignon Fermaid E 3.14 + 0.16 a 5.16 + 0.05 de 0.16 + 0.00 ef 34.77 + 0.17 a 0.30 + 0.02 cde 0.32 + 0.00 a
OptiWhite 3.04 + 0.16 a 5.08 + 0.02 ef 0.12 + 0.00 ij 34.18 + 0.69 a 0.40 + 0.00 b 0.28 + 0.00 b
VL3 Fermaid E 3.38 + 0.11 a 5.00 + 0.08 fg 0.13 + 0.01 hi 33.80 + 0.63 a 0.29 + 0.00 cde 0.25 + 0.00 b
OptiWhite 3.38 + 0.13 a 4.97 + 0.03 g 0.11 + 0.02 j 33.89 + 0.31 a 0.31 + 0.03 cd 0.26 + 0.00 b
X5 Fermaid E 3.23 + 0.07 a 5.17 + 0.01 de 0.19 + 0.00 b 34.06 + 0.72 a 0.23 + 0.03 ef 0.25 + 0.00 b
OptiWhite 3.26 + 0.25 a 5.20 + 0.01 cd 0.15 + 0.00 fg 34.24 + 0.00 a 0.32 + 0.01 cd 0.26 + 0.00 b
VIN7 Fermaid E 3.54 + 0.21 a 5.19 + 0.02 cd 0.17 + 0.01 cde 33.11 + 0.33 a 0.65 + 0.05 a 0.26 + 0.00 b
OptiWhite 2.89 + 0.42 a 5.20 + 0.06 cd 0.18 + 0.01 cd 32.66 + 0.15 a 0.63 + 0.01 a 0.26 + 0.00 b
VIN13 Fermaid E 3.50 + 0.07 a 5.16 + 0.03 de 0.17 + 0.01 de 33.68 + 0.05 a 0.34 + 0.01 bc 0.27 + 0.00 b
OptiWhite 3.25 + 0.34 a 5.15 + 0.04 de 0.12 + 0.02 ij 33.43 + 0.35 a 0.29 + 0.01 cde 0.28 + 0.00 b
4F9 Fermaid E 3.03 + 0.28 a 5.44 + 0.03 a 0.22 + 0.02 a 33.45 + 0.05 a 0.24 + 0.07 ef 0.26 + 0.00 b
OptiWhite 3.26 + 0.33 a 5.44 + 0.07 a 0.16 + 0.01 ef 33.15 + 0.13 a 0.30 + 0.02 cde 0.27 + 0.00 b
LVCB Fermaid E 2.87 + 0.35 a 5.20 + 0.01 cd 0.22 + 0.01 a 34.12 + 0.10 a 0.19 + 0.07 f 0.26 + 0.00 b
OptiWhite 3.04 + 0.04 a 5.41 + 0.00 a 0.17 + 0.01 de 33.25 + 0.14 a 0.25 + 0.01 def 0.26 + 0.00 b
AWRI R2 Fermaid E 3.16 + 0.10 a 5.36 + 0.08 ab 0.19 + 0.01 b 34.16 + 0.26 a 0.26 + 0.02 def 0.26 + 0.00 b
OptiWhite 3.08 + 0.18 a 5.43 + 0.01 a 0.14 + 0.00 gh 34.25 + 0.97 a 0.29 + 0.09 cde 0.27 + 0.00 b
Each value shows the mean + standard deviation. Values displaying the same letter (only ‗a‘) within the same column indicate no significant
difference (p>0.05) among treatments, whereas those displaying different letters are significantly different (p<0.05) according to the DMRT test.

102
Organic acids: The results in Table 4-9 demonstrate that strains 4F9 and AWRI R2
produced wines containing the highest amounts of malic acid with less response to nutrient
source (5.44 + 0.03, 5.44 + 0.07 and 5.36 + 0.08, 5.43 + 0.01 g L-1, respectively). Whereas,
the presence of OptiWhite resulted in high amounts of this acid in the LVCB and EC1118
wines (5.41 + 0.00 and 5.35 + 0.01 g L-1). The results also showed that strains 4F9 and
AWRI R2 consumed approximately 22.5 % of malic acid from the initial acid (7.02 g L-1). On
the other hand, addition of Fermaid E to the juice resulted in the highest level of lactic acid in
the 4F9 and LVCB wines (0.22 + 0.02 and 0.22 + 0.01 g L-1) and citric acid in the Sauvignon
wine (0.32 + 0.00 g L-1). Strain VIN7 was the highest acetic acid producer in either the
Fermaid E or the OptiWhite treatment (0.65 + 0.05 and 0.63 + 0.01 g L-1, respectively). All
wine treatments had similar concentrations of tartaric and shikimic acid ranging from 2.87 +
0.35 to 3.54 + 0.21 g L-1 and 32.66 + 0.15 to 34.77 + 0.17 mg L-1, respectively.
SO2-binding compounds: The results show that different productions of -ketoglutarate and
pyruvate in wines significantly varied depending on the yeast strains and the nutrient sources,
while that of acetaldehyde were similar (Figure 4-17). The addition of OptiWhite into the juice
significantly stimulated the highest formation of -ketoglutarate by strains Sauvignon and X5
(45.8 + 2.3 and 43.1 + 0.3 mg L-1) and that of pyruvate by the VIN7 strain (28.8 + 4.3 mg L-1).
Nevertheless, the concentration of these keto acids significantly diminished with Fermaid E
supplementation. Regarding acetaldehyde, its concentrations were similar among the wine
treatments ranging from 9.1 + 2.4 to 27.2 + 0.0 mg L-1, although strain EC1118 tended to be
a high acetaldehyde producer.
Sulphur containing compounds: Figure 4-18 demonstrates that the nine yeast strains
exhibited different production of these compounds in response to the nutrient source. Strain
VIN7 constantly produced the highest amounts of dimethyl sulphide in both nutrient sources
(10.3 + 1.0 and 10.6 + 0.2 g L-1, respectively). Carbon disulphide was detected only in the
Sauvignon, X5, VIN7, VIN13 and LVCB wines, however was most evident in the LVCB wine
(1.3 + 0.2 and 1.1 + 0.0 g L-1, respectively). Interestingly, strain LVCB also developed the
highest amount of dimethyl disulphide in the Fermaid E sample (1.0 + 0.3 g L-1). In addition,
other sulphur containing compounds like hydrogen sulphide, ethanethiol, methanethiol,
thioacetic acid S-methylester and thioacetic acid S-ethylester were not detected in all
Sauvignon blanc wines.

103
Figure 4-17 Concentration of SO2-binding compounds in finished Sauvignon blanc grape
wines fermented with nine yeast strains and two nutrient sources
Figure 4-18 Concentration of dimethyl sulphide, carbon disulphide and dimethyl disulphide
found in finished Sauvignon blanc grape wines produced by nine yeast strains
and two nutrient sources
Vertical bars represent standard deviations from two fermentation replicates. Means followed
by different letters on the top of the bar are significantly different (p<0.05) among treatment
combinations of each compound according to the DMRT test. Compounds displaying “(ns)”
show no significant difference (p>0.05) among treatment combinations of each compound
according to the DMRT test.
n.d. denotes not detected
26
.1
16
.817
.4
17
.1
17
.4
9.1
15
.618
.6
17
.7
3.2
hi
4.6
gh
i
6.2
efg
h
5.9
efg
hi
15
.9 c
5.4
fg
hi
7.6
ef
3.2
i
14
.3 c
d
26
.9 f
gh
22
.6 i
jk
25
.2 h
ij
21
.9 k
22
.4 j
k
28
.8 d
efg
27
.6 e
fgh
30
.4 d
e
23
.6 i
jk
14
.3
19
.9
16
.718
.2
11
.115
.217
.8
12
.9
27
.2
3.9
gh
i
6.5
efg
7.8
ef
8.7
e
28
.8 a
8.3
e
11
.9 d
4.2
gh
i
20
.0 b
31
.9 c
d
30
.0 d
ef
33
.6 c
27
.5 e
fgh
25
.7 g
hi
43
.1 a
39
.6 b
45
.8 a
30
.2 d
e
0
10
20
30
40
50
60
EC
11
18
Sa
uv
ign
on
VL
3
X5
VIN
7
VIN
13
4F
9
LV
CB
AW
RI R
2
EC
11
18
Sa
uv
ign
on
VL
3
X5
VIN
7
VIN
13
4F
9
LV
CB
AW
RI R
2
EC
11
18
Sa
uv
ign
on
VL
3
X5
VIN
7
VIN
13
4F
9
LV
CB
AW
RI R
2
Alpha-Ketoglutarate Pyruvate Acetaldehyde (ns)
Co
ncen
trati
on
(m
g L
-1)
Fermaid E
OptiWhite
0.7
b
1.0
a
0.3
d0.6
b
0.4
cd
0.2
de
n.d
.
n.d
.
0.8
b
n.d
.
1.3
a
6.3
b
6.2
b
5.9
b
6.1
b
10
.3 a
6.0
b
6.0
b
6.2
b
6.5
b
n.d
.
n.d
.
n.d
.
1.1
ab
n.d
.
n.d
.
n.d
.
n.d
.
0.7
b
0.2
de
0.2
de
0.5
bc
0.6
b
0.1
e
n.d
.0.3
d
n.d
.
1.1
ab
6.1
b
5.9
b
6.2
b
6.5
b
10
.6 a
6.3
b
5.9
b
6.1
b
6.8
b
n.d
.
1.0
b
n.d
.
1.0
b
1.0
b
1.1
ab
n.d
.
0
2
4
6
8
10
12
EC
1118
Sau
vig
no
n
VL
3
X5
VIN
7
VIN
13
4F
9
LV
CB
AW
RI R
2
EC
1118
Sau
vig
no
n
VL
3
X5
VIN
7
VIN
13
4F
9
LV
CB
AW
RI R
2
EC
1118
Sau
vig
no
n
VL
3
X5
VIN
7
VIN
13
4F
9
LV
CB
AW
RI R
2
Dimethyl sulphide Carbon disulphide Dimethyl disulphide
Co
ncen
trati
on
(
g L
-1)
Fermaid E
OptiWhite

104
Higher alcohols: The results in Table 4-10 show that the interaction of the commercial yeast
strain and the nutrient source did not significantly influence the formation of all five higher
alcohols in final wines. However, the AWRI R2 and Sauvignon strains considerably tended to
be higher alcohol producers and the addition of OptiWhite tended to stimulate the higher
development of these alcohols for the nine yeast strains. The Sauvignon blanc wines had
similar concentrations of higher alcohols; 17.0 + 1.5 to 47.5 + 6.7 mg L-1 2-methyl propanol,
103.8 + 14.1 to 176.3 + 33.6 mg L-1 3-methyl butanol, 19.6 + 0.2 to 44.6 + 5.5 mg L-1 2-
methyl butanol, 2573.9 + 402.8 to 3748.5 + 462.0 g L-1 hexanol and 12.1 + 1.4 to 30.3
+ 3.7 mg L-1 2-phenyl ethanol.
Acetic acid esters: Although commercial yeast strains and nutrient sources did not influence
the formation of higher alcohols, all acetic acid ester productions were significantly different
among the treatment combinations (Table 4-10 and Figure 4-19). The acetic acid ethyl
esters in this trial were identified by relative peak area as their concentrations were small and
out of the limit of quantification (50 mg L-1). Strain VIN7 was the highest acetic acid ethyl
ester producer without response to the nutrient source (19.3 + 2.5 and 22.3 + 4.7 of relative
peak area, respectively). The Sauvignon strain seemed to be the predominant producer of
most acetic acid esters, excluding acetic acid hexyl ester, with less dependence on the
nutrient source. These wines had the highest amounts of these esters; 444.3 + 32.9 and
404.6 + 15.7 g L-1 acetic acid 3-methylbutyl ester, 36.4 + 3.4 and 34.0 + 1.1 g L-1 acetic
acid 2-methylbutyl ester and 80.4 + 0.9 and 83.5 + 7.7 g L-1 acetic acid 2-phenylethyl ester.
The concentration of acetic acid hexyl ester was most obvious in the VIN7 wines with both
nutrient sources (144.7 + 12.7 and 128.2 + 9.6 g L-1, respectively), while acetic acid 2-
phenylethyl ester and acetic acid 3- and 2-methylbutyl ester were highest in the Fermaid E
sample (81.1 + 9.6, 467.7 + 100.9 and 29.7 + 5.5 g L-1, respectively). Strain VIN13 also
developed the highest amounts of acetic acid 2-methylbutyl ester in both nutrient sources
(31.1 + 3.7 and 31.6 + 4.2 g L-1, respectively), acetic acid 3-methylbutyl ester in the Fermaid
E treatment (341.3 + 56.0 g L-1) and acetic acid 2-phenylethyl ester in the OptiWhite sample
(68.2 + 9.9 g L-1). Overall, most acetic acid esters tended to increase with the Fermaid E
supplement, however it is strain-dependent.

105
Table 4-10 Concentration of higher alcohols and acetic acid ethyl ester found in finished Sauvignon blanc wines developed by nine yeast
strains with two nutrient sources
Yeast Nutrient 2-Methyl propanol
(mg L-1
)
3-Methyl butanol
(mg L-1
)
2-Methyl butanol
(mg L-1
)
Hexanol
(g L-1
)
2-Phenyl ethanol
(mg L-1
)
Acetic acid ethyl ester
(relative peak area)
EC1118 Fermaid E 29.0 + 5.8 a 157.1 + 16.1 a 28.0 + 3.2 a 3411.3 + 311.6 a 21.1 + 0.2 a 12.4 + 0.2 b
OptiWhite 23.0 + 9.8 a 111.6 + 28.7 a 22.7 + 7.7 a 2875.4 + 478.2 a 21.8 + 0.2 a 9.5 + 2.1 bcde
Sauvignon Fermaid E 28.0 + 3.2 a 134.1 + 11.3 a 33.6 + 2.2 a 3209.5 + 196.0 a 20.4 + 2.3 a 7.9 + 0.5 bcde
OptiWhite 43.0 + 6.0 a 170.6 + 19.1 a 44.6 + 5.5 a 3448.7 + 245.2 a 30.2 + 1.1 a 7.0 + 1.0 cde
VL3 Fermaid E 29.5 + 2.1 a 136.5 + 7.8 a 30.4 + 1.6 a 3054.4 + 16.7 a 15.5 + 0.6 a 11.3 + 1.1 bcd
OptiWhite 28.0 + 2.5 a 114.1 + 4.6 a 28.4 + 1.7 a 2770.1 + 101.7 a 16.8 + 1.2 a 9.2 + 0.9 bcde
X5 Fermaid E 24.5 + 2.9 a 118.3 + 13.1 a 27.7 + 3.1 a 2580.1 + 69.1 a 14.8 + 0.9 a 9.2 + 1.4 bcde
OptiWhite 30.0 + 1.8 a 122.7 + 2.5 a 32.3 + 0.1 a 2730.2 + 16.3 a 17.1 + 0.2 a 9.0 + 0.6 bcde
VIN7 Fermaid E 21.5 + 0.6 a 109.3 + 2.4 a 19.6 + 0.2 a 2926.2 + 217.4 a 12.9 + 0.5 a 19.3 + 2.5 a
OptiWhite 34.0 + 8.3 a 103.8 + 14.1 a 22.8 + 3.9 a 3467.1 + 271.5 a 12.1 + 1.4 a 22.3 + 4.7 a
VIN13 Fermaid E 22.5 + 3.6 a 121.1 + 22.1 a 28.7 + 5.7 a 2625.8 + 424.3 a 17.9 + 3.5 a 7.2 + 1.3 cde
OptiWhite 23.0 + 5.4 a 113.2 + 23.8 a 29.8 + 6.5 a 2573.9 + 402.8 a 20.2 + 3.1 a 6.7 + 1.6 de
4F9 Fermaid E 17.0 + 1.5 a 121.3 + 0.5 a 21.4 + 0.0 a 3012.2 + 93.5 a 23.6 + 2.8 a 5.4 + 0.1 e
OptiWhite 31.0 + 5.9 a 159.3 + 37.6 a 33.7 + 3.3 a 3569.0 + 692.2 a 30.3 + 3.7 a 8.9 + 3.7 bcde
LVCB Fermaid E 21.5 + 1.2 a 158.6 + 10.8 a 26.3 + 2.3 a 3349.6 + 123.8 a 24.0 + 0.1 a 8.0 + 0.7 bcde
OptiWhite 26.0 + 4.3 a 176.3 + 33.6 a 33.1 + 6.6 a 3748.5 + 462.0 a 30.0 + 3.2 a 9.3 + 1.8 bcde
AWRI R2 Fermaid E 31.5 + 4.1 a 148.5 + 24.5 a 35.7 + 6.3 a 3497.7 + 217.4 a 24.0 + 0.5 a 7.7 + 1.2 cde
OptiWhite 47.5 + 6.7 a 173.2 + 33.6 a 44.3 + 9.0 a 3675.3 + 471.3 a 25.6 + 5.8 a 11.4 + 1.6 bc
Each value shows the mean + standard deviation. Values displaying the same letters within the same column indicate no significant difference (p>0.05)
among treatment combinations, whereas those displaying different letters are significantly different (p<0.05) according to the DMRT test.

106
Figure 4-19 Concentration of acetic acid esters found in finished Sauvignon blanc wines
developed by nine yeast strains with two nutrient sources
Vertical bars represent standard deviations from two fermentation replicates. Means followed
by different letters on the top of the bar are significantly different (p<0.05) among treatment
combinations of each compound according to the DMRT test.
18
.7 c
de
f
15
.4 d
ef
12
.2 f
31
.1 a
29
.7 a
b
24
.5 b
c
21
.6 c
d
36
.4 a
23
.8 b
c
16
5.2
efg
29
1.8
bc
de
18
1.4
efg
34
1.3
ab
c
46
7.7
a
29
3.5
bc
de
25
8.8
cd
ef
44
4.3
a
33
5.4
ab
cd
21
.9 c
d
14
.5 e
f
14
.0 f
31
.6 a
23
.5 b
c
24
.5 b
c
21
.2 c
de
34
.0 a
18
.7 c
de
f
15
1.2
fg
17
4.0
efg
10
9.2
g
24
7.3
cd
efg
21
3.3
cd
efg
18
5.5
efg
20
3.9
de
fg
40
4.6
ab
14
2.0
fg
0
100
200
300
400
500
EC
1118
Sau
vig
no
n
VL
3
X5
VIN
7
VIN
13
4F
9
LV
CB
AW
RI
R2
EC
1118
Sau
vig
no
n
VL
3
X5
VIN
7
VIN
13
4F
9
LV
CB
AW
RI
R2
Acetic acid 3-methylbutyl ester Acetic acid 2-methylbutyl ester
Co
nc
en
tra
tio
n (
g L
-1)
50.5
cd
59.8
cd
57.4
cd
66.6
bcd
81.1
ab
58.8
cd
53.0
cd
80.4
ab
59.7
cd
96.8
cd
e
96.5
cd
e
90.3
cd
e
106.5
bcd1
44.7
a
98.4
cd
e
86.9
de
113.0
bc
110.3
bc
49.7
d
55.7
cd
56.2
cd6
8.2
ab
c
60.1
cd
56.1
cd
57.0
cd
83.5
a
58.1
cd
85.6
de
91.0
cd
e
78.8
e
110.7
bc
128.2
ab
96.4
cd
e
92.7
cd
e
89.9
cd
e
105.6
bcd
0
40
80
120
160
EC
1118
Sau
vig
no
n
VL
3
X5
VIN
7
VIN
13
4F
9
LV
CB
AW
RI
R2
EC
1118
Sau
vig
no
n
VL
3
X5
VIN
7
VIN
13
4F
9
LV
CB
AW
RI
R2
Acetic acid hexyl ester Acetic acid 2-phenyl ethyl ester
Co
nc
en
tra
tio
n (
g L
-1)
Fermaid E OptiWhite

107
Ethyl and diethyl esters: Table 4-11 shows that ethyl and diethyl ester productions differed
according to treatment combinations of yeast strains and nutrient sources. The formation of
LAEtE and BuEtE were similar among the wine treatments ranging from 19.9 + 2.3 to 34.9 +
5.0 mg L-1 and 116.0 + 1.6 to 167.5 + 2.5 g L-1, respectively. Nevertheless, strains VL3 and
X5 tended to be the high producers of BuEtE, whereas strains EC1118, 4F9, LVCB and
AWRI R2 tended to develop high amounts of LAEtE. The concentration of iBuEtE was most
obvious in the AWRI R2 wines with either Fermaid E or OptiWhite addition (163.8 + 6.1 and
174.4 + 10.7 g L-1, respectively). Strain EC1118 was the highest producer of SAdiEtE in
both nutrient sources (2268.5 + 67.6 and 2321.6 + 179.9 g L-1, respectively), whereas the
highest amounts of PrEtE was present in the Fermaid E treatment (188.6 + 21.0 g L-1). A
high amount of SAdiEtE was produced by strains VL3 and VIN13 in both nutrient sources as
well (2065.8 + 195.5, 2351.1 + 12.7 and 2044.0 + 273.0, 2040.4 + 191.9 g L-1, respectively).
It is likely that most ethyl and diethyl esters were considerably more dependent on the yeast
strain than on the nutrient source.
Monoterpenes: The result shows that the nine yeast strains had similar ability to release -
terpineol in any source of nutrient ranging from 12.5 + 0.8 to 16.3 + 0.1 g L-1 (Table 4-11).
While the other monoterpenes like trans-linalool oxide, cis-linalool oxide and linalool were
detected only in trace quantities in all wine treatments (data not shown).
Medium-chain fatty acids and their ethyl esters: The results in Table 4-12 and Figure 4-
20 demonstrate that the formation of OAEtE and DAEtE significantly differed among yeast
strains and nutrient sources. The formation of MCFAs and HAEtE were similar among the
wine treatments ranging from 5.5 + 0.1 to 8.0 + 0.1 mg L-1 hexanoic acid, 6.0 + 0.1 to 9.2 +
0.0 mg L-1 octanoic acid, 1.4 + 0.3 to 3.0 + 0.2 mg L-1 decanoic acid and 339.3 + 29.6 to
551.3 + 56.3 g L-1 HAEtE. However, strain LVCB tended to be the high producer of
hexanoic and octanoic acid. The addition of Fermaid E promoted the greatest production of
OAEtE and DAEtE by the AWRI R2 strain (1067.7 + 117.5 and 394.5 + 61.8 g L-1,
respectively). Strain VIN13 with the addition of Fermaid E also produced the highest amount
of DAEtE (389.3 + 53.7 g L-1).

108
Table 4-11 Concentration of ethyl, diethyl esters and -terpineol found in finished Sauvignon blanc wines developed by nine yeast strains with
two nutrient sources
Yeast Nutrient PrEtE (g L
-1) BuEtE (g L
-1) iBuEtE (g L
-1) LAEtE (mg L
-1) SAdiEtE (g L
-1) -Terpineol (g L
-1)
EC1118 Fermaid E 188.6 + 21.0 a 157.5 + 14.8 a 75.6 + 9.1 fgh 34.9 + 5.0 a 2268.5 + 67.6 ab 13.0 + 0.1 a
OptiWhite 133.3 + 63.6 b 127.9 + 15.2 a 61.5 + 15.5 h 25.6 + 7.0 a 2321.6 + 179.9 a 13.6 + 0.1 a
Sauvignon Fermaid E 69.7 + 3.7 f 156.1 + 3.9 a 93.1 + 8.3 efg 22.3 + 1.6 a 1118.4 + 122.4 f 15.7 + 0.5 a
OptiWhite 75.2 + 12.5 ef 149.5 + 14.7 a 107.5 + 20.3 de 22.6 + 1.7 a 1582.5+ 20.4 de 14.4 + 0.4 a
VL3 Fermaid E 94.6 + 7.3 bcdef 167.5 + 2.5 a 104.6 + 5.1 e 24.7 + 0.9 a 2065.8 + 195.5 abc 14.1 + 0.4 a
OptiWhite 85.5 + 15.7 cdef 158.1 + 17.9 a 102.5 + 16.8 ef 20.6 + 0.2 a 2351.1 + 12.7 a 14.0 + 0.9 a
X5 Fermaid E 113.5 + 5.0 bcdef 158.3 + 3.4 a 131.6 + 8.0 cd 27.7 + 1.1 a 1828.6 + 164.8 cde 14.2 + 0.9 a
OptiWhite 112.5 + 8.2 bcdef 159.6 + 8.7 a 139.9 + 8.3 bc 25.2 + 0.7 a 2009.8 + 85.7 abc 14.8 + 0.2 a
VIN7 Fermaid E 99.2 + 6.5 bcdef 125.5 + 14.2 a 74.6 + 6.6 fgh 23.2 + 1.4 a 1000.9 + 157.1 f 16.3 + 0.1 a
OptiWhite 110.8 + 12.6 bcdef 116.0 + 1.6 a 76.1 + 4.9 fgh 28.2 + 3.6 a 1015.4 + 63.4 f 15.1 + 0.6 a
VIN13 Fermaid E 125.4 + 11.1 bcd 146.7 + 4.9 a 72.2 + 1.5 gh 23.3 + 2.3 a 2044.0 + 273.0 abc 14.4 + 0.2 a
OptiWhite 116.0 + 12.4 bcde 138.5 + 4.5 a 70.4 + 1.7 gh 19.9 + 2.3 a 2040.4 + 191.9 abc 14.6 + 1.1 a
4F9 Fermaid E 113.1 + 5.7 bcdef 131.4 + 13.4 a 74.6 + 11.3 fgh 27.2 + 0.5 a 1822.2 + 261.2 cde 15.1 + 0.2 a
OptiWhite 108.3 + 12.7 bcdef 127.9 + 9.3 a 90.8 + 13.4 efg 28.0 + 3.4 a 1884.7 + 177.0 cd 14.1 + 0.4 a
LVCB Fermaid E 131.1 + 14.6 bc 151.2 + 8.7 a 72.0 + 4.3 gh 30.3 + 0.1 a 1785.4 + 67.2 cde 15.1 + 0.1 a
OptiWhite 127.1 + 17.5 bcd 149.0 + 1.0 a 70.7 + 1.2 gh 29.5 + 3.7 a 1945.5 + 32.4 bc 13.8 + 0.6 a
AWRI R2 Fermaid E 82.8 + 10.8 def 137.6 + 0.5 a 163.8 + 6.1 ab 30.3 + 2.5 a 1744.9 + 36.8 cde 15.1 + 1.4 a
OptiWhite 94.5 + 7.1 bcdef 129.5 + 0.3 a 174.4 + 10.7 a 27.6 + 2.6 a 1525.6 + 126.9 e 12.5 + 0.8 a
Each value shows the mean + standard deviation. Values displaying the same letter (only ‗a‘) within the same column indicate no significant difference
(p>0.05) among treatment combinations, whereas those displaying different letters are significantly different (p<0.05) according to the DMRT test.

109
Table 4-12 Concentration of fatty acids found in finished Sauvignon blanc wines developed
by nine yeast strains with two nutrient sources
Yeast Nutrient Hexanoic acid
(mg L-1)
Octanoic acid
(mg L-1)
Decanoic acid
(mg L-1)
EC1118 Fermaid E 6.2 + 0.3 a 6.0 + 1.0 a 1.7 + 0.8 a
OptiWhite 6.0 + 0.0 a 6.8 + 0.5 a 2.3 + 0.3 a
Sauvignon Fermaid E 6.6 + 0.5 a 7.9 + 0.3 a 2.9 + 0.0 a
OptiWhite 6.8 + 0.0 a 7.0 + 0.3 a 2.1 + 0.6 a
VL3 Fermaid E 6.8 + 0.4 a 7.2 + 0.4 a 2.4 + 0.2 a
OptiWhite 6.3 + 0.7 a 6.6 + 0.5 a 1.9 + 0.6 a
X5 Fermaid E 6.8 + 0.1 a 7.5 + 1.3 a 2.5 + 0.7 a
OptiWhite 6.7 + 0.2 a 8.0 + 0.3 a 3.0 + 0.2 a
VIN7 Fermaid E 5.5 + 0.1 a 6.0 + 0.1 a 1.7 + 0.6 a
OptiWhite 5.9 + 0.2 a 6.1 + 0.0 a 2.0 + 0.1 a
VIN13 Fermaid E 6.3 + 0.3 a 7.6 + 0.4 a 3.0 + 0.5 a
OptiWhite 6.2 + 0.1 a 7.3 + 0.4 a 2.7 + 0.4 a
4F9 Fermaid E 7.1 + 0.0 a 8.6 + 0.5 a 2.8 + 0.3 a
OptiWhite 7.1 + 0.4 a 7.8 + 0.3 a 2.1 + 0.6 a
LVCB Fermaid E 8.0 + 0.1 a 9.2 + 0.0 a 2.9 + 0.1 a
OptiWhite 7.9 + 0.0 a 8.7 + 0.7 a 2.7 + 0.3 a
AWRI R2 Fermaid E 7.7 + 0.4 a 8.8 + 0.9 a 3.0 + 0.2 a
OptiWhite 7.0 + 0.3 a 7.0 + 0.0 a 1.4 + 0.3 a
Each value shows the mean + standard deviation from two fermentation replicates. Values
displaying the same letter (only ‗a‘) within the same column and factor indicate no significant
difference (p>0.05) among treatment combinations according to the DMRT test.

110
Figure 4-20 Concentration of fatty acid esters found in finished Sauvignon blanc wines developed by nine yeast strains with two nutrient
sources
Vertical bars represent standard deviations from two fermentation replicates. Means followed by different letters on the top of the bar are
significantly different (p<0.05) among treatment combinations of each compound according to the DMRT test. Compounds displaying “(ns)”
show no significant difference (p>0.05) among treatment combinations according to the DMRT test.
41
9.1
48
3.5
45
2.8
52
5.0
40
9.0
45
3.1 53
3.5
54
9.1
55
1.3
57
9.9
f
90
8.2
ab
cd
82
3.8
ab
cd
ef
88
2.3
ab
cd
63
0.4
ef
89
6.9
ab
cd 96
5.0
ab
cd
98
5.4
ab
c
10
60
.7 a
16
8.9
d
36
7.9
ab
29
7.0
ab
cd
29
8.7
ab
cd
19
4.2
cd
38
9.3
a
34
3.2
ab
c
34
8.0
ab
c
39
4.5
a
44
1.5
43
6.6
43
4.0
52
5.4
33
9.3
43
5.3
45
5.5
54
6.3
39
6.5
79
3.1
bc
de
f
73
8.5
cd
ef
72
2.0
de
f
10
15
.5 a
b
58
4.8
f
83
2.3
ab
cd
e
80
5.5
bc
de
f
98
8.3
ab
62
0.1
ef
27
7.2
ab
cd
23
4.3
ab
cd
21
3.2
bc
d
37
9.6
a
24
0.4
ab
cd
34
4.9
ab
c
24
4.4
ab
cd
33
3.5
ab
c
14
4.5
d
0
300
600
900
1200
EC
1118
Sau
vig
no
n
VL
3
X5
VIN
7
VIN
13
4F
9
LV
CB
AW
RI R
2
EC
1118
Sau
vig
no
n
VL
3
X5
VIN
7
VIN
13
4F
9
LV
CB
AW
RI R
2
EC
1118
Sau
vig
no
n
VL
3
X5
VIN
7
VIN
13
4F
9
LV
CB
AW
RI R
2
Hexanoic acid ethyl ester (ns) Octanoic acid ethyl ester Decanoic acid ethyl ester
Co
nc
en
tra
tio
n (
g L
-1)
Fermaid E
OptiWhite

111
4.2.2 Impact of five commercial yeast strains and four nutrient sources on
fermentative characteristics, metabolic compounds and wine aromas of Sauvignon
blanc grape wines
In 2009, wine fermentations were conducted in fresh Sauvignon blanc juices. The
fermentations were conducted using five commercial yeast strains of Saccharomyces
(EC1118, X5, VIN7, Alchemy I and LittoLevure) and four commercial nutrient
sources; 0.3 g L-1 Superstart, 0.4 g L-1 Fermaid O, 0.4 g L-1 Fermaid E blanc and 0.4 g L-1
Vitamon Ultra (VUltra). The yeast strains and nutrient sources were selected on the basis
results, which were obtained from the previous trials of Scheurebe and Sauvignon blanc. The
fermentation kinetics, some non-volatile and volatile compounds in final wines were
investigated.
The growth kinetics: Figure 4-21 shows that the EC1118 strain appeared to be the
strongest strain followed by strain Alchemy I, while the LittoLevure seemed to be the weakest
strain. The EC1118 strain had the fastest fermentation kinetic and duration in any kind of
nutrient (15 days). Strain Alchemy I followed a similar pattern as strain EC1118, except in the
presence of Fermaid O that caused slightly longer fermentation duration (16 days). On the
other hand, strain LittoLevure had a longer lag phase and slow fermentation kinetics and
times (26 days), particularly in either the Fermaid O or the Fermaid E treatment that seemed
to result in a sluggish fermentation. However, the addition of Superstart and VUltra enhanced
the growth kinetic of the latter strain and reduced the duration of fermentation to 21 days.
Strain X5 tended to follow a similar pattern as strain LittoLevure, but had a slightly faster
fermentation kinetic and time in respect to the Superstart and Fermaid E treatments (15 and
24 days, respectively). The VIN7 strain had the slow growth kinetic and long fermentation
time in the Fermaid O fermentation (24 days), but addition of the other nutrient sources
enhanced fermentation kinetics and time, particularly in the Superstart fermentation (17
days). In all cases, Supertart seemed to be the most effective nutrient source to accelerate
fermentation kinetics, whereas Fermaid O tended to give the inverse response.
Chemical compositions: Commercial yeast strains and nutrient sources significantly
affected the concentrations of residual sugar, but not glycerol (Table 4-13). The EC1118 and
Alchemy I strains produced wines having low amounts of residual sugar and attained
dryness ranging from 1.0 + 0.2 to 2.4 + 0.7 g L-1 and 0.6 + 0.1 to 1.6 + 0.3 g L-1, respectively.
On the contrary, strain LittoLevure produced wines having high amounts of residual sugar in
the Fermaid O treatment (7.4 + 0.1 g L-1), followed by the VUltra treatment (4.5 + 0.3 g L-1).

112
The five yeast strains produced similar amounts of glycerol, which ranged from 2.0 + 0.1 to
2.1 + 0.0 g L-1 without any response to the nutrient source.
Figure 4-21 Fermentation kinetics of fresh Sauvignon blanc grape juice fermentations with
five commercial yeast strains and four commercial nutrient sources
Organic acids: The results show that concentrations of citric acid were similar among the
wine treatments ranging from 0.25 + 0.00 to 0.27 + 0.01 g L-1 (Table 4-14). When Superstart
was added, strain EC1118 produced wine having the highest amount of lactic acid (0.31 +
0.02 g L-1) followed by strain Alchemy I (0.27 + 0.02 g L-1), while the VIN7 produced the
greatest concentration of acetic acid (1.07 + 0.03 g L-1). Lactic acid was also most evident in
the LittoLevure wine with the Fermaid O addition (0.30 + 0.09 g L-1). The LittoLevure strain
produced wine with the highest amount of malic acid in the VUltra and Superstart treatments
(3.23 + 0.01 and 3.16 + 0.04 g L-1, respectively), shikimic acid in the Fermaid O and Fermaid
E samples (22.26 + 0.15 and 22.11 + 0.27 mg L-1, respectively) and tartaric acid in the VUltra
treatment (3.38 + 0.02 g L-1). Strain X5 also produced wine having the greatest concentration
of tartaric acid in the presence of Fermaid E (3.32 + 0.01 g L-1) and malic acid in the Fermaid
O and VUltra samples (3.18 + 0.04 and 3.16 + 0.04 g L-1). In addition, the VIN7 seemed to be
the highest acetic acid producer, but the lowest producer of lactic acid.
0
20
40
60
80
100
1 3 5 7 9 11 13 15 17 19 21 23 25
Fermentation days
Carb
on
dio
xid
e (
g L
-1)
EC1118-Superstart EC1118-Fermaid O
EC1118-Fermaid E EC1118-VUltra
X5-Superstart X5-Fermaid O
X5-Fermaid E X5-VUltra
VIN7-Superstart VIN7-Fermaid O
VIN7-Fermaid E VIN7-VUltra
Alchemy I-Superstart Alchemy I-Fermaid O
Alchemy I-Fermaid E Alchemy I-VUltra
LittoLevure-Superstart LittoLevure-Fermaid O
LittoLevure-Fermaid E LittoLevure-VUltra

113
Table 4-13 Chemical composition of finished wines obtained from fresh Sauvignon blanc
grape juices fermented with five yeast strains and four nutrient sources
Yeast Nutrient Residual sugar (g L-1) Glycerol (g L-1)
EC1118 Superstart 1.0 + 0.2 fgh 2.0 + 0.1 a
Fermaid O 2.4 + 0.7 d 2.0 + 0.0 a
Fermaid E 2.1 + 0.8 de 2.0 + 0.1 a
VUltra 1.5 + 0.1 def 2.0 + 0.0 a
X5 Superstart 0.5 + 0.2 h 2.0 + 0.0 a
Fermaid O 4.3 + 0.6 bc 2.0 + 0.0 a
Fermaid E 4.9 + 1.0 b 2.0 + 0.1 a
VUltra 0.7 + 0.3 fgh 2.1 + 0.0 a
VIN7 Superstart 1.2 + 0.1 efgh 2.0 + 0.1 a
Fermaid O 3.9 + 0.6 c 2.1 + 0.1 a
Fermaid E 3.8 + 0.8 c 2.1 + 0.1 a
VUltra 2.1 + 0.2 de 2.0 + 0.0 a
Alchemy I Superstart 0.8 + 0.1 fgh 2.0 + 0.1 a
Fermaid O 1.6 + 0.3 def 2.0 + 0.0 a
Fermaid E 0.7 + 0.2 fgh 2.1 + 0.0 a
VUltra 0.6 + 0.1 gh 2.0 + 0.0 a
LittoLevure Superstart 2.5 + 0.4 d 2.1 + 0.0 a
Fermaid O 7.4 + 0.1 a 2.1 + 0.0 a
Fermaid E 3.9 + 0.3 c 2.1 + 0.0 a
VUltra 4.5 + 0.3 bc 2.0 + 0.0 a
Each value shows the mean + standard deviation from three fermentation replicates .
Values displaying the same letter (only ‗a‘) within the same column indicate no significant
difference (p>0.05) among treatment combinations, whereas those displaying different letters
are significantly different (p<0.05) according to the DMRT test.

114
Table 4-14 Concentration of organic acids found in finished Sauvignon blanc wines produced by five yeast strains with four nutrient sources
Yeast Nutrient Tartaric acid
(g L-1
)
Malic acid
(g L-1
)
Lactic acid
(g L-1
)
Shikimic acid
(mg L-1
)
Acetic acid
(g L-1
)
Citric acid
(g L-1
)
EC1118 Superstart 3.31 + 0.11 abc 3.00 + 0.01 def 0.31 + 0.02 a 20.65 + 0.22 fgh 0.48 + 0.01 ij 0.27 + 0.01 a
Fermaid O 3.20 + 0.03 defg 3.07 + 0.02 cd 0.23 + 0.02 bcdef 20.64 + 0.11 fgh 0.57 + 0.01 g 0.26 + 0.01 a
Fermaid E 3.28 + 0.07 bcde 3.05 + 0.01 cd 0.25 + 0.03 abcd 20.54 + 0.09 ghi 0.54 + 0.03 gh 0.26 + 0.01 a
VUltra 3.26 + 0.03 bcde 3.04 + 0.01 cde 0.22 + 0.00 cdefg 20.37 + 0.06 hij 0.53 + 0.02 gh 0.25 + 0.00 a
X5 Superstart 3.15 + 0.06 fg 3.02 + 0.01 de 0.23 + 0.01 bcdef 20.70 + 0.08 fgh 0.50 + 0.01 hij 0.25 + 0.01 a
Fermaid O 3.05 + 0.03 h 3.18 + 0.04 ab 0.18 + 0.03 efgh 21.27 + 0.16 cd 0.40 + 0.02 k 0.26 + 0.01 a
Fermaid E 3.32 + 0.01 ab 3.11 + 0.00 bc 0.21 + 0.06 cdefgh 20.48 + 0.15 hi 0.47 + 0.03 j 0.26 + 0.00 a
VUltra 3.16 + 0.04 fg 3.16 + 0.04 ab 0.22 + 0.02 cdefg 20.87 + 0.37 efg 0.42 + 0.03 k 0.27 + 0.01 a
VIN7 Superstart 3.22 + 0.01 cde 2.84 + 0.01 g 0.16 + 0.02 gh 19.60 + 0.08 k 1.07 + 0.03 a 0.27 + 0.01 a
Fermaid O 3.26 + 0.01 bcde 2.95 + 0.02 ef 0.16 + 0.01 gh 20.27 + 0.24 ij 1.03 + 0.01 b 0.27 + 0.01 a
Fermaid E 3.22 + 0.03 bcdef 2.96 + 0.00 ef 0.16 + 0.03 gh 20.11 + 0.08 j 1.00 + 0.02 bc 0.27 + 0.01 a
VUltra 3.18 + 0.01 efg 2.93 + 0.05 f 0.15 + 0.05 h 20.05 + 0.38 j 0.99 + 0.03 c 0.27 + 0.00 a
Alchemy I Superstart 3.19 + 0.02 efg 2.95 + 0.03 ef 0.27 + 0.02 abc 20.92 + 0.23 def 0.52 + 0.04 h 0.26 + 0.00 a
Fermaid O 3.21 + 0.01 cdef 3.03 + 0.02 cde 0.20 + 0.01 defgh 21.17 + 0.15 de 0.65 + 0.02 ef 0.26 + 0.00 a
Fermaid E 3.31 + 0.05 abc 3.02 + 0.02 cde 0.22 + 0.02 cdefg 20.98 + 0.16 def 0.65 + 0.01 ef 0.26 + 0.00 a
VUltra 3.30 + 0.15 abcd 3.03 + 0.01 cde 0.24 + 0.03 bcde 20.98 + 0.12 def 0.62 + 0.03 f 0.25 + 0.00 a
LittoLevure Superstart 3.23 + 0.04 bcde 3.16 + 0.04 ab 0.22 + 0.04 cdefg 21.54 + 0.14 bc 0.66 + 0.01 e 0.26 + 0.01 a
Fermaid O 3.10 + 0.02 gh 2.98 + 0.17 def 0.30 + 0.09 ab 22.26 + 0.15 a 0.51 + 0.01 hi 0.26 + 0.01 a
Fermaid E 3.18 + 0.01 efg 3.07 + 0.06 cd 0.22 + 0.03 cdefg 22.11 + 0.27 a 0.48 + 0.01 ij 0.26 + 0.00 a
VUltra 3.38 + 0.02 a 3.23 + 0.01 a 0.17 + 0.00 fgh 21.79 + 0.11 b 0.72 + 0.01 d 0.26 + 0.01 a
Each value shows the mean + standard deviation. Values displaying the same letter (only ‗a‘) within the same column indicate no significant difference
(p>0.05) among treatment combinations, whereas those displaying different letters are significantly different (p<0.05) according to the DMRT test.

115
Figure 4-22 Concentration of SO2-binding compounds found in finished Sauvignon blanc
grape wines produced by five yeast strains with four nutrient sources
Vertical bars represent standard deviations from three fermentation replicates. Means
followed by different letters on the top of the bar are significantly different (p<0.05) among
treatment combinations according to the DMRT test.
32
.6 b
cd
23
.9 f
49
.5 a
33
.2 b
cd
29
.3 d
e
25
.9 e
f
22
.7 f
36
.1 b
37
.0 b
23
.7 f
22
.8 f
22
.9 f
34
.9 b
c
30
.2 c
de
22
.7 f
24
.1 f
22
.2 f
35
.5 b
33
.6 b
cd
23
.4 f
0
10
20
30
40
50
60
EC1118 X5 VIN 7 Alchemy I LittoLevure
-K
eto
glu
tara
te (
mg
L-1
)
5.4
i
9.3
h
23
.5 a
9.8
h
19
.1 b
c
5.3
i
15
.2 e
f
22
.8 a
17
.2 c
de
18
.5 b
cd
4.1
i
11
.4 g
h
20
.3 b
13
.6 f
g
15
.7 e
f
5.9
i
11
.3 g
h
22
.9 a
11
.6 g
h
16
.3 d
e
0
7
14
21
28
EC1118 X5 VIN 7 Alchemy I LittoLevure
Pyru
vate
(m
g L
-1)
18.8
c
17.8
cd
e
11.5
g
15.8
ef
12.4
g
22.1
b
24.7
a
16.5
def
17.5
cd
e
17.1
cd
e23.1
ab
24.9
a
16.0
ef
18.4
cd
15.0
f
22.5
b
21.6
b
15.6
ef
17.4
cd
e
15.6
ef
0
7
14
21
28
EC1118 X5 VIN 7 Alchemy I LittoLevure
Ac
eta
lde
hyd
e (
mg
L-1
)
Yeast strains Superstart Fermaid O Fermaid E VUltra

116
SO2-binding compounds: As shown in Figure 4-22, the productions of these compounds
by the five yeast strains were significantly different depending on the nutrient source. Strain
VIN7 produced the greatest amount of pyruvate in most nutrient sources (22.8 + 0.7 to 23.5
+ 1.5 mg L-1), except in the Fermaid E sample (20.3 + 0.7 mg L-1), and -ketoglutarate in the
Superstart sample (49.5 + 4.2 mg L-1). The greatest concentration of acetaldehyde was
produced by strain X5 in the Fermaid O and Fermaid E treatments (24.7 + 2.4 and 24.9
+ 1.7 mg L-1) and by strain EC1118 in the Fermaid E sample (23.1 + 2.4 mg L-1). Moreover,
the addition of Superstart significantly decreased acetaldehyde formation.
Sulphur containing compounds: Figure 4-23 and 4-24 show that the interaction of five
commercial yeast strains and nutrient sources significantly only affected the concentration of
SO2 and CS2. The concentrations of H2S and DMS were not statistically different among all
treatment combinations that ranging from 3.6 + 1.0 to 5.7 + 1.2 g L-1 and 2.4 + 0.1 to 3.0 +
0.2 g L-1, respectively. The X5 strain was the dominant SO2 forming producer with less
response to the nutrient source (26.2 + 0.2 to 28.9 + 4.3 g L-1), while strain EC1118
produced the greatest amount of this compound in the Fermaid E and VUltra treatments
(28.6 + 1.9 and 30.7 + 3.8 g L-1, respectively). The addition of Fermaid E promoted the
greatest production of CS2 by strains LittoLevure and X5 (11.1 + 2.1 and 10.5 + 2.2 g L-1,
respectively).
Figure 4-23 Concentration of total sulphur dioxide found in finished Sauvignon blanc grape
wines produced by five yeast strains with four nutrient sources
Vertical bars represent standard deviations from three fermentation replicates. Means
followed by different letters on the top of the bar are significantly different (p<0.05) among
treatment combinations according to the DMRT test.
13
.6 i
23
.9 b
cd
e
14
.3 h
i
26
.2 a
bc
23
.2 c
de
12
.9 j
20
.6 d
ef
19
.8 e
fg
28
.0 a
bc
25
.0 b
cd
15
.4 g
hi
25
.5 a
bc
d
17
.2 f
gh
i
28
.9 a
b
28
.6 a
bc
12
.6 i
18
.9 e
fgh
14
.4 h
i
28
.0 a
bc
30
.7 a
0
10
20
30
40
EC1118 X5 VIN 7 Alchemy I LittoLevure
Yeast strains
To
tal
SO
2 (
mg
L-1
)
Superstart Fermaid O Fermaid E VUltra

117
Figure 4-24 Concentration of sulphur containing compounds found in finished Sauvignon
blanc grape wines produced by five yeast strains with four nutrient sources
Vertical bars represent standard deviations from three fermentation replicates. Means
followed by different letters on the top of the bar are significantly different (p<0.05), whereas
those displaying the same letters are not significantly different (p>0.05) according to the
DMRT test.
4.7
a
4.8
a
4.7
a
3.9
a5.0
a
4.6
a
4.2
a
5.5
a
5.7
a
4.6
a
4.4
a
3.6
a
4.7
a4.8
a
3.9
a 4.4
a
4.7
a5.1
a
5.4
a
4.0
a
0
2
4
6
EC1118 X5 VIN 7 Alchemy I LittoLevure
Hyd
rog
en
su
lph
ide (
g L
-1)
2.5
a
2.6
a
2.4
a 2.5
a
3.0
a
2.5
a 2.9
a
2.7
a
2.7
a
2.8
a
2.9
a
2.8
a
2.6
a 2.6
a
2.8
a
2.5
a
2.8
a
2.6
a
2.6
a
3.0
a
0
2
4
EC1118 X5 VIN 7 Alchemy I LittoLevure
Dim
eth
yl
su
lph
ide
(
g L
-1)
4.4
cd
4.3
cd
6.1
bc
d
6.0
bc
d
4.4
cd
7.9
ab
c
6.0
bc
d
8.9
ab
c
7.8
ab
c
4.8
cd
11
.1 a
5.6
bc
d
7.4
ab
c10
.5 a
b
7.0
ab
c
9.9
ab
c
3.3
d
4.9
cd
5.2
bc
d7.8
ab
c
0
4
8
12
EC1118 X5 VIN 7 Alchemy I LittoLevure
Yeast strains
Carb
on
dis
ulp
hid
e (
g L
-1)
Superstart Fermaid O Fermaid E VUltra

118
Figure 4-25 Concentration of higher alcohols found in finished Sauvignon blanc grape wines
produced by five yeast strains with four nutrient sources (*10 = concentration
of compound times 10)
Vertical bars represent standard deviations from three fermentation replicates. Means
followed by different letters on the top of the bar are significantly different (p<0.05) among
treatment combinations according to the DMRT test.
43
.0 a
bc
37
.1 b
cd 4
6.6
ab
38
.3 b
cd 5
1.2
a
21
.5 a
b
16
.2 e
fg 22
.6 a
19
.1 b
cd
19
.8 b
cd
39
.9 b
c
34
.7 c
d
35
.7 c
d
37
.3 b
cd
40
.8 b
c
20
.1 b
cd
15
.6 f
g
18
.3 d
e
17
.0 d
ef
17
.1 d
ef
34
.1 c
d
32
.9 c
d
39
.5 b
cd
33
.1 c
d 39
.0 b
cd
21
.1 a
bc
17
.6 d
ef
18
.5 d
e
18
.8 c
d
15
.2 f
g
33
.0 c
d
34
.9 c
d
40
.9 b
c
29
.8 d
34
.9 b
cd
21
.5 a
bc
16
.4 e
f
17
.8 d
ef
19
.1 b
cd
13
.8 g
0
10
20
30
40
50
60
EC1118 X5 VIN 7 Alchemy I LittoLevure EC1118 X5 VIN 7 Alchemy I LittoLevure
2-Methyl propanol 2-Phenyl ethanol
Co
ncen
trati
on
(m
g L
-1)
19.6
a
13.5
defg
15.8
cd
e
18.5
ab
c
16.4
bcd
e
36.2
ab
c
28.9
de 3
8.5
ab
34.4
bcd
e
42.1
a
17.8
ab
c
11.2
g
13.7
defg
17.2
ab
c
13.5
defg
34.0
bcd
e
27.6
e
34.9
b
cd
34.2
bcd
e
36.7
ab
c
17.6
ab
c
13.4
efg
15.7
cd
e
19.1
ab
14.1
def
30.8
cd
e
31.1
cd
e
36.7
ab
c
35.5
ab
cd
36.2
ab
c
17.1
ab
c
13.6
defg
15.9
cd
e
16.4
bcd
12.6
fg
32.1
bcd
e
30.8
cd
e
37.1
ab
c
31.6
bcd
e
32.0
bcd
e
0
15
30
45
EC1118 X5 VIN 7 Alchemy I LittoLevure EC1118 X5 VIN 7 Alchemy I LittoLevure
3-Methyl butanol *10 2-Methyl butanol
Co
ncen
trati
on
(m
g L
-1)
Superstart Fermaid O Fermaid E VUltra
3320.2
gh
3223.3
hi
3776.4
de
3060.0
i
4258.8
ab
3498.8
fg
3437.4
fg
h
3877.7
cd
3340.1
gh
4529.0
a
3202.4
hi
3606.3
ef
3931.1
cd
3395.7
fg
h
4238.5
ab
3373.0
fg
h
3523.5
fg
3784.2
de
3188.3
hi 4090.8
bc
0
1200
2400
3600
4800
EC1118 X5 VIN 7 Alchemy I LittoLevure
Yeast strains
Hexan
ol (
g L
-1)
Superstart Fermaid O Fermaid E VUltra

119
Higher alcohols: The influence of five commercial yeast strains on higher alcohol production
was dependent upon the nitrogen source supplemented (Figure 4-25). Strain EC1118 was
the high producer of 3-methyl butanol and 2-phenyl ethanol with less response to the nutrient
source (171.4 + 16.7 to 196.0 + 10.2 mg L-1 and 20.1 + 2.0 to 21.5 + 0.8 mg L-1). Strain
Alchemy I followed a similar pattern of 3-methyl butanol production (164.4 + 3.2 to 190.6 +
4.2 mg L-1). Strain LittoLevure was the most hexanol producer in any kind of nutrient (4090.8
+ 164.3 to 4529.0 + 121.3 g L-1), while the greatest amounts of 2-methyl propanol and 2-
methyl butanol were produced in the Superstart variant (51.2 + 1.6 and 42.1 + 0.9 mg L-1,
respectively). The Superstart treatment also promoted the highest formation of 2-methyl
propanol and 2-methyl butanol by strain VIN7 (46.6 + 8.6 and 38.5 + 8.6 mg L-1, respectively).
Acetic acid esters: Figure 4-26 shows that strain Alchemy I was the most predominant
producer of acetic acid hexyl ester and acetic acid ethyl ester with less response to the
nutrient source (536.8 + 49.2 to 576.1 + 34.4 g L-1 and 212.8 + 21.1 to 289.4 + 10.5 mg L-1,
respectively). Strain VIN7 was also the greatest producer of acetic acid ethyl ester in most
nutrient sources (213.7 + 27.5 to 273.5 + 42.9 mg L-1, respectively) although its concentration
was slightly lower in the Fermaid O and Fermaid E samples. Acetic acid 3- and 2-methylbutyl
ester and acetic acid 2-phenyl ethyl ester were also most evident in the Alchemy I wine with
the Superstart supplementation (2960.8 + 239.2, 115.3 + 6.3 and 410.6 + 4.3 g L-1,
respectively). The presence of Superstart also stimulated strain EC1118 to produce the
highest amount of acetic acid 2-methylbutyl ester (103.0 + 16.0 g L-1).
Ethyl and diethyl esters: As shown in Table 4-15, the production of ethyl esters significantly
differed depending on the yeast strain and the nitrogen source, while succinic acid diethyl
esters were detected in all wine treatments only in trace quantities (data not shown). Strain
EC1118 developed the greatest amount of PrEtE in the presence of Superstart (98.8
+ 11.5 g L-1), whereas BuEtE was most evident in the Superstart and Fermaid O samples
(366.4 + 19.4 and 380.1 + 12.7 g L-1, respectively) and also in the X5 wine with Superstart
addition (361.1 + 39.5 g L-1). Strain Alchemy I produced the greatest amount of iBuEtE in
the Fermaid O and Fermaid E samples (13.5 + 0.5 and 13.3 + 0.8 g L-1, respectively) and
PrEtE in the presence of Fermaid E (92.5 + 5.2 g L-1). The greatest amount of iBuEtE was
also produced by strain LittoLevure in the Superstart treatment (12.2 + 0.3 g L-1), while
LAEtE was most evident in the Fermaid O sample (14.4 + 2.0 mg L-1). Strain VIN7 seemed to
be the low producer of BuEtE and LAEtE, while the LittoLevure was the low PrEtE producer
with less response to nutrient source.

120
Figure 4-26 Concentration of acetic acid esters found in finished Sauvignon blanc grape
wines produced by five yeast strains with four nutrient sources (*10 =
concentration of compound times 10)
Vertical bars represent standard deviations from three fermentation replicates. Means
followed by different letters on the top of the bar are significantly different (p<0.05) among
treatment combinations according to the DMRT test.
19
5.6
ab
cd
ef
26
0.7
ab
c
26
6.4
ab
13
8.3
ef
22
7.6
ab
cd
e
15
8.4
de
f
28
9.4
a
21
3.7
ab
cd
ef
12
3.0
f
19
8.8
ab
cd
ef
15
4.7
de
f
28
4.6
a
24
2.4
ab
cd
15
5.8
de
f
16
8.0
cd
ef
12
2.0
f
21
2.8
ab
cd
ef
27
3.5
a
16
1.6
de
f
17
3.3
bc
de
f
0
100
200
300
EC1118 X5 VIN 7 Alchemy I LittoLevure
Yeast strains
Aceti
c a
cid
eth
yl
este
r (m
g L
-1)
Superstart Fermaid O Fermaid E VUltra
21.2
h
115.3
a
53.0
ef
70.9
d
103.0
ab
29.7
hi
296.1
a
106.5
f
168.0
e
254.3
b
12.3
h
103.4
ab
38.4
g
42.3
fg
92.6
bc
3.6
i
222.8
bcd
51.3
gh
74.6
fg
202.0
cd
e
16.4
h
89.8
bc
53.1
ef
49.4
efg
92.2
bc
18.2
hi
235.1
bc
84.5
fg
98.4
f
232.6
bc
18.3
h
86.9
c
61.6
de
50.0
efg86.2
c
22.9
hi
216.7
cd
102.4
f
104.0
f
195.9
de
0
100
200
300
EC1118 X5 VIN 7 Alchemy I LittoLevure EC1118 X5 VIN 7 Alchemy I LittoLevure
Acetic acid 3-methylbutyl ester *10 Acetic acid 2-methylbutyl ester
Co
nc
en
tra
tio
n (
g L
-1)
14
5.9
hi
41
0.6
a
30
5.6
cd
e
27
4.3
e
35
3.8
b
14
6.7
i
57
6.1
a
33
1.5
ef
45
4.9
d50
7.0
bc
92
.7 j
30
5.5
cd
e
16
7.2
gh
14
9.6
hi
28
8.7
de
12
0.2
i
56
3.2
a
21
8.6
h
34
4.6
e
50
3.2
bc
d
11
1.7
ij
32
5.7
bc
d
20
3.5
fg
18
4.0
fg
h
34
9.6
b
14
3.3
i
53
6.7
ab
26
8.2
g37
6.6
e
49
6.0
bc
d
11
1.6
ij
33
1.0
bc
21
4.6
f
17
7.5
fg
h29
4.8
cd
e
15
6.8
i
53
6.8
ab
29
1.0
fg
35
0.1
e
46
9.1
cd
0
100
200
300
400
500
600
EC1118 X5 VIN 7 Alchemy I LittoLevure EC1118 X5 VIN 7 Alchemy I LittoLevure
Acetic acid hexyl ester Acetic acid 2-phenyl ethyl ester
Co
nc
en
tra
tio
n (
g L
-1)
Superstart Fermaid O Fermaid E VUltra

121
Table 4-15 Concentration of ethyl esters found in finished Sauvignon blanc grape wines
developed by five yeast strains with four nutrient sources
Yeast Nutrient PrEtE
(g L-1
)
BuEtE
(g L-1
)
iBuEtE
(g L-1
)
LAEtE
(mg L-1
)
EC1118 Superstart 98.8 + 11.5 a 366.4 + 19.4 ab 9.6 + 1.3 c 11.0 + 0.8 bcd
Fermaid O 80.5 + 5.0 bc 380.1 + 12.7 a 8.8 + 0.5 cd 9.9 + 0.4 bcde
Fermaid E 83.6 + 15.7 abc 351.3 + 18.1 abc 9.0 + 2.1 cd 10.4 + 0.5 bcde
VUltra 79.5 + 11.1 bc 327.7 + 24.4 c 7.2 + 0.7 de 10.2 + 0.2 bcde
X5 Superstart 58.2 + 12.5 de 361.1 + 39.5 ab 10.0 + 1.3 bc 10.1 + 0.3 bcde
Fermaid O 52.6 + 4.6 ef 326.2 + 19.5 c 10.2 + 0.6 bc 9.3 + 0.1 cde
Fermaid E 62.0 + 6.8 de 338.5 + 8.7 bc 9.2 + 0.6 cd 10.0 + 0.4 bcde
VUltra 60.4 + 8.6 de 338.4 + 9.3 bc 8.8 + 1.1 cd 10.1 + 0.6 bcde
VIN7 Superstart 48.4 + 14.5 def 176.9 + 29.1 f 9.3 + 2.2 c 8.5 + 0.4 e
Fermaid O 39.3 + 6.9 fg 170.6 + 13.4 f 8.5 + 2.0 cde 8.6 + 0.4 de
Fermaid E 47.1 + 6.3 ef 177.6 + 8.4 f 8.9 + 1.4 cd 8.7 + 0.3 de
VUltra 50.8 + 9.7 ef 180.8 + 17.7 f 9.0 + 2.0 cd 9.0 + 0.5 de
Alchemy I Superstart 86.1 + 8.2 abc 325.7 + 17.1 c 9.0 + 0.4 cd 11.0 + 0.3 bcd
Fermaid O 84.3 + 1.4 abc 324.7 + 5.0 c 13.5 + 0.5 a 11.3 + 0.0 bc
Fermaid E 92.5 + 5.2 ab 325.4 + 10.3 c 13.3 + 0.8 a 12.1 + 0.2 b
VUltra 71.1 + 5.2 cd 289.9 + 4.6 c 6.0 + 0.7 e 9.8 + 0.3 bcde
LittoLevure Superstart 37.6 + 2.6 fgh 336.1 + 11.2 bc 12.2 + 0.3 ab 10.4 + 0.4 bcde
Fermaid O 22.9 + 1.7 h 248.1 + 7.0 e 10.0 + 0.3 bc 14.4 + 2.0 a
Fermaid E 29.3 + 2.9 gh 264.2 + 5.1 de 10.2 + 0.4 bc 11.7 + 1.9 b
VUltra 25.1 + 7.0 gh 259.5 + 11.3 e 8.2 + 1.3 cde 10.1 + 0.3 bcde
Each value shows the mean + standard deviation from three fermentation replicates.
Values displaying different letters within the same column are significantly different (p<0.05)
among treatment combinations according to the DMRT test.
Medium-chain fatty acids and their ethyl esters: Table 4-16 and Figure 4-27 show that
the EC1118 strain was the greatest producer of MCFAs, hexanoic acid (7.4 + 0.3 to 7.7
+ 0.5 mg L-1), octanoic acid (6.9 + 0.4 to 7.2 + 0.2 mg L-1) and decanoic acid (1.5 + 0.0 to 1.9
+ 0.1 mg L-1) with less response to the nutrient source. It also developed the highest
concentrations of HAEtE (876.3 + 14.3 to 959.0 + 39.4 g L-1), OAEtE (999.8 + 101.6 to
1114.1 + 12.4 g L-1) and DAEtE (485.7 + 45.2 to 536.2 + 64.8 g L-1). The X5 strain was
also the most forming strain of MCFAs, 7.6 + 0.1 to 8.1 + 0.6 mg L-1 hexanoic acid, 6.4 + 0.1
to 7.1 + 0.3 mg L-1 octanoic acid and 1.6 + 0.1 to 1.8 + 0.2 mg L-1 hexanoic acid. The highest
formation of OAEtE and DAEtE was also most evident in the X5 wines with any source of

122
nutrient (952.1 + 97.4 to 1080.1 + 36.1 g L-1 and 487.9 + 17.4 to 501.2 + 49.4 g L-1,
respectively). On the other hand, strain VIN7 was the lowest producer of MCFAs and their
related ethyl esters.
Monoterpenes: Surprisingly, under the condition in this trial, all monoterpenes, -terpineol,
trans-linalool oxide, cis-linalool oxide and linalool were not detected in all wine treatments
(data not shown).
Table 4-16 Concentration of medium-chain fatty acids found in finished Sauvignon blanc
wines developed by five yeast strains with four nutrient sources
Yeast Nutrient Hexanoic acid
(mg L-1)
Octanoic acid
(mg L-1)
Decanoic acid
(mg L-1)
EC1118 Superstart 7.6 + 0.2 ab 6.9 + 0.4 a 1.5 + 0.0 bc
Fermaid O 7.7 + 0.5 ab 7.0 + 0.4 a 1.7 + 0.2 ab
Fermaid E 7.4 + 0.3 ab 7.2 + 0.2 a 1.9 + 0.0 a
VUltra 7.6 + 0.2 ab 7.0 + 0.2 a 1.9 + 0.1 a
X5 Superstart 8.1 + 0.6 a 7.1 + 0.3 a 1.8 + 0.2 ab
Fermaid O 7.6 + 0.1 ab 6.4 + 0.1 abc 1.7 + 0.0 ab
Fermaid E 7.9 + 0.4 a 6.5 + 0.3 ab 1.6 + 0.1 ab
VUltra 7.9 + 0.2 a 6.7 + 0.3 ab 1.7 + 0.1 ab
VIN7 Superstart 5.2 + 0.4 e 3.8 + 0.4 de 0.8 + 0.2 d
Fermaid O 5.3 + 0.3 e 3.9 + 0.3 de 0.9 + 0.3 d
Fermaid E 5.4 + 0.1 e 3.9 + 0.3 de 0.8 + 0.2 d
VUltra 5.2 + 0.4 e 3.7 + 0.3 de 0.8 + 0.2 d
Alchemy I Superstart 6.5 + 0.2 cd 5.6 + 0.1 c 1.3 + 0.0 c
Fermaid O 5.8 + 0.2 de 4.3 + 0.2 de 0.6 + 0.1 d
Fermaid E 5.8 + 0.1 de 4.4 + 0.2 d 0.6 + 0.0 d
VUltra 6.6 + 0.2 cd 5.9 + 0.3 bc 1.5 + 0.2 bc
LittoLevure Superstart 6.7 + 0.2 cd 5.7 + 0.2 c 1.2 + 0.1 c
Fermaid O 7.0 + 0.2 bc 5.9 + 0.3 bc 1.3 + 0.1 c
Fermaid E 7.0 + 0.3 bc 5.8 + 0.5 bc 1.3 + 0.3 c
VUltra 6.9 + 0.3 bc 5.7 + 0.4 c 1.3 + 0.3 c
Each value shows the mean + standard deviation from three fermentation replicates. Values
displaying different letters within the same column are significantly different (p<0.05) among
treatments according to the DMRT test.

123
Figure 4-27 Concentration of fatty acid ethyl esters found in finished Sauvignon blanc grape wines produced by five yeast strains with four
nutrient sources
Vertical bars represent standard deviations from three fermentation replicates. Means followed by different letters on the top of the bar are
significantly different (p<0.05) among treatment combinations according to the DMRT test.
424.4
bcd
390.3
def
276.1
g
495.2
ab
c
485.7
ab
cd
887.7
de
725.8
f
535.7
g
1011.5
ab
cd
999.8
ab
cd
547.9
ij
582.5
i
528.4
ijk
822.3
de
901.5
ab
c
464.6
ab
cd
495.6
ab
c
320.2
efg
501.2
ab
c
536.2
a
985.3
ab
cd
e
997.2
ab
cd
e
534.4
g
1053.1
ab
c
1097.8
ab
563.8
i
709.2
gh
491.9
jk
789.9
ef9
34.5
ab
417.5
bcd
483.2
ab
cd
304.8
fg
490.2
ab
c
506.8
ab
907.8
cd
e
1003.4
ab
cd
e
532.4
g
1080.1
ab
1114.1
a
565.1
i
741.0
fg
512.5
ijk
838.2
cd
e
959.0
a
404.8
cd
e
464.3
ab
cd
280.1
g
487.9
ab
cd
526.4
a
851.3
ef
860.3
def
512.5
g
952.1
bcd
e
1070.1
ab
547.5
j662.2
h
472.4
k
753.9
fg
876.3
bcd
0
400
800
1200
EC
1118
X5
VIN
7
Alc
hem
y I
Lit
toL
evu
re
EC
1118
X5
VIN
7
Alc
hem
y I
Lit
toL
evu
re
EC
1118
X5
VIN
7
Alc
hem
y I
Lit
toL
evu
re
Hexanoic acid ethyl ester Octanoic acid ethyl ester Decanoic acid ethyl ester
Co
nc
en
tra
tio
n (
g L
-1)
Superstart Fermaid O Fermaid E VUltra

124
4.3 Effects of yeast strains and nutrient supplements on wine fermentation and quality
of yellow passion fruit wines
The experimental results which are described in the following chapters were obtained from
four trials of yellow passion fruit (YPF) juice fermented with different commercial
Saccharomyces yeast strains and/or nutrient sources and concentrations.
4.3.1 Effect of fourteen commercial Saccharomyces yeast strains on fermentative
characteristics, metabolic compounds and aromas of yellow passion fruit wines
In 2009, the fermentation trial was performed in yellow passion fruit (YPF) juice. Fourteen
commercial yeast strains; EC1118, Sauvignon, VL3, X5, X16, VIN13, Alchemy I, Alchemy II,
4F9, LVCB, LittoLevure, AWRI R2, QA23 and Freddo were used in fermentation of this YPF
trial. These commercial yeast strains were obtained from the basis results of the Sauvignon
blanc and Scheurebe grape wines. The fermentation kinetics, some metabolic and aromatic
compounds in obtained YPF wines were investigated.
Fermentation kinetics: The results show that the fourteen commercial yeast strains had
significantly different fermentation kinetics (Figure 4-28). The VIN13, LVCB and QA23 had
the fastest growth kinetics and the shortest fermentation times for 20 days, followed by
strains EC1118, Alchemy I and II, X5, 4F9 and Freddo (21 days). While, strain Sauvignon
had a long lag phase (5 days) and resulted in a sluggish fermentation kinetic and duration
(28 days), strain AWRI R2 followed similar pattern, however had shorter lag phase (4 days).
Nevertheless, the fourteen yeast strains completed fermentations and reached dryness with
low residual sugar below 4 g L-1 (Figure 4-29).
Chemical composition: As shown in Figure 4-29, strain X16 produced the highest amount
of glycerol in YPF wine (6.0 + 0.0 g L-1), followed by the LittoLevure and AWRI R2 (5.9 + 0.2
and 5.7 + 0.1 g L-1, respectively). On the other hand, the EC1118 strain was the lowest
glycerol producer as well as strain X5 (4.9 + 0.2 and 5.0 + 0.1 g L-1, respectively). The YPF
fermentations with either Alchemy I or X16 strain had the highest amounts of residual sugar
(1.5 + 0.2 and 1.3 + 0.0 g L-1, respectively). However, their concentrations resulted in
dryness. While, the QA23, LVCB, 4F9 and AWRI R2 strains produced YPF wines having low
amounts of residual sugar (0.3 + 0.1, 0.4 + 0.1, 0.5 + 0.1 and 0.4 + 0.1 g L-1, respectively).

125
Figure 4-28 Growth kinetics of YPF juice fermentations with 14 different commercial yeast
strains
Figure 4-29 Concentration of residual sugar and glycerol in finished YPF wines produced by
14 different yeast strains
Vertical bars represent standard deviations from three fermentation replicates. Means
followed by different letters on the top of the bar are significantly different (p<0.05) among
yeast strains of each compound according to the DMRT test.
0
10
20
30
40
50
60
70
80
90
100
1 2 3 4 5 6 7 8 9 10 11 13 14 15 16 17 18 19 20 21 22 23 24 25 26 27 28
Fermentation days
carb
on
dio
xid
e (
g L
-1)
EC1118
SauvignonVL3
X5X16
VIN13Alchemy I
Alchemy II4F9
LVCBLittoLevure
AWRI R2QA23
Freddo
1.0
bc
4.9
h
1.0
bc
5.4
cd
e
1.0
bc
5.5
cd
0.9
cd
5.0
gh
1.3
ab
6.0
a
1.1
bc
5.5
cd
1.5
a
5.1
efg
h
1.0
bc
5.4
de
f
0.5
de
f
5.3
de
fg
0.4
ef
5.5
cd
1.0
bc
5.9
ab
0.4
ef
5.7
bc
0.3
f
5.1
fg
h
0.9
cd
5.1
fg
h
0
1
2
3
4
5
6
7
Glycerol Residual sugar
Co
ncen
trati
on
(g
L-1
)
EC1118 Sauvignon VL3 X5 X16 VIN13 Alchemy I
Alchemy II 4F9 DSM LVCB LittoLevure AWRI R2 QA23 Freddo

126
Table 4-17 Concentration of organic acids found in finished YPF wines produced by 14 yeast
strains
Yeast Citric acid (g L-1) Malic acid (g L-1) Acetic acid (g L-1)
EC1118 3.63 + 0.04 a 0.68 + 0.01 de 0.29 + 0.02 cd
Sauvignon 3.67 + 0.02 a 0.91 + 0.11 b 0.22 + 0.01 fg
VL3 3.67 + 0.02 a 0.74 + 0.03 de 0.26 + 0.01 de
X5 3.62 + 0.02 a 0.66 + 0.01 ef 0.29 + 0.01 cd
X16 3.65 + 0.03 a 1.15 + 0.03 a 0.26 + 0.01 de
VIN13 3.61 + 0.07 a 0.75 + 0.02 d 0.31 + 0.01 c
Alchemy I 3.62 + 0.03 a 0.55 + 0.01 g 0.39 + 0.01 a
Alchemy II 3.61 + 0.01 a 0.56 + 0.01 g 0.39 + 0.01 a
4F9 3.54 + 0.01 a 0.91 + 0.01 b 0.23 + 0.01 fg
LVCB 3.59 + 0.03 a 0.59 + 0.03 fg 0.35 + 0.01 b
LittoLevure 3.60 + 0.02 a 0.83 + 0.11 c 0.24 + 0.03 ef
AWRI R2 3.65 + 0.01 a 0.67 + 0.03 def 0.38 + 0.03 a
QA23 3.64 + 0.08 a 0.52 + 0.01 g 0.27 + 0.01 de
Freddo 3.59 + 0.02 a 0.70 + 0.03 de 0.21 + 0.02 g
Each value shows the mean + standard deviation from three fermentation replicates.
Values displaying the same letter (only ‗a‘) within the same column indicate no significant
difference (p>0.05), whereas those displaying different letters are significantly different
(p<0.05) according to the DMRT test.
Organic acids: The data in Table 4-17 show that concentrations of citric acid were similar
among the YPF wines ranging from 3.54 + 0.01 to 3.67 + 0.02 g L-1. Whereas, the other
organic acids like lactic, tartaric and shkimic acid were not detected in all YPF wines.
Concentrations of malic acid were most evident in the YPF fermentation with X16 (1.15 +
0.03 g L-1), followed by strains Sauvignon and 4F9 (0.91 + 0.11 to 0.91 + 0.01 g L-1,
respectively), but less present in YPF wines of Alchemy I, II and QA23. In addition, the X16
strain produced about two-fold of initial malic acid amounts in the YPF juice, whereas strains
4F9 and Sauvignon catalyzed approximately 80 %. Strains Alchemy I and II and AWRI R2
were the highest acetic acid producers (0.39 + 0.01, 0.39 + 0.01 and 0.38 + 0.03 g L-1,
respectively), while strains Sauvignon, 4F9 and Freddo were the lowest producers (0.22 +
0.01, 0.23 + 0.01 and 0.21 + 0.02 g L-1, respectively).

127
Figure 4-30 Concentration of SO2-binding compounds in finished YPF wines produced by 14
different yeast strains
Vertical bars represent standard deviations from three fermentation replicates. Means
followed by different letters on the top of the bar are significantly different (p<0.05) between
yeast strains of each compound according to the DMRT test.
SO2-binding compounds: The results show that fourteen Saccharomyces yeast strains
produced different concentrations of these compounds in final YPF wines (Figure 4-30). The
Sauvignon, 4F9 and X16 strain appeared to be the most -ketoglutarate producers in YPF
wines (313.3 + 22.8, 337.2 + 7.5 and 316.7 + 8.5 mg L-1, respectively). The first strain was
also the greatest pyruvate producer (121.2 + 18.7 mg L-1) as well strain Freddo (105.6
+ 11.9 mg L-1). While, strain QA23 was the least producer of both keto acids (47.8 + 1.8 and
9.4 + 0.7 mg L-1, respectively), on the contrary, it produced a great amount of acetaldehyde
(27.7 + 1.2 mg L-1) in the YPF wine. Nevertheless, the EC1118 and 4F9 strains produced the
highest concentrations of acetaldehyde (32.0 + 9.3 and 29.1 + 0.5 mg L-1, respectively),
whereas this compound was least present in the YPF wines from strains Alchemy I and II.
17
7.8
de
31
3.1
a
19
9.7
cd
13
4.6
f
31
6.7
a
11
3.2
fg
13
0.3
f
12
0.8
fg
33
7.2
a
10
1.1
g
15
9.4
e
20
4.4
c
47
.8 h
23
5.8
b
0
70
140
210
280
350
-Ke
tog
luta
rate
(m
g L
-1)
32
.0 a
75
.2 c
d
23
.9 b
cd
e
12
1.2
a
26
.7 b
cd
20
.0 f
g
22
.4 c
de
24
.0 e
fg
25
.7 b
cd
e
90
.1 b
c
23
.3 c
de
28
.9 e
f
21
.2 e
84
.5 c
d
20
.4 e
71
.8 d
29
.1 a
b
10
2.1
b
26
.9 b
cd
31
.5 e
f
25
.2 b
cd
e
15
.5 f
g
22
.0 d
e40
.8 e
27
.7 a
bc
9.4
g 26
.8 b
cd
10
5.6
ab
0
35
70
105
140
Pyruvate Acetaldehyde
Co
nc
en
tra
tio
n (
mg
L-1
)
EC1118 Sauvignon VL3 X5 X16 VIN13 Alchemy I
Alchemy II 4F9 DSM LVCB LittoLevure AWRI R2 QA23 Freddo

128
Figure 4-31 Concentration of carbon disulphide and thioacetic acid S-methylester found in
finished YPF wines produced by 14 different yeast strains
Vertical bars represent standard deviations from three fermentation replicates. Means
followed by different letters on the top of the bar are significantly different (p<0.05) between
yeast strains of each compound according to the DMRT test.
n.d. denotes not detected.
Sulphur containing compounds: Figure 4-31 shows the significant differences of these
compounds produced by the fourteen yeast strains. The Alchemy II and LittoLevure strains
were the greatest carbon disulphide producers (27.5 + 1.2 and 23.1 + 1.5 g L-1,
respectively), while strain AWRI R2 was the lowest producer. The highest amounts of
thioacetic acid S-methylester were produced by strains VIN13 and LittoLevure (11.6 + 1.7
and 11.5 + 1.3 g L-1, respectively), followed by AWRI R2, X16, Alchemy II and LVCB (5.6 +
1.6, 3.2 + 0.4, 3.5 + 0.7 and 2.4 + 0.4 µg L-1, respectively), while other yeast strains did not
produce MeSAc. In addition, all YPF wines did not reveal the other S-compounds, H2S, DMS,
DMDS, ethanethiol, methanethiol and thioacetic acid S-ethylester.
Higher alcohols: Figure 4-32 shows that concentrations in YPF wines significantly differed
depending on the yeast strains used. Strains X16 and AWRI R2 were the highest producers
of 2-methyl propanol (154.5 + 7.9 and 143.7 + 16.3 mg L-1, respectively), followed by strain
Sauvignon (131.5 + 1.9 mg L-1). Strain LittoLevure developed the greatest amounts of 3-
methyl butanol, 2-methyl butanol and 2-phenyl ethanol (206.1 + 12.4, 38.0 + 3.2 and 40.2 +
6.1 mg L-1, respectively). 2-Phenyl ethanol was also most present in the QA23 wine (39.5 +
2.2 mg L-1) but least amount of 2-methyl propanol (24.8 + 0.8 mg L-1) was detected in this
wine. The 3-methyl and 2-methyl butanol were also most evident in the AWRI R2 and VIN13
wines (185.0 + 16.0, 31.6 + 3.2 mg L-1 and 170.7 + 15.3, 33.6 + 3.6 mg L-1, respectively).
8.8
hi
n.d
.
12.8
f
n.d
.
10.2
gh
n.d
.
7.1
i
n.d
.
15.5
de
3.2
c
16.4
cd
11.6
a
18.2
c
n.d
.
27.5
a
3.5
c
8.9
hi
n.d
.
13.8
ef
2.4
c
23.1
b
11.5
a
2.6
j
5.6
b
13.4
ef
n.d
.
11.5
fg
n.d
.
0
7
14
21
28
35
Carbon disulphide Thioacetic acid S-methyl ester
Co
ncen
trati
on
(
g L
-1)
EC1118 Sauvignon VL3 X5 X16 VIN13 Alchemy IAlchemy II 4F9 LVCB LittoLevure AWRI R2 QA23 Freddo

129
Figure 4-32 Concentration of higher alcohols found in finished YPF wines developed by 14
different yeast strains
Vertical bars represent standard deviations from three fermentation replicates. Means
followed by different letters on the top of the bar are significantly different (p<0.05) among
yeast strains of each compound according to the DMRT test.
Acetic acid esters: The results in Figure 4-33 show that concentrations of acetic acid ethyl
ester in YPF wine were out of the calibration standard value, therefore they were present as
relative peak area. The production of acetic acid ethyl ester was slightly different among
yeast strains, strains EC1118, X5, VIN13 and Alchemy II tented to be the highest producers
(relative peak area ranging from 8.8 + 0.0 to 8.9 + 0.5), while strains 4F9 and Freddo were
the lowest producers. The LittoLevure strain was the most predominant producer of the other
acetic acid esters, acetic acid 3- and 2-methylbutyl ester, acetic acid 2-phenylethyl ester and
acetic acid hexyl ester (1729.0 + 188.9, 72.9 + 17.0, 236.7 + 30.6 and 14.1 + 1.4 g L-1,
respectively). The QA23 and VIN13 followed a similar pattern of these ester productions,
however in slightly lower amounts, except for the latter ester that they also produced in the
highest amounts (14.3 + 0.6 and 13.2 + 0.7 g L-1, respectively).
14
.2 c
d
11
6.9
cd
14
.6 c
d
13
1.5
bc
15
.2 c
d
10
6.7
de
12
.2 d
64
.4 h
14
.4 c
d
15
4.5
a
25
.9 b
80
.8 f
gh
11
.9 d
84
.2 f
g
13
.0 c
d
80
.5 f
gh
13
.2 c
d
11
4.1
d
22
.8 b
71
.7 g
h
40
.2 a
80
.7 g
h
17
.5 c
14
3.7
ab
39
.5 a
24
.8 i
14
.5 c
d
93
.7 e
f
0
40
80
120
160
2-Methyl propanol 2-Phenyl ethanol
Co
nc
en
tra
tio
n (
mg
L-1
)
29
.5 c
de
f
15
8.4
cd
28
.4 c
de
fg
16
2.9
cd
30
.8 b
c
15
1.3
cd
25
.1 g
h
10
8.8
e
29
.9 b
cd
e
16
7.6
bc
33
.6 b
17
0.7
bc
25
.9 e
fg
10
1.6
e
26
.9 d
efg
10
4.8
e
25
.5 f
gh
14
5.4
d
28
.7 c
de
fg
16
0.7
cd
38
.0 a
20
6.1
a
31
.6 b
c
18
5.0
b
30.1
bcd
153.9
cd
21
.9 h
14
6.6
d
0
50
100
150
200
3-Methyl butanol 2-Methyl butanol
Co
nc
en
tra
tio
n (
mg
L-1
)
EC1118 Sauvignon VL3 X5 X16 VIN13 Alchemy IAlchemy II 4F9 LVCB LittoLevure AWRI R2 QA23 Freddo

130
Figure 4-33 Concentration of acetic acid esters found in finished YPF wines developed by 14
different yeast strains (*10 = concentration of compound times 10, whereas /10
= concentration of compound divides by 10)
Vertical bars represent standard deviations from three fermentation replicates. Means
followed by different letters on the top of the bar are significantly different (p<0.05) between
yeast strains of each compound according to the DMRT test.
Relative peak area = (peak area of sample)/(Peak area of internal standard)
8.8
a
7.5
c 8.6
ab
8.8
a
8.1
ab
c
8.9
a
8.6
ab
8.8
a
6.4
d
8.2
ab
c
8.3
ab
c
8.5
ab
7.8
bc
6.4
d
0
4
8
12
Acetic acid ethyl ester
Rela
tive p
eak a
rea
34
.9 d
e
21
.9 e
20
.8 f
g
11
.4 e
42
.6 d
18
.1 e
17
.8 f
gh
13
.5 e
74
.0 c
34
.3 d
95
.4 b
51
.0 c
4.7
h 18
.8 e
8.8
gh
19
.6 e
25
.6 e
f
12
.2 e
75
.1 c
40
.5 d
17
2.9
a
72
.9 a
43
.5 d
16
.3 e
99
.9 b
62
.6 b
34
.3 d
e
14
.8 e
0
45
90
135
180
Acetic acid 3-methylbutyl ester*10 Acetic acid 2-methylbutyl ester
Co
nc
en
tra
tio
n (
g L
-1)
41
.3 d
e
91
.8 d
e
28
.7 e
82
.2 e
36
.2 d
e
99
.7 d
e
35
.1 d
e
10
1.1
cd
50
.5 d
12
4.9
b
11
7.0
c
13
1.9
ab
99
.4 c
d
38
.4 d
e
10
6.3
c
45
.3 d
e
10
0.3
cd
31
.7 d
e
13
1.4
b
10
0.5
c
14
1.2
a
23
6.7
a
97
.5 c
d
36
.0 d
e
14
3.0
a
20
3.1
b
10
2.0
cd
42
.9 d
e
0
50
100
150
200
250
Acetic acid hexyl ester/10 Acetic acid 2-phenylethyl ester
Co
nc
en
tra
tio
n (
g L
-1)
EC1118 Sauvignon VL3 X5 X16 VIN13 Alchemy IAlchemy II 4F9 LVCB LittoLevure AWRI R2 QA23 Freddo

131
Figure 4-34 Concentration of ethyl esters found in finished YPF wines developed by 14
different yeast strains ( /1000 = concentration of compound divides by 1000)
Vertical bars represent standard deviations from three fermentation replicates. Means
followed by different letters on the top of the bar are significantly different (p<0.05) between
yeast strains of each compound according to the DMRT test.
Ethyl esters: Figure 4-34 shows that strains Sauvignon, X5 and EC1118 were the greatest
producers of propionic acid ethyl ester (81.4 + 2.5, 82.4 + 7.2 and 74.6 + 8.4 g L-1,
respectively), followed by strain VIN13 (70.5 + 2.3 g L-1). The X16 was the highest producer
of ethyl esters of lactic acid and isobutanoic acid (36.1 + 1.2 mg L-1 and 92.3 + 9.2 g L-1,
respectively), followed by strain Sauvignon in respect to the former ester (29.0 + 1.6 mg L-1),
and strain AWRI R2 regarding the latter ester (72.2 + 16.4 g L-1). For butanoic acid ethyl
ester, the QA23 and Freddo strains were the most predominant producers (230.5 + 4.8 and
217.8 + 3.3 g L-1, respectively) and were followed by strains LVCB and EC1118 (200.1 +
6.8 and 189.6 + 7.2 g L-1, respectively), while the Alchemy I and II were the lowest
producers (87.7 + 3.6 and 92.2 + 1.4 g L-1, respectively). Of all ethyl esters, strain QA23
produced the least concentration of ethyl esters, except for butanoic acid ethyl ester.
22
.2 d
74
.6 a
b
29
.0 b
81
.4 a
17
.0 e
65
.6 b
cd
15
.3 f
82
.4 a
36
.1 a
52
.6 e
f
13
.9 f
g
70
.5 b
18
.7 e
58
.6 d
e
17
.7 e
59
.1 c
de
25
.9 c
69
.6 b
c
13
.4 g
47
.5 e
f
13
.4 f
g
56
.5 d
e
23
.2 d
69
.5 b
c
11
.2 h
42
.1 f
24
.1 d
48
.0 e
f
0
20
40
60
80
100
Propionic acid ethyl ester Lactic acid ethyl ester/1000
Co
nce
ntr
ati
on
(
g L
-1)
34
.9 d
ef
18
9.6
bc
44
.6 c
d
16
6.0
ef
54
.3 c
15
4.6
f
25
.2 f
16
3.2
ef
92
.3 a
13
0.9
g
30
.2 e
f
16
9.0
de
31
.1 d
ef
87
.7 h
29
.2 e
f
92
.2 h
42
.8 c
de
18
0.4
cd
24
.1 f
20
0.1
b
34
.9 d
ef
16
1.8
ef
72
.2 b
13
4.0
g
7.9
g
23
0.5
a
33
.9 d
ef
21
7.8
a
0
60
120
180
240
Butanoic acid ethyl ester Isobutanoic acid ethyl ester
Co
nc
en
tra
tio
n (
g L
-1)
EC1118 Sauvignon VL3 X5 X16 VIN13 Alchemy I Alchemy II 4F9 LVCB LittoLevure AWRI R2 QA23 Freddo

132
Monoterpenes: The results show that fourteen yeast strains released significantly different
linalool concentrations, but they had similar ability to liberate -terpineol ranging from 12.1 +
0.2 to 13.2 + 0.6 g L-1 (Figure 4-35). However, cis-linalool oxide and trans-linalool oxide
were not detected in all YPF wines. Regarding the linalool, strain QA23 was the most
releasing strain (11.7 + 0.8 g L-1), followed by strains Alchemy II and I and 4F9 (11.4 + 1.8,
10.0 + 1.0 and 10.1 + 0.9 g L-1, respectively), whereas strains X16 and VL3 were the least
releasers.
Medium-chain fatty acids and their ethyl esters: The formation of these compounds were
significantly different among the fourteen commercial yeast strains used (Table 4-18 and
Figure 4-36). The QA23 was the greatest producer of all MCFAs; hexanoic, octanoic and
decanoic acid (6.2 + 0.0, 7.3 + 0.6 and 1.6 + 0.1 mg L-1, respectively), and their ethyl esters;
HAEtE, OAEtE and DAEtE (758.6 + 48.7, 1111.6 + 60.7 and 387.0 + 32.8 g L-1,
respectively). High concentrations of these compounds were also produced by strains LVCB
(5.7 + 0.0, 6.3 + 0.0, 1.3 + 0.1 mg L-1 and 564.0 + 5.8, 1004.4 + 19.4, 338.9 + 9.4 g L-1,
respectively) and Freddo (5.1 + 0.6, 5.3 + 0.6, 1.1 + 0.1 mg L-1 and 485.2 + 4.9, 816.5 + 18.8,
250.9 + 16.9 g L-1, respectively). On the contrary, strain X16 was the least MCFA and ethyl
ester producer.
Figure 4-35 Concentration of linalool and -terpineol found in finished YPF wines developed
by 14 different yeast strains
Vertical bars represent standard deviations from three fermentation replicates. Means
followed by different letters on the top of the bar are significantly different (p<0.05) between
yeast strains of each compound, whereas those displaying the same letters are not
significantly different (p>0.05) according to the DMRT test.
9.1
cd
e
12
.3 a
8.5
cd
e
12
.9 a
7.5
de
12
.5 a
8.4
cd
e
12
.6 a
7.2
e
12
.9 a
9.2
cd
e
12
.3 a
10
.0 a
bc
12
.5 a
11
.4 a
b
12
.2 a
10
.1 a
bc
13
.1 a
9.7
bc 1
2.1
a
9.3
cd 1
2.2
a
8.4
cd
e
12
.6 a
11
.7 a
12
.4 a
8.3
cd
e
13
.2 a
0
5
10
15
Linalool alpha-Terpineol
Co
ncen
trati
on
(
g L
-1)
EC1118 Sauvignon VL3 X5 X16 VIN13 Alchemy I Alchemy II 4F9 LVCB LittoLevure AWRI R2 QA23 Freddo

133
Table 4-18 Concentration of fatty acids found in finished YPF wines developed by 14 yeast
strains
Yeast Hexanoic acid
(mg L-1)
Octanoic acid
(mg L-1)
Decanoic acid
(mg L-1)
EC1118 4.2 + 0.0 d 3.9 + 0.0 d 0.6 + 0.1 i
Sauvignon 4.2 + 0.0 d 4.0 + 0.0 d 0.6 + 0.1 hi
VL3 4.4 + 0.6 cd 4.3 + 0.0 d 0.8 + 0.1 efgh
X5 4.5 + 0.6 cd 4.7 + 0.6 cd 0.9 + 0.0 cdef
X16 3.4 + 0.0 e 2.6 + 0.6 e 0.3 + 0.1 j
VIN13 4.2 + 0.0 cd 4.3 + 0.0 d 0.7 + 0.1 fghi
Alchemy I 4.1 + 0.0 cd 4.2 + 0.0 d 0.8 + 0.1 defg
Alchemy II 4.5 + 0.6 cd 4.6 + 0.6 cd 1.0 + 0.1 c
4F9 4.7 + 0.0 b 4.9 + 0.0 c 0.9 + 0.1 cde
LVCB 5.7 + 0.0 a 6.3 + 0.0 b 1.3 + 0.1 b
LittoLevure 4.5 + 0.6 bc 4.3 + 0.6 cd 0.7 + 0.2 ghi
AWRI R2 4.1 + 0.0 d 3.7 + 0.0 d 0.6 + 0.1 hi
QA23 6.2 + 0.0 a 7.3 + 0.6 a 1.6 + 0.1 a
Freddo 5.1 + 0.6 b 5.3 + 0.6 c 1.1 + 0.1 c
Each value shows the mean + standard deviation from three fermentation replicates.
Values displaying different letters within the same column are significantly different (p<0.05)
according to the DMRT test.
Figure 4-36 Concentration of fatty acid ethyl esters found in finished YPF wines developed
by 14 different yeast strains
Vertical bars represent standard deviations from three fermentation replicates. Means
followed by different letters on the top of the bar are significantly different (p<0.05) between
yeast strains of each compound according to the DMRT test.
309.5
f
555.4
f
155.5
gh
331.4
f
540.5
f
174.4
fg
h
319.0
f
690.7
de
199.4
efg
384.3
e
786.3
c
277.7
c
141.2
h
298.9
g
50.9
i
326.8
f
646.9
e
220.2
def
316.5
f
558.5
f
233.1
cd
e
352.8
ef
651.2
e
268.5
cd
435.1
d
765.7
cd
243.4
cd
e
564.0
b
1004.4
b
338.9
b
327.9
f
644.1
e
158.4
gh
220.4
g
486.0
f
143.0
h
758.6
a
1111.6
a
387.0
a
485.2
c
816.5
c
250.9
cd
e
0
400
800
1200
Hexanoic acid ethyl ester Octanoic acid ethyl ester Decanoic acid ethyl ester
Co
nc
en
tra
tio
n (
g L
-1)
EC1118 Sauvignon VL3 X5 X16 VIN13 Alchemy I Alchemy II 4F9 LVCB LittoLevure AWRI R2 QA23 Freddo

134
4.3.2 Effect of three commercial Saccharomyces strains and five different commercial
nutrient sources on growth kinetics, fermentative characteristics, metabolic
compounds and aromas of yellow passion fruit wines
The fermentation trial was performed in yellow passion fruit (YPF) juice in 2008. Three
commercial yeast strains; EC1118, Sauvignon and X5, and five commercial nutrient sources,
DAP, Vitamon Combi (VCombi), Vitamon Ultra (VUltra), Fermaid E blanc (Fermaid E) and
OptiWhite at 0.4 g L-1 were used in the fermentation YPF trial. The fermentation kinetics and
some non-volatile and volatile compounds in final YPF wines were examined. The two S.
cerevisiae yeast strains; Sauvignon and X5, were chosen from the basis results obtained
from a previous trial of Sauvignon blanc and Scheurebe grape wines as well as the YPF trial.
They are considered to have relatively high nitrogen demands and their fermentation
performances are considered to be more susceptible to nitrogen deficiency. Additionally, they
also tended to produce wines having desirable fermentative characteristics and quality.
Whereas, the EC1118 strain was used as a control strain due to its high popularity in wine
industry and its tendency to produce less undesirable components.
Figure 4-37 Fermentation kinetics of YPF juice fermentations with three different commercial
yeast strains and four different nutrient sources
0
10
20
30
40
50
60
70
80
90
1 3 5 7 9 11 13 15 17 19 21 23 26 28 30 33 35 37 40 42 44 47
Carb
on
dio
xid
e (
g L
-1)
Fermentation day
EC1118-DAP
EC1118-VCombi
EC1118-VUltra
EC1118-Fermaid E
EC1118-OptiWhite
Sauvignon-DAP
Sauvignon-VCombi
Sauvignon-VUltra
Sauvignon-Fermaid E
Sauvignon-OptiWhite
X5-DAP
X5-VCombi
X5-VUltra
X5-Fermaid E
X5-OptiWhite

135
The fermentation kinetics: As shown in Figure 4-37, the EC1118 strain seemed to have
the fastest growth kinetics and time, while strain Sauvignon had the slowest kinetics,
however varied depending on the nutrient source. The addition of VCombi, VUltra and
Fermaid E enhanced strain EC1118 to have a similarly short lag phase and helped to finish
fermentations after 23 days, on the contrary, in the DAP and OptiWhite samples they
prolonged the fermentations to finish after 29 days. For strain X5, the fermentation kinetics
were relatively more responsive to the nutrient source than strain EC1118. Thus, the duration
of fermentation was shortest in the VCombi treatment (23 days), while addition of other
nutrients like DAP, VUltra, Fermaid E and OptiWhite, seemed to prolong the fermentation
time (27, 28, 36 and 43 days of fermentation, respectively). Nevertheless, the YPF
fermentations with both yeast strains completely finished. The Sauvignon strain tended to
have inverse behaviour. In all nutrient sources, its fermentations had a long lag phase (5-12
days) and resulted in sluggish fermentation varying from 36 to 47 days. Nonetheless, all YPF
fermentations with this strain completely finished as well.
Chemical composition: Three yeast strains produced YPF wines having different amounts
of residual sugar in response to the nutrient source (Table 4-19). Concentrations of residual
sugar were most evident in YPF wines produced by strain Sauvignon with the addition of
VUltra, Fermaid E and OptiWhite (1.5 + 0.2, 1.6 + 0.1 and 1.4 + 0.3 g L-1, respectively),
followed by with VCombi supplementation (1.1 + 0.2 g L-1). Nevertheless, the three yeast
strains consumed practically almost the initial sugar concentration provided (201 g L-1 as
given in 3.9.2) and resulted in low residual sugar below 2 g L-1, which helped to achieve
dryness in final YPF wines. In addition, there was no significant difference in glycerol
formation among the treatment combinations ranging from 4.6 + 1.1 to 6.2 + 0.3 g L-1.
Organic acids: The results demonstrate that the commercial yeast strains and the nutrient
sources significantly affected the concentration of organic acids in YPF wines (Table 4-20).
Strain Sauvignon synthesized the highest amounts of malic acid in the DAP treatment (1.47
+ 0.24 g L-1) and acetic acid in the Fermaid E and OptiWhite samples (0.47 + 0.05 and 0.48 +
0.04 g L-1, respectively). Strain Sauvignon synthesized malic acid approximately 64.7 % in
the DAP treatment and 39.5 % in the VCombi fermentation, while strain X5 produced 39.5 %
malic acid in the Fermaid E treatment. The highest amounts of citric acid were present in
YPF wine of strain X5 with the addition of OptiWhite (3.70 + 0.03 g L-1) and strain Sauvignon
with the DAP treatment (3.67 + 0.04 g L-1).

136
Table 4-19 Chemical composition of finished YPF wines obtained from frozen YPF juices
fermented with three different yeast strains and five nutrient sources
Yeast Nutrient Residual sugar (g L-1) Glycerol (g L-1)
EC1118 DAP 0.2 + 0.1 ef 4.8 + 0.1 a
VCombi 0.4 + 0.2 def 4.9 + 0.0 a
VUltra 0.2 + 0.1 f 4.9 + 0.1 a
Fermaid E 0.5 + 0.2 cde 4.8 + 0.2 a
OptiWhite 0.5 + 0.2 cdef 4.8 + 0.1 a
Sauvignon DAP 0.7 + 0.2 c 5.9 + 0.1 a
VCombi 1.1 + 0.2 b 6.2 + 0.3 a
VUltra 1.5 + 0.2 a 5.9 + 0.2 a
Fermaid E 1.6 + 0.1 a 6.1 + 0.1 a
OptiWhite 1.4 + 0.3 a 5.4 + 0.5 a
X5 DAP 0.4 + 0.1 def 4.9 + 0.0 a
VCombi 0.3 + 0.1 ef 4.8 + 0.1 a
VUltra 0.3 + 0.1 ef 4.7 + 0.1 a
Fermaid E 0.5 + 0.2 cdef 4.7 + 0.1 a
OptiWhite 0.6 + 0.1 cd 4.6 + 1.1 a
Each value shows the mean + standard deviation from three fermentation replicates.
Values displaying the same letter (only ‗a‘) within the same column indicate no significant
difference (p>0.05) among treatment combinations, whereas those displaying different letters
are significantly different (p<0.05) according to the DMRT test.
SO2-binding compounds: Figure 4-38 shows that the commercial yeast strains and the
nutrient sources significantly affected the production of these compounds in YPF wines. In
the DAP treatment, the greatest concentrations of -ketoglutarate were formed by strain
Sauvignon (338.1 + 22.9 mg L-1), followed by strain EC1118 (150.2 + 31.5 mg L-1) and that of
pyruvate by these two strains (62.0 + 14.4 and 61.5 + 6.8 mg L-1, respectively). The X5
seemed to be the lowest producer of both keto acids with less response to nutrient sources,
although the production slightly increased in the OptiWhite sample. Nevertheless, the
addition of VCombi, VUltra and Fermaid E significantly diminished the formation of these
keto acids. On the other hand, these three nutrient sources stimulated the highest
acetaldehyde formation in YPF wines by the EC1118 strain (31.6 + 0.2, 29.9 + 0.9 and 30.3
+ 0.5 mg L-1, respectively). This compound was also most evident in the YPF fermentation
with strain X5 in the presence of VCombi (29.8 + 1.9 mg L-1).

137
Table 4-20 Concentration of organic acids found in finished YPF wines produced by three
different yeast strains with five nutrient sources
Yeasts Nutrients Malic acid (g L-1) Acetic acid (g L-1) Citric acid (g L-1)
EC1118 DAP 0.66 + 0.01 cd 0.27 + 0.01 def 3.53 + 0.01 fgh
VCombi 0.55 + 0.01 d 0.28 + 0.03 de 3.54 + 0.02 efgh
VUltra 0.58 + 0.01 d 0.29 + 0.01 cd 3.55 + 0.02 defgh
Fermaid E 0.60 + 0.01 d 0.34 + 0.01 bc 3.58 + 0.05 cdef
OptiWhite 0.63 + 0.01 cd 0.38 + 0.01 b 3.57 + 0.01 def
Sauvignon DAP 1.47 + 0.24 a 0.35 + 0.04 b 3.67 + 0.04 ab
VCombi 0.89 + 0.27 b 0.35 + 0.07 b 3.56 + 0.04 defg
VUltra 0.74 + 0.01 bcd 0.38 + 0.02 b 3.59 + 0.01 cde
Fermaid E 0.72 + 0.03 bcd 0.47 + 0.05 a 3.61 + 0.01 cd
OptiWhite 0.62 + 0.04 cd 0.48 + 0.04 a 3.64 + 0.02 bc
X5 DAP 0.68 + 0.03 cd 0.27 + 0.00 def 3.50 + 0.00 gh
VCombi 0.73 + 0.03 bcd 0.22 + 0.01 f 3.59 + 0.02 cdef
VUltra 0.80 + 0.04 bc 0.23 + 0.01 ef 3.49 + 0.01 h
Fermaid E 0.86 + 0.01 b 0.24 + 0.00 ef 3.60 + 0.01 cd
OptiWhite 0.79 + 0.01 bc 0.34 + 0.01 bc 3.70 + 0.03 a
Each value shows the mean + standard deviation from three fermentation replicates.
Values displaying different letters within the same column are significantly different (p<0.05)
among treatment combinations according to the DMRT test.
Sulphur containing compounds: The results in Figure 4-39 demonstrate that three
commercial yeast strains significantly produced different compounds in response to the
nutrient source. Addition of DAP promoted the greatest production of H2S and CS2 by strain
EC1118 (7.2 + 1.5 and 19.1 + 2.8 g L-1, respectively), whereas addition of VCombi and
VUltra resulted in the highest formation of methanethiol (7.3 + 1.0 and 7.4 + 1.0 g L-1,
respectively). However, methanethiol was either not detected or present in trace quantities in
the other YPF wine treatments. Strain Sauvignon seemed to be the most predominant CS2
producer with less response to the nutrient source (15.0 + 1.6 to 21.8 + 3.6 g L-1) and also
developed a high level of H2S in the presence of DAP (5.3 + 1.2 g L-1). Under the condition
in this trial, the other sulphur compounds, ethanethiol, dimethyl sulphide, dimethyl disulphide,
thioacetic acid S-methylester, thioacetic acid S-ethylester, diethyl disulphide and dimethyl
trisulphide were not detected in all YPF wines.

138
Figure 4-38 Concentration of SO2-binding compounds found in finished YPF wines produced
by three different yeast strains with five nutrient sources
Vertical bars represent standard deviations from three fermentation replicates. Means
followed by different letters on the top of the bar are significantly different (p<0.05) among
treatment combinations of each compound according to the DMRT test.
67
.8 f
gh
33
8.1
a
15
0.2
b
51
.4 h85
.7 d
ef
45
.3 h
58
.9 g
h
10
7.3
cd
50
.1 h
62
.9 f
gh
11
2.8
c
53
.0 h 94
.9 c
de
11
0.0
c
80
.0 e
fg0
100
200
300
400
EC1118 Sauvignon X5
-K
eto
glu
tara
te (
mg
L-1
)
16
.2 e
62
.0 a
61
.5 a
9.5
ef
5.0
f12
.3 c
d
10
.6 e
f
7.3
f
17
.5 c
d
5.9
f7.3
f17
.4 c
d
24
.2 d31
.5 c
49
.4 b
0
10
20
30
40
50
60
70
EC1118 Sauvignon X5
Pyru
vate
(m
g L
-1)
27.4
cd
22.4
g29.2
bc
29.8
ab
24.5
efg
31.6
a
25.4
def
22.6
g
29.9
ab
26.5
de
24.0
fg3
0.3
ab
25.2
def
24.4
efg
26.6
de
0
10
20
30
40
EC1118 Sauvignon X5
Aceta
deh
yd
e (
mg
L-1
)
DAP VCombi VUltra Fermaid E OptiWhite

139
Figure 4-39 Concentration of carbon disulphide and thioacetic acid S-methylester found in
finished YPF wines produced by three different yeast strains with five nutrient
sources
Vertical bars represent standard deviations from three fermentation replicates. Means
followed by different letters on the top of the bar are significantly different (p<0.05) among
treatment combinations of each compound according to the DMRT test.
n.d. denotes not detected.
n.q. denotes not quantified or traced.
n.d
.
5.3
b
7.2
a
n.q
.
n.q
.
5.2
b
n.q
.
2.6
c
5.3
b
n.d
.
n.q
.
2.9
c
n.q
.
n.q
.
2.8
c
0
3
6
9
EC1118 Sauvignon X5
Hy
dro
ge
n s
ulp
hid
e (
g L
-1)
11
.0 d
ef
20
.6 a
b
19
.1 a
bc
4.3
g
21
.8 a
13
.6 c
de
f
16
.4 a
bc
d
19
.9 a
b
12
.4 d
ef
13
.5 c
de
f
16
.2 a
bc
d
9.8
ef
8.3
fg
15
.0 b
cd
e
12
.4 d
ef
0
5
10
15
20
25
EC1118 Sauvignon X5
Carb
on
dis
ulp
hid
e (
g L
-1)
n.q
.
n.d
.
n.d
.
7.3
a
n.d
.
n.d
.
7.4
a
n.d
.
n.d
.
n.q
.
n.d
.
n.d
.
n.d
.
n.d
.
n.d
.
0
2
4
6
8
10
EC1118 Sauvignon X5
Yeast strains
Meth
an
eth
iol
( g
L-1)
DAP VCombi VUltra Fermaid E OptiWhite

140
Higher alcohols: Figure 4-40 demonstrates that the Sauvignon strain was the predominant
producer of higher alcohols, although its production varied depending on the nutrient source.
It developed the greatest amounts of 2-methyl butanol and 2-phenyl ethanol in the VCombi,
VUltra and Fermaid E samples (47.5 + 4.9, 50.0 + 2.9, 47.5 + 3.6 mg L-1 and 52.7 + 6.1, 55.0
+ 0.3, 56.0 + 1.0 mg L-1, respectively). The highest level of 2-methyl propanol was also
produced by strain Sauvignon in the presence of DAP (143.6 + 23.1 mg L-1), while 3-methyl
butanol was most evident in the DAP, VCombi, VUltra and Fermaid E treatments (181.5 +
20.3, 187.3 + 8.0, 197.7 + 10.0 and 195.1 + 11.0 mg L-1, respectively). Addition of DAP
significantly reduced the formation of 2-methyl butanol and 2-phenyl ethanol for all yeast
strains, while VCombi, VUltra and Fermaid E decreased the formation of 2-methyl propanol.
Figure 4-40 Concentration of higher alcohols found in finished YPF wines developed by
three different yeast strains with five nutrient sources
Vertical bars represent standard deviations from three fermentation replicates. Means
followed by different letters on the top of the bar are significantly different (p<0.05) among
treatment combinations of each compound according to the DMRT test.
47.6
cd
93.2
b
143.6
a
15.6
e
16.0
e
16.2
e29.5
e
56.6
c
21.1
e 34.0
b
52.7
a
24.3
d33.9
de
61.4
c
23.2
e
33.7
b
55.0
a
23.6
d36.8
de5
4.9
c
20.7
e 36.9
b
56.0
a
25.7
cd
22.3
e
35.5
de
25.7
e
28.5
c
34.5
b
23.3
d
0
50
100
150
EC1118 Sauvignon X5 EC1118 Sauvignon X5
2-Methyl propanol 2-Phenyl ethanol
Co
ncen
trati
on
(m
g L
-1)
115.0
de
181.5
a
161.2
b
30.7
de
33.7
cd
e
29.0
e
126.1
cd
187.3
a
141.0
bc
32.5
cd
e
47.5
a
34.2
cd
e
128.4
cd
197.7
a
132.0
cd
33.0
cd
e
50.0
a
37.2
bc
141.2
c
195.1
a
140.0
bc
32.4
cd
e
47.5
a
39.9
b
98.5
e
134.8
cd
131.7
cd
34.6
bcd
e
36.0
bcd
31.3
de
0
40
80
120
160
200
EC1118 Sauvignon X5 EC1118 Sauvignon X5
3-Methyl butanol 2-Methyl butanol
Co
ncen
trati
on
(m
g L
-1)
DAP VCombi VUltra Fermaid E OptiWhite

141
Figure 4-41 Concentration of acetic acid esters found in finished YPF wines developed by
three different yeast strains with five nutrient sources (*10 = concentration of
compound times 10)
Vertical bars represent standard deviations from three fermentation replicates. Means
followed by different letters on the top of the bar are significantly different (p<0.05) among
treatment combinations of each compound according to the DMRT test.
Relative peak area = (peak area of sample)/(Peak area of internal standard)
8.5
cd 9.1
bc
8.0
de
f
7.8
de
f
9.2
bc
7.6
ef
7.4
f
9.6
b
8.0
de
f
7.4
f
10
.4 a
9.4
b
7.4
f 8.4
cd
e
8.0
de
f
0
4
8
12
EC1118 Sauvignon X5
Acetic acid ethyl ester
Rela
tive p
eak a
rea
20.9
ef
15.7
f
21.5
ef
25.0
def
33.7
cd 39.2
cd
31.7
cd
60.1
a
48.7
b
36.1
cd
94.7
a
58.1
b
25.8
de
62.7
a
37.2
c
26.3
cd
ef
97.3
a
39.5
c
27.9
de
56.4
ab
27.9
de
32.1
cd
e
87.9
a
27.7
cd
ef
31.7
cd
28.4
de
23.1
def
18.6
ef
26.6
cd
ef
14.3
f
0
40
80
120
EC1118 Sauvignon X5 EC1118 Sauvignon X5
Acetic acid 3-methylbutyl ester*10 Acetic acid 2-methylbutyl ester
Co
ncen
trati
on
(
g L
-1)
10.0
c
8.1
f
10.3
c
4.1
f
3.0
f 4.9
f
12.1
a
9.4
d 10.8
b 12.8
b
20.9
a
8.2
e10.5
c
8.9
d
9.0
d
11.2
bcd
20.4
a
7.3
e9.6
d
8.5
de
8.6
de 1
1.7
bc
20.3
a
9.6
cd
e
7.9
f
7.0
g
7.7
f 9.2
de
9.3
de
9.5
cd
e
0
5
10
15
20
25
EC1118 Sauvignon X5 EC1118 Sauvignon X5
Acetic acid hexyl ester Acetic acid 2-phenylethyl ester *10
Co
ncen
trati
on
(
g L
-1)
DAP VCombi VUltra Fermaid E OptiWhite

142
Acetic acid esters: Figure 4-41 shows that the Sauvignon strain tended to be the greatest
acetic acid ester producer, excluding the acetic acid hexyl ester, however this depended on
the nutrient source. Concentrations of acetic acid ethyl ester in YPF wine were out of the
quantification limit, they were therefore present as relative peak area. Addition of Fermaid E
promoted the highest formation of acetic acid ethyl ester by strain Sauvignon (10.4 + 0.2
relative peak area) and followed by strain X5. Strain Sauvignon with the addition of VCombi,
VUltra and Fermaid E developed the greatest amounts of acetic acid 3-methylbutyl ester
(947.2 + 113.1, 972.8 + 32.4, 878.9 + 76.3 g L-1, respectively), acetic acid 2-methylbutyl
ester (60.1 + 6.0, 62.7 + 2.9, 56.4 + 4.2 g L-1, respectively) and acetic acid 2-phenyl ethyl
ester (208.9 + 27.5, 203.8 + 8.7, 203.3 + 11.3 g L-1, respectively). On the contrary, DAP
addition significantly reduced the levels of these compounds for all yeast strains. Acetic acid
hexyl ester was most evident in the EC1118 strain with VCombi treatment, followed by the
X5 strain with the same nutrient (12.1 + 0.5 and 10.8 + 0.1 g L-1, respectively).
Ethyl and diethyl esters: As shown in Table 4-21, SAdiEtE was detected only in trace
quantities in all YPF wines (data not shown). The X5 strain was the highest PrEtE producer
when either Fermaid E or OptiWhite was added to the YPF juices (151.0 + 14.7 and 161.9 +
12.0 g L-1, respectively). High production of BuEtE was produced by strain EC1118 in the
VCombi sample (210.4 + 16.1 g L-1), followed by the DAP and VUltra treatments (181.2 +
11.0 and 180.4 + 5.1 g L-1, respectively), while strain X5 also developed high amount of this
ester in the VCombi sample (176.6 + 8.7 g L-1). Addition of DAP promoted the Sauvignon
strain to develop the greatest amounts of iBuEtE and LAEtE (56.8 + 9.9 and 25.8 + 0.3 g L-1,
respectively). Strain EC1118 seemed to follow the similar pattern for these ester productions
in response to DAP addition (23.5 + 1.0 and 14.9 + 1.6 g L-1, respectively).
Medium-chain fatty acids and ethyl esters: As shown in Table 4-22, addition of VCombi
and VUltra promoted strain EC1118 to develop the greatest amounts of hexanoic, octanoic
and decanoic acids (5.3 + 0.3 and 4.9 + 0.3 mg L-1, 6.0 + 0.5 and 5.5 + 0.2 mg L-1, and 1.2 +
0.2 and 1.1 + 0.0 mg L-1, respectively). Hexanoic acid was also most evident in the EC1118
wine with Fermaid E addition. Strain X5 also produced the highest amounts of all MCFAs in
the VCombi treatment (5.1 + 0.1, 5.8 + 0.2 and 1.2 + 0.0 mg L-1, respectively), while hexanoic
and octanoic acid were most evident in the DAP sample (4.9 + 0.1 and 5.4 + 0.2 mg L-1,
respectively). It also developed the greatest amounts of OAEtE and DAEtE in the VCombi
(954.3 + 21.2 and 317.5 + 28.4 g L-1, respectively) and the DAP samples (873.3 + 5.7 and
306.0 + 5.7 g L-1, respectively). Addition of VCombi promoted the highest productions of all
MCFA ethyl esters by strain EC1118 as well.

143
Table 4-21 Concentration of ethyl esters found in finished YPF wines produced by three
different yeast strains with five nutrient sources
Yeasts Nutrients PrEtE
(g L-1)
BuEtE
(g L-1)
iBuEtE
(g L-1)
LAEtE
(mg L-1)
EC1118 DAP 70.7 + 1.5 ef 181.2 + 11.0 b 23.5 + 1.0 bc 14.9 + 1.6 b
VCombi 58.9 + 3.7 f 210.4 + 16.1 a 7.0 + 2.2 gh 8.8 + 0.1 fg
VUltra 65.2 + 1.0 ef 180.4 + 5.1 b 5.9 + 0.5 h 8.7 + 0.1 fg
Fermaid E 68.7 + 0.9 ef 154.4 + 6.4 cd 7.6 + 0.4 gh 8.5 + 0.1 fg
OptiWhite 100.8 + 3.4 c 71.1 + 2.1 h 11.1 + 0.2 efgh 8.3 + 0.2 g
Sauvignon DAP 70.4 + 22.6 ef 120.8 + 17.2 fg 56.8 + 9.9 a 25.8 + 0.3 a
VCombi 67.7 + 1.7 ef 150.2 + 15.1 d 22.8 + 6.2 bc 10.8 + 0.2 c
VUltra 76.1 + 1.5 e 121.4 + 5.2 fg 22.6 + 0.4 bc 10.8 + 0.2 c
Fermaid E 73.8 + 3.4 ef 106.2 + 5.6 g 26.4 + 2.4 b 10.2 + 0.4 cd
OptiWhite 77.4 + 2.5 de 50.4 + 1.1 i 22.9 + 5.2 bc 9.2 + 0.2 fg
X5 DAP 80.8 + 1.2 de 167.4 + 3.9 bc 14.6 + 0.7 def 10.0 + 0.2 de
VCombi 90.7 + 4.1 cd 176.6 + 8.7 b 9.3 + 0.3 fgh 8.7 + 0.1 efg
VUltra 121.4 + 4.7 b 141.7 + 2.2 de 12.4 + 1.1 efg 9.1 + 0.1 efg
Fermaid E 151.0 + 14.7 a 133.3 + 11.3 ef 16.7 + 2.0 cde 9.5 + 0.1 def
OptiWhite 161.9 + 12.0 a 57.2 + 1.5 hi 19.5 + 1.8 cd 8.0 + 0.1 g
Each value shows the mean + standard deviation from three fermentation replicates.
Values displaying different letters within the same column are significantly different (p<0.05)
among treatment combinations according to the DMRT test.
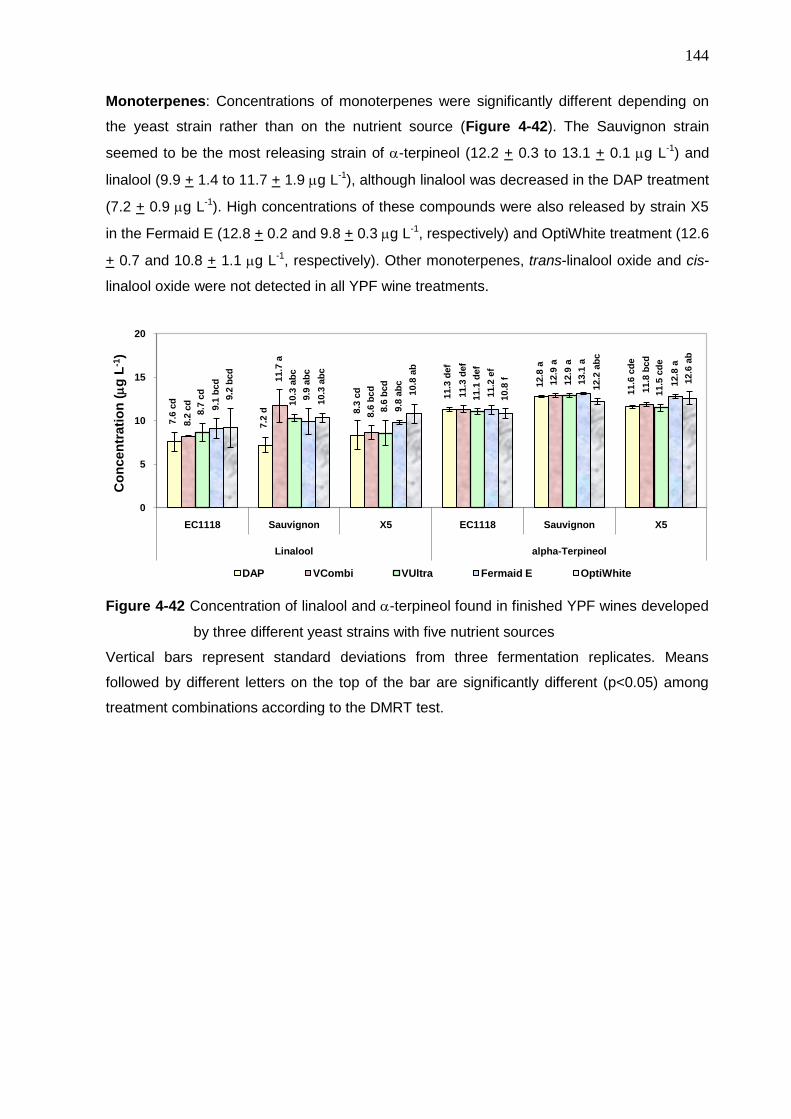
144
Monoterpenes: Concentrations of monoterpenes were significantly different depending on
the yeast strain rather than on the nutrient source (Figure 4-42). The Sauvignon strain
seemed to be the most releasing strain of -terpineol (12.2 + 0.3 to 13.1 + 0.1 g L-1) and
linalool (9.9 + 1.4 to 11.7 + 1.9 g L-1), although linalool was decreased in the DAP treatment
(7.2 + 0.9 g L-1). High concentrations of these compounds were also released by strain X5
in the Fermaid E (12.8 + 0.2 and 9.8 + 0.3 g L-1, respectively) and OptiWhite treatment (12.6
+ 0.7 and 10.8 + 1.1 g L-1, respectively). Other monoterpenes, trans-linalool oxide and cis-
linalool oxide were not detected in all YPF wine treatments.
Figure 4-42 Concentration of linalool and -terpineol found in finished YPF wines developed
by three different yeast strains with five nutrient sources
Vertical bars represent standard deviations from three fermentation replicates. Means
followed by different letters on the top of the bar are significantly different (p<0.05) among
treatment combinations according to the DMRT test.
7.6
cd
7.2
d 8.3
cd
11.3
def
12.8
a
11.6
cd
e
8.2
cd
11.7
a
8.6
bcd
11.3
def
12.9
a
11.8
bcd
8.7
cd
10.3
ab
c
8.6
bcd
11.1
def
12.9
a
11.5
cd
e
9.1
bcd
9.9
ab
c
9.8
ab
c
11.2
ef
13.1
a
12.8
a
9.2
bcd
10.3
ab
c
10.8
ab
10.8
f
12.2
ab
c
12.6
ab
0
5
10
15
20
EC1118 Sauvignon X5 EC1118 Sauvignon X5
Linalool alpha-Terpineol
Co
ncen
trati
on
(
g L
-1)
DAP VCombi VUltra Fermaid E OptiWhite

145
Table 4-22 Concentration of fatty acids and their ethyl esters found in finished YPF wines produced by three different yeast strains with five
nutrient sources
Yeasts Nutrients Hexanoic acid
(mg L-1)
Octanoic acid
(mg L-1)
Decanoic acid
(mg L-1)
HAEtE
(g L-1)
OAEtE
(g L-1)
DAEtE
(g L-1)
EC1118 DAP 4.1 + 0.2 b 3.8 + 0.2 c 0.5 + 0.2 ef 377.2 + 37.8 e 621.4 + 42.0 d 174.5 + 13.9 f
VCombi 5.3 + 0.3 a 6.0 + 0.5 a 1.2 + 0.2 a 634.0 + 84.4 a 921.1 + 94.8 a 286.5 + 32.0 abc
VUltra 4.9 + 0.3 a 5.5 + 0.2 a 1.1 + 0.0 ab 581.0 + 17.8 b 817.5 + 44.0 bc 260.2 + 17.3 cd
Fermaid E 4.8 + 0.1 a 5.2 + 0.1 b 1.0 + 0.1 bc 570.6 + 23.7 b 773.8 + 70.4 c 242.8 + 22.2 de
OptiWhite 3.7 + 0.1 b 3.3 + 0.3 d 0.6 + 0.1 de 342.3 + 8.6 ef 422.2 + 20.3 f 142.5 + 12.3 fg
Sauvignon DAP 3.5 + 0.4 c 2.8 + 0.5 e 0.4 + 0.1 efg 208.2 + 39.9 hi 335.3 + 89.3 g 116.3 + 37.5 gh
VCombi 4.1 + 0.3 b 3.7 + 0.3 c 0.6 + 0.1 de 295.9 + 5.8 fg 536.3 + 52.4 e 138.9 + 31.9 g
VUltra 3.8 + 0.2 b 3.2 + 0.0 de 0.4 + 0.0 efg 257.4 + 7.4 gh 427.8 + 18.3 f 117.1 + 7.7 gh
Fermaid E 3.6 + 0.0 b 3.1 + 0.0 de 0.4 + 0.0 efg 242.0 + 13.7 h 414.8 + 17.2 f 118.6 + 12.7 g
OptiWhite 3.1 + 0.0 d 2.4 + 0.0 f 0.3 + 0.0 g 113.4 + 11.1 j 205.7 + 20.7 h 82.4 + 10.4 h
X5 DAP 4.9 + 0.1 a 5.4 + 0.2 a 1.0 + 0.1 bc 436.2 + 7.1 d 873.3 + 5.7 ab 306.0 + 5.7 ab
VCombi 5.1 + 0.1 a 5.8 + 0.2 a 1.2 + 0.0 a 487.8 + 9.6 c 954.3 + 21.2 a 317.5 + 28.4 a
VUltra 4.4 + 0.1 b 4.7 + 0.0 b 1.0 + 0.1 bc 375.3 + 3.6 e 748.5 + 7.9 c 271.3 + 4.9 bcd
Fermaid E 4.0 + 0.1 b 4.0 + 0.2 c 0.7 + 0.1 d 307.4 + 21.4 fg 649.6 + 52.1 d 221.0 + 8.8 e
OptiWhite 3.4 + 0.0 d 2.9 + 0.0 de 0.5 + 0.1 ef 168.6 + 5.5 i 289.6 + 17.4 g 119.5 + 7.3 g
Each value shows the mean + standard deviation from three fermentation replicates.
Values displaying different letters within the same column are significantly different (p<0.05) among treatment combinations according to the
DMRT test.

146
4.3.3 Effect of five commercial Saccharomyces yeast strains and two different
commercial nutrient sources at different concentrations on growth kinetics,
fermentative characteristics, metabolic compounds and aromas of yellow passion fruit
wines
The fermentation trial was performed in yellow passion fruit (YPF) juice, which was prepared
from frozen yellow passion fruit puree in 2009. The chemical composition and volatile
compounds in yellow passion puree and juice used in the fermentation trial were examined
and the investigated results are given in Table 4-23.
The fermentation trial was performed in prepared YPF juice. Five commercial yeast strains;
EC1118, VL3, X5, Alchemy I and LittoLevure and two different commercial nutrient sources;
DAP and Vitamon Combi (VCombi) at two different concentrations; 0.25 and 0.5 g L-1, were
used for the fermentations of this YPF trial. In the previous YPF trial, the basic understanding
of commercial yeast strain and nutrient supplementation in YPF wine fermentation were
examined. Due to the fact that the addition of DAP, that is widely used in fruit wine
production, to the YPF juice resulted in higher production of keto acids, hydrogen sulphide
and some higher alcohols in the final YPF wines. Hence, the addition of a nutrient mixture
containing thiamine (VCombi) with varying concentrations was investigated in order to
optimize those compounds above.
This trial was aimed to investigate the effect of two nutrient sources with and without
thiamine on the fermentation kinetics and performances, some metabolic and volatile
compounds in final YPF wines. Four Saccharomyces yeast strains, VL3, X5, Alchemy I and
LittoLevure were chosen on the basis of the results obtained from the previous trial of grape
wine and YPF wine fermentations because their fermentation performances are considered
to be more susceptible to nitrogen deficiency and composition. However, they also seemed
to develop desirable fermentative characteristics and important volatile compounds in the
final grape and YPF wines under certain conditions. Strain EC1118 has a high popularity in
wine industry and fruit wine production, additionally it tended to produce less undesirable
components, thus it was used as a control strain in this YPF fermentation trial.
YPF puree: YPF puree contained high acid namely 40.50 + 0.00 g L-1 citric acid, 5.23
+ 0.00 g L-1 malic acid and had low pH at 2.9 + 0.1 (Table 4-23). The other physico-
chemical composition and aromas were TSS 9.0 + 0.1 0Brix, 53.5 + 3.5 g L-1 inverted sugar
(as glucose), 296.0 + 0.7 mg L-1 -amino nitrogen/NOPA (as isoleucine), 2491.0 mg L-1 total
amino acid without proline (Table A-3), 3.9 + 0.1 mg L-1 3-methyl butanol, 938.3 + 67.3 g L-1
hexanol, 141.6 + 5.9 g L-1 butanoic acid ethyl ester, 48.1 + 1.3 g L-1 linalool and 49.1

147
+ 0.5 g L-1 -terpineol. Concentrations of 2-methyl butanol, 2-phenyl ethanol, acetic acid
ethyl ester, propionic acid ethyl ester, succinic acid diethyl ester and ethyl ester of medium-
chain fatty acids (MCFAs) were detected in trace quantities only (Table 4-23).
Table 4-23 Physico-chemical composition and some aromas of YPF puree and prepared
YPF juice used in this fermentation trial
Compositions YPF puree Prepared YPF juice
pH 2.9 + 0.1 3.2 + 0.1
Total soluble solid (oBrix) 9.0 + 0.1 20.9 + 0.5
Inverted sugar (g L-1) 53.5 + 3.5 170.5 + 12.1
NOPA (as mg L-1 isoleucine) 296.0 + 0.7 24.0 + 0.0
Total amino nitrogen without proline (mg L-1) 2491.0 123.1
Free SO2 (mg L-1) n.m. 2.6 + 0.2
Total SO2 (mg L-1) n.m. 6.8 + 0.8
Citric acid (g L-1) 40.50 + 0.00 3.10 + 0.62
Malic acid (g L-1) 5.23 + 0.00 0.45 + 0.06
3-Methyl butanol (mg L-1) 3.9 + 0.1 n.d.
2-Methyl butanol (mg L-1) traces n.d.
2-Phenyl ethanol (mg L-1) traces n.d.
Hexanol (g L-1) 938.3 + 67.3 163.9 + 2.7
Acetic acid ethyl ester (mg L-1) traces Traces
Propionic acid ethyl ester (g L-1) traces n.d.
Butanoic acid ethyl ester (g L-1) 141.6 + 5.9 Traces
Succinic acid diethyl ester (g L-1) traces n.d.
hexanoic acid ethyl ester (g L-1) traces n.d.
octanoic acid ethyl ester (g L-1) traces Traces
decanoic acid ethyl ester (g L-1) traces Traces
Linalool (g L-1) 48.1 + 1.3 n.d.
-Terpineol (g L-1) 49.1 + 0.5 6.9 + 0.3
Each value shows the mean + standard deviation from two sample replicates.
NOPA denotes free α-amino acid nitrogen
n.m. denotes not measured
n.d. denotes not detected

148
Prepared YPF juice: In Table 4-23 and Table A-3, the physico-chemical properties of
prepared YPF juice were pH 3.2 + 0.1, 3.10 + 0.62 g L-1 citric acid, 0.45 + 0.06 g L-1 malic
acid, TSS 20.9 + 0.5 0 Brix, 170.5 + 12.1 g L-1 inverted sugar, 24.0 + 0.0 mg L-1 -amino
nitrogen/NOPA, 123.1 mg L-1 total amino acid without proline, 163.9 + 2.7 g L-1 hexanol and
6.9 + 0.3 g L-1 -terpineol. Concentrations of acetic acid ethyl ester, butanoic acid ethyl
ester, octanoic acid and decanoic acid ethyl ester were only present in trace quantities.
Figure 4-43 Growth kinetics of YPF juice fermentations with five different commercial yeast
strains and two different nutrient sources at two different concentrations
The growth kinetics: As shown in Figure 4-43, the EC1118 and Alchemy I strain appeared
to have similar fast fermentation kinetic and time, while the LittoLevure seemed to be the
weakest strain, however the kinetics varied depending on nutrient supplementation. For
strain LittoLevure, addition of any nutrient source and concentration resulted in the similar
initial long lag phase for 4 days, but final fermentation times differed depending on the
nutrient source and level. Strain LittoLevure had the longest fermentation duration in the
presence of DAP or VCombi at low level (44 and 44 days, respectively). The addition of
VCombi at both levels (0.25 and 0.5 g L-1) enhanced strain EC1118 to have the fastest
growth rates and fermentation times (26-27 days), on the contrary the similar nutrient
addition resulted in slow and sluggish fermentations of strain LittoLevure. The fermentation
kinetics and durations of strains Alchemy I, VL3 and X5 were accelerated in the high VCombi
0
10
20
30
40
50
60
70
80
1 3 5 7 9 11 13 15 17 19 21 23 25 27 29 32 34 36 38 40 42 44
Fermentation days
Ca
rbo
n d
iox
ide (
g L
-1)
EC1118-DAP 0.25 g L-1
EC1118-DAP 0.5 g L-1
EC1118-VCombi 0.25 g L-1
EC1118-VCombi 0.5 g L-1
VL3-DAP 0.25 g L-1
VL3-DAP 0.5 g L-1
VL3-VCombi 0.25 g L-1
VL3-VCombi 0.5 g L-1
X5-DAP 0.25 g L-1
X5-DAP 0.5 g L-1
X5-VCombi 0.25 g L-1
X5-VCombi 0.5 g L-1
Alchemy I-DAP 0.25 g L-1
Alchemy I-DAP 0.5 g L-1
Alchemy I -VCombi 0.25 g L-1
LittoLevure-DAP 0.25 g L-1
LittoLevure-DAP 0.5 g L-1
LittoLevure-VCombi 0.25 g L-1
LittoLevure-VCombi 0.5 g L-1
Alchemy I -VCombi 0.5 g L-1

149
treatment (26, 29 and 29 days, respectively). A high level of DAP addition also enhanced the
fast kinetics of strains Alchemy I and EC1118 (27 and 29 days, respectively), whereas both
levels of DAP addition resulted in slow and sluggish fermentations of strains VL3 and X5 (41
and 43 days, respectively). However, all YPF fermentations completely finished. In all cases,
fermentation kinetics seemed to increase and the duration of fermentation decreased in
response to increased nutrient concentrations, particularly in the VCombi treatment.
Chemical composition: In Table 4-24, the concentration of residual sugar was most
present in YPF wines produced by strains X5 and Alchemy I with DAP addition (1.0 + 0.2 and
1.1 + 0.3 g L-1, respectively) and by strain LittoLevure with VCombi treatment (1.1 + 0.1 g L-1).
In addition, the five yeast strains practically almost consumed the initial sugar provided
(Table 4-23) and resulted in low residual sugar below 2 g L-1. Some differences existed
between the YPF wine treatments in term of glycerol production. A low level of DAP
promoted the VL3 and X5 strains to produce the highest amounts of glycerol (4.8 + 0.5 and
4.9 + 0.2 g L-1, respectively), while strain Alchemy I produced the greatest level in high
VCombi treatment (4.7 + 0.4 g L-1).
Organic acids: Table 4-25 shows that all YPF wine treatments had similar amounts of acetic
acid ranging from 0.20 + 0.00 to 0.33 + 0.05 g L-1. The concentration of citric acid was most
evident in the YPF wine produced by Alchemy I in the DAP sample at both levels (2.43 +
0.10 and 2.47 + 0.10 g L-1, respectively) and at high level of VCombi (2.43 + 0.10 g L-1).
Strain EC1118 also produced YPF wine having a high amount of this acid in the VCombi
treatment at both levels (2.43 + 0.10 and 2.43 + 0.10 g L-1, respectively). There was a slight
decrease of citric acid at approximately 20.3-36.4 % in YPF wines. The highest amounts of
malic acid were produced by strain LittoLevure in the high VCombi and low DAP treatment
(0.78 + 0.04 and 0.73 + 0.01 g L-1, respectively).
SO2-binding compounds: Figure 4-44 shows that the five yeast strains produced similar
concentration of acetaldehyde ranged from 15.6 + 0.6 to 24.2 + 0.2 mg L-1. Strain VL3
produced the greatest amount of -ketoglutarate in the high DAP sample, followed by the low
DAP addition (272.8 + 5.6 and 251.7 + 6.2 mg L-1, respectively). Strain X5 also produced a
high amount of this compound in both levels of DAP (246.2 + 3.5 and 245.5 + 5.1 mg L-1,
respectively) and the highest amount of pyruvate in the low level of DAP addition (156.6 +
3.7 mg L-1). It is likely that the addition of DAP resulted in excess keto acid production by
strains VL3 and X5, however concentrations of these keto acids significantly diminished with
the addition of VCombi to the YPF juice.

150
Table 4-24 Chemical composition of finished YPF wines obtained from YPF juices fermented
with five different yeast strains with two nutrient sources at two different
concentrations
Yeasts Nutrients Concentrations
(g L-1)
Residual sugar
(g L-1)
Glycerol
(g L-1)
EC1118 DAP 0.25 0.3 + 0.1 f 4.0 + 0.3 cde
0.50 0.4 + 0.2 ef 4.1 + 0.4 bcde
VCombi 0.25 0.4 + 0.0 def 3.9 + 0.5 de
0.50 0.5 + 0.0 cdef 4.0 + 0.3 cde
VL3 DAP 0.25 0.8 + 0.2 bc 4.8 + 0.5 ab
0.50 0.3 + 0.1 f 4.0 + 0.6 cde
VCombi 0.25 0.4 + 0.1 def 4.2 + 0.5 bcde
0.50 0.6 + 0.1 cdef 4.5 + 0.4 abcd
X5 DAP 0.25 1.0 + 0.2 a 4.9 + 0.2 a
0.50 0.5 + 0.2 cdef 3.8 + 0.3 e
VCombi 0.25 0.7 + 0.2 bcde 4.1 + 0.2 bcde
0.50 0.6 + 0.1 cdef 4.3 + 0.1 abcde
Alchemy I DAP 0.25 1.1 + 0.3 a 4.5 + 0.4 abcd
0.50 0.7 + 0.1 bcde 4.5 + 0.2 abcd
VCombi 0.25 0.6 + 0.1 cdef 4.2 + 0.5 bcde
0.50 0.6 + 0.2 cdef 4.8 + 0.4 ab
LittoLevure DAP 0.25 0.8 + 0.1 bc 4.0 + 0.3 cde
0.50 0.5 + 0.1 cdef 4.7 + 0.4 abc
VCombi 0.25 1.1 + 0.1 a 4.4 + 0.5 abcde
0.50 0.5 + 0.2 cdef 4.4 + 0.5 abcde
Each value shows the mean + standard deviation from three fermentation replicates.
Values displaying different letters within the same column are significantly different (p<0.05)
among treatment combinations according to the DMRT test.

151
Table 4-25 Concentration of organic acids found in finished YPF wines produced by five
different yeast strains with two nutrient sources at two different concentrations
Yeasts Nutrients Concentrations
(g L-1
)
Citric acid
(g L-1
)
Malic acid
(g L-1
)
Acetic acid
(g L-1
)
EC1118 DAP 0.25 2.13 + 0.10 g 0.51 + 0.01 h 0.27 + 0.05 a
0.50 2.37 + 0.20 abc 0.48 + 0.01 hj 0.30 + 0.00 a
VCombi 0.25 2.43 + 0.10 ab 0.43 + 0.02 ij 0.33 + 0.05 a
0.50 2.43 + 0.10 ab 0.41 + 0.01 j 0.30 + 0.10 a
VL3 DAP 0.25 1.97 + 0.10 h 0.68 + 0.01 bcd 0.20 + 0.00 a
0.50 2.13 + 0.10 g 0.72 + 0.01 bc 0.30 + 0.00 a
VCombi 0.25 2.20 + 0.00 efg 0.64 + 0.02 de 0.23 + 0.05 a
0.50 2.27 + 0.10 def 0.58 + 0.01 fg 0.30 + 0.00 a
X5 DAP 0.25 2.20 + 0.00 efg 0.61 + 0.01 ef 0.30 + 0.00 a
0.50 2.20 + 0.00 efg 0.64 + 0.02 de 0.30 + 0.00 a
VCombi 0.25 2.30 + 0.00 cde 0.69 + 0.01 ef 0.23 + 0.03 a
0.50 2.33 + 0.10 bcd 0.54 + 0.01 gh 0.30 + 0.00 a
Alchemy I DAP 0.25 2.43 + 0.10 ab 0.50 + 0.02 h 0.30 + 0.00 a
0.50 2.47 + 0.10 a 0.48 + 0.02 hi 0.30 + 0.00 a
VCombi 0.25 2.20 + 0.00 fg 0.61 + 0.01 ef 0.30 + 0.00 a
0.50 2.43 + 0.10 ab 0.53 + 0.02 gh 0.20 + 0.00 a
LittoLevure DAP 0.25 2.00 + 0.00 h 0.73 + 0.01 ab 0.20 + 0.00 a
0.50 2.23 + 0.10 efg 0.67 + 0.02 cd 0.20 + 0.00 a
VCombi 0.25 2.03 + 0.10 h 0.71 + 0.01 bc 0.23 + 0.05 a
0.50 2.03 + 0.10 h 0.78 + 0.04 a 0.27 + 0.04 a
Each value shows the mean + standard deviation from three fermentation replicates.
Values displaying the same letter (only ‗a‘) within the same column indicate no significant
difference (p>0.05) among treatment combinations, whereas those displaying different letters
are significantly different (p<0.05) according to the DMRT test.

152
Figure 4-44 Concentration of SO2-binding compounds found in finished YPF wines produced
by five different yeast strains with two nutrient sources at two different
concentrations
Vertical bars represent standard deviations from three fermentation replicates. Means
followed by different letters on the top of the bar are significantly different (p<0.05) among
treatment combinations of each compound, whereas those followed by same letters on the
top of the bar are not significantly different (p>0.05) according to the DMRT test.
10
2.5
e
92
.9 f
68
.6 g
11
0.9
d
59
.6 h
24
6.2
b
61
.9 h
25
1.7
b
50
.1 ij
13
8.0
c
88
.7 f
10
4.3
e
60
.6 h
11
6.3
d
47
.2 j
24
5.5
b
55
.3 h
i
27
2.8
a
40
.8 k
13
3.3
c
0
50
100
150
200
250
300
DAP VCombi DAP VCombi DAP VCombi DAP VCombi DAP VCombi
EC1118 VL3 X5 Alchemy I LittoLevure
-K
eto
glu
tara
te (
mg
L-1
)0.25 g L-1
0.5 g L-1
14
.5 jk
l
17
.8 ijk
18
.8 ij
53
.7 g
22
.1 i
15
6.6
a
17
.8 ijk
12
4.1
b
22
.3 i
86
.7 e
5.8
m
11
.4 l
13
.3 k
l43
.4 h
12
.7 k
l
11
9.2
c
13
.5 k
l
94
.4 d
12
.0 l
71
.0 f
0
40
80
120
160
DAP VCombi DAP VCombi DAP VCombi DAP VCombi DAP VCombi
EC1118 VL3 X5 Alchemy I LittoLevure
Pyru
vate
(m
g L
-1) 0.25 g L-1
0.5 g L-1
17
.5 a20
.5 a
19
.7 a
19
.1 a
19
.8
15
.6 a
22
.3 a
17
.9 a
22
.2 a
20
.2 a
17
.0 a
16
.7 a2
0.9
a
18
.2 a21
.5 a
16
.7 a2
2.0
a
18
.9 a
24
.2 a
22
.0 a
0
10
20
30
DAP VCombi DAP VCombi DAP VCombi DAP VCombi DAP VCombi
EC1118 VL3 X5 Alchemy I LittoLevure
Yeast strains
Aceta
ldeh
yd
e (
mg
L-1
)
0.25 g L-1 0.5 g L-1

153
Figure 4-45 Concentration of hydrogen sulphide, carbon disulphide, methanethiol and
MeSAc found in finished YPF wines produced by five different yeast strains
with two nutrient sources at two different concentrations
Vertical bars represent standard deviations from three fermentation replicates. Means
followed by different letters on the top of the bar are significantly different (p<0.05) among
treatment combinations of each compound according to the DMRT test.
n.d. denotes not detected
2.5
bcd
3.1
ab
c
2.7
bcd
2.3
de
3.2
ab
1.6
ef
1.6
ef
2.0
def 2
.4 c
d
2.1
def
3.3
ab
2.3
de
3.2
ab
1.9
def
2.2
de
1.4
f
3.5
a
2.4
cd 2.7
bcd
2.1
def
0
2
4
DAP VCombi DAP VCombi DAP VCombi DAP VCombi DAP VCombi
EC1118 VL3 X5 Alchemy I LittoLevure
Hyd
rog
en
su
lph
ide (
g L
-1)
6.1
de
7.1
d
7.7
d
7.0
d
5.7
de
5.4
de
5.8
de
5.8
de
16.3
b
18.5
ab
6.8
de
11.0
c
19.5
a
5.1
de
5.2
de
3.7
e
10.6
c
12.9
c
10.9
c
16.3
b
0
5
10
15
20
DAP VCombi DAP VCombi DAP VCombi DAP VCombi DAP VCombi
EC1118 VL3 X5 Alchemy I LittoLevure
Ca
rbo
n d
isu
lph
ide
(
g L
-1)
n.d
.
n.d
.
n.d
.
2.6
c
3.0
b
n.d
.
n.d
.
n.d
.
n.d
.
n.d
.
n.d
.
n.d
.
n.d
.
2.9
bc
3.5
a
2.8
bc
n.d
.
n.d
.
n.d
.
n.d
.
0
2
4
DAP VCombi DAP VCombi DAP VCombi DAP VCombi DAP VCombi
EC1118 VL3 X5 Alchemy I LittoLevure
Me
tha
ne
thio
l (
g L
-1)
n.d
.
n.d
.
n.d
.
n.d
.
n.d
.
n.d
.
n.d
.
n.d
.
n.d
.
n.d
.
n.d
.
n.d
.
n.d
.
n.d
.
n.d
.
n.d
.
9.3
a
0.6
c
4.6
b
4.3
b
0
4
8
DAP VCombi DAP VCombi DAP VCombi DAP VCombi DAP VCombi
EC1118 VL3 X5 Alchemy I LittoLevure
Yeast strains
Me
SA
c (
g L
-1)
0.25 g L-1 0.5 g L-1
154
Sulphur containing compounds: As shown in Figure 4-45, A high level of DAP addition
stimulated the Alchemy I, EC1118 and VL3 strains to produce the highest amount of
hydrogen sulphide (3.5 + 0.2, 3.3 + 0.5 and 3.2 + 0.6 g L-1, respectively), on the contrary
strain X5 produced the greatest amount in the low DAP sample (3.2 + 0.7 g L-1). The
highest concentrations of carbon disulphide were produced by strain VL3 in the high DAP
treatment (19.5 + 2.7 g L-1) and by strain LittoLevure in the low VCombi addition (18.5
+ 2.3 g L-1). For methanethiol, a high level of DAP promoted the highest formation by
strain Alchemy I (3.5 + 0.1 g L-1) followed by the EC1118 in the low VCombi treatment (3.0
+ 0.3 g L-1). Methanethiol was not detected in the YPF wines fermented with VL3, X5 and
LittoLevure strains. The concentration of MeSAc was most evident in the YPF wines of the
Alchemy I strain in the high DAP sample (9.3 + 1.1 g L-1) followed by the LittoLevure YPF
wine with the addition of DAP and VCombi at a high level (4.6 + 0.6 and 4.3 + 0.9 g L-1,
respectively). Nevertheless, this sulphur containing ester was not detected in YPF wines
from the EC1118, VL3 and X5 strains. Other sulphur compounds, ethanethiol, dimethyl
sulphide, dimethyl disulphide, thioacetic acid S-ethylester, diethyl disulphide and dimethyl
trisulphide were not detected in YPF wines.
Higher alcohols: The influence of five commercial yeast strains on the productions of these
alcohols was dependent upon the nitrogen source and concentration, except for hexanol
(Figure 4-46). The LittoLevure strain developed the highest amounts of 2-phenyl ethanol in
both levels of VCombi addition and the high DAP sample (57.7 + 3.6, 54.9 + 4.5 and 54.4 +
1.1 mg L-1, respectively), while 3-methyl butanol and 2-methyl butanol were most evident in
the high DAP treatment (224.5 + 52.2 and 46.3 + 12.5 mg L-1, respectively). Addition of DAP
at either a low or a high level promoted the highest formation of 2-methyl propanol by strain
VL3 (108.4 + 6.4 and 113.2 + 4.2 mg L-1, respectively) followed by strain EC1118 in the high
DAP sample (74.0 + 6.3 mg L-1). Whereas, the addition of VCombi at both levels significantly
reduced the production of this alcohol for all yeast strains. For hexanol, all YPF wines had
similar amounts ranging from 166.0 + 4.7 to 184.6 + 7.6 g L-1.

155
Figure 4-46 Concentration of higher alcohols found in finished YPF wines developed by five
different yeast strains with two nutrient sources at two different concentrations
Vertical bars represent standard deviations from three fermentation replicates. Means
followed by different letters on the top of the bar are significantly different (p<0.05) among
treatment combinations of each compound, whereas those followed by same letters on the
top of the bar are not significantly different (p>0.05) according to the DMRT test.
61.1
cd
20.2
ij
108.4
a
35.3
fg
h
73.3
bc
27.2
gh
ij 38.6
fg
24.0
hij
24.6
hij
32.0
gh
i
16.5
gh
i
30.2
d
15.9
gh
i
24.2
ef
13.4
hi
23.6
ef
20.0
fg
35.6
c 45.5
b 57.7
a
74.0
b
18.7
j
113.2
a
29.0
gh
ij
65.3
bcd
24.9
hij
45.2
ef
17.3
j
55.5
de
25.8
hij
16.0
gh
i 31.2
cd
15.3
hi
25.6
e
12.3
i
24.2
ef
17.8
gh 3
4.0
cd
54.4
a
54.9
a
0
40
80
120
DA
P
VC
om
bi
DA
P
VC
om
bi
DA
P
VC
om
bi
DA
P
VC
om
bi
DA
P
VC
om
bi
DA
P
VC
om
bi
DA
P
VC
om
bi
DA
P
VC
om
bi
DA
P
VC
om
bi
DA
P
VC
om
bi
EC1118 VL3 X5 Alchemy I LittoLevure EC1118 VL3 X5 Alchemy I LittoLevure
2-Methyl propanol 2-Phenyl ethanol
Co
ncen
trati
on
(m
g L
-1)
14
8.4
bc
de
f
13
1.9
de
f 17
4.3
bc
14
8.6
bc
ef
14
0.5
cd
ef
12
7.0
de
f
11
7.0
ef
13
2.4
de
f
13
3.0
de
f
15
4.4
bc
de
30
.0 b
cd
efg
33
.6 b
cd
e
31
.3 b
cd
ef
37
.9 b
26
.0 e
fg
33
.2 b
cd
ef
27
.4 d
efg
36
.9 b
c
29
.8 b
cd
efg
35
.9 b
cd
15
8.7
bc
d
13
3.3
de
f
18
4.8
b
13
9.5
cd
ef
12
8.4
de
f
12
4.7
de
f
11
6.1
ef
11
1.8
f
22
4.5
a
12
4.2
de
f
28
.8 b
cd
efg
31
.2 b
cd
ef
30
.3 b
cd
efg
32
.3 b
cd
ef
21
.9 g
29
.9 b
cd
efg
24
.1 f
g
27
.9 c
de
fg
46
.3 a
28
.4 b
cd
efg
0
60
120
180
240
DA
P
VC
om
bi
DA
P
VC
om
bi
DA
P
VC
om
bi
DA
P
VC
om
bi
DA
P
VC
om
bi
DA
P
VC
om
bi
DA
P
VC
om
bi
DA
P
VC
om
bi
DA
P
VC
om
bi
DA
P
VC
om
bi
EC1118 VL3 X5 Alchemy I LittoLevure EC1118 VL3 X5 Alchemy I LittoLevure
3-Methyl butanol 2-Methyl butanol
Co
ncen
trati
on
(m
g L
-1)
17
3.7
a
17
2.8
a
17
5.9
a
17
0.3
a
17
2.3
a
17
2.2
a
17
5.6
a
17
5.4
a
17
4.5
a
17
8.1
a
16
9.6
a
18
4.6
a
16
6.0
a
16
6.0
a
16
8.9
a
17
0.8
a
16
7.8
a
17
8.4
a
17
0.3
a
17
6.6
a
0
40
80
120
160
200
DAP VCombi DAP VCombi DAP VCombi DAP VCombi DAP VCombi
EC1118 VL3 X5 Alchemy I LittoLevure
Hexan
ol (
g L
-1)
0.25 g L-1 0.5 g L-1

156
Figure 4-47 Concentration of acetic acid esters found in finished YPF wines developed by
five different yeast strains with two nutrient sources at two different
concentrations (*10 = concentration of compound times 10)
Vertical bars represent standard deviations from three fermentation replicates. Means
followed by different letters on the top of the bar are significantly different (p<0.05) among
treatment combinations of each compound according to the DMRT test.
Relative peak area = (peak area of sample)/(Peak area of internal standard)
8.7
cd
e
8.5
cd
e
12
.5 a
10
.3 a
bc
10
.8 a
bc
10
.6 a
bc
8.4
cd
e
9.8
cd
e
5.4
fg
5.4
fg
9.1
cd
e
8.6
cd
e
12
.3 a
b
8.9
cd
e
11
.0 a
bc
9.9
bc
d
7.6
de
f
7.2
ef
7.2
ef
3.8
g
0
5
10
15
DAP VCombi DAP VCombi DAP VCombi DAP VCombi DAP VCombi
EC1118 VL3 X5 Alchemy I LittoLevure
Acetic acid ethyl ester
Rela
tive p
eak a
rea
18
.2 d
ef
17
.4 e
f
11
.9 f
g18
.3 d
ef
7.4
g
24
.2 b
cd
12
.7 f
g
18
.3 d
ef
11
.5 f
g
25
.3 c
de
22
.0 d
ef
3.5
j
2.2
j
11
.7 g
hij
4.8
ij
28
.1 c
d
22
.7 d
ef
7.7
ij
6.7
ij
22
.5 c
de
27
.7 a
bc
17
.7 d
ef
31
.1 a
6.6
g
33
.6 a
13
.9 f
32
.0 a
12
.0 f
g
47
.3 a
51
.1 a
20
.2 d
efg
16
.4 e
fgh
37
.3 b
10
.3 h
ij
53
.9 a
34
.0 b
c
26
.9 c
d
14
.1 f
gh
i
30
.5 a
b 34
.2 a
0
10
20
30
40
50
60
DA
P
VC
om
bi
DA
P
VC
om
bi
DA
P
VC
om
bi
DA
P
VC
om
bi
DA
P
VC
om
bi
DA
P
VC
om
bi
DA
P
VC
om
bi
DA
P
VC
om
bi
DA
P
VC
om
bi
DA
P
VC
om
bi
EC1118 VL3 X5 Alchemy I LittoLevure EC1118 VL3 X5 Alchemy I LittoLevure
Acetic acid 3-methylbutyl ester*10 Acetic acid 2-methylbutyl ester
Co
nc
en
tra
tio
n (
g L
-1)
132.1
b
104.4
c
75.2
efg
45.1
h62.0
g
24.7
i
66.5
fg
30.7
hi
62.6
g
32.7
hi
149.3
a
123.5
b
97.7
cd
44.0
h
80.1
ef
23.0
i
96.9
cd
28.4
hi
84.6
de
30.7
hi
0
40
80
120
160
DAP VCombi DAP VCombi DAP VCombi DAP VCombi DAP VCombi
EC1118 VL3 X5 Alchemy I LittoLevureAceti
c a
cid
2-p
hen
yl eth
yl este
r (
g L
-1)
0.25 g L-1 0.5 g L-1

157
Acetic acid esters: The five commercial yeast strains produced different amounts of acetic
acid esters in response to nitrogen supplementation (Figure 4-47), whereas acetic acid hexyl
ester was not detected in all YPF wines. Concentrations of acetic acid ethyl ester in YPF
wine were below the detectable limit of the calibration standard value, therefore they were
present as relative peak area. Addition of DAP at both levels promoted the highest
production of acetic acid ethyl ester by strain VL3 (12.5 + 0.3, and 12.3 + 0.3 relative peak
area, respectively) and by strain X5 (10.8 + 1.3 and 11.0 + 0.5 relative peak area,
respectively). Strain LittoLevure developed the greatest concentrations of acetic acid 3-
methylbutyl ester in the DAP and VCombi treatments at high level (510.8 + 49.9 and 472.5 +
45.1 g L-1, respectively) and acetic acid 2-methylbutyl ester in the high VCombi sample
(34.2 + 6.6 g L-1). Interestingly, it also produced the highest amount of acetic acid 2-phenyl
ethyl ester in the high VCombi sample (149.3 + 2.5 g L-1) followed by the low VCombi and
high DAP treatments (132.1 + 6.2 and 123.5 + 8.4 g L-1). Concentration of acetic acid 3-
methylbutyl ester was also most evident in the YPF wine produced by strain VL3 in the
presence of high VCombi (539.1 + 27.8 g L-1), while strains EC1118, VL3 and X5 also
developed the greatest amount of acetic acid 2-methylbutyl ester in the same nutrient
treatment (32.0 + 5.7, 33.6 + 1.3 and 31.1 + 3.5 g L-1).
Ethyl and diethyl esters: The data in Table 4-26 show that the interaction of yeast strain,
nutrient source and concentration significantly affected the production of ethyl esters. The
SAdiEtE was present in all YPF wines in trace quantities only. Strain X5 appeared to be a
high producer of PrEtE with less response to nutrient addition (74.7 + 5.3 to 97.8 + 8.8 g L-1),
whereas BuEtE was most evident in the high VCombi sample (157.4 + 8.2 g L-1) and LAEtE
in the high DAP sample (21.4 + 1.0 g L-1). The highest concentration of PrEtE was also
formed by the Alchemy I in the low VCombi treatment (93.3 + 6.1 g L-1) and by strain VL3 in
the high DAP addition (89.4 + 5.3 g L-1). The VL3 strain also produced the greatest amount
of LAEtE in the high DAP sample (21.4 + 0.6 g L-1) and iBuEtE in the DAP treatment at both
levels (58.0 + 3.8 and 59.2 + 5.9 g L-1, respectively). The concentration of BuEtE was also
most evident in the YPF wine produced by strain EC1118 in the high VCombi sample (173.3
+ 42.2 g L-1). In most case, VCombi at both levels significantly decreased the
concentrations of iBuEtE and LAEtE for most of the yeast strains.

158
Table 4-26 Concentration of ethyl and diethyl esters found in finished YPF wines produced by five different yeast strains with two nutrient
sources at two different concentrations
Yeasts Nutrients Concentrations (g L-1
) PrEtE (g L-1
) BuEtE (g L-1
) iBuEtE (g L-1
) LAEtE (mg L-1
) SAdiEtE (g L-1
)
EC1118 DAP 0.25 63.3 + 2.1 cd 128.0 + 10.7 bcd 14.6 + 2.8 def 11.8 + 0.6 d trace
0.50 70.1 + 4.5 bc 146.1 + 9.7 abc 18.7 + 1.8 d 14.3 + 0.7 c trace
VCombi 0.25 68.6 + 11.2 bcd 128.5 + 22.8 bcd 6.0 + 1.8 h 7.9 + 0.2 f trace
0.50 57.1 + 7.6 cd 173.3 + 42.2 a 5.5 + 1.5 h 8.3 + 0.2 f trace
VL3 DAP 0.25 71.9 + 2.3 bc 69.3 + 2.9 gh 58.0 + 3.8 a 16.7 + 0.9 b trace
0.50 89.4 + 5.3 ab 94.9 + 4.7 efg 59.2 + 5.9 a 21.4 + 0.6 a trace
VCombi 0.25 78.5 + 3.9 abc 108.8 + 5.6 def 17.7 + 1.1 d 8.0 + 0.1 f trace
0.50 61.5 + 4.4 cd 142.9 + 5.7 bc 14.0 + 1.7 def 8.4 + 0.3 f trace
X5 DAP 0.25 79.3 + 8.1 abc 73.4 + 5.1 gh 40.7 + 2.0 b 17.3 + 1.3 b trace
0.50 92.9 + 1.7 ab 90.6 + 2.7 efg 33.2 + 0.8 c 21.4 + 1.0 a trace
VCombi 0.25 97.8 + 8.8 a 120.6 + 12.9 cde 15.8 + 0.4 de 7.9 + 0.1 f trace
0.50 74.7 + 5.3 abc 157.4 + 8.2 ab 12.4 + 0.8 efg 8.4 + 0.2 f trace
Alchemy I DAP 0.25 77.0 + 22.6 abc 66.9 + 10.8 gh 15.3 + 3.0 de 9.8 + 0.2 e trace
0.50 57.4 + 20.7 cd 112.4 + 20.0 def 15.9 + 2.6 de 11.1 + 0.6 de trace
VCombi 0.25 93.3 + 6.1 ab 82.1 + 8.9 fgh 9.9 + 0.8 fgh 8.4 + 0.3 f trace
0.50 60.9 + 19.8 cd 115.4 + 10.5 cde 6.4 + 1.5 h 8.3 + 0.1 f trace
LittoLevure DAP 0.25 43.3 + 17.4 de 54.2 + 8.4 h 11.2 + 3.0 efg 8.8 + 0.4 f trace
0.50 55.6 + 16.4 cd 97.2 + 13.2 efg 16.2 + 2.7 de 10.6 + 0.5 de trace
VCombi 0.25 43.1 + 12.3 de 55.8 + 13.8 h 14.8 + 4.0 de 8.8 + 0.4 f trace
0.50 25.2 + 2.7 e 76.0 + 18.7 gh 8.9 + 2.5 gh 8.9 + 0.5 f trace
Each value shows the mean + standard deviation from three fermentation replicates. Values displaying different letters within the same column are
significantly different (p<0.05) among treatment combinations according to the DMRT test.

159
Medium-chain fatty acids and related ethyl esters: As given in Table 4-27, the results
show that the production of MCFAs, except for decanoic acid, and MCFA ethyl esters
significantly differed depending on yeast strains and nutrient supplementation. Strain
EC1118 developed the highest amounts of hexanoic and octanoic acids in the high VCombi
sample (4.3 + 0.5 and 3.7 + 0.8 mg L-1, respectively). It also produced the highest amounts of
HAEtE, OAEtE and DAEtE in both levels of VCombi treatments (369.4 + 87.4 and 412.7 +
85.9, 384.4 + 45.8 and 480.5 + 80.0, and 120.9 + 29.3 and 139.4 + 39.9 g L-1, respectively).
The greatest concentrations of these compounds were also present in the YPF wines
produced by strain X5 in a high VCombi treatment (4.1 + 0.2 hexanoic acid, 3.5 + 0.4 mg L-1
octanoic acid, 344.8 + 25.5 g L-1 HAEtE, 496.5 + 82.0 g L-1 OAEtE and 139.0 + 7.3 g L-1
DAEtE). The high VCombi addition also promoted the highest formation of all ethyl esters of
MCFAs by the strain LittoLevure (369.4 + 87.4, 384.4 + 45.8 and 120.9 + 29.3 g L-1 HAEtE,
OAEtE and DAEtE, respectively). Whereas, concentrations of decanoic acid in YPF wines
were similar ranging from 0.10 + 0.0 to 0.23 + 0.1 mg L-1.
Monoterpenes: Figure 4-48 shows that under this trial condition, three yeast strains
released similar concentrations of linalool and -terpineol without any response to the
nutrient addition. The YPF wines had similar concentrations of linalool ranging from 3.9 + 0.1
to 6.1 + 0.2 g L-1 and -terpineol from 8.7 + 0.1 to 10.2 + 0.1 g L-1. Other monoterpenes
like trans-linalool oxide and cis-linalool oxide were not detected in all YPF wines.
Figure 4-48 Concentration of linalool and -terpineol found in finished YPF wines developed
by five different yeast strains with two nutrient sources at two different
concentrations
Vertical bars represent standard deviations from three fermentation replicates. Compounds
displaying “(ns)” show no significant difference (p>0.05) among treatment combinations of
each compound according to the DMRT test.
4.6
4.4 4.5
5.2
4.7
5.4
5.1
5.8
5.2 5
.8
9.2
8.7
9.9
9.3 9
.8
9.1
9.1 9.3 9
.7 10
.2
4.6
4.4
3.9
4.6
4.0
5.3
5.2 5.5 5.7 6
.1
9.5
8.9
10
.2
9.0
10
.1
9.3
9.3
9.0
9.8 1
0.2
0
4
8
12
DA
P
VC
om
bi
DA
P
VC
om
bi
DA
P
VC
om
bi
DA
P
VC
om
bi
DA
P
VC
om
bi
DA
P
VC
om
bi
DA
P
VC
om
bi
DA
P
VC
om
bi
DA
P
VC
om
bi
DA
P
VC
om
bi
EC1118 VL3 X5 Alchemy I LittoLevure EC1118 VL3 X5 Alchemy I LittoLevure
Linolool (ns) alpha-Terpineol (ns)
Co
nc
en
tra
tio
n (
g L
-1)
0.25 g L-1 0.5 g L-1

160
Table 4-27 Concentration of fatty acids and their ethyl esters found in finished YPF wines produced by five different yeast strains with two nutrient
sources at two different concentrations
Yeasts Nutrients Concentrations
(g L-1
)
Hexanoic acid
(g L-1
)
Octanoic acid
(g L-1
)
Decanoic acid
(g L-1
)
HAEtE
(g L-1
)
OAEtE
(g L-1
)
DAEtE
(g L-1
)
EC1118 DAP 0.25 3.3 + 0.2 de 2.3 + 0.3 def 0.10 + 0.0 a 235.3 + 38.1 bcd 267.4 + 76.7 bcde 71.3 + 18.2 def
0.50 3.4 + 0.2 cd 2.5 + 0.3 cde 0.10 + 0.0 a 213.1 + 17.7 bcde 306.6 + 69.5 bcd 78.0 + 14.0 cde
VCombi 0.25 3.8 + 0.4 bc 3.1 + 0.5 abc 0.17 + 0.0 a 369.4 + 87.4 a 384.4 + 45.8 ab 120.9 + 29.3 ab
0.50 4.3 + 0.5 a 3.7 + 0.8 a 0.23 + 0.1 a 412.7 + 85.9 a 480.5 + 80.0 a 139.4 + 39.9 a
VL3 DAP 0.25 2.6 + 0.2 e 1.5 + 0.2 g 0.10 + 0.0 a 47.5 + 8.4 h 65.9 + 25.9 h 26.3 + 5.6 gh
0.50 2.8 + 0.2 de 1.6 + 0.2 fg 0.10 + 0.0 a 73.3 + 13.2 h 135.9 + 31.2 efgh 39.2 + 3.9 gh
VCombi 0.25 3.2 + 0.2 de 2.1 + 0.3 efg 0.10 + 0.0 a 162.6 + 34.9 def 248.8 + 67.7 bcdef 71.9 + 19.0 def
0.50 3.7 + 0.0 b 2.9 + 0.2 bcd 0.13 + 0.0 a 243.3 + 23.5 bc 371.9 + 61.9 abc 102.9 + 13.0 bc
X5 DAP 0.25 2.8 + 0.1 de 1.6 + 0.1 efg 0.10 + 0.0 a 83.3 + 21.6 gh 66.0 + 28.7 h 31.1 + 7.4 gh
0.50 2.8 + 0.2 de 1.6 + 0.2 fg 0.10 + 0.0 a 84.1 + 11.4 gh 113.5 + 35.1 fgh 28.9 + 6.2 gh
VCombi 0.25 3.4 + 0.1 cd 2.4 + 0.3 cde 0.10 + 0.0 a 265.1 + 35.4 b 313.3 + 61.3 bcd 90.0 + 9.4 cd
0.50 4.1 + 0.2 ab 3.5 + 0.4 ab 0.20 + 0.0 a 344.8 + 25.5 a 496.5 + 82.0 a 139.0 + 7.3 a
Alchemy I DAP 0.25 2.8 + 0.2 de 1.8 + 0.3 efg 0.10 + 0.0 a 113.6 + 13.3 fgh 102.2 + 30.0 gh 24.1 + 1.9 h
0.50 3.1 + 0.2 de 2.3 + 0.5 def 0.10 + 0.0 a 166.7 + 26.0 def 206.7 + 35.9 defg 50.5 + 4.1 efgh
VCombi 0.25 2.9 + 0.2 de 1.8 + 0.3 efg 0.10 + 0.0 a 150.3 + 9.0 efg 163.7 + 38.7 efgh 42.7 + 5.9 fgh
0.50 3.5 + 0.2 bc 2.8 + 0.6 cde 0.13 + 0.0 a 252.0 + 39.8 bc 305.3 + 75.1 bcd 87.1 + 10.6 cd
LittoLevure DAP 0.25 3.2 + 0.1 de 2.4 + 0.2 def 0.13 + 0.0 a 120.8 + 11.4 fgh 200.7 + 47.7 defgh 53.8 + 10.6 efgh
0.50 3.6 + 0.0 b 2.8 + 0.1 bcd 0.13 + 0.0 a 235.3 + 38.1 bcd 267.4 + 76.7 bcde 71.3 + 18.2 def
VCombi 0.25 3.2 + 0.2 de 2.3 + 0.3 def 0.13 + 0.0 a 213.1 + 17.7 bcde 306.6 + 69.5 bcd 78.0 + 14.0 cde
0.50 3.8 + 0.2 b 3.2 + 0.2 bcd 0.17 + 0.1 a 369.4 + 87.4 a 384.4 + 45.8 ab 120.9 + 29.3 ab
Each value shows the mean + standard deviation. Values displaying the same letter (only ‗a‘) within the same column indicate no significant difference
(p>0.05) among treatment combinations, whereas those displaying different letters are significantly different (p<0.05) according to the DMRT test.

161
4.3.4 Effect of three commercial Saccharomyces yeast strains and four different
nutrient sources at two different concentrations on growth kinetics, fermentative
characteristics, metabolic compounds and aromas of yellow passion fruit wines
The fermentation trial was performed in yellow passion fruit (YPF) juice, which was prepared
from frozen YPF puree. The physico-chemical characteristics and volatile compounds in YPF
puree and prepared YPF juice used in this fermentation trial are given in Table 4-28.
The fermentation trial was performed in prepared YPF juice. Three commercial yeast strains
of EC1118, VL3 and X5; four commercial nutrient sources of Vitamon Combi (VCombi),
Vitamon Ultra (VUltra), Fermaid E blanc (Fermaid E) and OptiWhite, and two concentrations
at 0.2 and 0.4 g L-1, were used in this YPF fermentation trial. This YPF fermentation trial was
aimed to investigate the impact of yeast strains, nutrient source and concentration on the
fermentation characteristics, non-volatile and volatile compounds.
Yeast strains and nutrient sources were obtained from the basis results of previous trials.
The EC1118 strain has a high popularity in wine and fruit wine industry and is recommended
for all types of wine. It also tended to produce less undesirable components under certain
condition as shown in the previous trials. Hence, it was used as a control strain in this YPF
trial, while the two Saccharomyces yeast strains, VL3 and X5 were chosen as they respond
to the nutrient supplementation, which affects the fermentation characteristics. Under certain
conditions, they also developed desirable fermentative characteristics and volatile
compounds as shown in previous trials. In addition, they have shown to have differences in
fermentation performances and organoleptic characteristics imparted to wines and also to
produce low SO2 and H2S, but rather to develop varietal aroma (Eglinton & Henschke, 1996;
Reynolds et al., 2001; Wang et al., 2003; Howell et al., 2004; Dubourdieu et al., 2006;
Swiegers et al., 2007, 2009).
YPF Puree: The data in Table 4-28 show that it had high acidity, which comprises mainly
citric acid 42.10 + 0.00 g L-1 and malic acid 5.25 + 0.00 g L-1, and low pH at 2.9 + 0.1. The
other chemical properties were TSS 9.0 + 0.1 0Brix, 58.2 + 1.5 g L-1 inverted sugar (as
glucose), 296.0 + 5.7 mg L-1 -amino nitrogen/NOPA (as isoleucine) and 2491.0 mg L-1 total
amino acid without proline (Table A-3). Some volatile compounds were 3.9 + 0.0 mg L-1 3-
methyl butanol, 918.3 + 1.9 g L-1 hexanol, 154.2 + 2.6 g L-1 butanoic acid ethyl ester, 47.1
+ 0.6 g L-1 linalool and 48.0 + 0.2 g L-1 -terpineol. While, 2-methyl butanol, 2-phenyl
ethanol, acetic acid ethyl ester, propionic acid ethyl ester, succinic acid diethyl ester and
ethyl ester of medium-chain fatty acids were detected only in trace quantities.

162
Prepared YPF juice: The physico-chemical characteristics of prepared YPF juice were pH
3.2 + 0.1, 2.80 + 0.07 g L-1 citric acid, 0.51 + 0.01 g L-1 malic acid, TSS 21.0 + 0.6 oBrix, 170.0
+ 2.8 g L-1 inverted sugar (as glucose), 26.7 + 1.2 mg L-1 -amino nitrogen/NOPA
and 164.4 mg L-1 total amino acid without proline (Table 4-28). The volatile components
were 2.2 + 0.3 mg L-1 free SO2 and 6.9 + 0.3 mg L-1 total SO2, 177.7 + 2.8 g L-1, hexanol
and 7.4 + 0.2 g L-1 -terpineol. Whereas, acetic acid ethyl ester, ethyl ester of butanoic acid,
octanoic acid and decanoic acid were detected only in trace quantities, but the other aroma
compounds that can be detected in YPF puree were not detected in the prepared YPF juice.
Table 4-28 Chemical compositions of YPF puree and prepared YPF juice used in this
fermentation trial
Composition YPF puree Prepared YPF juice
pH 2.9 + 0.1 3.2 + 0.1
Total soluble solid (oBrix) 9.0 + 0.1 21.0 + 0.6
Inverted sugar (g L-1) 58.2 + 1.5 170.0 + 2.8
NOPA (as mg L-1 isoleucine) 296.0 + 5.7 26.7 + 1.2
Total amino nitrogen without proline (mg L-1) 2491.0 164.4
Free SO2 (mg L-1) n.m. 2.2 + 0.3
Total SO2 (mg L-1) n.m. 6.9 + 0.5
Citric acid (g L-1) 42.10 + 0.00 2.80 + 0.07
Malic acid (g L-1) 5.25 + 0.00 0.51 + 0.01
3-Methyl butanol (mg L-1) 3.9 + 0.0 n.d.
2-Methyl butanol (mg L-1) traces n.d.
2-Phenyl ethanol (mg L-1) traces n.d.
Hexanol (g L-1) 918.3 + 1.9 177.7 + 2.8
Acetic acid ethyl ester (mg L-1) traces traces
Propionic acid ethyl ester (g L-1) traces n.d.
Butanoic acid ethyl ester (g L-1) 154.2 + 2.6 traces
Succinic acid diethyl ester (g L-1) traces n.d.
Octanoic acid ethyl ester (g L-1) traces traces
Decanoic acid ethyl ester (g L-1) traces traces
Linalool (g L-1) 47.1 + 0.6 n.d.
-Terpineol (g L-1) 48.0 + 0.2 7.4 + 0.2
Each value shows the mean + standard deviation from two sample replicates.
NOPA denotes free α-amino acid nitrogen.
n.d. denotes not detected. n.m. denotes not measured

163
Figure 4-49 Growth kinetics of YPF juice fermentations with three different commercial yeast
strains and four different nutrient mixtures at two different concentrations
The fermentation kinetics: In Figure 4-49, for strain EC1118, low level of all nutrients as
well as high OptiWhite addition gave a similar long growth lag phase (4-5 days) and had
slower growth kinetics than the other fermentations. However, it completely finished
fermentation faster than the other yeast strains with similar nutrient conditions (25-33 days).
On the other hand, the addition of high concentration of any kind of nutrient, except for the
OptiWhite, enhanced the growth kinetics and reduced fermentation times from 25-34 days at
low nutrient level to 21- 23 days. When any level of OptiWhite was added to the YPF juice,
strain VL3 and X5 showed a similar long growth lag phase (3 days), followed by slow
fermentation kinetics and duration, however they finished fermentations after 30-46 days. In
addition, the fermentation with strain VL3 at high OptiWhite addition seemed to result in stuck
fermentation with high residual sugar (Table 4-29). While, the supplementation of YPF juice
with VCombi, VUltra and Fermaid E at either low or high level stimulated the VL3 and X5
strains to have similar faster growth kinetics, but they had afterwards different durations of
fermentation in response to the nutrient addition. Strain VL3 had sluggish fermentations in a
low level of VCombi, VUltra and Fermaid E (37-46 days), but at high level of these nutrients
significantly decreased fermentation times to 23-36 days. The X5 strain followed similar
pattern as strain VL3, but had shorter fermentation times in the same nutrient conditions.
0
20
40
60
80
1 4 7 10 13 16 19 22 25 28 31 34 37 40 43 46
Fermentation days
Carb
on
dio
xid
e (
g L
-1)
EC1118-VCombi 0.2 g L-1 EC1118-VCombi 0.4 g L-1
EC1118-VUltra 0.2 g L-1 EC1118-VUltra 0.4 g L-1
EC1118-Fermaid E 0.2 g L-1 EC1118-Fermaid E 0.4 g L-1
EC1118-OptiWhite 0.2 g L-1 EC1118-OptiWhite 0.4 g L-1
VL3-VCombi 0.2 g L-1 VL3-VCombi 0.4 g L-1
VL3-VUltra 0.2 g L-1 VL3-VUltra 0.4 g L-1
VL3-Fermaid E 0.2 g L-1 VL3-Fermaid E 0.4 g L-1
VL3-OptiWhite 0.2 g L-1 X5-VCombi 0.2 g L-1
X5-VCombi 0.4 g L-1 X5-VUltra 0.2 g L-1
X5-VUltra 0.4 g L-1 X5-Fermaid E 0.2 g L-1
X5-Fermaid E 0.4 g L-1 X5-OptiWhite 0.2 g L-1
X5-OptiWhite 0.4 g L-1 VL3-OptiWhite 0.4 g L-1

164
Chemical composition: As shown in Table 4-29, the data show that the three yeast strains
produced YPF wines having significantly different amounts of residual sugar in response to
nutrient source and concentration. The fermentation with strain VL3 at high OptiWhite
addition resulted in the highest level of residual sugar in YPF wine (10.08 + 0.3 g L-1),
followed by strain VL3 and X5 at low OptiWhite treatment (2.82 + 0.6 and 3.0 + 0.3 g L-1,
respectively). While, the EC1118 strain seemed to produce YPF wines having similar low
amounts of residual sugar in most nutrients (0.30 + 0.2 to 0.50 + 0.1 g L-1), except in the low
OptiWhite sample (0.75 + 0.2 g L-1). The YPF wines had similar concentrations of glycerol,
which ranged from 2.8 + 0.2 to 5.6 + 0.4 g L-1.
Organic acids: Yeast strain, nutrient source and concentration significantly affected the
concentrations of malic and citric acid in YPF wines (Table 4-30). Concentrations of acetic
acid had no statistical differences among the YPF wine treatments ranging from 0.10 + 0.00
to 0.43 + 0.07 g L-1. The highest amounts of malic acid were found in the YPF wine of strain
VL3 at both levels of Fermaid E (0.79 + 0.02 and 0.76 + 0.01 g L-1, respectively) and strain
X5 in the low Fermaid E treatment (0.77 + 0.01 g L-1). The two strains above can catalyze
malic acid, particularly strain VL3 produced the highest amounts (32.9-35.4 %). Although
strain EC1118 seemed to have no capability to produce this organic acid, it produced YPF
wines having the highest concentration of citric acid in the high Fermaid E and VCombi
samples (2.73 + 0.05 and 2.70 + 0.00 g L-1, respectively), followed by the samples with low
level of VCombi and VUltra additions (2.67 + 0.05 and 2.67 + 0.05 g L-1).
SO2-binding compounds: Three yeast strains, nutrient source and concentration
statistically affected both keto acids but not acetaldehyde (Figure 4-50). There were similar
concentrations of acetaldehyde among all YPF wines ranging from 24.5 + 0.3 to 30.6 + 0.9
mg L-1. The addition of OptiWhite at low level stimulated the highest production of -
ketoglutarate by strain VL3 (163.2 + 15.3 mg L-1), followed by strain X5 (142.6 + 5.3 mg L-1),
and the former strain in the high OptiWhite sample (137.0 + 3.6 mg L-1). The addition of YPF
juice with OptiWhite at high level resulted in the highest formation of pyruvate by the VL3
strain (143.0 + 2.9 mg L-1), followed by the same nutrient at low level (126.3 + 5.0 mg L-1).
Nevertheless, when the other nutrient sources were added, particularly at high level, the
production of both keto acids significantly decreased.

165
Table 4-29 Chemical composition of final YPF wines obtained from YPF juices fermented
with three different yeast strains with four nutrient sources at two different
concentrations
Yeasts Nutrients Concentrations (g L-1) Residual sugar (g L-1) Glycerol (g L-1)
EC1118 VCombi 0.2 0.32 + 0.1 h 3.9 + 0.7 a
0.4 0.30 + 0.2 h 3.5 + 0.7 a
VUltra 0.2 0.33 + 0.0 gh 3.5 + 0.8 a
0.4 0.33 + 0.0 gh 3.8 + 0.6 a
Fermaid E 0.2 0.50 + 0.1 efgh 3.8 + 0.5 a
0.4 0.37 + 0.1 fgh 3.9 + 0.2 a
OptiWhite 0.2 0.75 + 0.2 cdef 3.8 + 0.9 a
0.4 0.45 + 0.1 fgh 4.2 + 0.6 a
VL3 VCombi 0.2 0.72 + 0.1 cdefg 3.2 + 0.1 a
0.4 0.50 + 0.1 efgh 3.9 + 0.8 a
VUltra 0.2 0.87 + 0.3 cde 3.5 + 0.6 a
0.4 0.65 + 0.2 defgh 3.0 + 1.0 a
Fermaid E 0.2 0.62 + 0.0 defgh 4.2 + 0.7 a
0.4 0.45 + 0.2 fgh 4.2 + 0.2 a
OptiWhite 0.2 2.82 + 0.6 b 5.6 + 0.4 a
0.4 10.08 + 0.3 a 5.0 + 0.7 a
X5 VCombi 0.2 0.47 + 0.2 fgh 3.5 + 0.7 a
0.4 0.47 + 0.2 fgh 3.4 + 0.5 a
VUltra 0.2 0.42 + 0.2 fgh 3.6 + 0.5 a
0.4 0.53 + 0.1 defgh 3.3 + 0.6 a
Fermaid E 0.2 1.05 + 0.1 c 2.8 + 0.2 a
0.4 0.53 + 0.1 defgh 3.3 + 0.5 a
OptiWhite 0.2 3.00 + 0.3 b 3.5 + 0.2 a
0.4 0.90 + 0.3 cd 4.8 + 0.5 a
Each value shows the mean + standard deviation from three fermentation replicates.
Values displaying the same letter (only ‗a‘) within the same column indicate no significant
difference (p>0.05) among treatment combinations, whereas those displaying different letters
are significantly different (p<0.05) according to the DMRT test.

166
Table 4-30 Concentration of organic acids found in finished YPF wines produced by three
different yeast strains with four nutrient sources at two different concentrations
Yeasts Nutrients Concentrations
(g L-1)
Malic acid
(g L-1)
Acetic acid
(g L-1)
Citric acid
(g L-1)
EC1118 VCombi 0.2 0.48 + 0.01 hij 0.27 + 0.08 a 2.67 + 0.05 abc
0.4 0.45 + 0.01 j 0.20 + 0.00 a 2.70 + 0.00 ab
VUltra 0.2 0.47 + 0.01 hij 0.37 + 0.05 a 2.67 + 0.05 abc
0.4 0.46 + 0.00 ij 0.30 + 0.00 a 2.63 + 0.05 bc
Fermaid E 0.2 0.50 + 0.00 h 0.37 + 0.05 a 2.37 + 0.07 ef
0.4 0.45 + 0.01 j 0.30 + 0.00 a 2.73 + 0.05 a
OptiWhite 0.2 0.49 + 0.01 hi 0.37 + 0.06 a 2.40 + 0.00 def
0.4 0.50 + 0.02 h 0.27 + 0.05 a 2.47 + 0.05 de
VL3 VCombi 0.2 0.72 + 0.03 cd 0.27 + 0.06 a 2.20 + 0.00 hi
0.4 0.63 + 0.02 f 0.20 + 0.00 a 2.60 + 0.00 c
VUltra 0.2 0.74 + 0.03 bc 0.23 + 0.05 a 2.20 + 0.00 hi
0.4 0.62 +0.02 fg 0.10 + 0.00 a 2.50 + 0.00 d
Fermaid E 0.2 0.79 + 0.02 a 0.23 + 0.05 a 2.43 + 0.05 de
0.4 0.76 + 0.01 ab 0.20 + 0.00 a 2.13 + 0.07 i
OptiWhite 0.2 0.62 + 0.02 fg 0.43 + 0.07 a 2.40 + 0.00 def
0.4 0.61 + 0.04 fg 0.33 + 0.06 a 2.30 + 0.10 fg
X5 VCombi 0.2 0.70 + 0.02 de 0.17 + 0.05 a 2.47 + 0.05 de
0.4 0.59 + 0.01 g 0.20 + 0.00 a 2.43 + 0.07 de
VUltra 0.2 0.70 + 0.00 de 0.27 + 0.03 a 2.27 + 0.05 gh
0.4 0.62 + 0.01 fg 0.20 + 0.00 a 2.40 + 0.00 def
Fermaid E 0.2 0.77 + 0.01 ab 0.23 + 0.03 a 2.27 + 0.06 gh
0.4 0.68 + 0.03 e 0.20 + 0.02 a 2.47 + 0.05 de
OptiWhite 0.2 0.61 +0.01 fg 0.30 + 0.00 a 2.47 + 0.03 de
0.4 0.62 + 0.01 fg 0.30 + 0.00 a 2.40 + 0.00 def
Each value shows the mean + standard deviation from three fermentation replicates.
Values displaying the same letter (only ‗a‘) within the same column indicate no significant
difference (p>0.05) among treatment combinations, whereas those displaying different letters
are significantly different (p<0.05) according to the DMRT test.

167
Sulphur containing compounds: Figure 4-51 shows that under this trial conditions,
ethanethiol, dimethyl sulphide, dimethyl disulphide, thioacetic acid of S-ethylester and S-
methylester, diethyl disulphide and dimethyl trisulphide were not detected in YPF wines.
Strain EC1118 produced H2S in most nutrient treatments, but the highest amount was
present in the low OptiWhite sample (2.9 + 0.1 g L-1). The greatest amount of H2S was also
produced by strain X5 in high OptiWhite addition (3.1 + 0.2 g L-1), whereas in the low
Fermaid E and OptiWhite and high VUltra samples H2S was not detected. Strain X5
produced the highest amount of carbon disulphide in the low Fermaid E sample (17.1
+ 2.2 g L-1), followed by the high OptiWhite and low VUltra treatments (11.4 + 1.0 and
10.8 + 0.1 g L-1, respectively). Methanethiol was detected only in the YPF wines produced
by strain EC1118 with the addition of VUltra and Fermaid E at high level (2.6 + 0.2 and 2.7 +
0.2 g L-1, respectively).
Higher alcohols: The results in Figure 4-52 show that there were no significant differences
in the concentration of hexanol among all YPF wines ranging from 177.3 + 2.8 to 193.9
+ 6.4 g L-1. The VL3 strain developed the greatest amount of 2-methyl propanol in the
OptiWhite sample at low level (112.7 + 8.3 mg L-1) followed by the one at high level (82.7 +
0.9 mg L-1). While, the EC1118 strain significantly produced the lowest amounts of this
alcohol (18.5 + 0.9 to 22.4 + 2.6 mg L-1), except in the OptiWhite treatment, but it produced
the highest amount of 2-phenyl ethanol in the Fermaid E treatments and the high VCombi
sample (41.2 + 0.4, 40.7 + 2.0 and 41.6 + 1.6 mg L-1). Strain VL3 developed the highest
amount of 3-methyl butanol in both levels of Fermaid E sample and the low OptiWhite
treatment (202.3 + 3.0, 205.3 + 32.8 and 196.8 + 12.4 mg L-1, respectively), whereas 2-
methyl butanol was most evident in both Fermaid E levels (52.3 + 1.4 and 51.2 + 8.1 mg L-1,
respectively).

168
Figure 4-50 Concentration of SO2-binding compounds present in finished YPF wines
produced by three different yeast strains with four nutrient sources at two
different concentrations
Vertical bars represent standard deviations from three fermentation replicates. Means
followed by different letters on the top of the bar are significantly different (p<0.05) between
treatment combinations of each compound, whereas those followed by the same letters on
the top of the bar are not significantly different (p>0.05) according to the DMRT test.
142.6
b
60.2
efg
61.8
ef
52.7
fg
hi
163.2
a
66.5
e
66.1
e
62.9
ef
111.7
d
56.3
efg
h
54.3
fg
hi
48.1
hi
122.4
c
49.5
hi
51.4
gh
i
44.9
i
137.0
b
57.8
efg
h
56.7
efg
h
57.2
efg
h
105.9
d
50.3
gh
i
49.0
hi
44.3
i
0
50
100
150
200
VC
om
bi
VU
ltra
Fe
rma
id
E
Op
tiW
hit
e
VC
om
bi
VU
ltra
Fe
rma
id
E
Op
tiW
hit
e
VC
om
bi
VU
ltra
Fe
rma
id
E
Op
tiW
hit
e
EC1118 VL3 X5
-K
eto
glu
tara
te (
mg
L-1
)
11
8.7
c
14
.7 i
19
.3 h
13
.1 ij
12
6.3
b
12
.6 ij
19
.1 h
13
.5 ij
10
2.1
d
25
.4 g
32
.7 f
23
.4 g
90
.1 e
8.2
kl
12
.0 ij
9.8
jk
l
14
3.0
a
7.2
l
11
.0 jk
11
.2 ijk
91
.1 e
19
.2 h
18
.8 h
11
.4 ijk
0
40
80
120
160
VC
om
bi
VU
ltra
Fe
rma
id
E
Op
tiW
hit
e
VC
om
bi
VU
ltra
Fe
rma
id
E
Op
tiW
hit
e
VC
om
bi
VU
ltra
Fe
rma
id
E
Op
tiW
hit
e
EC1118 VL3 X5
Pyru
vate
(m
g L
-1)
28.2
a
27.8
a
28.8
a
24.5
a 28.5
a
28.2
a
28.7
a
27.4
a
29.1
a
27.9
a
29.2
a
24.8
a
30.1
a
28.8
a
29.7
a
25.2
a
30.6
a
30.5
a
30.0
a
27.5
a
30.4
a
28.8
a
30.3
a
24.5
a0
10
20
30
VC
om
bi
VU
ltra
Fe
rma
id
E
Op
tiW
hit
e
VC
om
bi
VU
ltra
Fe
rma
id
E
Op
tiW
hit
e
VC
om
bi
VU
ltra
Fe
rma
id
E
Op
tiW
hit
e
EC1118 VL3 X5
Aceta
ldeh
yd
e (
mg
L-1
)
0.2 g L-1 0.4 g L-1

169
Figure 4-51 Concentration of hydrogen sulphide, carbon disulphide and methanethiol
detected in finished YPF wines produced by three different yeast strains with
four nutrient sources at two different concentrations
Vertical bars represent standard deviations from three fermentation replicates. Means
followed by different letters on the top of the bar are significantly different (p<0.05) between
treatment combinations of each compound, whereas those followed by the same letters on
the top of the bar are not significantly different (p>0.05) according to the DMRT test.
n.d. denotes not detected
n.d
.
n.d
.
2.3
b
2.2
bc
2.2
bc
2.0
bc
d
n.d
.
1.6
ef
2.9
a
1.9
cd
ef
1.8
cd
ef
1.6
ef
1.8
cd
ef
1.8
cd
ef
n.d
.
2.0
bc
d
3.1
a
1.8
cd
ef
1.7
cd
ef
2.0
bc
d
2.0
bc
d
2.4
b
2.1
bc
d
1.5
f
0
1
2
3
4
VC
om
bi
VU
ltra
Fe
rma
id
E
Op
tiW
hit
e
VC
om
bi
VU
ltra
Fe
rma
id
E
Op
tiW
hit
e
VC
om
bi
VU
ltra
Fe
rma
id
E
Op
tiW
hit
e
EC1118 VL3 X5
Hyd
rog
en
su
lph
ide (
g L
-1)
10
.8 b
2.5
gh
ij
17
.1 a
2.8
fg
hij7.4
cd
10
.8 b
6.4
cd
e
5.1
de
fg
7.4
cd
8.7
bc
7.2
cd
4.8
de
fgh
i
1.9
hij
11
.4 b
1.8
ij
3.1
fg
hi
n.d
.
4.9
de
fg
7.0
cd
5.5
cd
efg
3.7
efg
hi
5.7
cd
ef
6.6
cd
e
6.3
cd
e
0
5
10
15
20
VC
om
bi
VU
ltra
Fe
rma
id
E
Op
tiW
hit
e
VC
om
bi
VU
ltra
Fe
rma
id
E
Op
tiW
hit
e
VC
om
bi
VU
ltra
Fe
rma
id
E
Op
tiW
hit
e
EC1118 VL3 X5
Carb
on
dis
ulp
hid
e (
g L
-1)
n.d
.
n.d
.
n.d
.
n.d
.
n.d
.
n.d
.
n.d
.
n.d
.
n.d
.
n.d
.
n.d
.
n.d
.
2.6
a
2.7
a
n.d
.
n.d
.
n.d
.
n.d
.
n.d
.
n.d
.
n.d
.
n.d
.
n.d
.
n.d
.
0
1
2
3
VC
om
bi
VU
ltra
Fe
rma
id
E
Op
tiW
hit
e
VC
om
bi
VU
ltra
Fe
rma
id
E
Op
tiW
hit
e
VC
om
bi
VU
ltra
Fe
rma
id
E
Op
tiW
hit
e
EC1118 VL3 X5
Yeast strains
Me
tha
ne
tio
l (
g L
-1)
0.2 g L-1 0.4 g L-1

170
Figure 4-52 Concentration of higher alcohols present in finished YPF wines developed by
three different yeast strains with four nutrient sources at two different
concentrations
Vertical bars represent standard deviations from three fermentation replicates. Means
followed by different letters on the top of the bar are significantly different (p<0.05) between
treatment combinations of each compound, whereas those followed by the same letters on
the top of the bar are not significantly different (p>0.05) according to the DMRT test.
27
.5 d
e
28
.7 c
d
24
.4 e
fg41
.2 a
35
.7 b
36
.7 b
70
.5 c
31
.4 i
j
36
.1 h
i
32
.5 h
ij
59
.5 d
11
2.7
a
52
.8 d
e
45
.0 f
g
41
.0 g
h
19
.7 k
22
.4 k
20
.1 k
27
.2 d
e
17
.6 h
26
.1 d
ef
23
.0 g
26
.5 d
ef
14
.7 i2
8.4
cd
28
.0 c
d
23
.0 g
40
.7 a
36
.9 b
41
.6 a
37
.2 g
hi
35
.2 h
ij
31
.0 i
j
27
.1 j
k
82
.7 b
49
.8 e
f
40
.3 g
h
35
.0 h
ij
37
.1 g
hi
18
.5 k
20
.8 k
20
.0 k 3
0.7
c
17
.8 h
24
.2 f
g
25
.5 d
efg
28
.1 c
d
16
.8 h
i
0
25
50
75
100
125
VC
om
bi
VU
ltra
Ferm
aid
E
Op
tiW
hit
e
VC
om
bi
VU
ltra
Ferm
aid
E
Op
tiW
hit
e
VC
om
bi
VU
ltra
Ferm
aid
E
Op
tiW
hit
e
VC
om
bi
VU
ltra
Ferm
aid
E
Op
tiW
hit
e
VC
om
bi
VU
ltra
Ferm
aid
E
Op
tiW
hit
e
VC
om
bi
VU
ltra
Ferm
aid
E
Op
tiW
hit
e
EC1118 VL3 X5 EC1118 VL3 X5
2-Methyl propanol 2-Phenyl ethanol
Co
ncen
trati
on
(m
g L
-1)
159.4
defg
h
155.8
defg
h
156.7
defg
h
147.0
gh
178.2
bcd
e
187.7
ab
c
202.3
a
196.8
ab
153.5
efg
h
148.6
fg
h
146.0
gh
138.7
h
34.2
g
hij
34.1
gh
ij
35.1
gh
ij
31.3
j
44.8
cd
46.7
bc
52.3
a
44.4
cd
e
39.9
defg
38.8
efg
hi
39.5
defg
h
33.3
hij
176.6
bcd
e
164.7
cd
efg
160.7
defg
h
142.0
gh
165.4
cd
efg
172.5
cd
ef
205.3
a
179.0
bcd
139.0
h
147.7
fg
h
164.6
cd
efg
101.5
i
34.9
gh
ij
33.6
hij
33.0
ij
31.2
j
38.2
fg
hi
41.4
cd
ef
51.2
ab
42.0
cd
ef
33.9
gh
ij
37.8
fg
hi
42.6
cd
ef
24.9
k
0
60
120
180
240
VC
om
bi
VU
ltra
Fe
rma
id
E
Op
tiW
hit
e
VC
om
bi
VU
ltra
Fe
rma
id
E
Op
tiW
hit
e
VC
om
bi
VU
ltra
Fe
rma
id
E
Op
tiW
hit
e
VC
om
bi
VU
ltra
Fe
rma
id
E
Op
tiW
hit
e
VC
om
bi
VU
ltra
Fe
rma
id
E
Op
tiW
hit
e
VC
om
bi
VU
ltra
Fe
rma
id
E
Op
tiW
hit
e
EC1118 VL3 X5 EC1118 VL3 X5
3-Methyl butanol 2-Methyl butanol
Co
ncen
trati
on
(m
g L
-1)
177.9
a
182.9
a
186.4
a
189.2
a
187.6
a
193.9
a
185.4
a
185.0
a
182.1
a
183.3
a
183.0
a
183.5
a
177.9
a
177.3
a
181.2
a
180.6
a
177.5
a
181.7
a
182.9
a
184.6
a
175.6
a
180.5
a
183.7
a
180.9
a0
50
100
150
200
VCombi VUltra Fermaid E OptiWhite VCombi VUltra Fermaid E OptiWhite VCombi VUltra Fermaid E OptiWhite
EC1118 VL3 X5
He
xa
no
l (
g L
-1)
0.2 g L-1 0.4 g L-1

171
Acetic acid esters: The results demonstrate that these compounds were dependent upon
yeast strain, nutrient source and concentration (Figure 4-53). It is similar to previous trials of
YPF fermentations, concentrations of acetic acid ethyl ester were only detected in small
quantities and out of the limit of quantification (50 mg L-1), thus it was present as relative
peak area. The addition of OptiWhite at both levels stimulated the highest production of
acetic acid ethyl ester by strain VL3 (17.0 + 1.3 and 15.3 + 0.7 relative peak area,
respectively), followed by the low Fermaid E treatment, and by strain X5 at high level of
OptiWhite (13.7 + 0.8 and 13.6 + 2.0 relative peak area, respectively). The greatest amount
of acetic acid 2-phenyl ethyl ester was produced by the EC1118 strain in the presence of
VCombi at high level (145.0 + 11.9 g L-1), followed by the VUltra and Fermaid E treatments
at high level (101.2 + 4.9 and 101.5 + 6.6 g L-1, respectively). A high level of VCombi
stimulated the highest production of acetic acid 3-methylbutyl ester and acetic acid 2-
methylbutyl ester by strain EC1118 (672.4 + 70.9 and 43.3 + 0.9 g L-1, respectively),
followed by strain VL3 at high level of VCombi (519.8 + 53.9 and 32.9 + 3.6 g L-1,
respectively) and VUltra treatments (558.4 + 45.9 and 35.5 + 2.6 g L-1, respectively).
Ethyl and diethyl esters: As shown in Table 4-31 and Table 4-32, three yeast strains
significantly produced different ethyl esters concentrations in response to nutrient
supplementation. Succinic acid diethyl ester was detected only in trace amounts in all YPF
wines. The addition of VCombi at high level promoted the highest formation of BuEtE by
strain EC1118 (259.4 + 6.9 g L-1) followed by strain X5 (196.3 + 5.1 g L-1). These two
strains also produced high amounts of this ethyl ester in the high VUltra sample (180.9 +
16.1 and 184.4 + 2.0 g L-1, respectively). Supplementation of YPF juice with high OptiWhite
level promoted the highest formation of iBuEtE and LAEtE by the VL3 strain (53.4 + 12.4 and
13.0 + 0.5 g L-1, respectively) followed by X5 strain (31.6 + 4.4 and 12.1 + 0.6 g L-1,
respectively). The greatest concentration of PrEtE was produced by strain VL3 in the high
OptiWhite sample (143.4 + 3.9 g L-1) and by the X5 strain in the low Fermaid E treatment
(138.9 + 19.6 g L-1). In most cases, high level of VCombi addition seemed to decrease the
production of iBuEtE, PrEtE and LAEtE, but to increase BuEtE formation.

172
Figure 4-53 Concentration of acetic acid esters present in finished YPF wines developed by
three different yeast strains with four nutrient sources at two different
concentrations (*10 = concentration of compound times 10)
Vertical bars represent standard deviations from three fermentation replicates. Means
followed by different letters on the top of the bar are significantly different (p<0.05) among
treatment combinations of each compound according to the DMRT test.
Relative peak area = (peak area of sample)/(Peak area of internal standard)
9.8
efg
9.1
g
9.3
fg
8.5
g 10
.5 d
efg
11
.4 d
ef 13
.7 b
c
17
.0 a
11
.3 d
ef
12
.1 c
d
11
.7 c
de
13
.6 b
c
10
.5 d
efg
9.1
g
9.5
fg
8.9
g
9.4
fg 1
0.3
de
fg
11
.8 c
de
15
.3 a
b
10
.6 d
efg
11
.3 d
ef
11
.9 c
de
9.3
fg
0
5
10
15
20
VCombi VUltra Fermaid E OptiWhite VCombi VUltra Fermaid E OptiWhite VCombi VUltra Fermaid E OptiWhite
EC1118 VL3 X5
Acetic acid ethyl ester
Rela
tiv
e p
ea
k a
rea
102.2
b
91.8
c
99.4
b
58.9
hi
76.9
ef
74.3
ef
86.1
cd
50.3
j 69
.3 f
g
61.9
gh
76.7
ef
43.8
j
14
5.0
a
10
1.2
b
10
1.5
b
58
.6 h
i
88
.2 c
90
.0 c
87
.4 c
51
.2 ij
78
.4 d
e
77
.8 d
ef
72
.3 e
f
47
.9 j
0
40
80
120
160
VCombi VUltra Fermaid E OptiWhite VCombi VUltra Fermaid E OptiWhite VCombi VUltra Fermaid E OptiWhite
EC1118 VL3 X5
Aceti
c a
cid
2-p
hen
yle
thyl este
r ( g
L-1
)
14
.0 k
l
15
.5 jk
l
15
.5 ijk
l
18
.2 h
ij
19
.8 h2
5.6
ef
24
.2 f
g
23
.6 f
g
12
.6 l
17
.5 h
ijk
19
.1 h
i
23
.9 f
g
4.5
j
9.5
ij
11
.2 h
i
16
.9 g
h
23
.1 g
34
.5 e
f
30
.8 f
30
.3 f
5.8
ij
9.1
ij
12
.2 h
i
21
.9 g
14
.3 k
l
19
.1 h
i
30
.6 c
d
31
.5 c
d
14
.0 l
27
.9 d
e
35
.5 b
32
.9 b
c
13
.5 l
21
.4 g
h
27
.9 d
e
43
.3 a
3.5
j
21
.5 g
37
.8 d
e43
.6 c
d
9.6
ij
44
.0 c
55
.8 b
52
.0 b
6.5
ij
19
.4 g
32
.7 e
f
67
.2 a
0
25
50
75
VC
om
bi
VU
ltra
Fe
rma
id
E
Op
tiW
hit
e
VC
om
bi
VU
ltra
Fe
rma
id
E
Op
tiW
hit
e
VC
om
bi
VU
ltra
Fe
rma
id
E
Op
tiW
hit
e
VC
om
bi
VU
ltra
Fe
rma
id
E
Op
tiW
hit
e
VC
om
bi
VU
ltra
Fe
rma
id
E
Op
tiW
hit
e
VC
om
bi
VU
ltra
Fe
rma
id
E
Op
tiW
hit
e
EC1118 VL3 X5 EC1118 VL3 X5
Acetic acid 3-methylbutyl ester*10 Acetic acid 2-methylbutyl ester
Co
ncen
trati
on
(
g L
-1)
0.2 g L-1 0.4 g L-1

173
Table 4-31 Concentration of butanoic and isobutanoic acid ethyl esters present in finished
YPF wines developed by three different yeast strains with four nutrient sources
at two different concentrations
Yeasts Nutrients Concentrations (g L-1) BuEtE (g L-1) iBuEtE (g L-1)
EC1118 VCombi 0.2 169.9 + 1.7 cd 4.2 + 0.6 g
0.4 259.4 + 6.9 a 3.5 + 0.3 g
VUltra 0.2 127.5 + 21.1 gh 5.4 + 0.8 fg
0.4 180.9 + 16.1 bc 3.6 + 0.9 g
Fermaid E 0.2 116.1 + 10.6 hi 6.1 + 0.3 fg
0.4 156.4 + 12.2 de 5.7 + 1.0 fg
OptiWhite 0.2 62.1 + 5.5 k 14.3 + 1.3 de
0.4 59.3 + 8.0 kl 12.3 + 1.6 e
VL3 VCombi 0.2 104.2 + 9.0 ij 14.4 + 2.9 de
0.4 160.1 + 13.6 de 13.2 + 1.3 de
VUltra 0.2 103.9 + 18.6 ij 16.5 + 1.0 cde
0.4 158.8 + 8.7 de 13.9 + 2.2 de
Fermaid E 0.2 87.1 + 7.9 j 21.7 + 2.5 c
0.4 129.2 + 14.9 fgh 19.4 + 3.5 cd
OptiWhite 0.2 53.0 + 10.3 kl 53.4 + 12.4 a
0.4 42.2 + 3.0 l 27.1 + 1.7 b
X5 VCombi 0.2 143.9 + 2.3 efg 11.6 + 1.5 ef
0.4 196.3 + 5.1 b 11.0 + 0.5 ef
VUltra 0.2 118.7 + 4.7 hi 13.9 + 1.3 de
0.4 184.4 + 2.0 bc 10.4 + 1.2 ef
Fermaid E 0.2 105.6 + 15.0 ij 13.0 + 2.3 de
0.4 147.4 + 9.9 ef 14.6 + 0.4 de
OptiWhite 0.2 59.6 + 6.4 kl 31.6 + 4.4 b
0.4 49.3 + 2.0 kl 20.6 + 1.6 c
Each value shows the mean + standard deviation from three fermentation replicates.
Values displaying different letters within the same column are significantly different (p<0.05)
among treatment combinations according to the DMRT test.

174
Table 4-32 Concentration of ethyl esters and diethyl ester present in finished YPF wines
developed by three different yeast strains with four nutrient sources at two
different concentrations
Yeasts Nutrients Concentrations
(g L-1)
PrEtE
(g L-1)
LAEtE
(mg L-1)
SAdiEtE
(g L-1)
EC1118 VCombi 0.2 66.4 + 2.5 jkl 8.3 + 0.2 h Trace
0.4 53.9 + 0.8 l 9.4 + 0.2 efg Trace
VUltra 0.2 71.7 + 2.6 ijkl 8.5 + 0.1 gh Trace
0.4 59.6 + 6.5 kl 9.0 + 0.1 fg Trace
Fermaid E 0.2 73.5 + 8.1 hijk 8.3 + 0.1 h Trace
0.4 66.5 + 1.9 jkl 8.9 + 0.2 fg Trace
OptiWhite 0.2 81.4 + 12.7 ghij 10.1 + 0.3 cde Trace
0.4 85.8 + 18.5 fghi 9.5 + 0.2 def Trace
VL3 VCombi 0.2 90.9 + 16.8 fgh 9.0 + 0.2 fg Trace
0.4 65.4 + 8.4 jkl 9.6 + 0.3 efg Trace
VUltra 0.2 95.1 + 14.4 efg 9.2 + 0.1 fg Trace
0.4 69.7 + 9.5 ijkl 9.6 + 0.3 efg Trace
Fermaid E 0.2 126.4 + 7.6 bc 9.1 + 0.2 fg Trace
0.4 102.4 + 15.9 def 9.8 + 0.7 cde Trace
OptiWhite 0.2 123.0 + 5.6 bc 13.0 + 0.5 a Trace
0.4 143.4 + 3.9 a 10.4 + 0.5 cd Trace
X5 VCombi 0.2 109.5 + 4.9 cde 9.0 + 0.2 fg Trace
0.4 80.6 + 3.5 ghij 9.7 + 0.3 def Trace
VUltra 0.2 120.9 + 6.7 c 9.3 + 0.3 fg Trace
0.4 93.7 + 2.1 efg 9.6 + 0.3 def Trace
Fermaid E 0.2 138.9 + 19.6 ab 8.8 + 0.4 gh Trace
0.4 125.7 + 4.1 bc 9.7 + 0.5 def Trace
OptiWhite 0.2 118.0 + 13.2 cd 12.1 + 0.6 b Trace
0.4 102.6 + 11.5 def 10.7 + 0.2 c Trace
Each value shows the mean + standard deviation from three fermentation replicates.
Values displaying different letters within the same column are significantly different (p<0.05)
among treatment combinations according to the DMRT test.

175
Medium-chain fatty acids and related ethyl esters: As given in Table 4-33 and Table 4-34,
the three yeast strains developed significant differences of these volatile compounds in
response to nutrient addition. Strain EC1118 developed the greatest concentration of
hexanoic, octanoic and decanoic acids in the high VCombi sample (5.8 + 0.4, 4.9 + 0.6 and
0.37 + 0.07 mg L-1, respectively), followed by the high VUltra treatment (4.9 + 0.3, 4.0 + 0.3,
0.30 + 0.02 mg L-1, respectively) and the VCombi sample (4.7 + 0.1, 3.7 + 0.3, 0.30 + 0.14
mg L-1, respectively). It also produced the greatest amounts of HAEtE, OAEtE and DAEtE in
the high VCombi treatment (830.5 + 67.0, 1101.9 + 46.0 and 324.2 + 15.5 g L-1,
respectively) and followed by the high VUltra sample (633.8 + 65.4, 872.9 + 62.9, 268.6 +
14.3 g L-1, respectively). A high concentration of VCombi also promoted high formation of
OAEtE and DAEtE by the X5 strain (891.6 + 30.1 and 294.4 + 16.1 g L-1, respectively).
Overall, strain EC1118 seemed to be the highest producer of MCFAs and MCFA ethyl esters
in certain nutrient condition, while the VL3 strain was the lowest producer but this varied
depending on nutrient source and concentration.
Monoterpenes: The results show that three yeast strains liberated similar concentrations of
-terpineol ranging from 9.4 + 0.4 to 10.6 + 0.2 g L-1 (Figure 4-54). Linalool, trans-linalool
oxide and cis-linalool oxide were not detected in all YPF wines.
Figure 4-54 Concentration of -terpineol present in finished YPF wines developed by three
different yeast strains with four nutrient sources at two different concentrations
Vertical bars represent standard deviations from three fermentation replicates. Means
followed by the same letters on the top of the bar are not significantly different (p>0.05)
between treatment combinations according to the DMRT test.
9.4
a
9.6
a
9.7
a
10
.0 a
10
.2 a
10
.2 a
10
.3 a
10
.6 a
10
.1 a
10
.1 a
10
.3 a
10
.4 a
9.8
a
9.7
a
9.8
a
9.6
a
9.9
a
9.9
a 10
.5 a
9.6
a
10
.1 a
9.9
a
10
.6 a
10
.5 a
0
4
8
12
VCombi VUltra Fermaid E OptiWhite VCombi VUltra Fermaid E OptiWhite VCombi VUltra Fermaid E OptiWhite
EC1118 VL3 X5
Yeast strains
-T
erp
ine
ol (
g L
-1)
0.2 g L-1 0.4 g L-1

176
Table 4-33 Concentration of fatty acids present in finished YPF wines developed by three
different yeast strains with four nutrient sources at two different concentrations
Yeasts Nutrients Concentrations
(g L-1)
Hexanoic acid
(mg L-1)
Octanoic acid
(mg L-1)
Decanoic acid
(mg L-1)
EC1118 VCombi 0.2 4.7 + 0.1 b 3.7 + 0.3 bc 0.30 + 0.14 b
0.4 5.8 + 0.4 a 4.9 + 0.6 a 0.37 + 0.07 a
VUltra 0.2 4.2 + 0.4 cd 3.2 + 0.5 bcd 0.23 + 0.04 cd
0.4 4.9 + 0.3 b 4.0 + 0.3 b 0.30 + 0.02 b
Fermaid E 0.2 4.1 + 0.2 d 3.0 + 0.2 cde 0.20 + 0.01 de
0.4 4.5 + 0.3 bc 3.5 + 0.4 bc 0.27 + 0.02 bc
OptiWhite 0.2 3.3 + 0.1 e 2.2 + 0.2 fg 0.17 + 0.02 e
0.4 2.8 + 0.5 ef 1.7 + 0.5 gh 0.10 + 0.04 f
VL3 VCombi 0.2 3.2 + 0.2 e 1.9 + 0.2 fg 0.10 + 0.01 f
0.4 3.8 + 0.3 d 2.8 + 0.3 cde 0.20 + 0.02 de
VUltra 0.2 3.2 + 0.3 e 1.9 + 0.3 fg 0.10 + 0.01 f
0.4 3.8 + 0.3 d 2.6 + 0.3 def 0.20 + 0.01 de
Fermaid E 0.2 2.7 + 0.1 e 1.5 + 0.1 gh 0.10 + 0.01 f
0.4 3.0 + 0.1 e 1.8 + 0.2 fg 0.10 + 0.01 f
OptiWhite 0.2 2.5 + 0.2 f 1.3 + 0.1 h 0.10 + 0.01 f
0.4 2.4 + 0.1 f 1.3 + 0.0 h 0.10 + 0.01 f
X5 VCombi 0.2 3.7 + 0.1 d 2.6 + 0.2 def 0.10 + 0.01 f
0.4 4.5 + 0.2 cd 3.5 + 0.2 bcd 0.20 + 0.01 de
VUltra 0.2 3.2 + 0.2 e 2.1 + 0.3 fg 0.17 + 0.03 e
0.4 4.2 + 0.1 d 3.1 + 0.3 cde 0.20 + 0.02 de
Fermaid E 0.2 3.2 + 0.0 e 2.1 + 0.1 fg 0.17 + 0.01 e
0.4 3.6 + 0.1 d 2.4 + 0.1 efg 0.20 + 0.02 de
OptiWhite 0.2 2.8 + 0.1 e 1.6 + 0.1 fg 0.10 + 0.01 f
0.4 2.9 + 0.3 e 1.7 + 0.3 gh 0.10 + 0.02 f
Each value shows the mean + standard deviation from three fermentation replicates.
Values displaying different letters within the same column are significantly different (p<0.05)
among treatment combinations according to the DMRT test.

177
Table 4-34 Concentration of fatty acid ethyl esters present in finished YPF wines developed
by three different yeast strains with four nutrient sources at two different
concentrations
Yeasts Nutrients Concentrations
(g L-1
)
HAEtE
(g L-1
)
OAEtE
(g L-1
)
DAEtE
(g L-1
)
EC1118 VCombi 0.2 664.5 + 31.5 b 859.6 + 34.2 b 253.6 + 2.8 cd
0.4 830.5 + 67.0 a 1101.9 + 46.0 a 324.2 + 15.5 a
VUltra 0.2 519.9 + 91.1 de 684.6 + 115.2 de 201.2 + 31.1 efg
0.4 633.8 + 65.4 bc 872.9 + 62.9 b 268.6 + 14.3 bc
Fermaid E 0.2 502.8 + 42.0 e 634.6 + 23.8 ef 202.2 + 7.2 efg
0.4 577.1 + 47.0 cd 758.2 + 49.2 cd 234.3 + 9.1 de
OptiWhite 0.2 283.4 + 6.9 ghi 340.1 + 23.7 ij 111.6 + 11.6 jk
0.4 273.6 + 12.2 hi 343.7 + 25.7 ij 108.0 + 26.6 jk
VL3 VCombi 0.2 208.3 + 36.5 ijk 404.5 + 59.1 hi 130.2 + 20.3 ij
0.4 363.5 + 15.7 f 707.8 + 67.2 de 234.8 + 13.5 de
VUltra 0.2 221.0 + 67.9 ij 394.3 + 53.2 hi 131.1 + 31.2 ij
0.4 352.6 + 19.9 fg 669.4 + 22.7 de 204.0 + 5.6 efg
Fermaid E 0.2 146.8 + 22.8 jk 286.6 + 38.8 jk 96.6 + 10.3 kl
0.4 239.7 + 32.7 i 473.6 + 54.6 gh 135.2 + 8.4 ij
OptiWhite 0.2 71.7 + 17.2 l 133.9 + 34.6 lm 67.6 + 7.5 l
0.4 54.7 + 11.9 k 101.6 + 14.4 m 71.7 + 1.7 l
X5 VCombi 0.2 391.4 + 15.1 f 673.0 + 40.4 de 212.0 + 22.0 ef
0.4 497.9 + 24.7 e 891.6 + 30.1 b 294.4 + 16.1 ab
VUltra 0.2 323.6 + 36.2 fgh 555.5 + 40.6 fg 181.1 + 13.6 fgh
0.4 469.5 + 12.4 e 808.6 + 12.2 bc 254.4 + 3.9 cd
Fermaid E 0.2 280.4 + 34.7 ghi 455.6 +46.0 h 152.2 + 8.6 hi
0.4 330.0 + 56.0 fgh 641.2 + 52.0 ef 172.8 + 49.1 gh
OptiWhite 0.2 147.4 + 21.0 k 199.1 + 47.3 kl 106.1 + 16.8 jk
0.4 148.9 + 5.0 k 219.3 + 29.3 kl 84.3 + 12.9 kl
Each value shows the mean + standard deviation from three fermentation replicates.
Values displaying different letters within the same column are significantly different (p<0.05)
among treatment combinations according to the DMRT test.

178
4.4 Volatile thiols involved in varietal aromas of yellow passion fruit wines
The volatile thiols involved in varietal aromas detected in YPF wines were selected from the
trials described in the chapters of 4.3.3 and 4.3.4. These selected YPF wines had desirable
fermentation characteristics and wine derived fermentation aromas with low undesirable
metabolites. The volatile thiols detected in YPF wine obtained from chapter 4.3.3 are given in
Figure 4-55 to 4-56, while those detected in YPF wines obtained from chapter 4.3.4 are
shown in Figure 4-57.
Figure 4-55 shows that the 3-sulphanylhexanol (3SH) was identified in the prepared YPF
juice (498 ng L-1), while acetic acid 3-sulphanylhexyl ester (3SHA) was present in trace
quantities (data not shown). Commercial Saccharomyces yeast strains had a significant
impact on the production of 3SH and its ester (3SHA) in YPF wines. The commercial yeasts
released approximately 7.1-fold to 11.2-fold of 3SH from its precursor in YPF juice but its
concentrations depended on the yeast strain. At 0.5 g L-1 VCombi addition, strain EC1118
significantly appeared to be the most effective producer of 3SH and 3SHA in YPF wine
(5594.0 + 1060.5 and 502.1 + 84.8 ng L-1, respectively). The LittoLevure strain followed a
similar pattern of the high 3SH liberation (4802.7 + 163.0 ng L-1) as strain EC1118, but
showed less 3SHA production. Strain VL3 seemed to be the least efficient in 3SH aroma
release in the YPF wine.
The EC1118 strain with the addition of 0.25 g L-1 DAP produced the greatest concentration of
3SH and 3SHA in the YPF wines (8317.8 + 2384.1 and 470.3 + 194.2 ng L-1, respectively) as
demonstrated in Figure 4-56. The addition of 0.5 g L-1 VCombi also promoted strain EC1118
to produce the highest amount of both volatile thiols in the YPF wines (5594.0 + 1060.5 and
502.1 + 84.8 ng L-1, respectively). These volatile thiols seemed to be least obvious in the
YPF wine produced by strain X5 with the 0.25 g L-1 VCombi supplementation.

179
Figure 4-55 Concentration of 3SH and 3SHA detected in prepared YPF juice and finished
YPF wines produced by five different yeast strains with the addition of VCombi
at the high level
Vertical bars represent standard deviations from three fermentation replicates, except YPF
juice obtained from two sample replicates. Means followed by different letters on the top of
the bar are significantly different (p<0.05) among yeast strains according to the DMRT test.
498.0
5594.0 a
3526.9 cd
3822.8 bc
4358.9 bc4802.7 ab
0
2000
4000
6000
YPF juice EC1118 VL3 X5 Alchemy I LittoLevure
3S
H (n
g L
-1)
502.1 a
229.3 b 256.0 b
314.0 b
238.5 b
0
100
200
300
400
500
600
EC1118 VL3 X5 Alchemy I LittoLevure
3S
HA
(n
g L
-1)

180
Figure 4-56 Concentration of 3SH and 3SHA detected in YPF wines produced by two yeast
strains with the addition of two nutrient sources at two levels
Vertical bars represent standard deviations from three fermentation replicates. Means
followed by different letters on the top of the bar are significantly different (p<0.05) among
yeast strains according to the DMRT test.
The analysis of the prepared YPF juice for trial 3.9.4 clearly indicated that the 426 ng L-1 3SH
and trace amounts of 3SHA were present as well (data not shown). The Saccharomyces
yeast strains had significantly the greater impact on the liberation of 3SH in YPF wines than
the nutrient supplementations. The X5 strain liberated a higher concentration of 3SH in the
YPF wine with either VCombi or VUltra supplementation (5527.5 + 639.5 and 5206.1
+ 397.1 ng L-1, respectively) than strain EC1118. Both factors of the yeast strain and the
8317.8 a
4973.8 ab
4009.5 b
3516.9 b
4376.5 b
5594.0 a
4291.7 b
3822.8 b
0
2000
4000
6000
8000
10000
DAP VCombi DAP VCombi
EC1118 X5
3S
H (n
g L
-1)
0.25 g L-1
0.5 g L-1
470.3 a
278.4 b
187.8 bc
123.2 c
178.0 bc
502.1 a
199.8 bc
256.0 bc
0
200
400
600
DAP VCombi DAP VCombi
EC1118 X5
3S
HA
(n
g L
-1)
0.25 g L-1
0.5 g L-1

181
nutrient source had no influence on the 3SHA production ranging from 263.8 + 73.5 to 333.9
+ 47.5 ng L-1 (Figure 4-57). Nevertheless, 3SHA amounts in YPF wine tended to be higher in
the VCombi treatment.
Figure 4-57 Concentration of 3SH and 3SHA detected in finished YPF wines produced by
two different yeast strains with the addition of VCombi and VUltra at 0.4 g L-1
Vertical bars represent standard deviations from three fermentation replicates. Means
followed by different letters on the top of the bar are significantly different (p<0.05) among
treatment combinations, whereas those followed by the same letters on the top of the bar are
not significantly different (p>0.05) according to the DMRT test.
4130.0 c4379.5 bc
5527.5 a5206.1 ab
0
1000
2000
3000
4000
5000
6000
VCombi VUltra VCombi VUltra
EC1118 X5
3S
H (n
g L
-1)
333.9 a263.8 a
322.9 a 315.4 a
0
100
200
300
400
VCombi VUltra VCombi VUltra
EC1118 X5
3S
HA
(n
g L
-1)

182
5. DISCUSSION
This study is focused on the improvement of the fermentation characteristics, varietal and
important aromas in grape wines as well as in yellow passion fruit (YPF) wine by optimal
choice of commercial Saccharomyces yeast strains and nutrient supplementations; nutrient
sources/compositions and concentrations.
The obtained results from the investigated fermentation experiments of Scheurebe and
Sauvignon blanc grape wines (chapter 5.1 and 5.2) and YPF wines (chapter 5.3) are
discussed in the following chapters (see experimental outline for all fermentation trials in
Figure A-2).
5.1 Effects of commercial Saccharomyces yeast strains and nutrient supplements on
wine fermentative characteristics and quality of Scheurebe grape wines
The experimental discussions, which are given in the following chapters, comprise five
Scheurebe grape juice fermentation trials that investigated the effect of commercial
Saccharomyces yeast strains and nutrient supplementation; nutrient source/composition and
concentrations, on fermentation kinetics, some metabolic compounds and volatile
compounds of finished wines (chapter 5.1.1 to 5.1.2).
5.1.1 Effect of commercial Saccharomyces yeast strains and nutrient sources on
fermentative characteristics, metabolic compounds and wine aroma of Scheurebe
grape wines
Strain X5 had a longer fermentation time than strain EC1118 in the OptiWhite and control
fermentation, but the addition of Fermaid E reduced fermentation time (Figure 4-1).
Nevertheless, all treatments completed fermentation after 11-14 days with low residual sugar
less than 2 g L-1 (Figure 4-2). It has been reported that nutrient composition in complex
mixtures affects yeast growth rate and favours higher rates than single compounds. Thus,
mixtures of amino acids and vitamins give higher growth rates than the most preferred single
nitrogen sources (Henschke & Jiranek, 1993; Albers et al., 1996; ter Schure et al., 2000; da
Cruz et al., 2002; Beltran et al., 2004, 2005; Ribéreau-Gayon et al., 2006 a). It is linked to the
ability of yeast to directly incorporate amino acids into protein, thereby minimising the need to
maintain an energetically expensive amino acid synthetic capability (Bell & Henschke, 2005).
In addition, nitrogen metabolism is central to cell growth and regulates other pathways,
including sugar metabolism in yeast (Bell & Henschke, 2005; Ugliano et al., 2007).

183
Both yeast strain and nutrient source did not affect the formation of glycerol and
acetaldehyde (Figure 4-2 and 4-3), which were within the normal ranges of concentration in
wines at 4-15 g L-1 and 75-100 mg L-1, respectively (Rankine & Bridson, 1971; Schreier, 1979;
Ough & Amerine, 1988; Swiegers et al., 2005 a; Ribéreau-Gayon et al., 2006 b).
Strain EC1118 produced high amounts of acetic acid in the control and OptiWhite treatments,
while strain X5 formed high levels in the control and DAP fermentations (Table 4-1).
According to Bely et al. (2003), increasing nitrogen availability increases NADH production,
which in turn reduces the need of the yeast cell to produce acetic acid to control redox
balance. On the contrary, a high production of acetic acid by strain X5 in a high-nitrogen juice,
as DAP might be related at least in part to a redox balancing reaction in response to high
glycerol production, which generates a net deficit of NADH (Vilanova et al., 2007).
Nonetheless, its amounts in these wines were within the normal range at below 0.7 g L-1
(Corison et al., 1979; Ribéreau-Gayon et al., 2006 b). In addition, they did not undergo
malolactic fermentation (Ough & Amerine, 1988; Radler, 1993). Concentrations of the other
acids were similar among the treatment combinations and within the range of the reported
wine values above.
As shown in Figure 4-3, it is likely that nitrogen in grape juice, including control, was
sufficient for yeast metabolism of the two yeast strains as concentrations of SO2-binding
compounds in wines were less than 100 mg L-1 (Rankine, 1968 a, 1968 b; Radler, 1993;
Ribéreau-Gayon et al., 2006 a). In addition, the supplementation of Fermaid E, which
contains thiamine, significantly reduced both keto acids. In accordance with some studies,
thiamine effectively reduces keto acid concentrations by the enzymatic decarboxylation
(Delfini et al., 1980; Delfini & Vormica, 2001; Ribéreau-Gayon et al., 2006 a; Jackson, 2008).
Both yeast strain and nutrient source had no influence on the production of dimethyl sulphide
(Figure 4-4) and its levels in most wines were below the aroma threshold of 25 g L-1 (De
Mora et al., 1986; Rauhut, 1993; Mestres et al., 2000; Swiegers et al., 2005 a). Although the
X5 strain produced H2S in the final wine, its formation decreased with the addition of Fermaid
E, DAP and OptiWhite. In addition, its levels were below the threshold value (50-80 µg L-1),
which excluded the occurrence of an off-flavour of ―rotten egg‖ (Rauhut, 1996; Bell &
Henschke, 2005; Rauhut, 2009). In agreement with several studies, addition of nutrient
decreased the formation of H2S by yeast (Rauhut & Kürbel, 1994; Jiranek et al. 1995 a, 1995
b; Rauhut et al., 1995, 1997, 2000 a, 2000 b; Mendes-Ferreira et al., 2004, 2009).
The formation of higher alcohols, acetic acid esters, volatile fatty acids and their ethyl esters
produced by the two yeast strains varied depending on the nutrient sources. Strain EC1118
developed high amounts of 2-methyl propanol and 3-methyl butanol in most nutrient sources

184
(Table 4-2). This might reflect a less efficient usage of nitrogen, resulting in an increase of
carbon flux related to branched-chain amino acid metabolism by this strain (Eden et al., 2001;
Ribéreau-Gayon et al., 2006 a; Carrau et al., 2008). The relationship between higher alcohol
production and high nitrogen availability was in agreement with earlier studies (Oshita et al.,
1995; Hernandez-Orte et al., 2005; Vilanova et al., 2007). They suggested that at higher
yeast assimilable nitrogen, sufficient nitrogen is available for amino acid biosynthesis, which
reduces the surplus of α-keto acids and, hence, the higher alcohols produced. The formation
of the other higher alcohols was similar among the treatment combinations (Table 4-2 and
Figure 4-5). Interestingly, concentrations of these higher alcohols were below 300 mg L-1
that they are usually considered to contribute to a wine‘s aromatic complexity as previously
reported (Lambrechts & Pretorius, 2000; Clarke & Bakker, 2004; Francis & Newton, 2005;
Swiegers & Pretorius, 2005; Ribéreau-Gayon et al., 2006 b). In addition, levels of 2-phenyl
ethanol, which elicits floral and rose-like aromas, in most wines were above the aroma
threshold of 10 mg L-1 as reported in literatures above.
The EC1118 strain seemed to be a higher producer of most acetic acid esters, ethyl esters
and hexanoic acid ethyl ester (excluding succinic acid diethyl ester) than strain X5 with less
response to nutrient sources (Figure 4-5, 4-6 and Table 4-3, 4-4), while these volatile esters
produced by strain X5 were most evident in the Fermaid E variant. It has been shown that
the final concentration of acetic acid esters of higher alcohols is the result of the balance
between alcohol acyl transferase enzymes promoting acetic acid ester biosynthesis and
esterase enzymes promoting their hydrolysis (Mauricio et al., 1993; Fukuda et al., 1998;
Vianna & Ebeler, 2001). Increased nitrogen availability promotes the expression of the ATF1
and ATF2 genes, which encode the alcohol acyl transferase enzymes (Yoshimoto et al.,
2002). Some studies have also reported that the increase in ester formation is directly related
to a high nitrogen level (Rapp & Versini, 1991; Beltran et al., 2005; Hernández-Orte et al.,
2006 a). Miller et al. (2007) have suggested that when ammonium was added into the juice,
the amino acids were not used for cellular structures and growth but, rather, induced the
production of secondary metabolites like volatile esters. In addition, when Superstart was
added, high amounts of succinic acid diethyl ester were formed by the two yeast strains. Rosi
et al. (2008) have also revealed that organic nitrogen like inactive dry yeast promoted yeast
cells to develop high amounts of esters.
From a wine maker‘s view, the most important esters in wine are acetic acid ethyl ester,
acetic acid 2-phenyl ethyl ester, acetic acid 3-methylbutyl ester and ethyl esters of medium-
chain fatty acids (Guth, 1997 b; Francis & Newton, 2005; Ribéreau-Gayon et al., 2006 b;
Sumby et al., 2009). They play a major role in the fruity and floral aroma of young wines and
also positively influence the general quality of the wine. They were prominent in most

185
EC1118 wines as well as the X5 wine with Fermaid E addition and their levels were above
the thresholds as reported in literatures above. On the contrary, the concentrations of lactic
acid ethyl ester in most wines were below the threshold at 50-200 μg L-1, which imparts milk,
buttery and soapy aromas and mainly increases during malolactic fermentation.
These findings pointed out that the two yeast strains and nutrient sources did not affect the
concentrations of most monoterpenes; trans-linalool oxide, cis-linalool oxide, linalool and -
terpineol detected in wines (Figure 4-7). Their concentrations in the wine treatments were
below their aroma threshold that contributes to varietal aroma (Guth, 1997 b; Ribéreau-
Gayon et al., 2006 b; Sumby et al., 2009). Großmann et al. (1990) suggested that under
normal wine making conditions, endogenous -glycosidases have a limited effect on the
development of terpenes, because their activity reaches an optimum at pH 5 and the
clarification of juice can also inhibit their activity.
5.1.2 Effect of thirteen commercial Saccharomyces yeast strains on fermentative
characteristics, metabolic compounds and wine aroma of Scheurebe grape wines
The fermentations of fresh Scheurebe grape juices with thirteen commercial Saccharomyces
yeast strains; EC1118, Sauvignon, VL3, X5, X16, VIN13, Alchemy I, Alchemy II, 4F9, LVCB,
LittoLevure, AWRI R2 and QA23 had different fermentation kinetics and chemical
composition. As demonstrated in Figure 4-8 and 4-9, strains EC1118, VIN13 and AWRI R2
had the fastest fermentation kinetics and times with low residual sugar (below 2 g L-1) but
high glycerol levels. On the contrary, the Sauvignon, Alchemy I, 4F9, LVCB and LittoLevure
strains resulted in sluggish or stuck fermentations with high residual sugar (above 10 g L-1)
but low glycerol amounts. It is likely that they had extremely higher nutrient demands than
the other strains as the grape juice was not supplemented with any kind of nutrients,
although it had high initial nitrogen; 0.09 g L-1 ammonium, 194 mg L-1 free amino nitrogen (as
shown in 3.7.2) and 1314.6 mg L-1 total amino acid content without proline (Table A-1). It
was exceptional for the Alchemy II and QA23 strains that they had sluggish and long
fermentation durations, but finished fermentations with low residual sugar. A sluggish or
stuck fermentation can be due to nitrogen deficiency, thiamine depletion of the must, CO2
and ethanol production (Bely et al., 1990; Bisson, 1999, 2000; Julien et al., 2000; Blateyron &
Sablayrolles, 2001). In addition, a low or lack initial level of nitrogen acts by limiting growth
rate and biomass formation of yeast which may result in a low rate of sugar catabolism and
decrease in sugar transport activity by yeast (Salmon, 1989; Bely et al., 1991; Monteiro &
Bisson, 1991; Salmon, 1996; Alexandre & Charpentier, 1998; Colombié et al., 2005).
Although the yeast strain strongly influenced the glycerol production under controlled
conditions as reported in several studies (Radler & Schütz, 1982; Scanes et al., 1998;

186
Antonelli et al., 1999; Remize et al., 1999, 2001; Reynolds et al., 2001; Erasmus et al., 2004),
its concentrations were within the concentrations reported for the wine.
Fermentations with strain EC1118 resulted in the highest amounts of lactic acid and keto
acids but the lowest acetic acid and acetaldehyde productions, whereas citric acid was
higher in the VL3 and QA23 wines (Table 4-5 and Figure 4-10). Strains VL3, X5, X16, 4F9,
LVCB and LittoLevure were the highest -ketoglutarate and acetaldehyde producers, while
strain Sauvignon was the highest producer of acetaldehyde, H2S and CS2 (Figure 4-11). It is
worth noting that the strains with fast fermentation kinetics and high sugar consumption
produced the lowest volatile acidity, H2S and acetaldehyde.
It appears that the ability of a yeast strain to produce H2S is genetically caused as H2S
production by different wine yeast strains varies under similar conditions (Thornton & Bunker,
1989; Henschke & Jiranek, 1993; Jiranek et al., 1995 b; Spiropoulos et al., 2000). Berry &
Watson (1987) proposed that yeasts with low vitality such as in other sluggish or stuck
fermentations can tend to autolyse faster and release consequently H2S (Henschke &
Jiranek, 1993). In addition, the ability of yeast strains to produce acetaldehyde is depending
on the activity of the enzyme involved in its synthesis like alcohol dehydrogenase (Vannini et
al., 1994; Pérez-Coello et al., 1999; Marks et al., 2003). Nevertheless, it could be confirmed
that the wine samples had neither malolactic fermentation nor the detectable spoilage of
vinegar-like odour and the off-flavour of rotten egg (see reported literatures in 5.1.1). These
compounds had no impact on the quality of the final wines and ranged within the usual
values in wines.
The use of Saccharomyces yeast strains during fermentation considerably contributes to
variations in the production of volatile compounds (Antonelli et al., 1999; Pérez-Coello et al.,
1999; Herjavec et al., 2003; Plata et al., 2003; Romano et al., 2003; Swiegers et al., 2005 a;
Regodón Mateos et al., 2006; Miller et al., 2007; Jackson, 2008). The greatest producer of
higher alcohol and ethyl ester (excluding isobutanoic acid ethyl ester) was strain EC1118
(Table 4-6, 4-7 and Figure 4-12). Strains QA23, VL3 and X16 also produced similar high
amounts of 2-phenyl ethanol (floral and rose-like aromas) at a level above the aroma
threshold (Clarke & Bakker, 2004; Francis & Newton, 2005; Swiegers et al., 2005 a;
Bartowsky & Pretorius, 2009; Sumby et al., 2009). The levels of hexanol were similar among
the thirteen yeast strains. This was supported by Bell & Henschke (2005) who reviewed that
hexanol is formed from a must-derived precursor, probably hexanal, during must processing,
since yeast are not able to synthesize it. At low concentration below 300 mg L-1, higher
alcohols are considered desirable (see previous literatures in 5.1.1). Interestingly,
concentrations of ethyl and diethyl esters in the final wines were above their aroma
thresholds, which elicit pleasant floral and fruity aroma as reported in literatures above.

187
The synthesis of acetic acid esters by S. cerevisiae yeasts during the fermentation of wine
involves the activity of at least three acetyltransferases, namely; alcohol acetyltransferase,
ethanol acetyltransferase and isoamyl alcohol acetyltransferase (Fukuda et al., 1998; Lilly et
al, 2000). As seen in Figure 4-12 and 4-13, the most acetic acid ester producer was strain
VIN13, excluding acetic acid ethyl ester, followed by strains EC1118 and AWRI R2. It is likely
to have a correlation between high formations of acetic acid esters and fast fermentation
kinetics and time (Figure 4-8). In accordance with previous studies, the higher levels of 2-
phenyl ethanol seemed to determine the greater production of acetic acid 2-phenyl ethyl
ester (Nykänen, 1986; Antonelli et al., 1999; Herjavec et al., 2003; Vilanova et al., 2007).
These wines might impart intensive banana aroma as the levels of acetic acid 3-methylbutyl
ester were above the aroma threshold at 40 g L-1 (see reported literatures in 5.1.1). The
concentrations of the other acetic acid esters were within the normal values detected in wine.
The highest formations of MCFAs and their ethyl esters by strains Alchemy I and II, 4F9,
LVCB and LittoLevure (Table 4-8) seemed to be responsible for their sluggish or stuck
fermentation (Figure 4-8). In fact, it was found that MCFAs and their ethyl esters including
ethanol might inhibit the growth of yeast (Ravaglia & Delfini, 1993; Ribéreau-Gayon et al.,
2006 b). In addition, the high concentrations of MCFAs might be the cause of a greater
formation of their corresponding ethyl esters, which is in accordance with earlier studies
(Antonelli et al., 1999; Hernández-Orte et al., 2006 a; Vilanova et al., 2007). Saerens et al.
(2006) have suggested that the regulatory mechanisms might be active at the level of MCFA
biosynthesis rather than esterification, but it is also strongly depending on the yeast strains.
Differences in expression of the ethyl ester synthetic genes EHT1 and EEB1 or regulation of
the balance between their ester synthetic and esterase activities could be involved.
Nevertheless, high levels of MCFA ethyl esters detected in most wines may be responsible
for pleasant fruity and floral aromas (see reported literatures in 5.1.1).
Some differences existed between the yeast strains in terms of linalool (rose, lavender and
camphorous aromas) liberation. It is likely that strains X5, VIN13, VL3 and Alchemy I were
the greatest linalool releasing strains, while most yeast strains had a similar ability to release
-terpineol, trans- and cis-linalool oxide (Figure 4-14). Interestingly, the concentration of
linalool in most wines might contribute to typical varietal aroma at the perception threshold of
15-50 g L-1 as reported in previous literatures in 5.1.1. In agreement with several authors,
some strains of S. cerevisiae posess -glycosidase activity that can release monoterpenes
from glycoconjugate forms during alcoholic fermentation (Hock et al., 1984; Günata et al.,
1985; Delcroix et al., 1994; Hernández et al., 2003; Carrau et al., 2005; Swiegers & Pretorius,
2005; Ugliano et al., 2006; Loscos et al., 2007).

188
5.2 Effects of yeast strains and/or nutrient supplements on wine fermentation and
quality of Sauvignon blanc grape wines
In the following chapters, the obtained results of two fermentation trials of Sauvignon blanc
grape juice are discussed. The improvement of fermentation characteristics, metabolic
products and volatile compounds of Sauvignon blanc wine fermentation by optimal choices of
commercial Saccharomyces yeast strains and nutrient supplementation; nutrient source and
concentration, are reported in section 5.2.1 to 5.2.2.
5.2.1 Effect of nine commercial Saccharomyces yeast strains and two nutrient sources
on fermentative characteristics, metabolic compounds and wine aroma of Sauvignon
blanc grape wines
The fermentation kinetics differed among the nine commercial yeast strains without any
response to the two nutrient supplementations (Figure 4-15). Strains AWRI R2, X5, VIN13,
VL3, EC1118 and LVCB had fast fermentation kinetics and durations, whereas strains
Sauvignon and VIN7 had inverse behaviours with less response to the nutrient source.
Nonetheless, all fermentations completely finished with similar amounts of low residual sugar
(below 1 g L-1) and glycerol (Figure 4-16), which were within the range of levels normally
reported in wines (see previous literatures in 5.1.1). It has been established that strain VIN7
usually has slow-acting fermentation kinetics, which might be related to its hybrid nature
(Erasmus et al., 2004; King et al., 2008). Nevertheless, supplementation with Fermaid E
slightly enhanced faster fermentation kinetics than OptiWhite. It might be due to the fact that
Fermaid E contains certain nutrient sources, sufficient vitamins and growth factors for cell
growth and metabolism as discussed before in 5.1.1.
Some differences existed between the treatment combinations in terms of production and/or
utilization of organic acids (Table 4-9). The addition of Fermaid E seemed to reduce acetic
acid formation, except for strain VIN7. This might be due to the fact that this nutrient source
provided high nutrient availability, and consequently increased NADH production, which in
turn reduced the need of the yeast cell to produce acetic acid to control redox balance as
suggested by Vilanova et al. (2007). Although strain VIN7 produced the highest amounts of
acetic acid, its final wine had no detectable spoilage of vinegar-like odour (Corison et al.,
1979; Ribéreau-Gayon et al., 2006 b). In addition, most wines did not undergo malolactic
fermentation as well as low concentrations of the other acids had less impact on the quality
of the final wines as discussed in 5.1.1.

189
It is worth noting that the nine yeast strains showed similar formations of acetaldehyde in
both nitrogen sources at the levels below the sensory threshold value as previously reported
in literatures in 5.1.1. The high formation of -ketoglutarate by strains Sauvignon and X5 as
well as pyruvate by strain VIN7 significantly diminished by the addition of Fermaid E (Figure
4-17). As discussed in 5.1.1, it might be due to the fact that Fermaid E contains thiamine,
which is reported to effectively reduce the keto acid formation by decarboxylation. On the
contrary, this nutrient addition tended to result in high levels of CS2 and dimethyl disulphide
in the detected wines (Figure 4-18). Nonetheless, the concentrations of these compounds
detected in all wine samples had no influence on the quality and undesirable sulphur aroma
(see reported literatures in Table 2.5 and 5.1.1). In addition, these findings indicated that
strains EC1118, 4F9 and AWRI R2 did not produce detectable CS2 and DMDS.
It is worth noting that the nine yeast strains showed similar formations of all higher alcohols,
acetic acid esters, ethyl ester of butanoic acid and lactic acid, all MCFAs and hexanoic acid
ethyl ester in either the Fermaid E or OptiWhite treatment (Table 4-10, 4-11, 4-12 and
Figure 4-19, 4-20). Besides, the most important aromatic higher alcohol is 2-phenyl ethanol,
which has a floral fragrance and rose-like aroma (see previous literatures in 5.1.1). Its
concentrations in most wines were above the aroma threshold at 10 mg L-1, while low
formation of the other higher alcohols may impart desirable fruity aroma and aromatic
complexity. Although the esters were directly derived from the corresponding higher alcohol
through condensation with acetyl-CoA (Bell & Henschke, 2005; Vilanova et al., 2007), the
production of acetic acid esters in this trial differed from the higher alcohols in response to
nitrogen supplementation (Table 4-10 and Figure 4-19).
The result revealed that acetic acid ester production was slightly higher with the addition of
Fermaid E rather than OptiWhite for most yeast strains. This might be due to the fact that
Fermaid E provides higher nutrient availability that consequently stimulates the formation of
the alcohol acyl transferase enzymes promoting acetic acid ester biosynthesis as discussed
before in 5.1.1. A high concentration of most acetic acid esters in both nutrient sources was
produced by strain Sauvignon only. This might be related to the distinctive capacity of the
yeast to assimilate nitrogen and nitrogen sources. The yeasts with greater demand for
nitrogen produce higher concentrations of esters during the fermentation (Perez-Coello et al.,
1999; Torrea et al., 2003; Hernandez-Orte et al., 2005). It is likely that slow fermentation
kinetics and time for strain Sauvignon (Figure 4-15) showed its higher nutrient demand and
resulted in higher production of acetic acid esters in final wines. This finding demonstrated
that only concentrations of acetic acid 3-methylbutyl ester (banana aroma) were beyond the
aroma threshold (see reported literatures in 5.1.1).

190
It should be emphasized that the addition of Fermaid E promoted the formation of ethyl ester
of propionic acid, octanoic acid and decanoic acid (Table 4-11 and Figure 4-20). As
discussed in 5.1.1, the increase in volatile ester formation is directly related to nitrogen
availability and DAP addition at high level. On the other hand, the presence of OptiWhite
seemed to increase the formation of isobutanoic acid ethyl ester and succinic acid diethyl
ester, particularly by strains EC1118 and AWRI R2, respectively. Some observations
reported similar results that concentrations of branched chain esters decrease with an
increased DAP addition (Ugliano et al., 2007). Rosi et al. (2008) also observed that addition
of organic nitrogen (yeast extract) stimulated yeast cells to produce high amounts of ethyl
ester. Interestingly, high levels of these esters detected in the wine samples may contribute
to the wine flavour of pleasant fruity and floral aroma (see reported literatures in 5.1.1).
Most yeast strains had a similar capability to liberate small amounts of -terpineol in both
nutrient sources (Table 4-11) and its concentrations were quite below the aroma threshold at
400 μg L-1 as previously reported in literatures (Table 2-4). In addition, trans-linalool oxide,
cis-linalool oxide and linalool, were detected only in trace quantities (data not shown).
Großmann et al. (1990) and Swiegers et al. (2005 a) have suggested that under normal
wine making conditions, endogenous -glycosidases from the yeast have a limited effect on
the development of the juice varietal aroma as discussed before in 5.1.1.
5.2.2 Impact of five commercial yeast strains and four nutrient sources on
fermentative characteristics, metabolic compounds and wine aromas of Sauvignon
blanc grape wines
Fermentations of fresh juice with five yeast strains (EC1118, X5, VIN7, Alchemy I and
LittoLevure) exhibited some significant differences of fermentation characteristics depending
on the nutrient sources (Superstart, Fermaid O, Fermaid E and VUltra).
Strains EC1118 and Alchemy I were rather not influenced by the nitrogen source with fast
fermentation kinetics and times (Figure 4-21). They completely finished fermentations with
low residual sugar below 3 g L-1 (Table 4-13). In contrast, strains X5, LittoLevure and VIN7
were more influenced by the nitrogen source, which resulted in sluggish fermentations in the
Fermaid E and Fermaid O variants. They afterwards finished fermentations with slightly high
residual sugar (3.8-7.4 g L-1). Nevertheless, Superstart seemed to be the most effective
nutrient as it accelerated fermentation kinetics and time for all yeast strains. It has been
suggested that PUFAs (polyunsaturated fatty acids) from inactive dry yeasts (IDY) can act as
protective agents reducing the osmotic shock of active dry yeasts (ADY) because of the high
sugar content of juices and helping yeasts to adapt their metabolism to the new conditions

191
(Caridi et al., 1999; Caridi, 2002). Recently, Soubeyrand et al. (2005) showed that IDY could
release fragments of yeast cell walls that can form micelle-like particles, which consequently
repair damaged cellular membranes of the yeast and are therefore able to increase the
fermentation rate. On the other hand, the addition of Fermaid O and Fermaid E gave an
inverse response, they retarded fermentation kinetics for strains X5, VIN7 and LittoLevure. It
seemed to reflect their specific behaviour towards nitrogen source and consumption. In
addition, the use of ammonium salts to increase the nitrogen content of grape must induced
a repression of amino acid consumption by the yeasts and could reduce the fermentation
efficiency, but this was strain-dependent (Bely et al., 1990; ter Shure et al, 2000; Beltran et
al., 2005). The metabolism of nitrogen through the nitrogen transporter permeases, encoding
GAP1 (the transport of amino acids) and MEP2 (the transport of ammonium), was repressed
in a nitrogen-rich medium by the nitrogen catabolite repression (NCR) mechanism.
The glycerol and citric acid were not influenced by both yeast strain and nutrient source
under the conditions of this trial (Table 4-13 and 4-14). There were some differences
between the variants in the production and/or utilization of the other organic acids.
Nevertheless, their levels in the wines were within the usual values in wine (see reported
literatures in 5.1.1). All treatments had no malolactic fermentation because of low lactic acid
levels. It was exceptional for strain VIN7 that produced excess amounts of acetic acid above
the detectable spoilage level of vinegar-like character, particularly in the Superstart variant.
Addition of Superstart resulted in a high formation of -ketoglutarate and pyruvate but a low
level of acetaldehyde for most yeast strains (Figure 4-22). Pozo-Bayón et al. (2009 a, 2009 b)
have demonstrated that most IDY products provide amino acids, particularly glutamic acid.
When glutamic acid is supplied as the sole major source of nitrogen, the -amino group is
mobilised in transamination reactions resulting in the high production of keto acids (Albers et
al., 1996). This is shown in Figure 2-2. The addition of Fermaid O, VUltra and Fermaid E
nonetheless diminished the formation of both keto acids. It might be due to the fact that
Fermaid E and VUltra contain thiamine, which effectively decrease keto acids as discussed
before in 5.1.1. There was a positive correlation between high levels of SO2 and a high
formation of acetaldehyde (Figure 4-22 and 4-23). It was demonstrated that additional
acetaldehyde is liberated in the presence of excessive quantities of sulphur dioxide in
fermentation juices (Rankine & Pocock, 1969; Bell & Henschke, 2005; Ribéreau-Gayon et al.,
2006 a). Nevertheless, the concentrations of these compounds detected in all treatments had
no impact on the quality and stability of the final wines (see reported literatures in 5.1.1).
The addition of Fermaid E and VUltra into the juice resulted in the highest formation of SO2
and CS2 by strain EC1118, while H2S and dimethyl sulphide formations were similar among
treatments (Figure 4-23 and 4-24). Sulphite formation by Saccharomyces yeasts is

192
influenced by the nutrient composition of the grape juice and by the content of sulphate
(Rauhut, 2009). Strain X5 produced exceptionally high amounts of SO2 in most nutrient
conditions. It might possibly reflect the specific SO2-forming yeast of this strain. A high
formation of sulphite can be caused by defects in sulphate uptake and reduction (Figure 2-8).
It could be demonstrated that in high-sulphite-producing strains sulphate-permease is not
suppressed by methionine (Henschke & Jiranek, 1991; Rauhut, 1993; Jiranek et al. 1995 a,
1995 b; Pretorius, 2000; Rauhut, 2009). Nonetheless, levels of these sulphur compounds
were not the cause of undesirable aromas in the final wines (see literatures in Table 2-5).
The production of higher alcohols was similar for most strains, which produced high amounts
in the Superstart treatment but decreased with the addition of Fermaid E and VUltra (Figure
4-25). It is likely that Superstart provided less nitrogen availability and vitamin than the other
nutrient sources. Surplus of α-keto acids, mainly synthesised from sugars, is consequently
excreted as higher alcohols because of the shortage of α-amino nitrogen required for the
transamination step of amino acid biosynthesis (Gutierrez, 1993; Oshita et al., 1995; Wang et
al., 2003; Betran et al., 2005; Vilanova et al., 2007; Carrau et al., 2008). It was exceptional
for the high production of individual higher alcohols by strains EC1118, Alchemy I and
LittoLevure in most nutrient sources. It might nonetheless reflect a less efficient usage of
nitrogen, which resulted in an increase of carbon flux related to branched-chain amino acid
metabolism and carbon metabolic wastes including higher alcohols (Ribereau-Gayon et al.,
2006 a; Carrau et al., 2008). The 2-phenyl ethanol, which is the most important higher
alcohol, was obvious in the EC1118 wines and the VIN7 wines with the Superstart treatment
at the levels above its aroma threshold. While levels of the other higher alcohols were below
an undesirable level at 300 mg L-1 (see reported literatures in 5.1.1).
Strain Alchemy I was the predominant producer of most acetic acid esters with less response
to the nutrient source, except for acetic acid 2-phenyl ethyl ester (Figure 4-26). Strain VIN7
followed similar pattern in respect to acetic acid ethyl ester. The formation of acetic acid
esters tended to increase with Superstart treatment, but decreased with Fermaid E and
VUltra addition. It was suggested that polyunsaturated fatty acids from IDY like Superstart
can act as protective agents reducing the stress of the yeasts and helping yeasts to adapt
their metabolism to the new conditions (Caridi et al., 1999; Caridi, 2002; Soubeyrand et al.,
2005). Thus, it might enhance yeast activity and metabolism to produce high levels of
secondary metabolites as acetic acid esters. It is likely that the higher acetic acid ethyl ester
production can be determined by the greater amount of acetic acid formed. Nevertheless,
excessive levels of this ester produced by strains EC1118, Alchemy I and VIN7 were above
the threshold of a positive impact (less than 160 mg L-1), thus it might lead to an unpleasant
volatile acidity, pungent and nail polish aromas (see reported literatures in 5.1.1).

193
The EC1118 strain tended to be the most producer of ethyl ester of propionic acid and
butanoic acid, MCFAs and their ethyl esters with less response to the nutrient source (Table
4-15, 4-16 and Figure 4-27). Strain Alchemy I followed similar pattern in respect to propionic
acid ethyl ester production, while strain X5 produced high amounts of MCFAs and their ethyl
esters. It seemed that there is a correlation between the high formation of these MCFAs and
ethyl esters and the fast fermentation kinetics of the two strains above (Figure 4-21). The
higher metabolic activities might also regulate the metabolic pathways of ester formations as
suggested by some authors (Henschke & Jiranek, 1993; Albers et al., 1996; Wang et al.,
2003; Hernández-Orte et al., 2005, 2006 a, 2006 b; Miller et al., 2007). The effect of Fermaid
E on a high formation of ethyl ester of isobutanoic acid and lactic acid by strains Alchemy I
and LittoLevure was consistent according to some studies (Hernández-Orte et al., 2005;
Miller et al., 2007; Rosi et al., 2008) and previously discussed before in 5.2.1. The addition of
Fermaid O also promoted strains Alchemy I and LittoLevure to develop high amounts of
these esters. Raynal et al. (2009) have reported that Fermaid O released 100 % of amino
acids to the fermentation juice. As amino acids are precursors of some esters, they might
increase the level of ethyl esters (Nykänen, 1986; Hernández-Orte et al., 2005, 2006 b; Miller
et al., 2007).
The results also demonstrated that the rate of conversion of MCFAs into their corresponding
ethyl esters is strongly dependent on the yeast strain. Differences in expression of the ethyl
ester synthetic genes EHT1 and EEB1 or regulation of the balance between their ester
synthetic and esterase activities could be involved (Hernández-Orte et al., 2005, 2006 a;
Saerens et al., 2006; Vilanova et al., 2007). Interestingly, concentrations of ethyl esters of
butanoic acid and MCFAs detected in the wines were above their aroma thresholds, which
contribute to floral and fruity aromas as previously reported in literatures in 5.1.1.
In general, the final wines of this Sauvignon blanc trial showed small amounts of
monoterpene precursors, as most monoterpenes, e.g. -terpineol, trans-linalool oxide, cis-
linalool oxide and linalool were not detected.
5.3 Effects of yeast strains and nutrient supplements on wine fermentation and quality
of yellow passion fruit wines
The following chapters are the outcome of four fermentation trials of yellow passion fruit juice.
The effects of commercial Saccharomyces yeast strains and/or nutrient sources at different
concentrations on the fermentation characteristics, metabolite by-products and volatile
compounds of each fermentation trial are discussed in chapter 5.3.1 to 5.3.4.

194
5.3.1 Effect of fourteen commercial Saccharomyces yeast strains on fermentative
characteristics, metabolic compounds and aromas of yellow passion fruit wines
Fourteen strains of commercial Saccharomyces yeasts (EC1118, AWRI R2, LittoLevure,
QA23, Freddo, Sauvignon, VL3, X5, X16, VIN13, 4F9, LVCB, Alchemy I and II) were
examined with regard to their impacts on the fermentation characteristics and formation of
metabolic compounds of obtained yellow passion fruit (YPF) wines. The results showed that
the QA23 strain had a similar fast fermentation kinetic and time as the LVCB and VIN13
strains (Figure 4-28) and was the lowest pyruvate, α-ketoglutarate and glycerol producer as
well (Figure 4-29 and 4-30). In contrast, strains VL3, X16, LittoLevure, Sauvignon and AWRI
R2 had slow and sluggish fermentations. However, all YPF fermentations completely finished
with low residual sugar at less than 2 g L-1 (Figure 4-29). Commercial yeast strains have
very different nitrogen demands, and consequently affect the fermentation kinetics and
characteristics as reported in some studies (Julien et al., 2000; Pretorius, 2000; Blateyron &
Sablayrolles, 2001; Colombié et al., 2005; Beltran et al., 2005) and previously discussed in
5.1.2. In addition, a sluggish fermentation can be due to nitrogen deficiency, thiamine
depletion of the must, CO2 and ethanol toxicity (see reported literatures in 5.2.1). A slow and
sluggish fermentation seemed to determine the greater formation of glycerol in YPF wines,
as found in the X16, AWRI R2 and LittoLevure YPF wines (Figure 4-29). Several authors
have suggested that the two most important functions of glycerol synthesis in yeast are
related to redox balancing and the hyperosmotic stress response that its formation is
increased during osmotic stress (Scanes et al., 1998; Swiegers et al., 2005 a; Ribéreau-
Gayon et al., 2006 a; Vilanova et al., 2007). Glycerol concentrations in these YPF wines
were nonetheless similar to the normal grape wine value (see previous literatures in 5.2.1).
Some differences existed between the treatment combinations in terms of production and/or
utilization of organic acids (Table 4-17). Although the Alchemy I, II and AWRI R2 strains
produced high amounts of acetic acid, their finished YPF wines had no detectable spoilage of
vinegar-like odour (see previous literatures in 5.2.1). In addition, most YPF wines did not
undergo malolactic fermentation because of no detectable lactic acid. It is worth noting that
the occurrence of large amounts of citric acid in YPF wines originates from the natural YPF
juice itself (see reported data in 3.9.1), which was previously reported in the fruit juice
fermentation by Jitjaroen (2007) and Srisamatthakarn et al. (2010).
The overproduction of -ketoglutarate and pyruvate by strains Sauvignon and X16 might be
related to their slow fermentation kinetics and higher nutrient demand (Figure 4-28 and 4-30).
Some authors have reviewed that when nitrogen is adequate keto acids typically accumulate
in wine to less than 50-100 mg L-1, when nitrogen is limited, more than 100 mg L-1 can be

195
produced by yeasts (Rankine, 1968 b; Radler, 1993; Hernández-Orte et al., 2005). On the
contrary, strains 4F9 and Freddo that had fast fermentation kinetics also developed high
amounts of these keto acids. The reason for this could be an extreme deficiency of vitamins
in the YPF juice like thiamine and pantothenic acid (Delfini et al., 1980; Bataillon et al., 1996;
Ribéreau-Gayon et al., 2006 a). In addition, excessive levels of these keto acids might affect
the stability and quality of YPF wines (see reported literatures in 5.1.1).
There was an inverse correlation between a high acetic acid and a low acetaldehyde
formation by the EC1118, 4F9 and QA23 strains (Table 4-17 and Figure 4-30). It has been
reported that acetaldehyde can be converted to ethanol and acetic acid through alcohol
dehydrogenase enzymes (Pronk et al., 1996; Marks et al., 2003). In addition, the ability of
yeast strains to produce acetaldehyde is depending on the activity of the enzyme, alcohol
dehydrogenase, involved in its synthesis (Pérez-Coello et al., 1999; Remize et al., 1999;
Cheraiti et al., 2005; Regodón Mateos et al., 2006). Nonetheless, its levels in all YPF wines
were within the reported wine values and it did neither contribute to the green, bruised apple
and nutty flavours nor led to a wine oxidation (see previous literatures in 5.1.1).
A low level of carbon disulphide in the QA23, X5, 4F9, EC1118 strains might be related to
their fast fermentation kinetics (Figure 4-28), while the LittoLevure strain had an inverse
behaviour and high amounts (Figure 4-31). It is likely that a slow and sluggish fermentation
of strain LittoLevure may lead to a high formation of MeSAc. As discussed before in 5.1.2,
yeasts with a low vitality such as in sluggish fermentations can tend to autolyse faster, and
consequently lead to the formation of several sulphur compounds (Berry & Watson, 1987;
Henschke & Jiranek, 1993). On the other hand, strain VIN13 also developed high amounts of
MeSAc, although it had a fast growth kinetic, thus some specific genes might be involved.
Interestingly, MeSAc was not detected in the YPF wines fermented with strains EC1118,
Sauvignon, VL3, X5, Alchemy I, 4F9, QA23 and Freddo. The concentration of these
compounds in the YPF wines had no impact on the sulphurous off-flavour (see reported
literatures in Table 2-5).
As discussed in the previous trial (5.1.2), the use of different yeast strains during
fermentation contributed considerably to variations in individual volatile compound formations.
It seemed that high productions of higher alcohols by strains LittoLevure, AWRI R2, X16 and
Sauvignon were related to the slow fermentation kinetics (Figure 4-28 and 4-32). On the
other hand, it can be suggested that the high formation of 2-phenyl ethanol and 2-methyl
butanol by strains QA23 and VIN13, which had fast fermentation kinetics, might reflect a less
efficient usage of nitrogen. Thus, it resulted in an increase of carbon flux related to branched-
chain amino acid metabolism and carbon metabolic wastes including higher alcohols

196
(Vilanova et al., 2007; Carrau et al., 2008). Nevertheless, concentrations of these higher
alcohols in YPF wines might be considered as desirable flavours as their levels were below
300 mg L-1 (see reported literatures in 5.1.1). In addition, the LittoLevure, QA23 and VIN13
YPF wines may impart floral and rose aromas because of high levels of 2-phenyl ethanol.
The LittoLevure strain followed by strains QA23, VIN13, X16 and LVCB was the most
predominant producer of acetic acid esters in the YPF wines (Figure 4-33). The acetic acid
ethyl ester is present as relative peak area due to the low detected amounts in the YPF
wines. It is likely that the higher amounts of higher alcohols were responsible for the greater
formation of corresponding acetic acid esters as discussed before in the Scheurebe grape
wine trial (5.1.2). The concentrations of only acetic acid 3-methylbutyl ester in the YPF wines
were quite above the aroma threshold (banana and fruity aromas) as reported in literatures in
5.1.1.
There was a relationship between the high formation of ethyl ester of lactic and isobutanoic
acid by strains X16, Sauvignon and AWRI R2 (Figure 4-34) and their slow fermentation
kinetics (Figure 4-28) as well as their distinctive capacities to assimilate nitrogen. It has been
suggested that the yeasts with greater demand for nitrogen/nutrients produced higher levels
of esters during fermentation (Perez-Coello et al., 1999; Torrea et al., 2003). On the other
hand, strains QA23, Freddo and LVCB developed high amounts of butanoic acid ethyl ester,
MCFAs and their esters (Table 4-18 and Figure 4-34, 4-36), while strains X5 and EC1118
produced high levels of propionic acid ethyl ester, but they had fast fermentation kinetics.
The higher metabolic activities of yeasts may also regulate the metabolic pathways of ethyl
ester formations as suggested by some studies (Albers et al., 1996; Hernández-Orte et al.,
2005, 2006 a, 2006 b; Miller et al., 2007). In addition, the level of MCFA biosynthesis
seemed to be responsible for the formation of related ethyl esters in the YPF wines as
discussed in previous trials of grape wines (5.1 and 5.2). The concentrations of most ethyl
esters detected in YPF wines, except for propionic acid ethyl ester, may impart the fruity and
floral aromas (see previous literatures in 5.1.1) but levels of MCFAs (soapy and rancid
odours) were far away from their thresholds.
This finding showed that most yeast strains had a similar ability to liberate -terpineol
(Figure 4-35). The linalool was most evident in the QA23, Alchemy I and II and 4F9 YPF
wines. It seemed that the higher metabolic activities of these yeast strains, which had the
faster fermentation kinetics, stimulated the greater release of linalool. Nonetheless,
concentrations of these monoterpenes were quite below their perception thresholds as
reported in the literatures (Table 2-4).

197
5.3.2 Effect of three commercial Saccharomyces yeast strains and five different
commercial nutrient sources on growth kinetics, fermentative characteristics,
metabolic compounds and aromas of yellow passion fruit wines
The YPF juice fermentations with three yeast strains (EC1118, Sauvignon and X5) showed
some significant differences on the fermentation kinetics, metabolic and volatile compounds
depending on the nutrient sources (DAP, VCombi, VUltra, Fermaid E and OptiWhite).
Addition of any source of nutrient, except OptiWhite, into YPF juices seemed to be effective
to enhance the fermentation kinetics of most strains, except for strain Sauvignon (Figure 4-
37). Nevertheless, all YPF fermentations completely finished with low residual sugar (less
than 2 g L-1) and similar amounts of glycerol (Table 4-19). The effect of OptiWhite, which is
an inactive dry yeast, might be due to the fact that it provides less nitrogen availability to the
YPF juice. On the contrary, when a nutrient containing DAP was added to the YPF juice,
resulting in an increase of ammonium nitrogen, Saccharomyces yeasts were possibly able to
transport ammonium ions across the plasma membrane more easily than another nitrogen
source (Miller et al., 2007; Boulton et al., 2009). Furthermore, addition of nutrient mixtures
like VCombi, VUltra and Fermaid E accelerated fermentation kinetics faster than DAP alone
as discussed before in 5.1.1 and 5.2.1. It can be suggested that under the condition in this
trial, the impact of one nutrient (e.g. assimilable nitrogen) on the fermentation kinetics during
alcoholic fermentation is also dependent upon the other nutrients.
It has been demonstrated that malic acid is catalyzed by some strains of S. cerevisiae via
sugar metabolism (Antonelli et al., 1999; Reynolds et al., 2001; Yéramian et al., 2007). As
shown in Table 4-20, in the VCombi and DAP treatments strain Sauvignon catalyzed 39.5 to
64.7 % malic acid. Strain X5 also produced 39.5 % malic acid in the Fermaid E variant. The
addition of these nutrients probably accelerated the fermentation kinetics and consequently
regulated the other pathways including organic acid metabolism (Radler, 1993; Bell &
Henschke, 2005; Ribéreau-Gayon et al., 2006 a; Ugliano et al., 2007). Acetic acid formation
plays an important physiological role in the intracellular redox balance by regenerating
reduced equivalents of NADH (Bely et al., 2003; Ribéreau-Gayon et al., 2006 a). Thus, an
increase of acetic acid production by strain Sauvignon in the Fermaid E and OptiWhite
variants, which had sluggish fermentations, might control the redox balance of this strain.
Nonetheless, concentrations of these acids in the YPF wines were similar to the reported
ranges in a normal grape wine (see literatures above) and these YPF wines did neither
undergo malolactic fermentation nor had a vinegar-like odour. As previously discussed in
5.3.1, high amounts of citric acid in YPF wines originate from the natural YPF juice itself (see
reported data in 3.9.2).

198
As previously discussed in 5.1.1 and 5.2.2, the addition of a nutrient source containing
thiamine; VCombi, VUltra and Fermaid E, significantly diminished the formation of -
ketoglutarate and pyruvate in the YPF wines (Figure 4-38). Jitjaroen (2007) also
demonstrated that the fermentation of fruit wines, santol and ma-mao, with DAP plus
thiamine and Fermaid E reduced the production of keto acids. The excessive formation of -
ketoglutarate by strains Sauvignon and EC1118 in the DAP treatment was quite above the
normal wine value, thus it might affect the stability and quality of these YPF wines (see
reported literatures in 5.1.1). There was probably a correlation between the high formation of
acetaldehyde and the fast fermentation kinetics of strain EC1118 with the addition of VCombi,
VUltra and Fermaid E (Figure 4-37). Recently, Jitjaroen (2007) reported a similar result that
the addition of Fermaid E promoted greater yeast growth rates and acetaldehyde production
in some fruit wines than DAP alone. Nevertheless, levels of acetaldehyde and pyruvate in
YPF wines were similar to the reported ranges in grape wine.
Ammonium salts like DAP are widely used to compensate nitrogen deficiencies in the juice
and to practically control H2S formation (Hansen et al, 1994; Rauhut, 2009). Nevertheless, its
supplementation is not always effecting H2S production because of other factors, e.g.
methionine and other nitrogen that regulate amino acid transport into the yeast cell and
sulphur metabolism, especially the SRS pathway, which generates H2S (Spiropoulos &
Bisson, 2000; Spiropoulos et al., 2000) and deficiencies in vitamins and micronutrients
(Wainwright, 1971; Wang et al., 2003). This is largely due to the fact that the regulation of
sulphur and nitrogen metabolism in yeast is complex (Marks et al., 2003; Bell & Henschke,
2005). Thus, the high production of H2S by strain EC1118 in the presence of DAP might be
partially explained (Figure 4-39). Overall, H2S and carbon disulphide formation decreased
with the addition of a nutrient mixture containing thiamine as well as OptiWhite. Their levels
in the YPF wines had nonetheless no undesirable sulphur off-flavour (Table 2-5). In contrast,
the addition of VCombi and VUltra resulted in a high formation of methanethiol (MeSH) by
strain EC1118. It is derived from methionine, cysteine, S-methylmethionine and sulphate (De
Mora et al., 1986; Rauhut, 1993). The addition of these nutrient sources might therefore
provide certain substrates for this strain to liberate high amounts of MeSH under this trial
condition. However, ongoing research is necessary to prove the effect of nutrient sources on
the sulphur compound formation in the YPF wines. The odour threshold of MeSH is
extremely low at 0.02-0.3 g L-1, thus detected levels in these YPF wines may contribute to
an undesirable aroma of rotten egg or cabbage.
It is well documented that an inverse correlation exists between DAP addition and the
production of higher alcohols, as pathways leading to the alcohol synthesis are down-
regulated by the addition of DAP (Rapp & Versini, 1991, 1996; Marks et al., 2003; Beltran et

199
al., 2005; Hernández-Orte et al., 2006 a). This result also showed that the addition of DAP
significantly decreased the concentration of 2-methyl butanol and 2-phenyl ethanol for most
yeast strains, but these alcohols increased with other nutrient mixtures (Figure 4-40). On the
other hand, the DAP addition promoted high formations of 2-methyl propanol and 3-methyl
butanol, particularly by strains Sauvignon and EC1118. Hernández-Orte et al. (2005) have
suggested that DAP increases the capacity of the yeast to transform the synthesized -keto
acids, avoiding their accumulation and later expulsion to the medium after their reduction to
higher alcohols. In addition, it may also reflect a less efficient usage of nitrogen for these
strains (see similar discussion in 5.2.2). For instance, strain Sauvignon seemed to be the
predominant producer of higher alcohols, but their concentrations were within the desirable
value in grape (see reported literatures in 5.1.1). In addition, high levels of 2-phenyl ethanol
produced by this strain may elicit floral and rose aroma in YPF wines.
Strain Sauvignon developed prominent aroma compounds in terms of acetic acid esters
(excluding acetic acid hexyl ester), linalool and -terpineol with the addition of nutrient
sources containing thiamine (VCombi, VUltra and Fermaid E) (Figure 4-41 and 4-42). It has
been reported that acetic acid ester can be derived directly from the corresponding higher
alcohol through condensation with acetyl-CoA (Nykänen, 1986; Antonelli et al., 1999;
Herjavec et al., 2003; Vilanova et al., 2007). This result also indicated that there was a
positive relationship between higher concentrations of higher alcohols and the greater
productions of corresponding acetic acid esters by strain Sauvignon with the same nutrient
condition (Figure 4-40 and 4-41). Acetic acid hexyl ester is probably derived from a grape
precursor, hexyl aldehyde that is modified by yeast metabolism (Boulton et al., 2009). Strains
EC1118 and X5 with VCombi addition showed high liberation of this ester. High acetic acid
3-methylbutyl ester productions in the YPF wines, particularly in the Sauvignon treatments,
may have an intensive banana aroma (see reported literatures in 5.1.1). The slow
fermentation time of strain Sauvignon seemed to correspond to high levels of -terpineol and
linalool. A longer fermentation time may lead to high release of monoterpenes under the
condition in this trial. However, their concentrations were quite below the perception
thresholds (Table 2-4).
Likewise, depending on the yeast strain utilized, the formation of ethyl ester compounds
presented different responses when different nutrients were added to the medium as shown
in previous studies (Torrea et al., 2005; Miller et al., 2007). Strain Sauvignon with DAP
addition produced the highest amounts of ethyl esters of isobutanoic acid and lactic acid
(Table 4-21). The addition of VCombi promoted strain EC1118 to develop the greatest
concentrations of butanoic acid ethyl ester, medium-chain fatty acids and their ethyl esters as
well as strain X5 with respect to fatty acids and their ethyl esters (Table 4-22). The propionic

200
acid ethyl ester was most obvious in the YPF wines produced by strain X5 with Fermaid E
and OptiWhite additions. Similar to earlier studies (Hernández-Orte et al., 2005, 2006 a;
Miller et al., 2007; Rosi et al., 2008) who suggested that a large pool of ammonium released
from these nutrient sources was not used for cellular structures and growth of the yeast but
was rather available to produce high levels of secondary metabolites as ethyl esters. The
high formation of fatty acids and their ethyl esters by strains EC1118 and X5 (Table 4-22)
seemed to be related to their fast fermentation kinetics in the same nutrient sources (Figure
4-37). As discussed in 5.2.2, these nutrients enhanced the metabolic activities of the yeast,
and might consequently regulate the metabolic pathways of ester formations as well. In
addition, the higher concentration of fatty acids seemed to determine the greater production
of corresponding fatty acid ethyl esters. Nevertheless, the rate of conversion is strongly
dependent on the yeast strain as suggested by some research groups (Antonelli et al., 1999;
Herjavec et al., 2003; Torija et al., 2003 a, 2003 b; Vilanova et al., 2007).
The YPF wines produced by most yeast strains with the addition of DAP and VCombi might
have an odour reminiscent of floral and fruity aromas, as the concentration of ethyl esters in
these samples were beyond the perception thresholds (see reported literatures in 5.1.1).
5.3.3 Effect of five commercial Saccharomyces yeast strains and two different
commercial nutrient sources at different concentrations on growth kinetics,
fermentative characteristics, metabolic and aroma compounds of yellow passion fruit
wines
The YPF puree had low pH and extremely high acidity, thus it was diluted by the addition of
water to the optimal value for yeast growth and sensory preferences (Ribéreau-Gayon et al.,
2006 a; Swiegers et al., 2005 a; www.foodsci.purdue.edu/research/labs/enology/Acid
2007slides.pdf, 2009) as shown in Table 4-23. Concentrations of -amino nitrogen in the
prepared YPF juice were consequently reduced to approximately 91.9 % and it had a low
total amino acid and sugar content (Table A-3). The sugar content was then adjusted by
adding sucrose (beet sugar) giving inverted sugar to 170.5 + 12.1 g L-1. In accordance with
some authors, numerous higher alcohols and esters are produced during fermentation
(Francis & Newton, 2005; Ribéreau-Gayon et al., 2006 b). These compounds were detected
from traces to below 5 mg L-1 in the YPF puree and prepared juice and below the aroma
threshold reported in the literatures above, except for levels of linalool that were above the
perception threshold (15-50 g L-1). In addition, a decrease of the aroma compound
concentrations in prepared YPF juice was also due to the addition of water to YPF puree.
The fermentations of prepared YPF juice were examined with regard to the effect of yeast
strains (EC1118, VL3, X5, Alchemy I and LittoLevure), nutrient sources (DAP and VCombi)

201
and nutrient levels (0.25 and 0.5 g L-1) on the fermentation characteristics, non-volatile and
volatile compounds in the final YPF wine. The result indicated that strains EC1118 and
Alchemy I had the fastest fermentation kinetics and durations, while strains LittoLevure and
VL3 resulted in sluggish fermentations depending on the nutrient supplement (Figure 4-43).
Nevertheless, these yeast strains fermented practically nearly all the initial sugar provided
(Table 4-23) and resulted in a low residual sugar below 2 g L-1 (Table 4-24). The addition of
VCombi at a high concentration (0.5 g L-1) seemed to be the most effective condition to
accelerate fermentation kinetics and time for the five yeast strains. The VCombi contains
thiamine, which is also a growth factor hence it might help the yeast to adapt its metabolism
to the new conditions as previously discussed in 5.3.2. The addition of thiamine to the grape
juice influences the growth rate, the velocity and the kinetic of fermentation (Delfini &
Formica, 2001; Ribéreau-Gayon et al., 2006 a; Jitjaroen, 2007). On the contrary, strain
LittoLevure showed slow fermentation kinetic in the VCombi at low level, it might be due to its
less effective behaviour in relation to nitrogen usage as well as the nitrogen deficiency and
thiamine depletion of the juice as suggested by some studies (see reported literatures in
5.2.2 and 5.3.2).
High productions of glycerol by strains VL3 and X5 are probably related to their slow
fermentation kinetics in the low DAP treatment (Table 4-24 and Figure 4-43). Larsson et al.
(1998) have suggested that when Saccharomyces yeast cells face nitrogen limitation,
glycerol synthesis is increased in order that excessive cytosolic ATP can be consumed. In
addition, glycerol may have a role in oxidative stress resistance, in regenerating cytosolic
inorganic phosphate and in nitrogen metabolism (Scanes et al., 1998). Even though some
variations in the glycerol production were observed among the treatments, glycerol levels in
all YPF wines were within the optimal wine ranges (see reported literatures in 5.1.1). Some
differences existed among the treatment combinations in terms of citric and malic acid
concentrations, except for acetic acid (Table 4-25). It might be due to a chemical reaction
with other substances in the YPF wine. It has been reviewed that many yeasts are able to
use certain carboxylic acids not only as sources of carbon for growth but also for controlling
the intracellular pH and contribute therewith to the intracellular charge balance by enhancing
K+ ion uptake (Walker, 1998; Torija et al., 2003 b). The lactic acid was not detected in all YPF
wines, thus they did not undergo malolactic fermentation. In addition, concentrations of
organic acids were similar to the reported values in grape wines and YPF wines in 5.3.1 and
5.3.2.

202
Excessive amounts of -ketoglutarate and pyruvate in the YPF wines were produced by
strains X5 and VL3 in the presence of DAP, especially at low levels, but significantly
diminished with VCombi (DAP plus thiamine) addition (Figure 4-44). It has been suggested
that when ammonium salts are added as sole major source, they will be converted to
glutamate and mobilized in transamination reactions in yeasts resulting in the formation of
other amino acids and keto acids, however depending on the yeast strain (Rankine, 1968 b;
Albers et al., 1996). As previously discussed in 5.2.2 and 5.3.2, thiamine effectively
decreased keto acid productions. The result indicated that excessive levels of keto acids
detected in the YPF wines produced by strains X5 and VL3 in the DAP treatment seemed to
influence the stability and quality. The acetaldehyde formation in all the YPF wines showed
no significant difference and was below the sensory threshold (see reported literatures in
5.1.1).
Similar to the previous trial, although DAP was added to compensate nitrogen deficiencies in
the YPF juices, high formations of H2S by most strains were observed (Figure 4-45). Rauhut
(2009) suggested that some yeast strains are constantly high or constantly low H2S
producers (see previous discussion in 5.3.2). On the other hand, its production significantly
decreased when the VCombi was supplemented into the juice at 0.5 g L-1. Regarding CS2,
the slow and sluggish fermentations of strains LittoLevure and VL3 seemed to affect their
high productions under similar nutrient conditions. On the contrary, high production of MeSH
seemed to be related to fast fermentation kinetics of strains EC1118 and Alchemy I under the
same nutrient conditions (Figure 4-43 and 4-45). It is likely that the accelerated fermentation
kinetic and yeast activity regulated the liberation of MeSH. In addition, a high formation of
H2S by both strains in the same nutrient condition might lead to a high production of MeSH
as well as a high production of MeSAc by the Alchemy I strain. It has been reported that a
high H2S formation in the early phase of fermentation leads to high amounts of MeSAc
(Matsui & Amaha, 1981; Rauhut, 1996). Although concentrations of H2S, CS2 and MeSAc
detected in the YPF wines were below the aroma threshold (Table 2-5), levels of MeSH
produced by strains EC1118 and Alchemy I under certain nutrient conditions may give a
reductive off-flavour (odour threshold 0.02-0.3 g L-1) in YPF wines.
The result in Figure 4-46 indicated that hexanol amounts in YPF wines were similar among
treatments. As previously discussed in 5.3.2, the addition of DAP at high level resulted in the
highest production of 2-phenyl ethanol, 2-methyl and 3-methyl butanol by strain LittoLevure,
as well as 2-methyl propanol by strain VL3. As previously suggested in 5.3.2, addition of
DAP increased the capacity of some yeast strains to transform the synthesized -keto acids,
avoiding their accumulation, but reduced them to higher alcohols (Beltran et al., 2005;
Hernández-Orte et al., 2005, 2006 a). In contrast, the addition of VCombi diminished keto

203
acids and reduced concentrations of higher alcohols, except for 2-phenyl ethanol, for all
yeast strains. The higher alcohol production by wine yeasts appears to be the result of either
the anabolic formation of amino acids de novo from a sugar substrate or the catabolic
conversion of the branched-chain amino acids via corresponding keto acids from the Ehrlich
pathway (Äyräpää, 1971; Rapp & Versini, 1991, 1996; Marks et al., 2003; Bell & Henschke,
2005; Ribéreau-Gayon et al., 2006 a). The high formation of 2-phenyl ethanol by strain
LittoLevure with less response to the nutrient supplement might reflect a less efficient usage
of nitrogen as previously discussed in 5.2.2 and 5.3.2. The levels of higher alcohols in YPF
wines were below 300 mg L-1, which are usually considered desirable (see reported
literatures in 5.1.1).
Even though the YPF wines produced by strains VL3 and X5 in most nutrient supplements
showed a tendency to develop high amounts of acetic acid ethyl ester, their concentrations
were below the quantification limit as displayed in relative peak area (Figure 4-47). Strain
LittoLevure, with the addition of either DAP or VCombi at high level, produced prominent
acetic acid esters. The addition of high level of VCombi resulted in the greatest formation of
acetic acid 3-methylbutyl ester by strains VL3 and acetic acid 2-methylbutyl ester for all yeast
strains. As previously discussed in 5.2.2 and 5.3.2, a high nutrient level promoted a great
formation of acetic acid esters. It is likely that VCombi, which enhanced the metabolic activity
of the yeast, also regulated the metabolic pathways of acetic ester production. In addition,
the high formation of 2-phenyl ethanol by strain LittoLevure in YPF wines yielded a great
amount of acetic acid 2-phenyl ethyl ester above the aroma threshold in wine (see previous
literatures in 5.1.1). These YPF wines might also impart an intensive banana aroma as the
concentrations of acetic acid 3-methylbutyl ester were quite above the threshold.
As demonstrated in Table 4-26, strain X5 produced constantly high amounts of propionic
acid ethyl ester with less response to the nutrient supplementation. It might be due to an
efficient behaviour of each strain in relation to the distinctive capacity of nitrogen usage
(Carrau et al., 2008). High formations of lactic acid ethyl ester by strains VL3 and X5 in the
high DAP level, isobutanoic acid ethyl ester by strain VL3 in the DAP treatment and butanoic
acid ethyl ester by strains EC1118 and X5 in a high level of VCombi seemed to be related to
their fast fermentation kinetics. As previously discussed in 5.3.2, the addition of ammonium
into the YPF juice, particularly at high level, promoted high formations of ethyl esters. Lactic
acid ethyl ester is known to be formed from lactic acid and ethanol (Mason & Dufour, 2000;
Sumby et al., 2009), while lactic acid can be derived from pyruvate, directly reduced by yeast
lacticodehydrogenases (Ribéreau-Gayon et al., 2006 a). Thus, the addition of VCombi, which
reduced the formation of pyruvate (Figure 4-44), might be involved in the significant
decrease of lactic acid ethyl ester production in YPF wines. High concentrations of these

204
ethyl esters detected in certain YPF wines may elicit pleasant fruity and floral aromas (see
reported literatures in 5.1.1). Likewise, the addition of VCombi at high level, which enhanced
fast fermentation kinetics and metabolic activities of strains EC1118 and X5, resulted in a
high production of MCFAs and ethyl esters (Table 4-27). In addition, high levels of MCFAs
produced by the two strains seemed to be responsible for the greater production of related
ethyl esters, which is similar to the previous discussion in 5.3.2. Nevertheless, concentrations
of only ethyl ester of hexanoic acid and octanoic acid were beyond the odour threshold.
Even though the yeast strains with nutritive supplementation had an influence on some
volatile compounds, they released similar amounts of linalool and -terpineol in the YPF
wines with no response to the nutrient supplement (Figure 4-48). Their concentrations in the
YPF wines were quite below the aroma threshold (Table 2-4). A limited effect of endogenous
-glycosidases on the development of the juice aroma due to its activity is optimum at pH 5
(Großmann et al., 1990; Swiegers et al., 2005 a) and the clarification of YPF juice might
inhibit its activity.
5.3.4 Effect of three commercial Saccharomyces yeast strains and four different
nutrient sources at two different concentrations on growth kinetics, fermentative
characteristics, metabolic compounds and aroma of yellow passion fruit wines
As previously discussed in 5.3.3, the YPF juice used for the fermentation was diluted by the
addition of 10-fold water because its natural puree has high acidity (Table 4-28). The YPF
juice then had a low -amino nitrogen, total amino acid and sugar content (Table 4-28 and
A-3), and beet sugar was added into the juice resulting in 170.0 + 2.8 g L-1 inverted sugar.
The yeast nutrient was supplemented according to the experimental plan (Table 3-12) to
compensate nutrient deficiencies in the YPF juice. The results also indicated that
concentrations of volatile compounds in prepared YPF juice were detected in small amounts
below the aroma threshold (see reported literatures in 5.1.1).
Strain EC1118 had shorter fermentation duration with less response to the nutrient addition
than strains X5 and VL3 (Figure 4-49). Strain VL3 with the addition of 0.4 g L-1 OptiWhite
resulted in a slow and stuck fermentation with residual sugar higher than 10 g L-1 (Table 4-
29). It is likely that strains VL3 and X5 were more sensitive to the nutrient source and the
concentration than strain EC1118, and had a higher nitrogen demand. Nevertheless, the
VCombi and VUltra at high level seemed to be the most effective to enhance fermentation
kinetics for all yeast strains in the YPF juice fermentations, while OptiWhite was the least
effective, particularly at low level. Similar to previous trials, the nutrient mixtures containing
thiamine and growth factors gave better fermentation kinetics than the single nutrient source

205
(see reported literatures in 5.2.2 and 5.3.2). On the other hand, some yeast strains resulted
in sluggish or stuck fermentations with the addition of Fermaid E. It might be due to a specific
nitrogen demand of each yeast strain, nitrogen deficiency, thiamine depletion and an
excessive clarification of the YPF juice as previously discussed in 5.3.3. Even though both
yeast strain and nutrient supplement affected fermentation kinetics and residual sugar
content in the YPF wines, they had no significant influence on the glycerol production (Table
4-29).
There were some differences among the treatments in terms of organic acid concentrations
in the YPF wines, but they had no impact on the quality (Table 4-30). Nevertheless,
concentrations of these acids in YPF wines were normally within the reported wine ranges
(see previous literatures in 5.1.1). It was exceptional that high citric acid amounts in the YPF
wines were originally from the YPF juice itself as previously discussed in the YPF trials.
Similar to previous trials, the addition of OptiWhite at both levels, resulted in excessive
productions of -ketoglutarate and pyruvate, particularly by strain VL3 (Figure 4-50). Pozo-
Bayón et al. (2009 a, 2009 b) have suggested that the IDY product like OptiWhite can
release amino acids, particularly glutamic acid that is the donor of nitrogen in several
biosynthetic pathways of amino acids. An excess of -ketoglutarate can consequently be
formed as a de-amination product (Albers et al., 1996; Rankine, 1968 b). On the other hand,
the addition of other nutrient sources containing thiamine significantly reduced the formations
of both keto acids as previously discussed in several trials. The excessive amounts of both
keto acids in the YPF wines produced by strains VL3 and X5 with OptiWhite addition might
affect the stability and quality (see previous literatures in 5.1.1). Under this trial condition, all
yeast strains produced similar amounts of acetaldehyde without any response to nutrient
addition and had no influence on the quality of the YPF wines.
The result indicated that the YPF juice supplemented with OptiWhite, which is rich in
glutathione, resulted in high production of H2S (Figure 4-51). Tokuyama et al. (1973)
suggested that when nitrogen is limited, H2S can be produced by the degradation of
glutathione and the release of cysteine. In addition, the impact of vitamins or degradation of
sulphur reserves like glutathione is involved in H2S formation (Eschenbruch, 1974; Henschke
& Jiranek, 1993; Hallinan et al., 1999; Wang et al., 2003; Edwards & Bohlscheid, 2007).
Nevertheless, production of H2S significantly diminished when another nutrient source
containing DAP was added into the YPF juice. It is likely to have a relationship between high
concentrations of carbon disulphide and sluggish fermentations of strains X5 and VL3 with
the addition of low Fermaid E level, but the mechanism involved is unclear. Strain EC1118
with a high level of VUltra and Fermaid E addition produced methanethiol in the YPF wines,
which seemed to be related to the fast fermentation kinetics. The accelerated fermentation

206
activity of this strain might have regulated the liberation of MeSH. Although levels of H2S and
CS2 were not high enough to cause a reductive sulphur off-flavour in the YPF wines, levels of
MeSH in certain EC1118 samples were above its odour threshold (Table 2-5) and might
impart a reductive odour of rotten eggs.
As shown in Figure 4-52, the effect of the nutrient source at different concentrations on
higher alcohol production was dependent upon the inoculated yeast strain, except for
hexanol. Strain VL3 with high OptiWhite addition developed the prominent concentrations of
2-methyl propanol and 3-methyl butanol. As previously discussed in 5.3.2, higher formations
of -ketoglutarate by strain VL3 (Figure 4-50) seemed to be responsible for the greater
amount of these alcohols in the low OptiWhite sample. Higher alcohols can be formed from
intermediates in branched-chain amino acids via corresponding keto acids from the Ehrlich
pathway (Bell & Henschke, 2005). On the other hand, the addition of Fermaid E at both
levels promoted the greatest production of 2-phenyl ethanol by strain EC1118 in the YPF
wines and 2-methyl butanol by strain VL3. The former compound was also most obvious in
the high VCombi treatment of strain EC1118. Nevertheless, the effect of the nutrient source
containing DAP on the high production of some higher alcohols is earlier discussed in 5.3.2
and 5.3.3. Concentrations of hexanol were not affected from both yeast strain and nutrient
supplement. Clarke & Bakker (2004) and Bell & Henschke (2005) have suggested that it is
formed from a must-derived precursor, thus its formation depends largely on the formation of
its precursor during must processing. It is not greatly influenced by the initial must nitrogen
content and source. Interestingly, concentrations of 2-phenyl ethanol in the YPF wines,
particularly in the EC1118 samples, were above the aroma threshold which elicits floral and
rose odour.
Although the acetic acid ethyl ester formation was different among the treatments, its
concentration was below the limit of quantification and had no impact on the aroma of the
YPF wines (Figure 4-53). Similar to the previous trial, there is probably a correlation between
the high formation of acetic acid esters, butanoic acid ethyl ester, fatty acids and their ethyl
esters by strain EC1118 with the high VCombi addition (Figure 4-53 and Table 4-31, 4-33,
4-34) and its fast fermentation kinetics (Figure 4-49). Ethyl esters can be formed from the
catabolic activity of alcohol acetyl transferases on ethanol and carboxylic acids (Mason &
Dufour, 2000; Lilly et al., 2000, 2006). This nutrient condition might enhance the yeast
metabolic activity as well as regulated the metabolic pathways of these ester formations.
Moreover, the addition of a high VCombi level, which is DAP plus thiamine, might provide a
higher proportion of DAP than another nutrient. When a large pool of DAP and ammonium
was added, the amino acids were not used for cellular structures and growth, but rather
induced the formation of secondary metabolites like esters (see earlier discussions and

207
literatures in 5.1.1 and 5.3.2). In addition, it seemed that the great concentration of MCFA
biosynthesis was responsible for the formation of corresponding ethyl esters rather than
esterification (Saerens et al., 2006, 2008). On the other hand, the high production of ethyl
ester of isobutanoic acid, propionic acid and lactic acid seemed to be related to the sluggish
or stuck fermentation of strain VL3 in the OptiWhite treatment followed by strain X5 (Figure
4-49 and Table 4-31, 4-32). The OptiWhite is an IDY product, which has been reported to
release a large pool of amino acids into the juice (Pozo-Bayón et al., 2009 b; Raynal et al.,
2009). Amino acids play a direct role as precursors of esters (Hernández-Orte et al., 2005,
2006 b; Miller et al., 2007), thus high formations of ethyl ester in the OptiWhite sample might
be observed. In addition, Bowyer et al. (2010) also reported that glutathione, which is rich in
OptiWhite, can be used as a natural antioxidant for the preservation of wine aromas and
concurrently delay the appearance of developed characters. Thus, it can be suggested that
depending on the yeast strain utilized, the formation of acetic acid ester and ethyl esters
showed different responses when nutrient/nitrogen was added to the medium as
demonstrated in some studies (Torrea et al., 2003, 2005; Miller et al., 2007). Concentrations
of acetic acid 3-methylbutyl ester and most ethyl esters in these YPF wines were greatly
beyond their perception thresholds, which have a reminiscence of banana, floral and fruity
aromas (see reported literatures in 5.1.1).
Similar to previous YPF trials, the three yeast strains released similar amounts of -terpineol
in all nutrient conditions of the YPF wines (Figure 4-54). It might be due to the fact that the
activity of -glycosidase is limited at low pH (pH 5) and the extreme clarification of YPF juice
might inhibit its activity as well (see previous literatures in 5.3.3). In addition, its levels were
below the aroma threshold, thus they did not contribute to the varietal aroma (Table 2-4).
5.4 Volatile thiols involved in varietal aroma of yellow passion fruit wines
The concentrations of volatile thiols that contribute to the varietal aroma of grape wines may
depend considerably on the variety, as well as soil, climate and vineyard management
techniques (Rapp, 1998; Tominaga et al., 1998 b; Ribéreau-Gayon et al., 2006 b). Some
research works indicated that commercial yeast strains differ in the ability to release various
volatile thiols (Murat et al., 2001 a; Howell et al., 2004; Curtin et al., 2009; Swiegers et al.,
2009). In addition, the particular yeast‘s ability to release one thiol does not appear to be
linked with its ability to release a second, different volatile thiol. This study also clearly
outlines agreeing with the literatures above, that the choice of commercial Saccharomyces
yeasts had a significant influence, variable according to the specific commercial yeast strain,
on the concentration of the typical thiol aromas in the YPF wines.

208
The volatile thiol analysis is a high-sophisticated analytical method and very time consuming.
Therefore, the YPF wines used for the investigation of volatile thiols were chosen from two of
four YPF wine trials (4.3.3 and 4.3.4). The selection was based on wines, which showed
desirable fermentation characteristics and high levels of fermentation-derived compounds
that impart pleasant fruity and floral aromas, but very low levels of undesirable compounds.
The results confirmed that high amounts of 3SH and 3SHA can be found as the naturally
occurring volatile thiols in YPF juice (Engel & Tressl, 1983, 1991; Weber et al., 1994, 1995;
Tominaga & Dubourdieu, 2000). Although the prepared YPF juice in this study was diluted by
water addition, these volatile thiols were detected (Figure 4-55). In grapes, 3SH is mainly
present in conjugate form, while in YPF juice this volatile thiol is present in both free and
conjugate form (Tominaga & Dubourdieu, 2000). They also demonstrated that the precursor
of 3SH, S-(3-hexan-1-ol)-L-cysteine, is present in YPF juice as well. In passion fruit juice, the
conjugates are probably converted into free thiols either by acid hydrolysis or by an
endogenous enzyme, such as β-lyase.
The results clearly showed that commercial Saccharomyces yeasts released approximately
7.1-fold to 11.0-fold of 3SH in YPF wines in comparison to detected 3SH in the YPF juice,
however this depended on the yeast strain. According to Tominaga & Dubourdieu (2000),
3SH can be generated by the action of C-S β-lyase from its S-cysteine conjugate in YPF
juice. As shown in Figure 4-55, the high VCombi addition (0.5 g L-1) induced strain EC1118
to be the most effective producer of 3SH and 3SHA in the YPF wines. The LittoLevure strain
seemed to follow a similar pattern of 3SH liberation, but less 3SHA production. Strain VL3
appeared to be the least efficient in releasing the 3SH aroma. This result confirmed previous
studies in grape wines (Murat et al., 2001 a; Howell et al., 2005; King et al., 2008; Swiegers
et al., 2009) that the release and the modulation mechanisms of volatile thiol compounds in
YPF wines were also yeast strain dependent.
It has been shown that during fermentation 3SHA is generally formed when acetic acid
esterifies the 3SH that has been released. Swiegers et al. (2005 b, 2007) found out that
3SHA is formed from 3SH by the action of the yeast ester-forming alcohol acetyltransferase,
encoded by the ATF1 gene. Lilly et al. (2006) suggested that the overexpression of ATF1 in
a VIN13 yeast strain resulted in increased 3SHA concentrations. The present study also
revealed that a higher concentration of 3SH induced an increased production of 3SHA in
YPF wines for most yeast strains (6.5 to 9.0 % released 3SHA), except for strain LittoLevure
(5.0 %). Some specific gene, which encodes an ester-degrading enzyme, might be involved
(Swiegers et al., 2005 b, 2007).

209
Interestingly, concentrations of 3SH in YPF wines were between 59-fold and 93-fold (in the
EC1118 treatment) of the perception thresholds (60 ng L-1), which contribute to grapefruit
and passion fruit aromas (Tominaga et al., 1998 b; Bell & Henschke, 2005; Francis & Newton,
2005; Dubourdieu et al., 2006; Ribéreau-Gayon et al., 2006 b). Concentrations of 3SHA
(boxwood, grape fruit zest, passion fruit aromas) in YPF wines were also above the aroma
threshold (4 ng L-1) and differed from 57-fold to 125-fold (in the EC1118 treatment).
To examine the effect of the nutrient source (DAP and VCombi) at different levels (0.25 and
0.5 g L-1) on the production of volatile thiols, the two yeast strains of EC1118 and X5 were
used. As demonstrated in Figure 4-56, the result clearly indicated that the low level of DAP
addition modulated higher 3SH and 3SHA productions by strain EC1118 than the high level.
This result confirmed the investigation of Subileau et al. (2008) that a complementation with
DAP induces a decrease of 3SH production. They also concluded that in synthetic medium,
Cys-3SH enters the cell through at least one identified transporter, GAP1p, whose activity is
limiting the release of volatile thiols. The uptake of the precursor through GAP1p is not
confirmed, but the effect of the addition of DAP, eventually prolonging nitrogen catabolite
repression, is shown to decrease thiol production. On the other hand, the addition of VCombi
(DAP plus thiamine) at high level tended to enhance higher expression of these thiols in
strain EC1118. In addition, the nutrient source and concentration had no significant influence
on the 3SH release in strain X5.
As discussed above, 3SHA is formed from 3SH by the action of the yeast activity (Swiegers
et al., 2005 b, 2007), thus higher concentration of 3SH seemed to determine greater
production of 3SHA in the YPF wines. For instance, the EC1118 strain with the addition of
low DAP level and high VCombi level resulted in the highest transformation of 3SHA from
3SH at an average of 5.7 % and 9.0 % respectively. In addition, concentrations of both 3SH
and 3SHA were quite beyond the aroma threshold, which contributes to the varietal aroma
(see literatures above and Table 2-5).
As shown in Figure 4-57, commercial Saccharomyces yeast strains significantly had the
greater impact on the liberation of 3SH in YPF wines than the nutrient source supplemented
in the YPF juices. The X5 strain liberated higher concentrations of 3SH in the YPF wine in
either the VCombi or VUltra supplementation (5527.5 + 639.5 and 5206.1 + 397.1 ng L-1,
respectively) than strain EC1118. The results showed that neither the yeast strain nor the
nutrient source affected the 3SHA formation ranging from 263.8 + 73.5 to 333.9 + 47.5 ng L-1,
although the 3SHA amounts tended a little bit to be higher in the VCombi treatment for strain
EC1118. In contrast to the results described above, the addition of VCombi stimulated the
EC1118 strain to release higher 3SH amounts than strain X5. It is important to take into
account that these results were obtained from the lower nutrient level addition (0.4 g L-1

210
VCombi) hence it might influence the ability of the yeast strain in the liberation of volatile
thiols in final YPF wines.
Subileau et al. (2008) recently investigated that a complementation with DAP in grape must
induces a decrease of 3SH production. On the other hand, the addition of DAP, in form of
VCombi and VUltra, seemed to have no impact on the release of 3SH during YPF juice
fermentation. It has been suggested by some studies that the particular yeast‘s ability to
release one thiol does not appear to be linked with its ability to release a second, different
thiol (Murat et al., 2001 a; Swiegers et al., 2005 b, 2009). In addition, separate yeast
enzymes may be involved in the formation of different volatile thiols, allowing the levels of the
aroma compounds to be altered independently (Murat et al., 2001 a; Dubourdieu et al., 2006).
The genetic and physiological characteristics of each commercial yeast strain might be
involved (Murat et al., 2001 a; Howell et al., 2005; Curtin et al., 2009; Swiegers et al., 2009).
Concentrations of 3SH and 3SHA in these YPF wines were far beyond the perception
thresholds as shown in publications related to grape wines (see earlier literatures above and
Table 2-5) at about 69-fold to 92-fold and 66-fold to 83-fold, respectively.
The present result clearly confirmed that the presence of larger quantities of varietal volatile
thiols in YPF wines than in YPF juice is due to the metabolic action of the commercial
Saccharomyces yeasts. Tominaga & Dubourdieu (2000) also suggested that the conjugates
in YPF juice are probably converted into free thiols either by acid hydrolysis or by an
endogenous enzyme like β-lyase. Furthermore, the qualitative and quantitative composition
of thiol-precursors can affect the concentration of thiols in final wines.
The structures of 3SH, 3SHA and their cysteinylated precursors in YPF juices have been
identified (Engel & Tressl, 1983, 1991; Weber et al., 1994, 1995; Tominaga & Dubourdieu,
2000). A little scientific research carried out the impact of yeast rehydration nutrients such as
DYNASTART on the increased release of volatile thiols by yeasts in Sauvignon blanc wine
(Bowyer et al., 2008; Swiegers et al., 2008; van der Westhuizen et al., 2008). However, the
impact of yeast strains and nitrogen supplementation on the release of volatile varietal thiols
in YPF wine has not yet been elucidated. Therefore, this study is the first to report the effect
of commercial Saccharomyces yeast strains and nutrient supplementations on volatile thiol
production in YPF wines.

211
6. CONCLUSION AND PERSPECTIVES
Yeast fermentation of sugars not only produces ethanol and carbon dioxide but also a range
of minor but sensorially important volatile metabolites which give the wine the vinous
character and inhibit the development of off-flavours. These volatile metabolites, which
comprise esters, higher alcohols, carbonyls, volatile fatty acids and sulphur compounds, are
derived from sugar and amino acid metabolism. Hence, the assessment of nitrogen
requirements for wine yeasts should be controlled because it can not only have an impact on
yeast growth and fermentation kinetics but also on the formation of volatile and non-volatile
compounds that are important for the organoleptic qualities of the resulting wine. The
limitation of nitrogen and its sources/composition can also influence the formation of reduced
sulphur compounds like H2S.
One of the main objectives in the selection of industrial yeasts for the beverage industry must
be the understanding of the relationship between the nutrient supplements and the
production of desirable non-volatile and volatile compounds by different commercial yeast
strains. Therefore, the main objective of this study is focused on the improvement of
desirable metabolites, the varietal and important aromas in grape wines from two varieties of
Sauvignon blanc and Scheurebe as well as in yellow passion fruit wine by the optimal choice
of Saccharomyces yeast strains and nutrient supplements. In addition, the fermentation trials
of passion fruit wines were carried out accordingly on the basis of the experimental results
obtained from the research on grape wines.
The optimal choice of the required yeast strains and nutrient supplements for the
fermentation of grape wines and YPF wines were studied in detail. The grape juices and YPF
juices were fermented at 20 0C under controlled conditions. The growth and fermentative
behaviours, volatile compound productions and other enological characteristics, which have
an impact on grape wine and YPF wine properties, were summarized as below.
The fermentation trials of Scheurebe wine:
It was observed that the supplemented nutrient sources (control/without nutrient, OptiWhite,
Superstart, DAP and Fermaid E) in the fermentations of fresh Scheurebe juice strongly
modulated the wine composition in a strain-dependent manner (EC1118 and X5). For some
compounds, the influence of the nitrogen source is relatively similar for the two strains,
whereas for the other compounds, considerable differences were observed. Nevertheless,
Fermaid E blanc followed by DAP and Superstart seemed to be the effective nutrients to
accelerate fermentation kinetics and to promote high formations of important wine aromas,
but to diminish the formation of SO2-binding compounds for the two strains.

212
The impact of thirteen commercial strains of Saccharomyces yeasts (EC1118, Sauvignon,
VL3, X5, X16, VIN13, Alchemy I, Alchemy II, 4F9, LVCB, LittoLevure, AWRI R2 and QA23)
without nutrient addition was evaluated on fermentation characteristics and on the production
of metabolic compounds of obtained Scheurebe wines. The results clearly indicate some
differences among the yeast strains used. The VIN13, AWRI R2, EC1118, QA23, VL3 and
X16 strains produced wines with higher volatile contents; mainly 2-phenyl ethanol, acetic
acid 2-phenyl ethyl ester, linalool and wine esters and less negative and undesirable
compounds. It was realized that strain QA23 has to be well observed as it had the slowest
fermentation, although it completely finished fermentation with low residual sugar.
In conclusion, on the basis of the results obtained with regard to fermentation characteristics
as well as important and desirable aromas, the optimal choice of commercial
Saccharomyces yeast strains for the fermentation of Scheurebe wine are strains VIN13,
AWRI R2, EC1118, QA23, VL3, X5 and X16. The most effective nutrients are Fermaid E
blanc, DAP and Superstart at 0.3 g L-1.
The fermentation trials of Sauvignon blanc wine:
The effect of the nutrient source (Fermaid E and OptiWhite at 0.3 g L-1) on the fermentation
kinetics, non-volatile and volatile compounds of the wines was dependent upon the yeast
strain used (EC1118, Sauvignon, VL3, X5, VIN7, VIN13, 4F9, AWRI R2 and LVCB). The
results indicated that Fermaid E addition increased the formation of ethyl esters and acetic
acid esters, but significantly decreased the formation of keto acids for most yeast strains. It is
worth noting that the nine yeast strains showed similar formations of acetaldehyde, higher
alcohols, most ethyl esters and -terpineol with less response to the nutrient source.
Nonetheless, strains EC1118, Sauvignon, VL3, X5 and VIN7 were the most optimal yeast
strains, thus their behaviour was intensively investigated in further trials.
The fermentation trial with five yeast strains (EC1118, X5, VIN7, Alchemy I and LittoLevure)
showed that some significant differences with regard to fermentation kinetics, non-volatile
and volatile metabolic compounds in the wines were depended on the nutrient sources
(Superstart, Fermaid O, Fermaid E and VUltra). The Fermaid E and VUltra seemed to be the
most effective nutrients to enhance the fermentation behaviours and the formation of
desirable metabolic compounds in strains EC1118, X5 and Alchemy I with the lower level of
volatile acidity and keto acids.

213
Finally, the outcomes clearly indicated the direct influence of commercial yeast strains and
nutrient supplements on the different fermentation parameters and the formation of important
wine aromas. Under laboratory conditions, yeast strains X5, EC1118, Alchemy I and II and
VL3 and/or the nutrient sources of Fermaid E blanc, DAP and Superstart at high levels
seemed to be the most effective for the fermentation of Sauvignon blanc wine.
The fermentation trials of yellow passion fruit (YPF) wine:
The following trials investigated the improvement of fermentation properties, important non-
volatile and volatile compounds as well as varietal aromas in the YPF wines by the optimal
choice of commercial yeast strains and nutrients. This choice was leaned on the results
obtained from the trials carried out with Scheurebe and Sauvignon blanc wines.
The optimal fermentation parameters and the formation of metabolic compounds in the YPF
wines were evaluated for five S. cerevisiae var. bayanus strains (EC1118, AWRI R2,
LittoLevure, QA23 and Freddo), seven S. cerevisiae strains (Sauvignon, VL3, X5, X16, 4F9,
VIN13 and LVCB) and two Saccharomyces spp. strains (Alchemy I and II) with the same
nutrient addition (0.5 g L-1 DAP). The results clearly showed that strains QA23 and
LittoLevure were the most optimal yeast strains for the production of YPF wines displaying
more desirable aroma compounds, particularly 2-phenyl ethanol, acetic acid 2-phenyl ethyl
ester, most of wine esters and linalool but a low level of keto acids and reductive sulphur
compounds, followed by strains EC1118, X5, VL3, Alchemy I and II. These optimal yeast
strains were also used for an intensive investigation and a better understanding in further
trials of YPF wines.
At the mean time, the influence of three yeast strains (EC1118, Sauvignon and X5) and five
nutrient sources (DAP, VCombi, VUltra, Fermaid E and OptiWhite at 0.4 g L-1) on the
fermentation behaviour and the formation of non-volatile and volatile compounds as well as
monoterpenes was also examined. The results demonstrated that supplementation of YPF
juices with VCombi, VUltra or Fermaid E appeared to be the most effective method to
stimulate the production of great amounts of important and desirable volatile components,
mainly wine esters, 2-phenyl ethanol and its ester, but low levels of keto acids for the three
yeast strains, nevertheless this was slightly yeast strain-dependent. Interestingly, strain
Sauvignon also released great amounts of linalool and -terpineol in the YPF wines.

214
The effects of yeast strains (EC1118, VL3, X5, Alchemy I and LittoLevure), nutrient sources
(DAP and VCombi) and nutrient levels (0.25 and 0.5 g L-1) were examined to improve the
fermentation characteristics, wine aroma compounds as well as varietal volatile thiols in the
YPF wines. The results clearly demonstrated that supplementation of YPF juice with VCombi
(DAP plus thiamine) at a high level appeared to be the most effective way of producing YPF
wines with accelerated fermentation kinetics, more desirable aromas and a low level of
reductive sulphur compounds and keto acids for strains EC1118, VL3, X5 and LittoLevure.
Interestingly, strain EC1118 was the greatest producer of varietal volatile thiols, 3SH and
3SHA, in 0.25 g L-1 DAP and 0.5 g L-1 VCombi treatments. Strain LittoLevure with 0.5 g L-1
VCombi addition also produced high amounts of 3SHA.
The final YPF wine fermentations with three yeast strains (EC1118, VL3 and X5) showed
some significant differences with regard to the fermentation parameters, non-volatile and
volatile compounds and volatile thiols depending on different nutrient supplements (DAP,
VCombi, VUltra, Fermaid E and OptiWhite) at two levels (0.2 and 0.4 g L-1). The results
revealed that the addition of VCombi and VUltra at 0.4 g L-1 resulted in enhanced
fermentation behaviours and a high level of desirable aroma compounds, especially 2-phenyl
ethanol, acetic acid 2-phenyl ethyl ester, but a lower level of higher alcohols, keto acids for
the three yeast strains. In addition, the X5 strain with the addition of high VCombi or VUltra
produced the YPF wine having the greatest concentration of 3SH, while concentrations of
3SHA were similar among the yeast strains and nutrients used.
Finally, the YPF results obtained from YPF fermentations revealed that when 0.5 g L-1 DAP
was added as sole source of nitrogen in YPF juice, strains QA23, LittoLevure, EC1118, X5,
VL3 and Alchemy I and II seemed to be the optimal choice for the YPF wine fermentation.
However, the addition of VCombi at high levels (0.5 g L-1) was the most efficient nutrient
condition to obtain the best fermentation characteristics and to improve wine aroma and
varietal volatile thiols in the YPF wines for strains EC1118, LittoLevure, X5, Alchemy I and
VL3, respectively. The addition of either 0.25 g L-1 DAP or 0.4-0.5 g L-1 VCombi and VUltra
modulated varietal volatile thiol productions in the YPF wines by strains EC1118 and strain
X5 as well. Nevertheless, it has to be taken into account that DAP addition resulted in
excessive formation of keto acids by strain X5. Interestingly, concentrations of volatile thiols
in YPF wines were quite above the aroma threshold contributing to typical and varietal
aromas of grapefruit zest and passion fruit.

215
In conclusion, this present study clearly indicated that the use of different commercial
Saccharomyces strains for grape wine and YPF wine fermentations resulted in wines and
YPF wines with differing fermentative characteristics and the production of non-volatile and
volatile compounds that influenced the quality. The nutrients supplemented to the
fermentations strongly modulated the wine composition in a strain-dependent manner as well.
This study is particularly relevant considering that in grape wine and tropical fruit wine
productions, it is simultaneously desirable to achieve low concentrations of SO2-binding
compounds, high levels of substances that impart pleasant fruity and floral aromas as well as
varietal aromas. On the other hand, low levels of compounds that can cause off-flavours and
low levels of metabolites (e.g. MCFAs) that could compromise the yeast fermentative activity
have to be achieved.
Therefore, the present work is demonstrating that the choice of the yeast strain as well as the
nutrient support can have a high impact not only on the fermentation activity, but also on the
composition of volatile and non-volatile compounds. The results may help the winemakers to
optimize the important and potential fermentation parameters by an adequate choice of yeast
strains and nutrient supplements to improve wine quality.
In addition, this study also has important implications for the grape and tropical fruit
winemaking industry where a better understanding of the nutritional requirements of
Saccharomyces is necessary to reduce fermentation problems and to improve the final
product quality. It is worthwhile pointing out that this work is an interesting new observation
for the YPF wine fermentation, although the fermentation trials were only done in laboratory
scale. Thus, some different fermentation parameters as well as volatile compounds might be
achieved under industrial conditions.
Nevertheless, a better understanding of the effects of nutrient supplementation on yeast
metabolic products as well as sensory properties is still required in further work in both the
laboratory and pilot scale.

216
7. REFERENCES
Abbas, C.A. (2006). Production of antioxidants, aromas, colours, flavours, and vitamins by
yeasts. In A. Querol & G. H. Fleet (Eds.), The Yeast Handbook: Yeasts in Food and
Beverages (pp. 285-334). Heidelberg: Springer.
Acedo, M.I., Pueyo, E., & Polo, M.C. (1994). Preliminary studies on peptides in wine by
HPLC. American Journal of Enology and Viticulture, 45, 167-172.
Acree, T.E., Sonoff, E.P., & Splittstoesser, D.F. (1972). Effect of yeast strain and type of
sulphur compound on hydrogen sulphide production. American Journal of Enology and
Viticulture, 23, 6-9.
Albers, E., Larsson, C., Lidén, G., Niklasson, C. & Gustafsson, L. (1996). Influence of the
nitrogen source on Saccharomyces cerevisiae anaerobic growth and product formation.
Applied Environmental Microbiolology, 62, 3187−3195.
Albers, E., Lidén, G., Larsson, C., & Gustafsson, L. (1998). Anaerobic redox balance and
nitrogen metabolism in Saccharomyces cerevisiae. Recent Research Developments in
Microbiology, 2, 253–279.
Alexandre, H. & Charpentier, C. (1998). Biochemical aspects of stuck and sluggish
fermentation in grape must. Journal of Industrial Microbiology & Biotechnology, 20, 20-27.
Amerine, M.A., Berg, H.W., Kunkee, R.E., Ough, C.S., Singleton, V.L., & Webb, A.D. (1980).
The Technology of Winemaking. 4th Ed. AVI Publishing Co., Inc. Westport.
Amoore, J.E., & Hautala, E. (1983). Odor as an ald to chemical safety: Odor thresholds
compared with threshold limit values and volatilities for 214 industrial chemicals in air and
water dilution. Journal of Applied Toxicology, 3(6), 272-290.
Anli, E., Vuralb, N., Yimaza, S., & Vural, Y.H. (2004). The determination of biogenic amines
in Turkish red wines. Journal of Food Composition and Analysis, 17, 53–62.
Anocibar Beloqui, A. (1998). Contribution à l'étude des composés soufrés volatiles des vins
rouges. Thèse de Doctorat de l'Université de Bordeaux I.

217
Ansorge, A. (2007). Influence of vinification processes on contents of biogenic amines in
wine. 8th International Symposium Innovations in Enology (pp. 133-140). Stuttgart.
Antonelli, A., Castellari, L., Zambonelli, C., & Carnacini, A. (1999). Yeast influence on volatile
composition of wines. Journal of Agricultural and Food Chemistry, 47, 1139-1144.
Ayestarán, B.M., Ancín, M.C., García, A.M., González, A., & Garrido, J.J. (1995). Influence of
prefermentation clarification on nitrogenous contents of musts and wines. Journal of
Agricultural and Food Chemistry, 43 (2), 476-482.
Äyräpää, T. (1971). Biosynthetic formation of higher alcohols by yeast. Dependence on the
nitrogenous nutrient level of the medium. Journal of the Institue of Brewing, 77, 276-267.
Barnett, J.A. (1975). The entry of D-ribose into some yeasts of the genus Pichia. Journal of
General Microbiology, 90, 1-12.
Barnett, J.A., Payne, R.W., & Yarrow, D. (2000). Yeasts: Characteristics and Identification
(3rd Ed). Cambridge: Cambridge University Press.
Bartowsky, E.J., & Pretorius, I.S. (2009). Microbial formation and modification of flavor and
off-flavor compounds in wine. In H. König, G. Unden, & J. Fröhlich (Eds.), Biology of
Microorganisms on Grapes, in Must and in Wine (pp. 209-231). Heiselberg, Germany:
Springer Verlag GmbH.
Bataillon, M., Rico, A., Sablayrolles, J.M., Salmon, J.M., & Barre, P. (1996). Early thiamin
assimilation by yeasts under enological conditions: Impact on alcoholic fermentation kinetics.
Journal of Fermentation and Bioengineering, 82 (2), 145-150.
Baumgartner, D., Bill, R., & Roth, I. (2001). Traubenmostanalyse mit Hilfe der FTIR-
Spektroskopie. Schweizerische Zeischrift fuer Obst-und Weinbau, 2, 46-48.
Belitz., H.D., Grosch, W., & Schieberle, P. (2004). Food Chemistry. Berlin: Springer.
Bell, S-J. (1994). The effect of nitrogen fertilisation on the growth, yield and juice composition
of Vitis vinifera cv. Cabernet Sauvignon grapevines. Department of Soil Science and Plant
Nutrition. PhD. Thesis, The University of Western Australia.

218
Bell, S.-J., & Henschke, P.A. (2005). Implications of nitrogen nutrition for grapes,
fermentation and wine. In R.J. Blair, M.E. Francis, I.S. Pretorius (Eds.), AWRI, Advances in
Wine Science. Commemorating 50 Years of the Australian Wine Research Institute, (pp. 45-
91). Australia: The Australian Wine Research Institute.
Beltran, G., Esteve-Zarzoso, B., Rozès, N., Mas, A., & Guillamón, J. M. (2005). Influence of
the timing of nitrogen additions during synthetic grape must fermentations on fermentation
kinetics and nitrogen consumption. Journal of Agricultural and Food Chemistry, 53 (4), 996-
1002.
Beltran, G., Novo, M., Rozès, N., Mas, A., & Guillamón, J.M. (2004). Nitrogen catabolite
repression in Saccharomyces cerevisiae during wine fermentations. FEMS Yeast Research,
4, 625-632.
Beltran, G., Novo, M., Guillamón, J.M., Mas, A., & Rozès, N. (2008). Effect of fermentation
temperature and culture media on the yeast lipid composition and wine volatile compounds.
FEMS Yeast Research, 4, 625-632.
Beltran, G., Rozès, N., Mas, A., & Guillamón, J.M. (2007). Effect of low-temperature
fermentation on yeast nitrogen metabolism. World Journal of Microbiology and Biotechnology,
23, 809-815.
Belviso, S., Bardi, L., Bartolini, A.B., & Marzona, M. (2004). Lipid nutrition of Saccharomyces
cerevisiae in winemaking. Canadian Journal of Microbiology, 50, 669-674.
Bely, M., Sablayrolles, J.M., & Barre, P. (1990). Automatic detection of assimilable nitrogen
deficiencies during alcoholic fermentation in oenological conditions. Journal of Fermentation
and Bioengineering, 70, 246-252.
Bely, M., Rinaldi, A., & Dubourdieu, D. (2003). Influence of assimilable nitrogen on volatile
acidity production by Saccharomyces cerevisiae during high sugar fermentation, Journal of
Bioscience and Bioengineering, 96 (6), 507-512.
Bely, M., Sablayrolles, J.-M., & Barre, P. (1991) Automatic detection and correction of
assimilable nitrogen deficiency during alcoholic fermentation under enological conditions.
Proceedings of the International Symposium on Nitrogen in Grapes and Wine (pp. 211–214),
Seattle, USA : American Society for Enology and Viticulture, Davis, CA.

219
Berry, D.R., & Watson, D.C. (1987). Production of organoleptic compounds. In D.R., Berry, I.
Russell, & G.G. Stewart (Eds), Yeast Biotechnology (pp. 345-368). London: Allen & Unwin.
Bisson, L.F. (1991). Influence of nitrogen on yeast and fermentation of grapes. International
Symposium on Nitrogen in Grapes and Wine (pp. 78-89). Davis: American society for
Enology and Viticulture.
Bisson, L.F. (1999). Stuck and sluggish fermentations. American Journal of Enology and
Viticulture, 50, 107-117.
Bisson, L.F. (2000). Glucose transport in Saccharomyces cerevisiae and the role of
potassium in stuck fermentations. In Lallemand (Ed.), Inoculation Rate and Nutritional
Aspects. Keys Points for Good Alcoholic Fermentation Management (pp. 27-33). Krems.
Blanchard, L., Darriet, P., & Dubourdieu, D. (2004). Reactivity of 3-mercaptohexanol in red
wine: impact of oxygen, phenolic fractions, and sulfur dioxide. American Journal of Enology
and Viticulture, 55 (2), 115-120.
Blank, I. (2002). Sensory relevance of volatile organic sulfur compounds in food. In G.A.
Reineccius & T.A. Reineccius (Eds.), Heteroatomic Aroma Compounds. ACS Symposium
Series 82 (pp. 25-53). Washington: American Chemical Society.
Blateyron, L., & Sablayrolles, J.M. (2001). Stuck and slow fermentations in enology:
statistical study of causes and effectiveness of combined additions of oxygen and
diammonium phosphate. Journal of Bioscience and Bioengineering, 91, 184-189.
Boehringer Mannheim. (1998). Methods of Biochemical Analysis and Food Analysis,
Boehringer Mannheim GmbH, Mannheim, Germany.
Boekhout, T., & Kurtzman, C.P. (1996). Principles and methods used in yeast classification,
and an overview of currently accepted yeast genera. In K. Wolf (Ed.), Non-conventional
Yeasts in Biotechnology: a Handbook (pp. 1-81). Berlin: Springer Verlag.
Boekhout, T., & Phaff, H.J. (2003). Yeast biodiversity. In T. Boekhout & V. Robert (Eds.),
Yeasts in Food: Benificial and Detrimental Aspects (pp. 1-38). Hamburg: B. Behr's Verlag
GmbH & Co.

220
Bohlscheid, J.C., Fellman, J.K., Wang, X.D., Ansen, D., & Edwards, C.G. (2007). The
influence of nitrogen and biotin interaction on the performance of Saccharomyces in alcoholic
fermentation. Journal of Applied Microbiology, 102, 390-400.
Bora, P.S., & Narain, N. (1997). Passion fruit. In S. Mitra (Ed.), Postharvest Physiology and
Storage of Tropical and Subtropical Fruits (pp. 375-386). New York: CAB International.
Bouchilloux, P., Darriet, P., Henry, R., Lavigne-Cruège, V., & Dubourdieu, D. (1998).
Identification of volatile and powerful thiols in Bordeaux wines. Journal of Agricultural and
Food Chemistry, 46, 3095-3099.
Boulton, R.B., Singleton, V.L., Singleton, V.L., & Bisson, L.F. (2009). Principles and Practices
Of Winemaking. New York: Springer-Verlag New York, LLC.
Bowyer, P., Gourraud, C., van der Westhuizen, T., & Murat, M.L. (2008). Yeast strain and
nutritional modulation of aroma intensity, longevity and winemaker preference in Sauvignon
blanc. The Australian and New Zealand Grapegrower and Winemaker, Annual Technical
Issue, 47-58.
Bowyer, P., Murat, M.L., & Moine-Ledoux, V. (2010). Glutathione: Aroma preservation in
white/rosé wines. Practical Winery & Vinyard, May/June 2010, online:
www.practicalwinery.com/mayjun10/aroma1.htm (Access 21 June 2010).
Boze, H., Moulin, G., & Galzy, P. (1992). Production of food and fodder yeasts. Critical
Reviews in Biotechnology, 12, 65-86.
Brajkovich, M., Tibbits, N., Peron, G., Lund, C.M., Dykes, S.I., Kilmartin, P.A., & Nicolau, L.
(2005). Effect of screwcap and cork closures on SO2 levels and aromas in a Sauvignon
Blanc wine. Journal of Agricultural and Food Chemistry, 53, 10006-10011.
Brat, P, Brillouet, J.-M., Reynes, M., Cogat, P.-O., & Olle, D. (2000). Free volatile
components of passion fruit puree obtained by flash vacuum-expansion. Journal of
Agricultural and Food Chemistry, 48, 6210-6214.
Brat, P., Thi Hoang, L.N., Soler, A., Reynes, M., & Brillouet, J-M. (2004). Physicochemical
characterization of a new pineapple hybrid (FLHORAN41 Cv.). Journal of Agricultural and
Food Chemistry, 52 (20), 6170-6177.

221
Brückner, H., & Koza, A. (2003). Solution phase synthesis of the 14-residue peptaibol
antibiotic trichovirin I. Amino Acids, 24, 311-323.
Brückner, H., & Pätzold, R. (2006). Sind D-aminosaeuren gute molekulare Marker in
Lebensmitteln? Pro und Kontra. Lebensmittelchemie, 60, 141-142.
Brückner, H., & Westhauser, T. (2003). Chromatographic determination of L- and D-amino
acids in plants. Amino Acids, 24, 43-55.
Bumberger, E., & Belitz, H.D. (1993). Bitter taste of enzymatic hydrolysates of casein. I.
Isolation, structural and sensorial analysis of peptides from tryptic hydrolysates of β-casein.
Zeitschrift für Lebensmittel-Untersuchung und –Forschung, 197, 14-19.
Butzke, C.E. (1998) Survey of yeast-assimilable nitrogen status in musts from California,
Oregon, and Washington. American Journal of Enology and Viticulture, 49, 220-224.
Buzzini, P., & Vaughan-Martini, A. (2006). Yeast biodiversity and biotechnology. In C. Rosa
& G. Péter (Eds.), Biodiversity and Ecophysiology of Yeasts: the Yeast Handbook (pp. 533-
559). Berlin: Springer.
Caridi, A. (2002). Protective agents used to reverse the metabolic changes induced in wine
yeasts by concomitant osmotic and thermal stress. Letters in Applied Microbiology, 35 (2),
98-101
Caridi, A., Crucitti, P., & Ramondino, D. (1999). Winemaking of musts at high osmotic
strength by thermotolerant yeasts. Biotechnology Letters, 21 (7), 617-620.
Carnevillier, V., Charpentier, C., & Feuillat, M. (2000). Production de Peptides par
Saccharomyces cerevisiae au Cours de la Fermentatio et de L‘Autolyse sur Moût
Chardonnay. 6e Symposium International d'œnologie (pp. 287-289). Paris.
Carrau, F.M., Medina, K., Boido, E., Farina, L., Gaggero, C., Dellacassa, E., Versini, G., &
Henschke, P.A. (2005). De novo synthesis of monoterpenes by Saccharomyces cerevisiae
wine yeasts. FEMS Microbiology Letters, 243, 107-115.

222
Carrau, F.M., Medina, K., Farina, L., Boido, E., Henschke, P.A. & Dellacassa, E. (2008).
Production of fermentation aroma compounds by Saccharomyces cerevisiae wine yeasts:
effect of yeast assimilable nitrogen on two model strains. FEMS Yeast Research, 1-12.
Caruso, M., Fiore, C., Contursi, M., Salzano, G., Paparella, A., & Romano, P. (2002).
Formation of biogenic amines as criteria for the selection of wine yeasts. World Journal of
Microbiology and Biotechnology, 18, 159-163.
Casimir, D.J., Kefford, J.F., & Whitfield, F.B. (1981). Technology and flavor chemistry of
passion fruit juices and concentrate. Advances in Food Research, 27, 243-295.
Cecchi, H., & Rodriguez-Amaya, D.B. (1981). Carotenóides and vitamina A in processed
passion-fruit juice (carotenoids and vitamin A value in processed passion fruit juice). Ciencia
e Cultura, 33, 72−76.
Charoenchai, C., Fleet, G.H., Henschke, P.A., & Todd, B.E.N. (1997). Screen of non-
Saccharomyces wine yeasts for the presence of extracellular hydrolytic enzymes. Australian
Journal of Grape Wine Research, 3, 2-8.
Chassagne, D., Boulamger, R., & Crouzet, J. (1999). Enzymatic hydrolysis of edible
Passiflora fruit glycosides. Food Chemistry, 66, 281-288.
Chassagne, D., Crouzet, J., Bayonove, C.L., Brillouet, J.M., & Baumes, R.L. (1996 a). 6-O-α-
L-Arabinopyranosyl-β-D-glucopyranosides as aroma precursors from passion fruit.
Phytochemistry, 41, 1497-1500.
Chassagne, D., Crouzet, J., Bayonove, C.L., & Baumes, R.L. (1996 b). Identification and
quantification of passion fruit cyanogenic glycosides. Journal of Agricultural and Food
Chemistry, 44, 3817-3820.
Chen, C.-C., Kuo, M.-C., Hwang, L.S., Wu, J.S.-B., & Wu, C.-M. (1982). Headspace
components of passion fruit juice. Journal of Agricultural and Food Chemistry, 30, 1211-1215.
Cheraiti, N., Guezenec, S., & Salmon, J.M. (2005). Redox interactions between
Saccharomyces cerevisiae and Saccharomyces uvarum in mixed culture under enological
conditions. Applied and Environmental Microbiology, 71, 255-260.

223
Cheynier, V., Souquet, J.M., & Moutounet, M. (1989). Glutathione content and glutathione to
hydroxyl-cinnamic acid ratio in Vitis vinifera grapes and musts. American Journal of Enology
and. Viticulture, 40, 320-324.
Cheynier, V., Trousdale, E. Singleton, V.L., Salgues, M., & Wylde, R. (1986).
Characterization of 2-S-glutathionyl caftaric acid and its hydrolysis in relation to grape wines.
Journal of Food Science, 34, 217-221.
Chomsri, N. (2008). Impact of Protease Activity of Yeasts on Wine Fermentation and
Formation of Volatile and Non-volatile Metabolites. Dissertation, Justus-Liebig-University
Giessen, Germany.
Choné, X., Lavigne-cruège, V., Tominaga, T., Van Leeuwen, C., Castagnéde, C., Saucier, C.,
& Dubourdieu, D. (2006). Effect of vine nitrogen status on grape aromatic potential: flavour
precursor (S-cysteine conjugates), glutathione and phenolic content in Vitis vinifera L. c.v.
Sauvignon blanc grape juice. Journal International des Sciences de la Vigne et du Vin, 40, 1-
6.
Ciani, M. & Maccarelli, F. (1998). Oenological properties of non-Saccharomyces yeasts
associated with wine-making. World Journal of Microbiology and Biotechnology, 14, 199-203.
Clarke, R.J., & Bakker, J. (2004). Wine: Flavour Chemistry. United Kingdom: Blackwell
Publishing Ltd.
Clemente-Jimenez, J.M., Mingorance-Cazorla, L., Martinez-Rodriguez, S., Las Heras-
Vazquez, F.J., & Rodriguez-Vico, F. (2005). Influence of sequential yeast mixtures on wine
fermentation. International Journal of Food Microbiology, 98, 301-308.
Cole, V.C., & Noble, A.C. (2003). Flavour chemistry. In A.G.H. Lea, & J.R. Piggott (Eds.),
Fermented Beverage Production (pp. 393-412), 2nd Ed. London: Blackie Academic and
Professional.
Colombié, S., Malherbe, S., & Sablayrolles, J.M. (2005). Modeling alcoholic fermentation in
enological conditions: Feasibility and interest. American Journal of Enology and Viticulture,
56 (3), 238-245.

224
Comuzzo, P., Tat, L., Tonizzo, A., & Battistutta, F. (2005). Yeast derivatives (extracts and
autolysates) in winemaking: Release of volatile compounds and effects on wine aroma
volatility. Food Chemistry, 99, 217-230.
Cooper, T.G. (1982). Nitrogen metabolism in Saccharomyces cerevisiae. In J.N. Strathern,
E.W. Jones & J.R. Broach (Eds), The Molecular Biology of the Yeast Saccharomyces:
Metabolism and Gene Expression (pp. 39-99). New York: Cold Spring Harbor Laboratory
Press, Cold Spring Harbor.
Cooper, T.G., & Sumrada, R.A. (1983). What is the function of nitrogen catabolic repression
in Saccharomyces cerevisiae?. Journal of Bacteriology, 155, 623-627.
Corison, C. A., Ough, C. S., Berg, H. W., & Nelson, K. E. (1979). Must acetic acid and ethyl
acetate as mold and rot Indicators in grapes. American Journal of Enology and Viticulture, 30
(2), 130-134.
Cramer, A.C., Vlassides, S., & Block, D.E. (2002) Kinetic model for nitrogen-limited wine
fermentations. Biotechnology and Bioengineering, 77, 49-60.
Crochemore, M.C., Molinari, H.B.C., & Vieira, L.G.E. (2003). Genetic diversity in passion fruit
(Passiflora spp.) evaluated by RAPD markers. Brazilian Archives of Biology and Technology,
46 (4), 521-527.
Curtin, C., Travis, B., Osidacz, O., Kievit, R., Bramley, B., & Francis, L. (2009). Yeast
modulation of cool-climate Chardonnay sensory profiles and consumer preferences.
Proceeding of LES XXIes ENTRETIENS SCIENTIFIQUES LALLEMAND (pp. 7-12), April 24,
2009. Germany: Geisenheim Research Center.
Czyhrinciw, K.N. (1966). The technology of passion fruit and mango fruit wine. American
Journal of Enology and Viticulture, 17 (1), 27-30.
da Cruz, S.H., Cilli, E.M., & Ernandes, J.R. (2002). Structural complexity of the nitrogen
source and influence on yeast growth and fermentation. Journal of the Institute of Brewing,
108, 54-61.

225
Da Porto, C., & Battistutta, F. (1995). Effects of an unconventional oenological technique on
the evolution of free and glycosidically bound terpenols of Muscat of Ganelli grapes:
preliminary results. Journal of Wine Research, 6 (3), 207-213.
Darriet, P. (2002). Caractérisation des composés volatils associés à la vigne et au vin.
Applications Technologiques. Université Victor Segalen Bordeaux.
Darriet, P., Lavigne, V., Boidron, J.N., & Dubourdieu, D. (1991). Caractérisation de l'arôme
variétal des vins de Sauvignon par couplage chromatographie en phase gazeuse-
olfactométrie (Characterization of Sauvignon wine varietal aroma by gas chromatography-
olfactometry). Connaiss. Vigne Vin, 25, 167-174.
Darriet, P., Tominaga, T., Demole, E., & Dubourdieu, D. (1993). Mise en évidence dans le
raisin de Vitis vinifera (var. Sauvignon) d‗un précurseur de la 4-mercapto-4-méthylpentan-2-
one (Evidence of the presence of a 4-mercapto-4-methylpentan-2-one precursor in Vitis
vinifera Sauvignon blanc grape variety). Comptes rendus de l'Académie des sciences. Série
3, Sciences de la vie, 316, 1332−1335.
Darriet, P., Tominaga, T., Lavigne, V., Boidron, J.-N., & Dubourdieu, D. (1995). Identification
of a powerful aromatic component of Vitis vinifera L. var. Sauvignon wines: 4-Mercapto-4
methylpentan-2-one. Flavour and Fragrance Journal, 10, 385-392.
Davis, L., & Metzler, D.E. (1972). Pyridoxal-linked elimination and replacement reactions. In
P.D. Boyer (Ed.), The enzymes (pp. 33-74), 3rd Ed., Vol. 7. New York: Academic Press.
Delfini, C., Castino, M., & Ciolfi, G. (1980). Thiamin addition to musts to reduce ketoacid
formation and increase the efficacy of SO2 in wines. Rivista di Viticoltura e di Enologia, 33
(12), 572–589.
Delfini, C., & Vormica, J. V. (2001). Wine Microbiology: Science and Technology. New York:
Marcel Dekker.
Delcroix, A., Günata, Y.Z., Sapis, J.C., Salmon, J.M., & Bayonove, C. (1994). Glycosidase
activities of 3 enological yeast strains during winemaking – Effect on the terpenol content of
Muscat wine. American Journal of Enology and. Viticulture, 45, 291-296.

226
Deliza, R., MacFie, H., & Hedderley, D. (2005). The consumer sensory perception of
passion-fruit juice using free-choice profiling. Journal of Sensory Study, 20 (1), 17-27.
Demole, E., Enggist, P., & Ohloff, G. (1982). 1-p-Methene-8-thiol: a powerful flavor impact
constituent of grapefruit juice (Citrus paradisi Macfayden). Helvetica Chimica Acta, 65,
1785−1794.
De Mora, S.J., Eschenbruch, R., Knowless, S.J., & Spedding, D.J. (1986). The formation of
dimethyl sulphide during fermentation using a wine yeast. Food Microbiology, 3, 27-32.
De Mora, S.J., Knowless, S.J., Eschenbruch, R., & Torrey, W.J. (1987). Dimethyl sulphide in
some Australian red wines. Vitis, 26, 79-84.
De Neira, C.M. (2003). The Effect of yellow Passion Fruit, Passiflora edulis Flavicarpa,
Phytochemicals on Cell Cycle Arrest and Apoptosis of Leukemia Lymphoma Molt-4 Cell Line.
Master Thesis. Florida, USA: The University of Florida.
Dequin, S., Salmon, J.M., Nguyen, H.V., & Blondin, B. (2003). Wine yeasts. In T. Boekhout &
V. Robert (Eds.), Yeasts in Food: Benificial and Detrimental Aspects (pp. 389-412), Hamburg:
B. Behr's Verlag GmbH & Co.
Desportes, C., Charpentier, M., Duteurtre, B., Maujean, A., & Duchiron, F. (2000). Liquid
chromatographic fractionation of small peptides from wine. Journal of Agricultural and Food
Chemistry, 893, 281-291.
Dharmadhikari, M. (2001). Nitrogen metabolism during fermentation. Vineyard & Vintage
View, 17 (2), 5-7.
Dickinson, J. R. (2004). Nitrogen metabolism. In J. R. Dickinson & M. Schweizer (Eds.), The
Metabolism and Molecular Physiology of Saccharomyces cerevisiae (pp. 104-116). Boca
Raton: CRC Press.
Di Stefano, R., Maggiorotto, G., & Gianotti, S. (1992). Transformazioni di nerolo e geraniolo
indotte dai lieviti. Rivista di Viticultura e di Enología, 1, 43-49.
Dittrich, H.H. (1987). Mikrobiologie des Weines. 2nd Ed. Sttuttgart, Germany: Verlag Eugen
Ulmer.

227
Dittrich, H. H., & Großmann, M. (2005). Mikrobiologie des Weines. Stuttgart: Ulmer.
Dizy, M., & Polo, M.C. (1996). Changes of the concentration of nitrogenous compounds
during fermentation of must at pilot-plant scale. Food Science and Technology International,
2, 87-93.
Doco, T., Vuchot, P., Cheynier, V., & Moutounet, M. (2003). Structural modification of wine
arabinogalactans during aging on lees. American Journal of Enology and Viticulture, 54 (3),
150-157.
Dubourdieu, D., & Lavigne-Cruège, V. (2002). Role of glutathione on development of aroma
defects in dry white wines. In H. Trogus, J. Gafner, & A. Sütterin (Eds.), Proceeding of the
13th International Enology Symposium, Management and Wine Marketing, Montpellier (pp.
331-347). Breisach Germany: TS Verlag, Neuenburg am Rhein.
Dubourdieu, D., Tominaga, T., Masneuf-Pomarède, I., Peyrot des Gachons, C., & Murat, M.L.
(2006). The role of yeast in grape flavour development during fermentation: The example of
Sauvignon blanc. American Journal of Enology and Viticulture, 57, 81-88.
Dugelay, I., Gunata, Z., Sapis, J.C., Baumes, R., & Bayonove, C. (1992). Etude de l‘origine
du citronellol dans le vins. Journal International des Sciences de la Vigne et du Vin, 26, 177-
184.
Dukes, B.C. & Butzke, C.E. (1998). Rapid determination of primary amino acid in grape juice
using an o-phthaldialdehyde/N-acetly-L-cysteine spectrometric assay. American Journal of
Enology and Viticulture, 49, 125-134.
Duncan, W.S., & Derek, J.J. (1996). Glutathione is an important molecule in the yeast
Saccharomyces cerevisiae. FEMS Microbiology Letters, 141, 207-212.
Duteurtre, B., Bourgeosis, C., & Chollot, B. (1971) Study of the assimilation of proline by
brewing yeast. Journal of the Institute of Brewing, 77, 28-35.
Du Toit, J.W., Lisjak, K., Stander, M., & Prevoo, D. (2007). Using LC-MSMS to assess
glutathione levels in South African white grape juices and wine made with different level of
oxygen. Journal of Agricultural and Food Chemistry, 55, 2765-2769.

228
Ebeler, S.E., & Thorngate, J.H. (2009). Wine chemistry and flavor: Looking into crystal glass.
Journal of Agricultural and Food Chemistry, 57, 8098-8108.
Eden, A., Van Nedervelde, L., Drukker, M., Benvenisty, N., & Debourg, A. (2001).
Involvement of branched-chain amino acid aminotranferases in the production of fusel
alcohols during fermentation in yeast. Applied Microbiology and Biotechnology, 55, 296-300.
Edwards, C.G., & Bohlscheid, J.C. (2007). Impact of pantothenic acid addition on H2S
production by Saccharomyces under fermentative conditions. Enzyme and Microbial
Technology, 41, 1-4.
Eglinton, J.M., & Henschke, P.A. (1996). Saccharomyces cerevisiae strains AWRI 838,
Lalvin EC1118 and Maurivin PDM do not produce excessive sulfur dioxide in white wine
fermentations. Australian Journal of Grape and Wine Research, 2, 77-83.
Elskens, M.T., Jasper, C.J., & Penninckx, M. (1991). Glutathione as an endogenous sulfur
source in the yeast Saccharomyces cerevisiae. Journal of General Microbiology, 137, 637-
644.
Engel, K.-H. (1999). The importance of sulfur-containing compounds to fruit flavors. In R.
Teranishi, E.L. Wick & I. Hornstein (Eds), Flavor Chemistry: Thirty Years of Progress (pp.
265-273). New York: Kluwer Academic/Plenum Publishers,
Engel, K.-H., & Tressl, R. (1983). Formation of aroma components from nonvolatile
precursors in passion fruit. Journal of Agricultural and Food Chemistry, 31, 998-1002.
Engel, K.-H., & Tressl, R. (1991). Identification of new sulfur-containing volatiles in yellow
passion fruits (Passiflora edulis f. flavicarpa). Journal of Agricultural and Food Chemistry, 39,
2249-2252.
Erasmus, D.J., Cliff, M., & van Vuuren, H.J.J. (2004). Impact of yeast strain on the production
of acetic acid, glycerol, and the sensory attributes of Icewine. American Journal of Enology
and Viticulture, 55 (4), 371-378.
Eschenbruch, R. (1974). Sulfite and sulfide formation during winemaking – A review.
American Journal of Enology and Viticulture, 25, 157-161.

229
Escot, S., Feuillat, M., Dulau, L., & Charpentier, C. (2001). Release of polysaccharides by
yeasts and the influence of released polysaccharides on colour stability and wine astringency.
Australian Journal of Grape and Wine Research, 7 (3), 153-159.
Fedrizzi, B., Mango, F., Badocco, D., Nocolini, G., & Versini, G. (2007). Aging effects and
grape variety dependence on the content of sulfur volatiles in wine. Journal of Agricultural
and Food Chemistry, 55 (26), 10880-10887.
Fang, T., Chen, H.E., & Chiou, L.M.J. (1986). Effects of heat treatment and subsequent
storage on the quality of passion fruit (Passiflora edulis) juice, 19th Symposium of
International Federation of Fruit Juice Producers, Den Haag, Netherlands.
Fernández-González, M., & Di Stefano, R. (2004). Fractionation of glycoside aroma
precursors in neutral grapes. Hydrolysis and conversion by Saccharomyces cerevisiae.
Lebensmittel-Wissenschaft und-Technologie, 37, 467-473.
Fernández-González, M., Di Stefano, R., & Briones, A. (2003). Hydrolysis and transformation
of terpene glycosides from muscat must by different yeast species. Food Microbiology, 20,
35-41.
Ferreira, V., Ortín, N., & Cacho, J.F. (2007). Optimization of a procedure for the selective
isolation of some powerful aroma thiols. Development and validation of a quantitative method
for their determination in wine. Journal of Chromatography A, 1143, 190-198.
Ferreira, R.B., Picarra-Pereira, M.A., Monteiro, S., Loureiro, V. B., & Teixeira, A.R. (2002).
The wine proteins. Trends in Food Science & Technology, 12, 230-239.
Feuillat, M. (2005). Use of yeasts in Burgundy and in other regions: fermentation and aging
on lees. Les XVIIe
scientitiques Lallemand (pp. 27-32). La Rioja: Lallemand.
Feuillat, M., & Guerreau, J. (1996). Les nouveaux activateurs de la fermentation alcoolique
Bulletin de l'OIV, 789-790, 987-998.
Fisher, U. (2007). Wine aroma. In R.G. Berger (Ed.), Flavours and Fragances: Chemistry,
Bioprocessing and Sustainability (pp. 241-267). Berlin Heidelberg.

230
Fleet, G.H. (1992). Spoilage yeasts. Critical Reviews in Biotechnology, 1, 1-44.
Fleet, G.H. (1993). The microorganisms of wine making: Isolation enumeration and
identification. In G. H. Fleet (Ed.), Wine Microbiology and Biotechnology (pp. 1-26). Chur:
Harwood Academic Publishers.
Fleet, H.H. (1998). Microbiology of alcoholic beverages. In B.J. Wood (Ed.), Microbiology of
Fermented Foods (pp. 217-262), 2nd Ed., Volume 1. London: Blackie.
Fleet, G.H. (2003). Yeast interactions and wine flavor. International Journal of Food
Microbiology, 86, 11-22.
Fleet, G.H. (2006). The commercial and community significance of yeasts in food and
beverage production. In A. Querol & G.H. Fleet (Eds.), The Yeast Handbook: Yeasts in Food
and Beverages (pp. 1-12). Heidelberg: Springer.
Fleet, G.H. (2007). Yeasts in foods and beverages: impact on product quality and safety.
Current Opinion in Biotechnology, 18, 1-6.
Fleet, G.H., & Heard, G. (1993). Yeast growth during fermentation. In G. H. Fleet (Eds), Wine
Microbilology and Biotechnology (pp. 27-54). Chur: Harwood Academic Publishers.
Francis, I.L., & Newton, J. L. (2005). Determining wine aroma from composition data. In R.J.
Blair, M.E. Francis, & I.S. Pretorius (Eds.), Advances in Wine Science-Commemorating 50
Years of The Australian Wine Research Institute (pp. 201-212). The Australian Wine
Research Institute.
Francis, I.L., Sefton, M.A., & Williams, P.J. (1992). Sensory descriptive analysis of the aroma
of hydrolysed precursor fractions from Semillon, Chardonnay and Sauvignon blanc grape
juices. Journal of the Science of Food and Agriculture, 59, 511-520.
Francis, I.L., Tate, M.E., & Williams, P.J. (1996). The effect of hydrolysis conditions on the
aroma released from Semillon grape glycosides. Australian Journal of Grape and Wine
Research, 2, 70-76.

231
Fröhlich-Wyder, M.-T., (2003). Yeasts in dairy products. In T. Boekhout & V. Robert (Eds.),
Yeasts in Food: Benificial and Detrimental Aspects (pp. 1-38). Hamburg: B. Behr's Verlag
GmbH & Co.
Fuganti, C., & Grasselli, P. (1985). Stereochemistry and synthetic applications of products of
germentation of α-β-unsaturated aromatic aldehydes by baker‘s yeast. In R. Porter & S. Clark
(Eds.), Enzymes in Organic Synthesis, Ciba Foundation Symposium 111 (pp. 112-125).
London: Pitman.
Fugelsang, K.C., & Edwards, C.G. (2007). Wine Microbiology: Practical Applications and
Procedures . 2nd Ed. New York: Springer.
Fukuda, K., Yamamoto, N., Kiyokawa, Y., Yanagiuchi, T., Wakay, Y., Kitamoto, K., Inoue, Y.,
& Kimura, A. (1998). Balance of activities of alcohol acetyltransferase and esterase in
Saccharomyces cerevisiae is important for production of isoamyl acetate. Applied and
Environmental Microbiology, 64, 4076–4078.
Fukui, M., & Yokotsuka, K. (2003). Content and origin of protein in white and red wines:
changes during fermentation and maturation. American Journal of Enology and Viticulture,
54, 178-188.
Garde-Cerdán, T., & Ancín-Aypilicueta, C. (2007). Effect of the addition of different qualities
of amino acids to nitrogen-deficient must on the formation of esters, alcohols, and acids
during wine alcoholic fermentation. LWT-Food Science and Technology, 41, 501-510.
Gardini, F., Zaccarelli, A., Belletti, N., Faustini, F., Cavazza, A., Martuscelli, M., Mastrocola,
D., & Suzzi, G. (2005). Factors influencing biogenic amine production by a strain of
Oenococcus oeni in a model system. Food Control, 16 (7), 609-616.
Giudici, P., & Kunkee, R.E. (1994). The effect of nitrogen deficiency and sulfur-containing
amino acids on the reduction of sulfate to hydrogen sulfide by wine yeast. American Journal
of Enology and Viticulture, 45, 107-112.
Gockowiak, H., & Henschke, P.A. (1992). Nitrogen composition of grape juice and
implications for fermentation: results of a survey made in N-E Victoria. Australian
Grapegrower and Winemaker Annual Technical, 340, 131, 133-138.

232
Goniak, O.J., & Noble, A.C (1987). Sensory study of selected volatile sulfur-compounds in
white wine. American Journal of Enology and Viticulture, 38, 223-227.
Grant-Preece, P.A, Pardon, K.H, Capone, D.L, Cordente, A.G, Sefton, M.A, Jeffery, D.W, &
Elsey, G.M. (2010). Synthesis of wine thiol conjugates and labeled analogues: fermentation
of the glutathione conjugate of 3-mercaptohexan-1-ol yields the corresponding cysteine
conjugate and free thiol. Journal of Agricultural and Food Chemistry, 58 (3), 1383-1389.
Grenson, M., Dubois, E., Piotrowska, M., Drillien, R., & Aigle, M. (1974). Ammonia
assimilation in Saccharomyces cerevisiae as mediated by the two glutamate
dehydrogenases: Evidence for the gdhA locus being a structural gene for the NADP-
dependent glutamate dehydrogenase. Molecular & General Genetic, 128, 73-85.
Gross, J. (1987). Pigments in Fruits. London: Academic Press.
Großmann, M., Linsenmeyer, H., Muno, H. & Rapp, A. (1996). Use of oligo-strain yeast
cultures to increase complexity of wine aroma. Viticultural and Enological Science, 51, 175-
179.
Großmann, M., Suckrau, A., & Rapp, A. (1990). Einfluß kellertechnischer Maßnahmen auf
das Sortenbukett. Weinwirtschaft-Technik, 8, 13-16.
Günata, Z., Bayonove, C., Baumes, R., & Cordonnier, R. (1985). Stability of free and bound
fractions of some aroma components of grape cv. Muscat during the wine processing.
American Journal of Enology and Viticulture, 37, 112-114.
Gutierrez, L.E. (1993). Effect of some vitamins and micronutrient deficiencies on the
production of higher alcohols by Saccharomyces cerevisiae. Scientia Agricola, 50 (3), 484-
489.
Guth, H. (1997 a). Identification of character impact odorants of different white wine varieties.
Journal of Agricultural and Food Chemistry, 45, 3022-3026.
Guth H. (1997 b). Quantification and sensory studies of character impact odorants of
different white wine varieties. Journal of Agricultural and Food Chemistry, 45, 3027-3032.

233
Guth, H. (1998). Comparison of different white wine varieties by instrumental analysis and
sensory studies. In L.A Waterhouse, & S.E. Ebeler (Eds.), Chemistry of Wine Flavour (pp.
39-52). San Francisco, USA: ACS Symposium Series 714.
Hallinan, P., Saul, D.J., & Jiranek, V. (1999). Differential utilisation of sulfur compounds for
H2S liberation by nitrogen-starved wine yeasts. Australian Journal of Grape and Wine
Research, 5, 82-90.
Hansen, J., Cherest, H., & Kielland-Brandt, M.C. (1994). Two divergent MET10 genes, one
from Saccharomyces cerevisiae and one from Saccharomyces carlsbergensis, encode the
alpha subunit of sulfite reductase and specify potential binding sites for FAD and NADPH.
Journal of Bacteriology, 176, 6050-6058.
Hartnell, P.C., & Spedding, D.J. (1979). Uptake and metabolism of 35S-sulfate by wine yeast.
Vitis, 18, 307-315.
Hazelwood, L.A., Daran, J-M., van Maris, A.J., Pronk, J.T., & Dickinson, J.R. (2008). The
Ehrlich pathway for fusel alcohol production: a century of research on Saccharomyces
cerevisiae metabolism. Applied and Environmental Microbiolgy, 74 (8), 2259-2266.
Heard, G.M. (1999). Novel yeasts in winemaking-looking to the future. Food Australia, 51,
347-352.
Henschke, P.A. (1997). Wine yeasts. In F.K. Zimmermann & K.D. Entian (Eds.), Yeast Sugar
Metabolism (pp. 527-560). Lancaster: Technomic Publishing.
Henschke, P.A., & Jiranek, V. (1991). Hydrogen sulfide formation during fermentation: Effect
of nitrogen composition in model grape musts. Proceedings of International Symposium on
Nitrogen in Grapes and Wine (pp. 172-184), 18-19 June 1991, Seattle Davis, California:
American Society for Enology and Viticulture.
Henschke, P.A., & Jiranek, V. (1993). Yeast-metabolism of nitrogen compounds. In G. H.
Fleet (Ed.), Wine Microbilology and Biotechnology (pp. 77-164). Chur: Harwood Academic
Publishers.

234
Henick-Kling, T., Edinger, W., Daniel, P., & Monk, P. (1998). Selective effects of sulphur
dioxide and yeast starter culture addition on indigenous yeast populations and sensory
characteristics of wine. Journal of Applied Microbiology, 84, 865-867.
Herbert, P., Cabrita, M.J., Ratola, N., Laureano, O., & Alves, A. (2005). Free amino acids
and biogenic amines in wines and musts from the Alentejo region: evolution of amines during
alcoholic fermentation and relationship with variety, sub-region and vintage. Journal of Food
Engineering, 66, 315-322.
Herjavec, S, Podgorski, V., Redźepović, S., & Mirošević, N. (2003). The influence of some
commercial Saccharomyces cerevisiae strains on the quality of Chardonnay wines. Food
Technology and Biotechnology, 44 (1), 77-81.
Hernández, L.F., Espinosa, J.C., Fernández-González, M., & Briones, A. (2003). β-
Glucosidase activity in a Saccharomyces cerevisiae wine strain. International Journal of
Food Microbiology, 80 (2), 171-176.
Hernández-Orte, P., Bely, M., Cacho, J., & Ferreira, V. (2006 a). Impact of ammonium
additions on volatile acidity, ethanol, and aromatic compound production by different
Saccharomyces cerevisiae strains during fermentation in controlled synthetic media.
Australian Journal of Grape and Wine Research, 12, 150-160.
Hernández-Orte, P., Guitart, A., & Cacho, J. (1999). Changes in the concentration of amino
acids during the ripening of Vitis vinifera Tempranillo variety from the Denomination d’Origin
Somonto (Spain). American Journal of Enology and Viticulture, 50, 144–154.
Hernández-Orte, P., Ibarz, M.J., Cacho, J., & Ferreira, V. (2005). Effect of the addition of
ammonium and amino acids to musts of Airen variety on aromatic composition and sensory
properties of the obtained wine. Food Chemistry, 89, 163-174.
Hernández-Orte, P., Ibarz, M.J., Cacho, J., & Ferreira, V. (2006 b). Addition of amino acids to
grape juice of the Merlot variety: effect on amino acid uptake and aroma generation during
alcoholic fermentation. Food Chemistry, 98, 300-310.
Heusinger, G., & Mosandl, A. (1984). Chirale, schwefelhaltige Aromastoffe der gelben
Passionsfrucht. Darstellung der Enantiomeren und absolute Konfiguration. Tetrahedron
Letters, 25, 507-510.

235
Hock, R., Benda, I., & Schreier, P. (1984). Formation of terpenes by yeasts during alcoholic
fermentation. Zeitschrift für Lebensmitteluntersuchung und -Forschung A, 179, 450-452.
Howell, K.S., Swiegers, J.H., Elsey, G.M., Siebert, T.E., Bartowsky, E.J., Fleet, G.H.,
Pretorius, I.S., & de Barros Lopes, M.A. (2004). Variation in 4-mercapto-4 methyl-pentan-2-
one release by Saccharomyces cerevisiae commercial wine strains. FEMS Microbiology
Letters, 240, 125-129.
Howell, K.S., Klein, M., Swiegers, J.H., Hayasaka, Yoji., & Elsey, G.M. (2005). Genetic
determinants of volatile-thiol release by Saccharomyces cerevisiae during wine fermentation.
Applied and Environmental Microbiology, 71 (9), 5420-5426.
Howell, K.S., Cozzolino, D., Bartowsky, E., Fleet, G. H., & Henschke, P.A. (2006). Metabolic
profiling as a tool for revealing Saccharomyces interaction during wine fermentation. FEMS
Yeast Research, 71 (9), 5420-5426.
Huang, Z., & Ough, C.S. (1989). Effect of vineyard locations, varieties and rootstocks on the
juice amino acid composition of several cultivars. American Journal of Enology and
Viticulture, 40, 135-139.
Idstein, H., & Schreier, P. (1985). Volatile constituents from guava (Psidium guajava, L.) fruit.
Journal of Agricultural and Food Chemistry, 33 (1), 138-143.
Iland, P., Ewart, A., & Sitters, J. (1993) Techniques for Chemical Analysis and Stability Tests
of Grape Juice and Wine. Australia: Patrick Iland & Wine Promotions.
Ingledew, W.M., Magnus, C.A., & Sosulski, F.W. (1987). Influence of oxygen on proline
utilization during wine fermentation. American Journal of Enology and Viticulture, 38, 246-
248.
Ishibashi, N., Arita, Y., Kanehisa, H., Kouge, K., Okai, H., & Fukui, S. (1987). Bitterness of
leucine-containing peptides. Agricultural and Biological Chemistry, 51, 2389-2394.
Ishibashi, N., Kubo, T., Chino, M., Fukui, H., Shinoda, I., Kiduchi, E., & Okai, H. (1988).
Taste of proline-containing peptides. Agricultural and Biochemistry, 52, 95-98.

236
Itoh, T., Takagi, Y., & Fujisawa, T. (1989). A novel carbon-carbon bond formation in the
course of bakers‘ yeast reduction of cyanoacetone. Tetrahedron Letters, 30, 3811-3812.
Jackson, R.S. (2008). Chemical constituents of grapes and wines. In S.L. Taylor (Ed.), Wine
Science: Principles and Applications (pp. 270-329), 3rd Ed. Oxford, Great Britain: Academic
Press.
Jagtiani, J., Chan, H.T., Jr., & Sakai, W.S. (1988). Tropical Fruit Processing. New York:
Academic Press, Inc.
Jay, J.M., Loessner, M., & Golden, D.A. (2005). Modern Food Microbiology, 7th Ed. New York:
Springer.
Jiranek, V., Langridge, P., & Henschke, P.A. (1995 a). Amino acid and ammonium utilization
by Saccharomyces cerevisiae wine yeasts from a chemically defined medium. American
Journal of Enology and Viticulture, 46, 75-83.
Jiranek, V., Langridge, P., & Henschke, P.A. (1995 b). Regulation of hydrogen sulfide
liberation in wine-producing Saccharomyces cerevisiae strains by assimilable nitrogen.
Journal of Applied and Environmental Microbiology, 61, 461-467.
Jitjaroen, W. (2007). Influence of Yeast Strains and Nutritive Supplements on Enological
Characteristics of Tropical Fruit Wines. Göttingen: Cuvillier Verlag Göttingen.
Jolly, N., Augustyn, O.P.H., & Pretorius, I.S. (2006). The role and use of non-Saccharomyces
yeasts in wine production. South African Journal of Enology and Viticulture, 27, 15-39.
Jordán, M.J., Goodner, K.L., Shaw, P.E. (2000). Volatile components in tropical fruit
essences: yellow passion fruit (Passiflora edulis Sims F. flavicarpa Degner) and banana
(Musa sapientum L.). Proceedings of the Florida State Horticultural Society, 113, 284-286.
Jordán, M.J., Goodner, K.L., & Shaw, P.E. (2002). Characterization of the aromatic profile in
aqueous essence and fruit juice of yellow passion fruit (Passiflora edulis Sims F. Flavicarpa
degner) by GC−MS and GC/O. Journal of Agricultural and Food Chemistry, 50, 1523-1528.

237
Julien, A., Roustan, J.-L., Dulau, L., & Sablayrolles, J. M. (2000). Comparison of nitrogen and
oxygen demands of enological yeasts: Technological consequences. American Journal of
Enology and Viticulture, 51 (3), 215-222.
Kang, T., & Liang, N. (1997). Studies on the inhibitory effects of quercetin on the growth of
HL-60 leukemia cells. Biochemical Pharmacology, 54, 1013-1018.
King, S.E., Swiegers, H.J., Travis, B., Francis, L.I., Bastian, E.P.S., & Pretorius, I.S. (2008).
Coinoculated fermentations using Saccharomyces yeasts affect the volatile composition and
sensory properties of Vitis vinifera L. cv. Sauvignon blanc wines. Journal of Agricultural and
Food Chemistry, 56, 10829-10837.
Kunkee, R.E. (1991). Relationship between nitrogen content of must and sluggish
fermentation. In J. M. Rantz (Ed.), Proceedings of the International Symposium on Nitrogen
in Grapes and Wine (pp. 148-155), 18-19 June 1991, Seattle Davis, California: American
Society for Enology and Viticulture.
Kurtzman, C.P. (1998). 51. Torulaspora Lindner. In C.P. Kurtzman & J.W. Fell (Eds.), The
Yeast: a Taxonomic Study (pp. 404-408). Amsterdam: Elsevier.
Kurtzman, C.P., & Fell, J.W. (2006). Yeast systematics and phylogeny: implications of
molecular identification methods for studies in ecology. In C. Rosa, & G. Péter (Eds.),
Biodiversity and Ecophysiology of Yeasts: The Yeast Handbook (pp. 11-30). New York:
Springer.
Lafon-Lafourcade, S., Geneix, C., & Ribéreau-Gayon, P. (1984). Ways of initiating the action
of yeast ghost during winemaking. Connaissance de la Vigne et du Vin, 18, 111-125.
Lagunas, R., Dominguez, C., Busturia, A., & Saez, M.J. (1982). Mechanisms of appearance
of the Pasteur effect in Saccharomyces cerevisiae: Inactivation of sugar transport systems.
Journal of Bacteriology, 152, 19-25.
Lambrechts, M.G., & Pretorius, I.S. (2000). Yeast and its importance to wine aroma: A review.
South African Journal of Enology and Viticulture, 21, 97–129.
Large, P.J. (1986). Degradation of organic nitrogen compounds by yeasts. Yeast, 2, 1-34.

238
Larsson, C., Páhlman, I.L., Ansell, R., Rigoulet, M., Adler, L., & Gustafsson, L. (1998). The
importance of the glycerol 3-phosphate shuttle during aerobic growth of Saccharomyces
cerevisiae. Yeast, 14 (4), 347-57.
Lavigne, V., Pons, A., & Dubourdieu, D. (2007). Assay of glutathione in must and wines
using capillary electrophoresis and laser-induced fluorescence detection: Changes in
concentration in dry white wines during alcoholic fermentation and aging. Journal of
Chromatography A, 1139, 130-135.
Lehtonen, P. (1996). Determination of amines and amino acids in wine — A review.
American Journal of Enology and Viticulture, 47, 127-133.
Leitão, M.C., Teixeira, H.C., Crespo, M.T., & Romão, M.V. (2000). Barreto San biogenic
amines occurrence in wine. Amino acid decarboxylase and proteolytic activities expression
by Oenococcus oeni. Journal of Agricultural and Food Chemistry, 48, 2780-2784.
Lehmann, D., Dietrich, A., Hener, U., & Mosandl, A. (1994). Stereoisomeric flavour
compounds. LXX: 1-p-menthene-8-thiol: Separation and sensory evaluation of the
enantiomers by enantioselective gas chromatography-olfactometry. Phytochemical Analysis,
6 (5), 255-257.
Lemperle, E., & Lay, H. (1989). Zusammensetzung und Beurteilung der Weiner. In G. Würdig,
& R. Woller (Eds.), Chemie des Weines (pp. 568-571). Stuggart, Germany: Verlag Eugen
Ulmer.
Leppänen, O.A., Denslow, J., Ronkainen, P.P. (1979). A gas chromatographic method for
the accurate determination of low concentration of volatile sulfur compounds in alcoholic
beverages. Journal of the Institute of Brewing, 85, 350-362.
Leppänen, O.A., Denslow, J., Ronkainen, P.P. (1980). Determination of thiolacetates and
some other volatile sulfur compounds in alcoholic beverages. Journal of Agricultural and
Food Chemistry, 28 (2), 359–362.
Lilly, M., Bauer, F.F., & Lambrechts, M.G. (2006). The effect of increased yeast alcohol
acetyltransferase and esterase activity on the flavour profiles of wine and distillates. Yeast,
23, 641-659.

239
Lilly, M., Lambrechts, M.G., & Pretorius, I.S. (2000). Effect of increased yeast alcohol
acetyltransferase activity on flavor profiles of wine and distillates. Applied Environmental
Microbiology, 66, 744-753.
Linderholm, A.L., Findleton, C.L., Kumar, G., Hong, Y., & Bisson, L.F. (2008). Identification of
genes affecting hydrogen sulfide formation in Saccharomyces cerevisiae. Applied
Environmental Microbiology, 74, 1418-1427.
Loeillet, D. (1995). Refrigerated fruit juices. New outlets for word fruit crops. Fruits, 49, 344-
347.
Lonvaud-Funel, A. (2001). Biogenic amines in wines: role of lactic acid bacteria, FEMS
Microbiology Letters, 199, 9–13.
Loscos, N., Hernandez-Orte, P., Cacho, J., & Ferreira, V. (2007). Release and formation of
varietal aroma compounds during alcoholic fermentation from nonfloral grape odorless flavor
precursors fractions. Journal of Agricultural and Food Chemistry, 55 (16), 6674-6684.
Luan, F., Hampel, D., Mosandl, A., & Wüst, M. (2004). Enantioselective analysis of free and
glycosidically bound monoterpene polyols in Vitis vinifera L. cvs. Morio Muscat and Muscat
Ottonel: evidence for an oxidative monoterpene metabolism in grapes. Journal of Agricultural
and Food Chemistry, 52 (7), 2036-2041.
Lubbers, S., Charpentier, C., Feuillat, M., & Voilley, A. (1994 a). Influence of yeasts walls on
the behavior of aroma compounds in a model wine, American Journal of Enology and
Viticulture, 45, 29-33.
Lubbers, S., Voilley, A., Feuillat, M., & Charpentier, C. (1994 b). Influence of mannoproteins
from yeast on the aroma intensity of a model wine, Lebensmittel – Wissenschaft und
Technology, 27, 108-114.
Magasanik, B., & Kaiser, C.A. (2002). Nitrogen regulation in Saccharomyces cerevisiae.
Gene, 290, 1-18.
Manginot, C., Roustan, J. L., & Sablayrolles, J.M. (1998). Nitrogen demand of different yeast
strains during alcoholic fermentation. Importance of the stationary phase. Enzyme and
Microbial Technology, 23, 511-517.

240
Marais, J. (1983). Terpenes in the aroma of grapes and wines: a review. South African
Journal of Enology and Viticulture, 4, 49-60.
Marks, V.D., van der Merwe, G.K., van Vuuren, H.J. (2003). Transcriptional profiling of wine
yeast in fermenting grape juice: regulatory effect of diammonium phosphate. FEMS Yeast
Research, 3 (3), 269-87.
Marques, A.P., Leitao, M.C., & San Romao, M.V. (2008). Biogenic amines in wines: influence
of oenological factors. Food Chemistry, 107, 853-860.
Martin, F.W., & Nakasone, H.Y. (1970). The edible species of Passiflora. Economic Botanic,
24, 333-43.
Martínez-Rodríguez, A.J., Carrascosa,A.V., Martín-Álverez, P.J., Moreno-Arribas, V., & Polo,
M.C. (2002). Influence of the yeast strain on the changes of the amino acids, peptides and
proteins during sparkling wine production by the traditional method. Journal of Industrial
Microbiology and Biotechnology, 29, 34-322.
Martini, A. (1993). The origin and domestication of the wine yeast Saccharomyces cerevisiae.
Journal of Wine Research, 4, 165-176.
Masneuf-Pomarède, I., Murat, M.L., Naumov, G., Tominaga, T., & Dubourdieu, D. (2002).
Hybrids Saccharomyces cerevisiae x Saccharomyces bayanus var. uvarum having a high
liberating ability of some sulfur varietal aromas of Vitis vinifera Sauvignon blanc wines.
Journal International des Sciences de la Vigne et du Vin, 36 (4), 205-212.
Masneuf-Pomarède, I., Mansour, C., Murat, M., Tominaga, T., & Dubourdieu, D. (2006).
Influence of fermentation temperature on volatile thiols concentration in Sauvignon blac
wines. International Journal of Food Microbiology, 108, 385-390.
Mason, A.B., & Dufour, J.-P. (2000). Alcohol acetyltransferases and the significance of ester
synthesis in yeast. Yeast, 16, 1287-1298.
Mateo, J.J., & Jiménez, M. (2000). Monoterpenes in grape juice and wines. Journal of
Chromatography A, 881, 557-567.

241
Matsui, S., & Amaha, M. (1981). Production of S-methyl thioacetate from methyl mercaptan
by brewer‘s yeast. Agricultural and Biological Chemistry, 45, 1341-1349.
Maujean, A. (2001). La chimie du soufre dans les moûts et les vin. International Journal of
Vine and Wine Sciences, 35, 171-194.
Mauricio. J.C., Moreno, J.J., Valero, E.M., Zea, L., Medina, M., & Ortega, J.M. (1993). Ester
formation and specific activities of in vitro alcohol acetyltransferase and esterase by
Saccharomyces cerevisiae during grape must fermentation. Journal of Agricultural and Food
Chemistry, 41, 2086-2091.
Mauricio, J.C, Ortega, J.M., & Salmon, J.M. (1995). Sugar uptake by three strains of
Saccharomyces cerevisiae during alcoholic fermentation at different initial ammoniacal
nitrogen concentrations. Acta Horticulturae, 388, 197-202.
Mauricio, J.C., & Ortega, J.M. (1997). Nitrogen compounds in wine during its biological aging
by two flor film yeasts: An approach to accelerated biological aging of dry Sherry-type wines.
Biotechnology and Bioengineering, 53, 159-167.
Maw, G.A. (1963 a). Sulfur utilization by yeast. Pure and Applied Chemistry, 7, 655-668.
Maw, G.A. (1963 b). The uptake of inorganic sulphate by a brewer‘s yeast. Folia
Microbiologica, 8, 325-332.
Maw, G.A. (1965). The role of sulphur in yeast growth and in brewing. Wallerstein Laboratory
Communications, Vol. XXVIII, 95, 49-70.
Mendes-Ferreira, A., Mendes-Faia, A., & Leao, C. (2002). Survey of hydrogen sulphide
production by wine yeasts. Journal of Food Protection, 65, 1033-1037.
Mendes-Ferreira, A., Mendes-Faia, A., & Leao, C. (2004). Growth and fermentation patterns
of Saccharomyces cerevisiae under different ammonium concentrations and its implications
in winemaking industry. Journal of Applied Microbiology, 97, 540-545.

242
Mendes-Ferreira, A., Olmo, M., García-Martínez, J., Jiménez-Martí, E., Leao, C., Mendes-
Faia, A., & Pérez-Ortín, J.E. (2007 a). Saccharomyces cerevisiae signature genes for
predicting nitrogen deficiency during alcoholic fermentation. Applied and Environmental
Microbiology, 73, 5363-5369.
Mendes-Ferreira, A., Olmo, M., García-Martínez, J., Jiménez-Martí, E., Mendes-Faia, A.,
Pérez-Ortín, J.E., & Leao, C. (2007 b). Transcriptional response of Saccharomyces
cerevisiae to different nitrogen concentrations during alcholic fermentation. Applied and
Environmental Microbiology, 73, 3049-3060.
Mendes-Ferreira, A. Barbosa, C., Falco, V., Leão, C., & Mendes-Faia, A. (2009). The
production of hydrogen sulphide and other aroma compounds by wine strains of
Saccharomyces cerevisiae in synthetic media with different nitrogen concentrations. Journal
of Industrial Microbiology & Biotechnology, 36 (4), 571-583.
Mendoza, L.M., de Nadra, M.C.M., & Farίas, M.E. (2007). Kinetics and metabolic behavior of
a composite culture of Kloeckera apiculata and Saccharomyces cerevisiae wine related
strains. Biotechnology Letters, 29, 1057-1063.
Mercadante, A., Britton, G., & Rodriguez-Amaya, D. (1998). Carotenoids from yellow passion
fruit (Passiflora edulis). Journal of Agricultural and Food Chemistry, 46, 4106-4106.
Mestres, M., Busto, O., & Guasch, J. (2000). Analysis of organic sulfur compounds in wine
aroma. Journal of Chromatography A, 881, 569-581.
Miller, A.C., Wolff, S.R., Bisson, L.F., & Ebeler, S.E. (2007). Yeast strain and nitrogen
supplementation: Dynamics of volatile ester production in Chardonnay juice fermentations.
American Journal of Enology and Viticulture, 58 (4), 470-483.
Monk, P.R. (1986). Formation, utilization and excretion of hydrogen sulphide by wine yeast.
Wine Industry Journal, 1, 10-16.
Monteiro, F.F., & Bisson, L.F. (1991). Biological assay of nitrogen content of grape juice and
prediction of sluggish fermentations. American Journal of Enology and Viticulture, 42, 47-57.

243
Monteiro, F.F., & Bisson, L.F. (1992 a). Nitrogen supplementation of grape juice. I. Effect on
amino acid utilization during fermentation. American Journal of Enology and Viticulture, 43,
1-10.
Monteiro, F.F., & Bisson, L.F. (1992 b). Nitrogen supplementation of grape juice. II. Effect on
amino acid urea release following fermentation. American Journal of Enology and Viticulture,
43, 11-17.
Monteiro, S., Piçarra-Pereira, M., Mesquita, P., Loureiro, V., Teixeira A., & Ferreira, R. (2001).
The wide diversity of the structurally similar wine proteins. Journal of Agricultural and Food
Chemistry, 49, 3999-4010.
Monteiro, F.F, Trousdale, E. K., & Bisson, L.F. (1989). Ethyl carbamate formation in wine:
use of radioactively labeled precursors to demonstrate the involvement of urea. American
Journal of Enology and Viticulture, 40, 1-8.
Moreira, N., Mendes, F., Guedes de Pinho, P., Hogg, T., & Vasconcelos, I. (2008). Heavy
sulphur compounds, higher alcohols and esters production profile of Hanseniaspora uvarum
and Hanseniaspora guilliermondii grown as pure and mixed cultures in grape musts.
International Journal of Food Microbiology, 124, 231-238.
Moreira, N., Mendes, F., Pereira, O., Guedes de Pinho, P., Hogg, T., & Vasconcelos, I.
(2002). Volatile sulphur compounds in wines related to yeast metabolism and nitrogen
composition of grape musts. Analytica Chimica Acta, 458, 157-167
Moreno-Arribas, V., Pueyo, E., & Polo, M.C. (1996). Peptides in musts and wines: changes
during the manufacture of Cavas (Sparkling wines). Journal of Agricultural and Food
Chemistry, 44, 3783-3788.
Moreno-Arribas, M.V., Bartolomé, B., Pueyo, E., & Polo, M.C. (1998 a). Isolation and
characterization of individual peptides from wine. Journal of Agricultural and Food Chemistry,
46, 3422-3425.
Moreno-Arribas, M.V., Polo, M.C., & Martin-Alvarez, P.J. (1998 b). Changes in the amino
acid composition of the different nitrogenous fractions during the aging of wine with yeasts.
Journal of Agricultural and Food Chemistry, 46 (10), 4042-4051.

244
Morton, J. (1987). Passionfruit. In J.F. Morton & F.L. Miami (Eds.), Fruits of Warm Climates
(pp. 320−328). Winterville, NC: Creative Resource Systems, Inc.
Mosandl, A., & Heusinger, G. (1985). 1,3-Oxathianes, chiral fruit flavor compounds. Justus
Liebigs Annalen der Chemie, 25, 507-510.
Muller, J.K., Kepner, E.R., & Webb, D.A. (1964). Some volatile constituents of passion fruit
wine. Journal of Food Science, 29 (5), 569-575.
Munoz, E., & Ingledew, W.M. (1990). Yeast hulls in wine fermentations – A review. Journal of
Wine Research, 1, 197-210.
Murat, M.L., Masneuf-Pomarède, I., Darriet, P., Lavigne, V., Tominaga, T., & Dubourdieu, D.
(2001 a). Effect of Saccharomyces cerevisiae yeast strains on the liberation of volatile thiols
in Sauvignon blanc wine. American Journal of Enology and Viticulture, 52, 136-139.
Murat, M.L., Tominga, T., & Dubourdieu, D. (2001 b). Assessing the aromatic potential of
Cabernet Sauvignon and Merlot musts used to produce Rosé wine by assaying the
cysteinylated precurser of 3-mercaptohexan-1-ol. Journal of Agricultural and Food Chemistry,
49, 5412-5417.
Nakopoulou, Z.G., Vafopoulou-Mastrogiannaki, A., & Soufleros, E.H. (2006). Protein
characterization of Roditis Greek grape variety and Sauvignon blanc and changes in certain
nitrogen compounds during alcoholic fermentation. Journal International des Sciences de la
Vigne et du Vin, 40, 165-175.
Nikolantonaki, M., Chichuc, I., Teissedre, P-L., & Darriet, P. (2009). Reactivity of volatile
thiols with polyphenols in a wine-model medium: impact of oxygen, iron, and sulfur dioxide.
Analytica Chimica Acta, 668, 102-109.
Nykänen, L. (1986). Formation and occurrence of flavour compounds in wine and distilled
alcoholic beverages. American Journal of Enology and Viticulture, 37, 84-96.
Oganesjanz, L, Telegin, J., & Kardasch, N. (2007). Lysatpräparate zur Qualitätssteigerung.
Der Deutsche Weinbau, 2, 31.

245
Osborne, J.P., & Edwards, C. (2006). Inhibition of malolactic fermentation by Saccharomyces
during alcoholic fermentation under low- and high-nitrogen conditions: a study in synthetic
media. Australian Journal of Grape and Wine Research, 12, 69-78.
Oshita, K., Kubota, M., Uchida, M., & Ono, M. (1995). Clarification of the relationship
between fusel alcohol formation and amino acid assimilation by brewing yeast using 13C-
labeled amino acid. Proceedings of the 25th Congress of the European Brewing Convention
(pp. 387-394). Oxford, United Kingdom: Oxford University Press.
Ough, C. S. (1991). Influence of nitrogen compounds in grapes on ethyl carbamate formation
in wines. In J. M. Rantz (Ed.), Proceedings of the International Symposium on Nitrogen in
Grapes and Wine (pp. 165-171), 18-19 June 1991, Seattle Davis, California: American
Society for Enology and Viticulture.
Ough, C.S., & Amerine, A. (1988). Methods for Analysis of Musts and Wines. 2nd Ed.
California: University of California.
Ough, C.S., & Crowell, E.A. (1980). Nitrate determination in California musts and wines.
American Journal of Enology and Viticulture, 31 (4), 344-346.
Ough, C.S., Huang, Z., An, D., & Stevens, D. (1991). Amino acid uptake by four commercial
yeasts at two different temperatures of growth and fermentation: effects on urea excretion
and reabsortion. American Journal of Enology and Viticulture, 42, 26-40.
Pätzold, R., & Brückner, H. (2007). D-Amino acids - New frontiers in amino acid and peptide
research. In R. Konno, H. Brückner, A. D‘Aniello, G.H. Fisher & H. Homma (Eds.), Gas
Chromatographic Determination of D-Amino Acids in Food and Beverages (pp. 351-366).
New York: NovaScience Publishers.
Parliament, T.H. (1972). Some volatile constituents of passion fruit. Journal of Agricultural
and Food Chemistry, 20 (5), 1043-1045.
Park, S.K., Boulton, R.B., & Noble, A.C. (2000 a). Formation of hydrogen sulphide and
glutathione during fermentation of white wine grape must. American Journal of Enology and
Viticulture, 51 (2), 91-97.

246
Park, S.K., Boulton, R.B., & Noble, A.C. (2000 b). Automated HPLC analysis of glutathione
and other volatile thiols in grape must and wine using pre-column derivertization with
fluorescence detection. Food Chemistry, 69, 475-480.
Patz, C.D., David, A., Thente, K., Kuerbel, P., & Dietrich, H. (1999). Wine analysis with FTIR
spectrometry. Viticultural and Enological Sciences, 54, 80-87.
Penninckx, M.J. (2002). An overview on glutathione in Sacchrapmyces versus non-
conventional yeasts. FEMS Yeast Research, 2, 295-305.
Pérez-Coello, M.S., Briones Pérez, A.I., Ubeda Iranzo, J.F., & Martin Alvarez, P.J. (1999).
Characteristics of wines fermented with different Saccharomyces cerevisiae strains isolated
from the La Mancha region. Food Microbiology, 16, 563-573.
Peyrot des Gachons, C. (2002). Aroma Potential of Sauvignon blanc Grapes (Vitis vinifera L.
cv Sauvignon blanc). Doctoral Dissertation Oenology Department, Victor Ségalen University,
Bordeaux (www.academie-amorim.com/us/laureat/synthese_de_la_these.pdf).
Peyrot des Gachons, C., Tominaga, T., & Dubourdieu, D. (2000). Measuring the aromatic
potential of Vitis vinifera L. cv. Sauvignon blanc grapes by assaying S-cysteine conjugates,
precursors of the volatile thiols responsible for their varietal aroma. Journal of Agricultural
and Food Chemistry, 48, 3387-3391.
Peyrot des Gachons, C., Tominaga, T., & Dubourdieu, D. (2002 a). Localization of S-cysteine
conjugates in the berry: Effect of skin contact contact on aromatic potential of Vitis vinifera L.
cv. Sauvignon must. American Journal of Enology and Viticulture, 53 (2), 144-146.
Peyrot des Gachons, C., Tominaga, T., & Dubourdieu, D. (2002 b). Sulfur aroma precursor
present in S-glutathione conjugate form: Identification of S-3-(hexan-1-ol)-glutathione in must
from Vitis vinifera L. cv. Sauvignon. Journal of Agricultural and Food Chemistry, 50, 4076-
4079.
Píry, J., Príbela, A., Ďurčanská, J., & Farkaš, P. (1995). Fractionation of volatiles from
blackcurrant (Ribes nigrum L.) by different extractive methods. Food Chemistry, 5, 73-77.
Plata, C., Millán, C., Mauricio, J.C., & Ortega, J.M. (2003). Formation of ethyl acetate and
isoamyl acetate by various species of wine yeasts. Food Microbiology, 20 (2), 217-224.

247
Polo, M.C., Gonzalez de Llano, M.D., & Ramos, M. (1992). Derivatization and liquid
chromatographic separation of peptides. In M. L. Nollet (Ed.), Food Analysis by HPLC (pp
117-140). New York: Dekker.
Poux, C., & Ournac, A. (1970). Acides aminés libres et polypeptidiques du vin. Annals of
Technology in Agriculture, 19, 217-237.
Pozo-Bayón, M. Á, Andújar-Ortiz, I., Alcaide-Hidalgo, J.M., Martίn-Álvarez, P.J., & Moreno-
Arribas, M.V. (2009 a). Characterization of commercial inactive dry yeast preparations for
enological use based on their ability to release soluble compounds and their behavior toward
aroma compounds in model wines. Journal of Agricultural and Food Chemistry, 57 (22),
10784-10792.
Pozo-Bayón, M. Á, Andújar-Ortiz, I., & Moreno-Arribas, M. V. (2009 b). Scientific evidences
beyond the application of inactive dry yeast preparations in winemaking. Food Research
International, 42, 754-761.
Pretorius, I.S. (2000). Tailoring wine yeast for the new millennium: novel approaches to the
ancient art of winemaking. Yeast, 16, 675-729.
Pretorius, I.S., van der Westhuizen, T.J., & Augustyn, O.P.H. (1999). Yeast biodiversity in
vineyards and wineries and its importance to the South African wine industry. South African
Journal of Enology and Viticulture, 20, 61-74.
Pronk, J.T., Steensma, H.Y., & van Dijken, J.P. (1996). Pyruvate metabolism in
Saccharomyces cerevisiae. Yeast, 12, 1607-1633.
Pruthi, J.S., & Lal, G. (1958). Carotenoids in passion fruit juice. Food Research, 23, 505-510.
Pruthi, J.S., & Lal, G. (1959). Chemical composition of passion fruit (Passiflora edulis, Sims.).
Journal of the Science of Food and Agriculture, 10, 188-192.
Radler, F. (1993). Metabolism of organic acids. In G. H. Fleet (Ed.), Wine Microbilology and
Biotechnology (pp. 77-164). Chur, Switzerland: Harwood Academic Publishers.

248
Radler, F., & Schütz, H. (1982). Glycerol production of various strains of Saccharomyces.
American Journal of Enology and Viticulture, 33, 36-40.
Rankine, B.C. (1963). Nature, origin and prevention of hydrogen sulphide aroma. Journal of
the Science and Food Agriculture, 14, 79-91.
Rankine, B.C. (1968 a). The importance of yeasts in determining the composition and quality
of wines. Vitis, 7, 22-49.
Rankine, B.C. (1968 b). Formation of -ketoglutaric acid by wine yeasts and its oenological
significance. Journal of the Science of Food and Agriculture, 9 (11), 624-627.
Rankine, B.C., & Bridson, D.A. (1971). Glycerol in Australian wines and factors influencing its
formation. American Journal of Enology and Viticulture, 22, 2-12.
Rankine, B.C., & Pocock, K.F. (1969). Influence of yeast strain on binding of sulphur dioxide
in wines, and on its formation during fermentation. Journal of the Science of Food and
Agriculture, 20 (2), 104-109.
Rapp, A. (1988). Wine aroma substances from gas chromatographic analysis. In H.F.
Jackson, & J.F. Linskens (Eds.), Wine Analysis (pp. 29-66). Berlin, Germany: Springer-
Verlag.
Rapp, A. (1998). Volatile flavour of wine: correlation between instrumental analysis and
sensory perception. Nahrung, 42 (6), 351-363.
Rapp, A., & Versini, G. (1991). Influence of nitrogen compounds in grapes on aroma
compounds in wine. Proceedings of the International Symposium on Nitrogen in Grapes and
Wine (pp. 156-164). Seattle, USA: American Society of Enology and Viticulture, Davis, CA.
Rapp, A., & Versini, G. (1996). Influence of nitrogen on compounds in grapes on aroma
compounds in wines. Journal International des Sciences de la Vigne et du Vin, 51, 193-203.
Rapp, A., Versini, G., & Ullemeyer, H. (1993). 2-Aminoacetophenon: Verursachende
Komponente der ‗Untypischen Alterungsnote‘ (‗Naphthalinton‘, ‗Hybriton‘) bei Wein. Vitis, 32,
61–62.

249
Rapp A., Yavas I., & Hastrich H. (1994). Einfache und schnelle Anreicherung
(„Kaltronmethode―) von Aromastoffen des Weines und deren quantitative Bestimmung mittels
Kapillargaschromatographie, Deutsche Lebensmittel-Rundschau, 90, 171-174.
Rauhut, D. (1993). Yeasts-production of sulfur compounds. In G. H. Fleet (Ed.), Wine
Microbiology and Biotechnology (pp. 183-223). Chur, Switzerland: Harwood Academic
Publishers.
Rauhut, D. (1996). Qualitätsmindernde schwefelhaltige Stoffe im Wein: Vorkommen, Bildung,
Beseitigung. Dissertation, Justus-Liebig-University Giessen, Geisenheimer Berichte Band 24.
Rauhut, D. (2003). Impact of volatile sulfur compounds on wine quality. In J.-C. Davidian, D.
Grill, L.J. De Kok, I. Stulen, M.J. Hawkesford, E. Schung, & H. Rennenberg (Eds.), Sulfur
Transport and Assimilation in Plants. Regulation, Interaction and Signalling (pp. 121-131).
Leiden, The Netherlands: Backhuys Publishers.
Rauhut, D. (2009). Usage and formation of sulphur compounds. In H. König, G. Unden, & J.
Fröhlich (Eds.), Biology of Microorganisms on Grapes, in Must and in Wine (pp. 181-207).
Heidelberg, Germany: Springer Verlag GmbH.
Rauhut, D., Beisert, B., Berres, M., Gawron-Scibek. M., & Kürbel, H. (2005 a). Pulse flame
phytometric detection: an innovative technique to analyse volatile sulphur compounds in wine
and other beverages. In T. Hofmann, M. Rothe & P. Schieberle (Eds.), State-of-the-Art in
Flavour Chemistry and Biology (pp. 363-367). Garching, Germany: Deutsche
Forschungsanstalt für Lebensmittelchemie.
Rauhut, D., & Kürbel, H. (1994). Die Entstehung von H2S aus Netzschwefel-Rückständen
während der Gärung und dessen Einfluss auf die Bildung von böckserverursachenden
schwefelhaltigen Metaboliten in Wein. Viticultural and Enological Science, 4, 27-36.
Rauhut, D., Kürbel, H., Fischer, S., & Beisert, B., (2005 b). Simultaneous analysis of N- and
S-compounds as screening for the identification of off-flavours in wine. In T. Hofmann, T.
Meyerhof, & P. Schieberle (Eds.), Recent Highlights in Flavor Chemistry & Biology (pp. 314-
317). Garching, Germany: Deutsche Forschungsanstalt für Lebensmittelchemie.

250
Rauhut, D., Kürbel, H., & Großmann, M. (1995). Influences of yeast strain and assimilable
nitrogen on the formation of undesirable volatile sulfur compounds during fermentation.
Proceedings of the SASEV International Congress, 8-10 November 1995. Cape Town, South
Africa.
Rauhut, D., Kürbel, H., Dittrich, H. H., & Großmann, M. (1996). Properties and differences of
commercial yeast strains with respect to their formation of sulfur compounds. Die Wein-
Wissenschaft, 51, 187-192.
Rauhut, D., Kürbel, H., Prior, B., Löhnertz, O., & Großmann, M. (1997). Synthetic media to
monitor the different abilities of yeast strains to produce undesirable volatile sulfur
compounds. Proceedings of the Fourth International Symposium on Cool Climate Viticulture
and Enology (pp. 76-79), 16.-20 Juli 1996. Rochester, New York, USA VI.
Rauhut, D., Kürbel, H., Schneider, K., & Großmann, M. (2000 a). Influence of nitrogen
supply in the grape must on the fermentation capacity and the quality of wine. Proceedings of
the XXV International Horticultural Congress, ISHS Acta Horticulturae 512: Part 2: Mineral
Nutrition and Grape and Wine Quality (pp. 93-100). Benelux, Brussels.
Rauhut, D., Riegelhofer, M., Ottes, G., Weisbrod, A., Hagemann, O., Glowacz, E., Löhnertz,
O., & Großmann, M. (2000 b). Investigation of nutrient supply and vitality of yeasts leading
to quality improvement of wines and sparkling wines. XXVème Congrès Mondial de la Vigne et
du Vin (pp. 101-106), 19-23 June 2000, Section II, Œnologie. Paris, France.
Rauhut, D., Shefford, P.G., Roll, C., Kürbel, H., Pour Nikfardjam, M., Loos, U., & Löhnertz, O.
(2001). Effect of pre- and/or post-fermentation addition of antioxidants like ascorbic acid or
glutathione on fermentation, formation of volatile sulphur compounds and other substances
causing off-flavours in wine. OIV, XXVI World Wine and Vine Congress (OIV) (pp. 76-82),
11-17 October 2001. Adelaide, Australia.
Ravaglia, S., & Delfini, C. (1993). Production of medium chain fatty acids and their ethyl
esters by yeast strains isolated from musts and wines. Italian Journal of Food Science, 5, 21-
36.
Raynal, C., Bonnefond, C., Eaginel, F., Granès, F., & Ortiz-Julien, A. (2009). Wine
fermentation with a new 100 % organic nutrient. Lallemand Technical Document, April 2009
(www.lallemandwine.com/IMG/pdf_Fermaid_O_eng.pdf).

251
Regodón Mateos, J.A., Pérez-Nevado, F., & Ramírez Fernández, M. (2006). Influence of
Saccharomyces cerevisiae yeast strain on the major volatile compounds of wine. Enzyme
and Microbial Technology, 5, 151-157.
Remize, F., Roustan, J.-L., Sablayrolles, J.-M., Barre, P., & Dequin, S. (1999). Glycerol
overproduction by engineered Saccharomyces cerevisiae wine yeast strains leads to
substantial changes in by-product formation and to a stimulation of fermentation rate in
stationary phase. Applied and Environmental Microbiology, 65, 143-149.
Remize, F., Sablayrolles, J. M., & Dequin, S. (2001). Re-assessment of the influence of
yeast strain and environmental factors on glycerol production in wine. Journal of Applied
Microbiology, 88 (3), 371-378.
Reynolds, A.G., Edwards, C.G., Cliff, M.A., Thorngate III, J.H., & Marr, J.C. (2001).
Evaluation of yeast strain during fermentation of Riesling and Chenin blanc musts. American
Journal of Enology and Viticulture, 52 (4), 336-344.
Ribéreau-Gayon, P., Dubourdieu, D., Donèche, B., & Lonvaud, A. (2006 a). Handbook of
Enology Volume 1: The Microbiology of Wine and Vinifications. 2nd Ed. Chichester: John
Wiley & Sons.
Ribéreau-Gayon, P., Glories, Z., Maujean, A., & Dubourdieu, D. (2006 b). Handbook of
Enology Volume 2: The Chemistry of Wine Stabilization and Treatments. 2nd Ed. Chichester:
John Wiley & Sons.
Rice-Evans, C. & Miller, N. J. (1996). Antioxidant activities of flavonoids as bioactive
components of food. Biochemical Society Transactions, 24, 790-795.
Richmond, D.V. (1973). Sulfur compounds. In L.P. Miller (Ed.), Phytochemistry Volume III
(pp. 41-73). New York: Van Nostrand Reinholt.
Rigaud, J., Etievant, P., Henry, R., & Latrasse, A. (1986). 4-Methoxy-2-methyl-2-
mercaptobutane, a major constituent of the aroma of the blackcurrant bud (Ribes nigrum).
Sciences Des Aliments, 6 (2), 213-220.

252
Roland, A., Vialaret, J., Moniatte, M., Rigou, P., Razungles, A., & Schneider, R. (2010).
Validation of a nano liquid chromatography-tandem mass spectrometry method for the
identification and the accurate quantification by isotopic dilution of glutathionylated and
cysteinylated precursors of 3-mercaptohexan-1-ol and 4-mercapto-4-methylpentan-2-one in
white grape juices. Journal of Chromatography A, 1217, 1626-1635.
Romano, P., Capece, A., & Jespersen, L. (2006). Taxonomic and ecological diversity of food
and beverage yeasts. In A. Querol, & G.H. Fleet (Eds.), The Yeast Handbook: Yeasts in
Food and Beverages (pp. 13-53). Heidelberg: Springer.
Romano, P., Fiore, C., Paraggio, M., Caruso, M., & Capece, A. (2003). Function of yeast
species and strains in wine flavour. International Journal of Food Microbiology, 86,169-180.
Romano, P., & Suzzi, G. (1993). Sulfur dioxide and wine microorganisms. In G. H. Fleet (Ed.),
Wine Microbiology and Biotechnology (pp. 373-393). Chur, Switzerland: Harwood Academic
Publishers.
Rosi, I.M., Bertuccioli, M., & Giovani, G. (2008). Effect of source, amount and timing of
nitrogen addition on yeast fermentative: Performance and flavour compound formation in
Trebbiano wine. In D. Chassagne (Ed.), Wine Active Compounds-Proceeding of the WAC
2008 International Conference (pp. 252-254), 27-29 March 2008. Beaune: OenoPluri Media.
Roussis, I.G., Lambropoulos, I., & Tzimas, P. (2007). Protection of volatiles in a wine with
low sulphur dioxide by caffeic acid or glutathione. American Journal of Enology and
Viticulture, 58, 274-282.
Sablayrolles, J.M. (2009). Control of alcoholic fermentation in winemaking: Current situation
and prospect. Food Research International, 42, 418-424.
Saerens, S.M.G., Delvaux, F., Verstappen, K.J., Van Dijck, P., Thevelein, J.,M., & Delvaux,
F.R. (2008). Parameters affecting ethyl ester production by Saccharomyces cerevisiae
during fermentation. Applied and Enviromental Microbiology, 74 (2), 454-461.
Saerens, S.M.G., Verstappen, K.J., Van Laere, S.D.M., Voet, A.R.D., Van Dijck, P., Delvaux,
F.R., & Thevelein, J.M. (2006). The Saccharomyces cerevisiae EHT1 and EEB1 genes
encode novel enzymes with medium-chain fatty acid ethyl ester synthesis and hydrolysis
capacity. The Journal of Biological Chemistry, 281, 4446-4456.

253
Sala, C., Busto, O., Guasch, J., & Zamora, F. (2004 a). Influence of vine training and sunlight
exposure on the 3-alkyl-2-methoxypyrazines content in musts and wines from the Vitis
vinifera variety Cabernet Sauvignon. Journal of Agricultural and Food Chemistry, 52, 3492-
3497.
Sala, C., Busto, O., Guasch, J., & Zamora, F. (2004 b). Factors affecting the presence of 3-
alkyl-2-methoxypyrazines in grapes and wines. A review (pp. 53-58). (Access May 2010).
Salah, N., Miller, N.J., Paganga, G., Tijburg, L., Bolwell, G.P., & Rice-Evans, C. (1995).
Polyphenolic flavanols as scavengers of aqueous phase radicals and as chain-breaking
antioxidants. Archives of Biochemistry and Biophysics, 322 (2), 339-346.
Salmon, J.M. (1989). Effect of sugar transport inactivation in Saccharomyces cerevisiae on
sluggish and stuck enological fermentations. Applied and. Environmental Microbiology, 55 (4),
953-958.
Salmon, J.M. (1996). Sluggish and stuck fermentations: some actual trends on their
physiological basis. Viticulture and Enology of Science, 51, 137-140.
Salmon, J., & Barre, P. (1998). Improvement of nitrogen assimilation and fermentation
kinetics under enological conditions by derepression of alternative nitrogen-assimilatory
pathways in an industrial Saccharomyces cerevisiae strain. Applied and Environmental
Microbiology, 64, 3831-3837.
Sandi, D., Paes Chaves, J.B., Gomes de Sousa, C., Ferreira, J., Parreiras, M., Coelho da
Silva, M.T., & Lessa Constant, P.B. (2004). Hunter color dimensions, sugar content and
volatile compounds in pasteurized yellow passion fruit juice (Passiflora edulis var. flavicarpa)
during storage. Brazillian Archives of Biology and Technology, 47 (2), 233-245.
Sarrazin, E., Shinkaruk, S., Tominaga, T., Benneteau, B., Frédot, E., Dubourdieu, D. (2007).
Odourous impact of volatile thiols on the aroma of young botrytized sweet wines:
Identification and quantification of new sulphanyl alcohols. Journal of Agricultural and Food
Chemistry, 55, 1437-1444.

254
Scafato, P., Colangelo, A., & Rosini, C. (2009). A new efficient enantioselective synthesis of
(+)-cis-2-methyl-4-propyl-1,3-oxathiane, a valuable ingredient for the aroma of passion fruit.
Chirality, 21 (1), 176-182.
Scanes, K.T., Hohmann, S., & Prior, B.A. (1998). Glycerol production by yeast
Saccharomyces cerevisiae and its relevance to wine: A review. South African Journal of
Enology and Viticulture, 19 (1), 17-24.
Schmitt, A. (1987). Untersuchung des chemischen Verhaltrens von
Tetramethylthiuramdisulfid in Lebensmitteln. Thesis. Universität Karlsruhe.
Schneider, A., Gerbi, V., & Redoglia, M. (1987). A rapid HPLC method for separation and
determination of major organic acids in grape musts and wines. American Journal of Enology
and Viticulture, 38 (2), 151-155.
Schneider, R., Charrier, F., Razungles, A., & Baumes, R. (2006). Evidence for an alternative
biogenetic pathway leading 3-mercaptohexanol and 4-mercapto-4-methylpentan-2-one in
wines. Analytica Chimica Acta, 563, 58-64.
Schreier, P. (1979). Flavor compositions of wines: a review. CRC Critical Reviews in Food
Science and Nutrition, 12, 59-111.
Schütz, M., & Kunkee, R.E. (1977). Formation of hydrogen sulfide from elemental sulfur
during fermentation by wine yeast. American Journal of Enology and Viticulture, 28, 137-144.
Shaw, P.E., & Nagy, S. (1981). Analysis and flavour effects of volatile sulphur compounds in
citrus juices. In G. Charalambous, & G. Inglett (Eds.), The Quality of Foods and Beverages.
Chemistry and Technology (pp. 361-376). New York: Academic Press.
Shibamoto, T., & Tang, C.S. (1990). Minor tropical fruits mango, papaya, passion fruit, and
guava. In I.D. Morton & A.J. MacLeod (Eds.), Food Flavours. Part C. The Flavour of Fruits
(pp. 221−280). Amsterdam: Elsevier.
Shinohara, T., Kubodera, S., & Yanagida, F. (2000). Distribution of phenolic yeasts and
production of phenolic off-flavors in wine fermentation. Journal of Bioscience and
Bioengineering, 90 (1), 90-97.

255
Silla-Santos, M.H. (1996). Biogenic amines: their importance in foods. International Journal
of Food Microbiology, 29, 213-231.
Simpson, R.F. (1979). Some important aroma components of white wine. Food Technology
Australia, 31, 516-522.
Singer, G., Heusinger, G., Fröhlich, 0., Schreier, P. and Mosandl, A. (1986). Chirality
evaluation of 2-methyl-4-propyl-l,3-oxathiane from the yellow passion fruit. Journal of
Agricultural and Food Chemistry, 34, 1029-1033.
Singleton, V.L. (1987). Oxygen with phenols and related reactions im musts, wines and
model systems: observation and practical implications. American Journal of Enology and
Viticulture, 38, 69-77.
Soden, A., Francis, I. L., Gockowiak, H., Lee, T. H., & Henschke, P. A. (1999). The use of
non-Saccharomyces yeasts in winemaking. In R. J. Blair, A. N. Sas, P. F. Hayes, & P. B. Høj
(Eds.), Proceedings of the Tenth Australian Wine Industry Technical Conference (pp.166-
176). Urrbrae, Winetitles.
Somogyi, L.P., Barret, D.M., & Hui, Y.H. (1996). Processing Fruits: Science and Technology
of Major Processed Products. Davis, California: American Food and Nutrition Center.
Soubeyrand, V., Luparia. V., Williams, P., Doco, T., Vernhet, A., Ortiz-Julien, A., & Salmon,
J.-M. (2005). Formation of micella containing solubilized sterols during rehydration of active
dry yeasts iImproves their fermenting capacity. Journal of Agricultural and Food Chemistry,
53 (20), 8025-8032.
Soufleros, E.H., Bouloumpasi, E., Tsarchopoulos, C., & Biliaderis, C.G. (2003). Primary
amino acid profiles of Greek white wines and their use in classification according to variety,
origin and vintage. Food Chemistry, 80, 261-273.
Spayd, S.E., & Andersen-Bagge, J. (1996). Free amino acid composition of grape juice from
12 Vitis vinifera cultivars in Washington. American Journal of Enology and Viticulture, 47,
389-402.
256
Spedding, D.J., Eschenbruch, R., & McGregor, P.J. (1983). Sulfur compounds in the
headspace of some New Zealand commercial wines. Food Technology in Australia, 35, 22-
23.
Spiropoulos, A., & Bisson, L.F. (2000). MET17 and hydrogen sulfide formation in
Saccharomyces cerevisiae. Applied Environmental Microbiology, 66, 4421-4426.
Spiropoulos, A., Tanaka, J., Flerianos, I., & Bisson, L.F. (2000). Characterization of hydrogen
sulfide formation in commercial and natural wine isolates of Saccharomyces. American
Journal of Enology and Viticulture, 51, 233-247.
Sponholz, W.R. (1991). Nitrogen compounds in grapes, must and wine. Proceedings of the
International Symposium on Nitrogen in Grapes and Wine (pp. 67–77). Seattle, USA:
American Society of Enology and Viticulture Davis, California.
Sponholz, W.R., Großmann, M., & Hühn, T. (2000). The untypical ageing (UTA) in white
wines and its origin and prevention. Proceedings of 5th International Symposium on Cool
Climate Viticulture and Oenology, 16-20 January 2000, Melbourne, Australia.
Srisamatthakarn, P., Rauhut, D., & Brückner, H. (2010). Impact of commercial yeast strains
on wine fermentation and formation of metabolites of yellow passion fruit juice (Passiflora
edulis Sims f. flavicarpa Degner). Asian Journal of Food and Agro-Industry, 3 (2), 282-292.
Steinhaus, M., Sinuco, D., Polster, P., Osorio, C., & Schieberle, P. (2008). Characterization
of the aroma-active compounds in pink guava (Psidium guajava, L.) by application of the
aroma extract dilution analysis. Journal of Agricultural and Food Chemistry, 56 (11), 4120-
4127.
Stines, A. P., Grubb, J., Gockowiak, H., Henschke, P. A., Høj, P. B., & van Heeswijck, R.
(2000). Proline and arginine accumulation in developing berries of Vitis vinifera L. in
Australian vineyards: Influence of vine cultivar, berry maturity and tissue type. Australian
Journal of Grape and Wine Research, 6, 150-158.
Strauss, C.R., Wilson, B., Gooley, P.R., & Williams, P.J. (1986). Role of monoterpenes in
grape and wine flavor. In T.H. Parliament, & R. Croteau (Eds.), Biogeneration of Aromas (pp.
223-242). Washington, USA: American Chemical Society.

257
Strehaiano, P., Ramon-Portugal, F., & Taillandier, P. (2006). Yeasts as biocatalysts. In A.
Querol & G. H. Fleet (Eds.), The Yeast Handbook: Yeasts in Food and Beverages (pp. 243-
284). Heidelberg: Springer.
Strohalm, H., Dregus, M., Wahl, A., & Engel, K.-H. (2007). Enantioselelective analysis of
secondary alcohols and their esters in purple and yellow passion fruits. Journal of
Agricultural and Food Chemistry, 55, 10339-10344.
Strohalm, H., Dold, S., Pendzialek, K., Weiher, M., & Engel, K.-H. (2010). Preparation of
passion fruit-typical 2-alkyl ester enantiomers via lipase-catalyzed kinetic resolution. Journal
of Agricultural and Food Chemistry, 58 (10), 6328-6333.
Subileau, M., Schneider, R., Salmon, J.-M., & Degryse, E. (2008). Nitrogen catabolic
repression modulates the production of aromatic thiols characteristic of Sauvignon blanc at
the level of precursor transport. FEMS Yeast Research, 8, 771-780.
Sumby, K.M., Grbin, P.R., & Jiranek, V. (2009). Microbial modulation of aromatic esters in
wine: Current knowledge and future prospects. Food Chemistry, 121 (1), 1-16.
Surdin-Kerjan, Y. (2003). Foreward (I): Sulphur metabolism. In J-C, Davidian, D, Grill, L.J. De
Kok, I. Stulen I, M.J. Hawkesford, E. Schnug, & H. Rennenberg (Eds.), Sulfur Transport and
Assimilation in Plants: Regulation, Interaction and Signaling (pp. xiii-xviii). Leiden, The
Netherlands: Backhuys Publishers.
Swiegers, J.H., Barowasky, E.J., Henschke, P.A., & Pretorius, I.S. (2005 a) Yeast and
bacteria modulation of wine aroma and flavour. In R.J. Blair, M.E. Francis, I.S. Pretorius
(Eds.), AWRI, Advances in Wine Science. Commemorating 50 Years of The Australian Wine
Research Institute (pp. 159-187). Australia: The Australian Wine Research Institute.
Swiegers, J.H., Capone, D.L., Pardon, K.H., Elsey, G.M., Sefton, M.A., Francis, I.L., &
Pretorius, I.S. (2007). Engineering volatile thiol release in Saccharomyces cerevisiae for
improved wine aroma. Yeast, 24, 561-574.
Swiegers, J.H., Francis, I.L., Herderich, M.J., & Pretorius, I.S. (2006). Meeting consumer
expectations through management in vineyard and winery: the choice of yeast for
fermentation offers great potential to adjust the aroma of Sauvignon Blanc wine. Australian
and New Zealand Wine Industry Journal, 21, 34-42.

258
Swiegers, J.H., King, E.S., Travis, B., Francis, I.L., & Pretorius, I.S. (2007). Enhancement of
Sauvignon blanc through yeast combinations. Wynboer: A Technical Guide for Wine
Producer: www.wynboer.co.za/recentarticles/200712sauvignon.php3 (Access 1 June 2010).
Swiegers, J.H., & Pretorius, I.S. (2005). Yeast modulation of wine flavour. Advances in
Applied Microbiology, 57, 131-175.
Swiegers, J.H., Ugliano, M., van der Westhuizen, T. & Bowyer, P. (2008). Impact of yeast
rehydration nutrient on the aroma of Sauvignon Blanc wine. The Australian and New Zealand
Grapegrower and Winemaker, January, 66-69.
Swiegers, J.H., Willmott, R.L, Hill-Ling, A., Capone, D.L., Pardon, K.H., Elsey, G.M., Howell,
K.S., de Barros Lopes, M.A., Sefton, M.A., Lilly, M., & Pretorius, I.S. (2005 b). Modulation of
volatile thiol and ester aromas in wine by modified wine yeast. Proceedings of the Weurman
Flavour Research Symposium (pp. 113-116), 21-26 June 2005. Roskilde, Denmark.
Swiegers, J.H., Willmott, R.L, Siebert, T.E., Lattey, K., Bramley, B.R., Francis, I.L., King, E.S.,
& Pretorius, I.S. (2009). The influence of yeast on the aroma of Sauvignon Blanc wine. Food
Microbiology, 26 (2), 204-211.
Taillandier, P., Ramon, F., Fuster, A., & Strehaiano, P. (2007). Effect of ammonium
concentration on alcoholic fermentation kinetics by wine yeasts for high sugar content. Food
Microbiology, 24, 95-100.
Talcott, S.T., Percival, S.S., Pittet-Moore, J. & Celoria, C. (2003). Phytochemical composition
and antioxidant stability of fortified yellow passion fruit (Passiflora edulis). Journal of
Agricultural and Food Chemistry, 51 (4), 935-941.
ter Schure, E.G., van Riel, N.A.W., & Verrips, C.T. (2000). The role of ammonia metabolism
in nitrogen catabolite repression in Saccharomyces cerevisiae. FEMS Microbiology Reviews,
24, 67-83.
Thibon, C., Marullo, P., Claisse, O., Cullin, C., Dubourdieu, D. and Tominaga, T. (2008 a).
Nitrogen catabolic repression controls the release of volatile thiols by Saccharomyces
cerevisiae during wine fermentation. FEMS Yeast Research, 8, 1076-1086.

259
Thibon, C., Shinkaruk, S., Tominaga, T., Bennetau, B., & Dubourdieu, D. (2008 b). Analysis
of the diastereoisomers of the cysteinylated aroma precursor of 3-sulfanylhexanol in Vitis
vinifera grape must by gas chromatography coupled with ion trap tandem mass spectrometry.
Journal of Chromatography A, 1183, 150-157.
Thomas, C.S., Boulton, R.B., Silacci, M.W., & Gubler, W.D. (1993). The effect of elemental
sulfur, yeast strain and fermentation medium on hydrogen sulfide production during
fermentation. American Journal of Enology and Viticulture, 44, 211-216.
Thomas, D., & Surdin-Kerjan, Y. (1997). Metabolism of sulfur amino acids in Saccharomyces
cerevisiae. Microbiology and Molecular Biology Review, 61 (4), 503-532.
Thomas, K.C., & Ingledew, W.M. (1992). Production of 21 % (v/v) ethanol by fermentation of
very high gravity (VHG) wheat mashes. Journal of Industrial Microbiology and Biotechnology,
10, 61-68.
Thornton, R.J., & Bunker, A. (1989). Characterisation of wine yeasts for genetically
modifiable properties. Journal of the Institute of Brewing, 95, 181-184.
Tokitomo, Y., Steinhaus, M., Bütner, A., & Schieberle, P. (2005). Odor-active constituents in
fresh pineapple (Ananas comosus [L.] Merr.) by quantitative and sensory evaluation.
Bioscience, Biotechnology, and Biochemistry, 67 (7), 1323-1330.
Tokuyama, T., Kuraishi, H., Aida, K., & Uemura, T. (1973). Hydrogen sulfide evolution due to
pantothenic acid deficiency in the yeast requiring this vitamin, with special reference to the
effect of adenosine triphosphate on yeast cysteine desulfhydrase. The Journal of General
and Applied Microbiology, 19, 439-466.
Tominaga, T., Blanchard, L., Darriet, P., & Dubourdieu, D. (2000). A powerful aromatic
volatile thiol, 2-furanmethanethiol, exhibiting roast coffee aroma in wines made from several
Vitis vinifera grape varieties. Journal of Agricultural and Food Chemistry, 48, 1799-1802.
Tominaga, T., & Dubourdieu, D. (2000). Identification of cysteinylated aroma precursors of
certain volatile thiols in passion fruit juice. Journal of Agricultural and Food Chemistry, 48,
2874-2876.

260
Tominaga, T., Furrer, A., Henry, R., & Dubourdiue, D. (1998 a). Identification of new volatile
thiols in the aroma of Vitis vinifera L. var. Suavignon blanc wines. Flavour and Fragrance
Journal, 13, 159-162.
Tominaga, T., Masneuf-Pomarède, I., & Dubourdieu, D. (1995). A S-cysteine conjugate,
precursor of aroma of white Sauvignon. Journal International des Sciences de la Vigne et du
Vin, 29, 227-232.
Tominaga, T., Murat, M.L., & Dubourdieu, D. (1998 b). Development of a method for
analyzing the volatile thiols involved in the characteristic aroma of wines made from Vitis
vinifera L. cv. Sauvignon blanc. Journal of Agricultural and Food Chemistry, 46, 1044-1048.
Tominaga, T., Peyrot des Gachons, C., & Dubourdieu, D. (1998 c). A new type of flavour
precusors in Vitis vinifera L. cv. Sauvignon blanc: S-cysteine conjugates. Journal of
Agricultural and Food Chemistry, 46, 5215-5219.
Torija, M.J., Beltran, G., Novo, M., Poblet, M., Guillamón, J. M., & Mas, A. (2003 a). Effect of
fermentation temperature and Saccharomyces species on the cell fatty acid composition and
presence of volatile compounds in wine. International Journal of Food Microbiology, 85, 126-
136.
Torija, M.J., Beltran, G., Novo, M., Poblet, M., Rozès, N., Mas, A., & Guillamón, J. M.. (2003
b). Effect of organic acids and nitrogen source on alcoholic fermentation: Study of their
buffering capacity. Journal of Agricultural and Food Chemistry, 51 (4), 916-922.
Torrea, D., Fraile, P., Garde, T., Ancín, C. (2003). Production of volatile compounds in the
fermentation of Chardonnay musts inoculated with two strains of Saccharomyces cerevisiae
with different nitrogen demands. Food Control, 14, 565-571.
Torrea, D., Siebert, T., Liebich, B., Ancin, C., Francis, L., & Henschke, P.A. (2005). Effect of
ammonium supplementation of a Chardonnay must on wine aroma. In R.J. Blair, P.J.
Williams, & I.S. Pretorius (Eds.). Proceedings of the Twelfth Australian Wine Industry
Technical Conference (pp. 293), Melbourne, Victoria, 24-29 July 2004. Adelaide, South
Australia: Australian Wine Industry Technical Conference Inc.
Turgeon, S.L., Gauthier, S.F., Mollé, D., & Léonil, J. (1992). Interfacial properties of tryptic
peptides of β-lactoglobulin. Journal of Agricultural and Food Chemistry, 40, 669-675.

261
Ugliano, M., Bartowsky, E.J., McCarthy, J., Moio, L., & Henschke, P.A. (2006). Hydrolysis
and transformation of grape glycosidically bound volatile compounds during fermentation
with three Saccharomyces yeast strains. Journal of Agricultural and Food Chemistry, 54,
6322-6331.
Ugliano, M., Fedrizzi, B., Siebert, T., Travis, B., Magno, F., Versini, G., & Henschke, P.A.
(2009). Effect of nitrogen supplementation and Saccharomyces species on hydrogen sulfide
and other volatile sulfur compounds in Shiraz fermentation and wine. Journal of Agricultural
and Food Chemistry, 57 (11), 4948-55.
Ugliano, M., & Henschke, P.A. (2009). Yeast and wine flavours. In M.V. Moreno-Arribas &
M.C. Polo (Eds.), Wine Chemistry and Biochemistry (pp. 313-392). New York: Springer New
York.
Ugliano, M., Henschke, P.A, Herderich, M.J., & Pretorius, I.S. (2007). Nitrogen management
is critical for wine flavour and style. Wine Industry Journal, 22 (6), 24-30.
Usseglio-Tomasset, L., & Bosia, P.D. (1990). Amino acid and oligopeptide variations from
must to wine. Bulletin de l'O.I.V., 63 (707-708), 21-46.
Vaughan-Martini, A., & Martini, A. (1998). Saccharomyces Meyen ex Reess. In C.P.
Kurtzman & J.W. Fell (Eds.), The Yeast: A Taxonomic Study (pp. 358-371). Amsterdam:
Elsevier.
Valero, E., Mauricio, J. C., Millán, M. C., & Ortega, J.M. (1999). Changes in the urea content
of wine under different fermentation and aging conditions by two Saccharomyces cerevisiae
races. Biotechnology Letter, 21, 555-559.
Valero, E., Millán, C., Ortega, J., & Mauricio, J. (2003). Concentration of amino acids in wine
after the end of fermentation by Saccharomyces cerevisiae strains. Journal of the Science of
Food and Agriculture, 83, 830-835.
van der Westhuizen, T., Bowyer, P., Gourraud, C., Marullo, P., & Murat, M.L. (2008).
Optimizing the aromas of wines made from Sauvignon Blanc and other grape varieties with
«Sauvignon» aromas: impact of a yeast rehydration nutrient and inoculation with mixed
yeasts. Laffort Info (www.laffort.com/en/research-and-innovation/laffort-news).

262
Vannini, L., Simone, G., Norscia, P., Romano, P., & Suzzi, G. (1994). Acetaldehyde
production as a selective characteristic in Saccharomyces cerevisiae. Industrie delle
Bevande, 23, 414-417.
Vera, E., Ruales, J., Dornier, M., Sandeaux, J., Sandeaux, R., & Pourcelly, G. (2003).
Deacidification of clarified passion fruit juice using different configuratons of electrodialysis.
Journal of Chemical Technology and Biotechnology, 78 (8), 918-925.
Vermeulen, C., Guyot-Declerck, C., & Collin, S. (2003). Combinatorial synthesis and
sensorial properties of mercapto primary alcohols and analogues. Journal of Agricultural and
Food Chemistry, 51 (12), 3523-3628.
Viana, F., Gil, V.J., Vallés, S., & Manzanares, P. (2009). Increasing the levels of 2-
phenylethyl acetate in wine through the use of mixed culture of Hanseniaspora osmophila
and Saccharomyces cerevisiae. International Journal of Food Microbiology, 135, 68-74.
Vianna, E., & Ebeler, S. (2001). Monitoring ester formation in grape juice fermentation using
solid phase microextraction coupled with gas chromatography–mass spectrometry. Journal
of Agricultural and Food Chemistry, 49, 589-595.
Vilanova, M., Ugliano, M., Varela, C., Siebert, T., Pretorius, I.S., & Henschke, P.A. (2007).
Assimilable nitrogen utilisation and production of volatile and non-volatile compounds in
chemically defined medium by Saccharomyces cerevisiae wine yeasts. Applied Microbiology
and Biotechnology, 77, 145-157.
von Wallbrunn, C. (2007). Identification and monitoring: risk assessment of genetically
modified yeast during wine making. 8th International Symposium Innovations in Enology, (pp.
125-132). Stuttgart.
Wainwright, T. (1971). Production of H2S by yeasts: role of nutrients. Journal of Applied
Bacteriology, 34, 161-171.
Wakabayashi, H. (2004). Enzyme-catalyzed Transformations of Sulfur-containing Flavour
Precursors. genehmigten Dissertation, der Technischen Universität München.

263
Wakabayashi, H., Wakabayashi, M., Eisenreich, W., & Engel, K.H. (2004). Stereochemical
course of the generation of 3-mercaptohexanal and 3-mercaptohexanol by beta-lyase-
catalyzed cleavage of cysteine conjugates. Journal of Agricultural and Food Chemistry, 52,
110-116.
Walker, G. M. (1998). Yeast Physiology and Biotechnology. U.K., Wiley: West Sussex.
Walker M.D., & Simpson, W.J. (1993). Production of volatile sulphur compounds by ale and
lager brewing strains of Saccharomyces cerevisiae. Letters in Applied Microbiology, 16, 40-
43.
Walker, K., Skelton, H., & Smith, K. (2002). Cutaneous lesions showing giant yeast forms of
Blastomyces dermatitidis. Journal of Cutaneous Pathology, 29 (10), 616-618.
Wang, X.D., Bohlscheid, J.C., & Edwards, C.G. (2003). Fermentative activity and production
of volatile compounds by Saccharomyces grown in synthetic grape juice media deficient in
assimilable nitrogen and/or panthothenic acid. Journal of Applied Microbiolgy, 94, 349-359.
Weber, B., Dietrich, A., Maas, B., Marx, A. Olk, J., & Mosandl, A. (1994). Sterioisomeric
flavour compounds: LXVI. Enantiomeric distribution of the chiral sulfur-containing alcohols in
yellow and purpul passion fruit. Zeitschrift für Lebensmittel- Untersuchung und -Forschung A,
199, 48-50.
Weber, B., Maas, B., & Mosandl, A. (1995). Stereoisomeric flavour compounds. 72.
Stereoisomeric distribution of some chiral sulfur-containing trace components of yellow
passion fruits. Journal of Agricultural and Food Chemistry, 43, 2438-2441.
Werkhoff, P., Güntert, M., Krammer, G., Sommer, H., & Kaulen, J. (1998). Vacuum
headspace method in aroma research: Flavor chemistry of yellow passion fruits. Journal of
Agricultural and Food Chemistry, 6, 1076-1093.
Whitfield, F.B., & Last, J.H. (1986). The flavour of the passion fruit - A review. In E.J. Brunke
(Ed.), Progress in Essential Oil Research (pp. 3−48). Berlin: de Gruyter.
Wigand, P., & Decker, H. (2007). Proteine im Wein. Deutsche Lebensmittel-Rundschau, 103,
52-57.

264
Williams, P.J., Strauss, C.R., & Wilson, B. (1980). Hydroxylated linalool derivatives as
precursors of volatile monoterpenes of muscat grapes. Journal of Agricultural and Food
Chemistry, 28, 766-771.
Winter, E. (2003). Avoiding drought-related mothball aroma in white wines. Australian and
New Zealand Wine Industry Journal, 18, 63-66.
Winter, M., Furrer, A., Willhalm, B., & Thommen, W. (1976). 168. Identification and synthesis
of two new organic sulfur compounds from the yellow passion fruit (Passiflora edulis
f .flavicarpa). Helvetica Chimica Acta, 59 (16), 1613-1620.
Winter, M., & Klöti, R. (1972). Über das Aroma der gelben Passionsfrucht (Passiflora edulis
f .flavicarpa). Helvetica Chimica Acta, 55, 1916-1921.
Winterhalter, P. (1990). Bound terpenoids in the juice of the purple passion fruit (Passiflora
edulis Sims). Journal of Agricultural and Food Chemistry, 38, 452-455.
Wüst, M. (2003). Zur Biochemie des sortentypischen Aromas. Wein-Qualität entscheidet sich
in Nanogramm. Chemie unserer Zeit, Nr. 1, 37, 8-17.
Wylie, E.B., & Johnson, M. (1961). Effect of penicillin on the cell wall of Escherichia coli.
Biochimica et Biophysica Acta, 59, 450-457.
Yamagata, S. (1989). Roles of O-acetyl-L-homoserine sulfhydrylases in micro-organisms.
Biochimie, 71, 1125-1143.
Yéramian, N., Chaya, C., & Suárez Lepe, J. A. (2007). L-(-)-Malic acid production by
Saccharomyces spp. during the alcoholic fermentation of wine (1). Journal of Agricultural and
Food Chemistry, 55 (3), 912-919.
Yokotsuka, K., Aihara, T., Umehara, Y., & Kushida, T. (1975). Free amino acids and peptides
in musts and wines from Japanese grapes. Journal of Fermentation Technology, 53, 631-635.
Yokotsuka, K., & Singleton, V.L. (1995). Interactive precipitation between phenolic fractions
and peptides in wine-like model solutions: turbidity, particle size, and residual content as
influenced by pH, temperature and peptide concentration. American Journal of Enology and
Viticulture, 46, 329-338.

265
Yokotsuka, K., Yoshii, M., Aihara, T., & Kushida, T. (1977). Isolation and characterization of
proteins from juices, musts, and wines from Japanese grapes. Journal of Fermentation
Technology, 55 (5), 510-515.
Yoshida, M., Yamamoto, M., & Nikaido, T. (1992). Quercetin arrest human leukemic cells in
late G1 phase of the cell cycle. Cancer Research, 52, 6679-6681.
Yoshimoto, H., Fukushige, T., Yonezawa, T., & Sone, H. (2002). Genetic and physiological
analysis of branched-chain alcohols and isoamyl acetate production in Saccharomyces
cerevisiae. Applied Microbiology and Biotechnology, 9, 501-508.
Zibadi, S., & Watson, R.R. (2004). Passion fruit (Passiflora edulis): Composition, efficacy and
safety. Evidence-Based Integrative Medicine, 1 (3), 183-187.
Zibadi, S., & Watson, R.R. (2004). Passion fruit (Passiflora edulis): Composition, efficacy and
safety. Evidence-Based Integrative Medicine, 1 (3), 183-187.
Zoecklein, B. (2007). Enology Notes #129: Winery planning and design CD; advanced
technical meeting: wine longevity; copper, glutathione, and wine longevity; hyper-reduction
and wine Longevity (www.fst.vt.edu/extension/enology/EN/129.html#3).
Zoecklein, B.W., Fugelsang, K.C., Gump, B.H., & Nury, F. (1999). Wine Analysis and
Production. New York: Kluwer Academic.
Zolou, A. Lokou, Z., Souflero, E., & Stratis, I. (2003). Determination of biogenic amines in
wines and beers by high performance liquid chromatography with pre-column dansylation
and ultraviolet detection. Chromatographia, 57, 429-439.
Electronic literatures
http://biochemie.web.med.uni-muenchen.de/Yeast_Biol/03%20Yeast% 20Metabolism.pdf
http://lfbisson.ucdavis.edu/PDF/VEN124%20Section%203.pdf
https://people.ok.ubc.ca/neggers/Chem422A/VARIETAL%20AROMA%20COMPOUNDS.pdf
www.acai-natural-pain-free-health.com/passion-constituents.html
www.anchorwineyeast.com/enalch1.html
www.anchorwineyeast.com/enalch2.html

266
www.anchorwineyeast.com/envin7.html
www.anchorwineyeast.com/envin13.html
www.dsm.com/en_US/downloads/oenology/CCSauvignon.pdf
www.dsm.com/en_US/downloads/oenology/Fermicru_4F9.pdf
www.dsm.com/en_US/downloads/oenology/FermicruLVCB.pd
www.erbsloeh.com/en/datenblatt/Saft/Oenoferm_Freddo.pdf
www.foodsci.purdue.edu/research/labs/enology/Acid 2007slides.pdf
www.gpo.or.th/rdi/html/passionfruit.html
www.hort.purdue.edu/newcrop/morton/passionfruit.html#Storage
www.laffort.com/en/quality-management/74
www.laffort.com/en/products/zymaflore-yeasts/70
www.laffort.com/en/products/zymaflore-yeasts/71
www.lalittorale.com/en/oehefe_en.php
www.lallemandwine.com/catalog/img/catalog/description_activity_image_1209025085_QA23
eng.pdf
www.lallemandwine.com/catalog/products/view/61
www.lallemandwine.us/products/yeast_chart.php
www.lalvinyeast.com/images/library/EC1118_Yeast.pdf
www.maurivinyeast.com/media/35.pdf
www.moac.go.th/builder/bhad/passionfruit.php
www.msu.edu/~freed/disks.htm
www.nutritionanalyser.com/food_composition/?fid=09233
www.stou.ac.th/study/sumrit/12-51(500)/page1-12-51(500).html
www.thainutri.com/juicelineframe.htm
www.vivc.de/datasheet/dataResult.php?data=10818

267
8. ADDENDUM
Additional results which are described in this chapter are related to Scheurebe and
Sauvignon blanc grape juices and YPF juices which were used in different research trials of
this study.
In Table A-1, A-2 and A-3 the amino acid concentrations which were detected in the diverse
juices are listed.
Table A-1 Concentration of amino acids in Scheurebe grape juice used in trials described in
chapter 3.7.1 to 3.7.2
Amino acid (mg L-1) Juice 2007 Juice 2008
Aspartic acid 70.2 62.3
Threonine 65.7 77.6
Serine 38.7 51.5
Asparagine 8.2 9.2
Glutamic acid 79.2 98.2
Glutamine 174.8 173.4
α-Aminoadipic acid n.d. n.d.
Glycine 2.0 2.8
Alanine 96.2 92.9
Citrulline 6.0 10.5
α-Aminobutyric acid n.d. n.d.
Valine 16.7 29.4
Cystine n.d. n.d.
Methionine 2.7 8.0
Isoleucine 12.7 27.1
Leucine 13.4 33.3
Tyrosine 5.6 8.9
Phenylalanine 19.4 41.0
β-Alanine 2.0 2.5
β -Aminobutyric acid n.d. n.d.
-Aminobutyric acid 58.8 60.8
Histidine 11.2 17.6
Tryptophan 4.0 8.7
Ornithine 1.1 1.4
Lysine 3.1 5.7
Ammonia 54.9 66.4
Arginine 299.7 425.3
Proline 256.2 169.4
Total amino acids 1302.5 1484.0
Total amino acids (without proline) 1046.3 1314.6
n.d.: not detectable

268
Table A-2 Concentration of amino acids in fresh Sauvignon blanc grape juice used in trials
described in chapter 3.8.1 to 3.8.2
Amino acid (mg L-1) Sauvignon blanc juice
2008
Sauvignon blanc juice
2009
Aspartic acid 70.5 64.0
Threonine 81.0 90.7
Serine 47.2 69.8
Asparagine 3.5 4.8
Glutamic acid 82.7 158.6
Glutamine 99.0 128.7
α-Aminoadipic acid n.d. n.d.
Glycine 1.9 3.0
Alanine 138.8 209.7
Citrulline 11.9 15.1
α-Aminobutyric acid 0.4 0.4
Valine 10.7 20.1
Cystine n.d. n.d.
Methionine 1.4 1.5
Isoleucine 7.8 10.3
Leucine 10.2 15.4
Tyrosine 3.5 6.4
Phenylalanine 18.4 18.9
β-Alanine 1.3 3.5
-Aminobutyric acid 43.6 90.1
Histidine 10.8 23.3
Tryptophan 1.8 2.2
Ornithine 1.8 2.8
Lysine 2.2 1.8
Ammonia 69.9 70.2
Arginine 544.0 771.8
Proline 115.4 430.8
Total amino acids 1380.0 2213.7
Total amino acids (without proline)
1264.6
1782.9
n.d.: not detectable

269
Table A-3 Concentration of amino acids in prepared YPF juice used in YPF trials described
in chapter 3.9.1 to 3.9.4
Amino acids (mg L-1) YPF puree
Lists of prepared YPF juices
1st trial a 2nd trial b 3rd trial c 4th trial d
Aspartic acid 569.3 55.5 47.6 32.0 43.6
Threonine 13.8 1.1 1.0 0.7 1.0
Serine 201.3 19.1 16.9 11.1 15.9
Asparagine 6.1 n.d. n.d. n.d. n.d. Glutamic acid 709.8 64.1 54.7 37.7 49.3
Glutamine 82.7 7.2 7.0 4.2 5.6
α-Aminoadipic acid n.d. n.d. n.d. n.d. n.d. Glycine 7.1 0.7 0.7 0.7 0.8
Alanine 151.7 14.5 12.6 8.7 11.5
Citrulline n.d. n.d. n.d. n.d. n.d. α-Aminobutyric acid n.d. n.d. n.d. n.d. n.d. Valine 32.7 2.7 2.4 1.6 2.2
Cystine n.d. n.d. n.d. n.d. n.d. Methionine 4.0 n.d. n.d. n.d. n.d. Isoleucine 17.0 1.6 1.4 1.3 1.3
Leucine 30.7 2.9 2.5 1.9 2.3
Tyrosine 16.4 1.3 1.6 1.6 1.3
Phenylalanine 46.5 4.1 3.6 2.1 3.5
β-Alanine 8.0 0.6 0.6 0.3 0.7
-Aminobutyric acid 172.1 16.9 14.9 10.1 13.3
Histidine 23.5 2.2 1.9 1.3 1.9
Tryptophan n.d. n.d. n.d. n.d. n.d. Ornithine 0.4 n.d. n.d. n.d. n.d. Lysine 29.5 2.3 2.0 1.3 1.8
Ammonia 56.9 6.2 5.4 3.9 5.1
Arginine 47.0 4.1 3.9 2.4 3.0
Proline 153.1 12.5 11.2 8.4 11.1
Total amino acids 2644.1 219.6 191.5 131.6 175.6
Total amino acids
(without proline) 2491.0
207.1
180.3
123.1
164.4
n.d.: not detectable
a amino acid composition in prepared YPF juice for the 1
st YPF trial described in chapter 3.9.1
b amino acid composition in prepared YPF juice for the 2
nd YPF trial described in chapter 3.9.2
c amino acid composition in prepared YPF juice for the 3
rd YPF trial described in chapter 3.9.3
d amino acid composition in prepared YPF juice for the 4
th YPF trial described in chapter 3.9.4

270
a) 3-Sulphanylhexanol (m/z 134) b) Acetic acid 3-sulphanylhexyl ester (m/z 116) 1000 ng L
-1* 100 ng L
-1*
c) 4-Methyl-4-sulphanylpentan-2-one d) 4-Methoxy-2-methyl-2-sulphanylbutane
(m/z 132) 40 ng L-1*
(m/z 100) 200 ng L-1*
(Internal standard)
Figure A-1 Retention time windows of selected ion chromatograms showing the quantifier
ion peaks of the four thiols obtained in the analysis of the dearomatized wine
sample spiked with different levels of the analytes
*concentration added to dearomatized wine
4,2,2MSB
3SH
minutes
3SHA
4MSP
minutes
minutes minutes

271
Figure A-2 Experimental outline for the fermentation trials of Scheurebe and Sauvignon blanc grape juices and YPF juices
Scheurebe
Grape juice
Fresh juice with two commercial yeast strains, four nutrient sources and without nutrient (Chapter 3.7.1)
Fresh juice with nine commercial yeast strains and two nutrient sources (Chapter 3.8.1)
YPF juice with fourteen commercial yeast strains and DAP addition (Chapter 3.9.1)
Fresh juice with thirteen commercial yeast strains (Chapter 3.7.2)
Preliminary trials: Fresh juice with different origins, commercial yeast strains and/or nutrient supplements (data not shown)
Fresh juice with five commercial yeast strains and four nutrient sources (Chapter 3.8.2)
YPF juice with five commercial yeast strains and two nutrient sources at two different levels (Chapter 3.9.3)
YPF juice with three commercial yeast strains and four nutrient sources at two different levels (Chapter 3.9.4)
YPF juice with three commercial yeast strains and five nutrient sources (Chapter 3.9.2)
Yellow passion
fruit (YPF) juice
Sauvignon blanc
Preliminary trials: Pasteurized or fresh juice with different commercial yeast strains and/or nutrient supplements (data not shown)

272
List of publication and presentation
Publication:
Srisamatthakarn, P., Rauhut, D., & Brückner, H. (2010). Impact of commercial yeast strains
on wine fermentation and formation of metabolites of yellow passion fruit juice (Passiflora
edulis Sims f. flavicarpa Degner). Asian Journal of Food and Agro-Industry, 3 (2), 282-292.
Poster:
Srisamatthakarn, P., Rauhut, D., & Brückner, H. (2009). Impact of commercial yeast strains
on wine fermentation and formation of metabolites of yellow passion fruit juice (Passiflora
edulis Sims f. flavicarpa Degner). 1st International Conference on the Role of Universities in
Hands-On Education, Rajamangala University of Technology Lanna, Chiang Mai, Thailand.
23.-28. August 2009.
Oral presentation:
Srisamatthakarn, P., Rauhut, D., & Brückner, H. (2010). Effect of commercial yeast strains
on wine fermentation and metabolic compounds of yellow passion fruit (Passiflora edulis
Sims f. flavicarpa Degner) wines. 28th Specialised Symposium on Yeasts, Bangkok,
Thailand. 15.-18. September 2010.

273
ACKNOWLEDGEMENTS
This work was carried out at the Department of Microbiology and Biochemistry of the
Geisenheim Research Center during the years 2006-2010. The fellowship of necessary
financial support and the allowance throughout the period of my doctoral program of the
Rajamangala University of Technology Suvarnabhumi (RMUTSB) and Lanna (RMUTL),
Thailand, are gratefully acknowledged.
I wish to express my sincere thanks and gratitude to Prof. Dr. Hans Brückner and Prof. Dr.
Doris Rauhut for their great supervision with a perfect balance of the necessary guidance
and for providing excellent working facilities as well as their tireless encouragement and
support with kind understanding.
My sincere gratitude is due to Prof. Dr. Sylvia Schnell for her kind support and scientific
suggestions to achieve this study program.
I am very grateful to Prof. Dr. Klaus Schaller, Prof. Dr. Manfred Großmann and Dr. Christian
von Wallbrunn for the valuable suggestions and their support with technical infrastructure at
the Geisenheim Research Center where I conducted all the experimental work.
Working with the colleagues at the Department of Microbiology and Biochemistry of the
Geisenheim Research Center has been a wonderful experience and memorial, particularly
Andreas Kapaklis and Helmut Kürbel for their appreciative and excellent carrying out of the
varietal thiol analysis with great enthusiasm. Many thanks also to Beata Beisert, Stefanie
Fritsch, Heike Semmler and Judith Muno-Bender for their support and assistance to analyse
the huge amount of samples with different analytical equipment and Anja Abd Elrehim for
proofreading of my dissertation.
Caroline Knoll, Armin Schüttler, Daniel Gerhards and Bernd Christoph Lochbühler for sharing
their enthusiasm of many helpful discussions and friendship are also acknowledged with
thanks.
Hereby I also wish to grateful thank all my friends for their help and kind understanding as
well as for their enjoyable friendship in every occasion during my whole stay at Geisenheim,
especially Praderm Daum, Kasorn Haber, Jamsai Hirsch, Alfred Weiß, Fritz Hauch, Chalalai
Hauch and Jakapan Rodsup.

274
I thank Asst. Prof. Dr. Wanphen Jitjaroen and Dr. Ni-orn Chomsri who proposed me the
opportunity to study in Germany. I heartily appreciate the staffs of Department of Food
Science, Lampang Agricultural Research and Training Center, RMUTL for their support,
encouragement and much understanding during my absence from work.
I would like to thank to Lallemand (Danstar Ferment AG, Switzerland), DSM Food
Specialities (Delft, The Netherlands), Laffort Oenologie (Bordeaux, France), Erbslöh
Geisenheim AG and La Littorale - Groupe Erbslöh (Geisenheim, Germany), Anchor-Bio
Technologies (Eppindust, South Africa) and AB Mauri (Mauri Yeast Australia, Australia) for
their supply of yeasts and nutrients.
I warmly thank my parents, Mrs. Boonma Srisamatthakarn and my family as well as my true
friend, Ms. Patcharawadee Wattanawikkit, for their great inspiring, encouragement and
wonderful support during my whole life.
Finally, my deep gratitude to those who have contributed to the successful accomplishment
of this work in some way but are not mentioned here.

275
Erklärung
„Ich erkläre: Ich habe die vorgelegte Dissertation selbständig und ohne unerlaubte fremde
Hilfe und nur mit den Hilfen angefertigt, die ich in der Dissertation angegeben habe. Alle
Textstellen, die wörtlich oder sinngemäß aus veröffentlichten Schriften entnommen sind, und
alle Angaben, die auf mündlichen Auskünften beruhen, sind als solche kenntlich gemacht.
Bei den von mir durchgeführten und in der Dissertation erwähnten Untersuchungen habe ich
die Grundsätze guter wissenschaftlicher Praxis, wie sie in der „Satzung der Justus-Liebig-
Universität Giessen zur Sicherung guter wissenschaftlicher Praxis― niedergelegt sind,
eingehalten.―
Geisenheim, den 03. Dezember 2010 Unterschrift: .....................................................