Improvement and Investigation of the Requirements for ...
10
Available online at www.HighTechJournal.org HighTech and Innovation Journal Vol. 2, No. 1, March, 2021 67 Improvement and Investigation of the Requirements for Electric Vehicles by the use of HVAC Modeling Hansjörg Kapeller a* , Dominik Dvorak a , Dragan Šimić a a AIT Austrian Institute of Technology GmbH, Giefinggasse 2, Vienna 1210, Austria. Received 15 October 2020; Revised 10 February 2021; Accepted 16 February 2021; Published 01 March 2021 Abstract Current activities in the field of vehicle electrification offer a great potential for contributing to climate change mitigation by reducing anthropogenic CO2 emissions. Beyond the environmental strain, there is an economic one, too. It is therefore crucial for the European automotive industry to exploit not only the environmental benefits, but also the business opportunities which come from the transition from conventional fuel powered to electrified vehicles. To capture these opportunities, electric vehicles must deliver better performance at a lower price, overcoming the constraints that are currently limiting their mass-market uptake. This paper presents the approach of the research and innovation action H2020 project QUIET to meet these stringent requirements by developing an improved and energy efficient electric vehicle with increased driving range under real world driving conditions. This is achieved by exploiting the synergies of a technology portfolio in the areas of: user centric design with enhanced passenger comfort and safety, lightweight materials with enhanced thermal insulation properties, and optimised vehicle energy management. Keywords: Environmental- and Economic Benefits; Increased Driving Range; User Centric Design; Lightweight Materials; Vehicle Energy Management. 1. Introduction Current activities in the field of vehicle electrification offer a great potential for contributing to climate change mitigation by reducing anthropogenic CO2 emissions. Beyond the environmental strain, there is an economic one, too. The automotive sector today accounts for 4 % of EU GDP employing approximately 12 million people in the manufacturing, sales, maintenance, and transport sector [1]. It is therefore crucial for the European automotive industry to exploit not only the environmental benefits, but also the business opportunities which come from the transition from conventional fuel powered to electrified vehicles. To capture these opportunities, electric vehicles must deliver better performance at a lower price, overcoming the constraints that are currently limiting their mass-market uptake. One of these is the limited driving range compared to conventional fuel vehicles, due to the still limited capacity and high cost of the battery systems. This aspect is exacerbated by cold and hot weather conditions and, more in general, by the variety of conditions that can be encountered in real-world driving. In fact, preliminary experimental tests from both the EU Commission and the US department of energy show a significant variation of the distance-specific energy demand of electric vehicles depending on the temperature, auxiliary systems load and driving conditions [2, 3]. Figure 1 depicts the reduced driving range of a medium-sized EV with a conventional HVAC system in cold (winter) and hot (summer) weather conditions [4]. A significant detrimental effect can be seen when heating up or cooling down the passenger * Corresponding author: [email protected] http://dx.doi.org/10.28991/HIJ-2021-02-01-07 This is an open access article under the CC-BY license (https://creativecommons.org/licenses/by/4.0/). © Authors retain all copyrights.
Transcript of Improvement and Investigation of the Requirements for ...
Available online at www.HighTechJournal.org
HighTech and Innovation Journal
Vol. 2, No. 1, March, 2021
67
Improvement and Investigation of the Requirements for Electric
Vehicles by the use of HVAC Modeling
Hansjörg Kapeller a*, Dominik Dvorak a, Dragan Šimić a a AIT Austrian Institute of Technology GmbH, Giefinggasse 2, Vienna 1210, Austria.
Received 15 October 2020; Revised 10 February 2021; Accepted 16 February 2021; Published 01 March 2021
Abstract
Current activities in the field of vehicle electrification offer a great potential for contributing to climate change mitigation
by reducing anthropogenic CO2 emissions. Beyond the environmental strain, there is an economic one, too. It is therefore
crucial for the European automotive industry to exploit not only the environmental benefits, but also the business
opportunities which come from the transition from conventional fuel powered to electrified vehicles. To capture these
opportunities, electric vehicles must deliver better performance at a lower price, overcoming the constraints that are
currently limiting their mass-market uptake. This paper presents the approach of the research and innovation action
H2020 project QUIET to meet these stringent requirements by developing an improved and energy efficient electric
vehicle with increased driving range under real world driving conditions. This is achieved by exploiting the synergies of
a technology portfolio in the areas of: user centric design with enhanced passenger comfort and safety, lightweight
materials with enhanced thermal insulation properties, and optimised vehicle energy management.
Keywords: Environmental- and Economic Benefits; Increased Driving Range; User Centric Design; Lightweight Materials; Vehicle
Energy Management.
1. Introduction
Current activities in the field of vehicle electrification offer a great potential for contributing to climate change
mitigation by reducing anthropogenic CO2 emissions. Beyond the environmental strain, there is an economic one, too.
The automotive sector today accounts for 4 % of EU GDP employing approximately 12 million people in the
manufacturing, sales, maintenance, and transport sector [1].
It is therefore crucial for the European automotive industry to exploit not only the environmental benefits, but also
the business opportunities which come from the transition from conventional fuel powered to electrified vehicles. To
capture these opportunities, electric vehicles must deliver better performance at a lower price, overcoming the
constraints that are currently limiting their mass-market uptake. One of these is the limited driving range compared to
conventional fuel vehicles, due to the still limited capacity and high cost of the battery systems. This aspect is
exacerbated by cold and hot weather conditions and, more in general, by the variety of conditions that can be
encountered in real-world driving. In fact, preliminary experimental tests from both the EU Commission and the US
department of energy show a significant variation of the distance-specific energy demand of electric vehicles
depending on the temperature, auxiliary systems load and driving conditions [2, 3]. Figure 1 depicts the reduced
driving range of a medium-sized EV with a conventional HVAC system in cold (winter) and hot (summer) weather
conditions [4]. A significant detrimental effect can be seen when heating up or cooling down the passenger
* Corresponding author: [email protected]
http://dx.doi.org/10.28991/HIJ-2021-02-01-07
This is an open access article under the CC-BY license (https://creativecommons.org/licenses/by/4.0/).
© Authors retain all copyrights.

HighTech and Innovation Journal Vol. 2, No. 1, March, 2021
68
compartment, quantifiable in up to 22 % reduction of driving range in hot (+40 °C) and up to 60 % in cold (-10 °C)
weather conditions. The described scenarios also consider relative humidity (rH) and the solar radiation (W/m²).
Figure 1. Driving range reduction of a medium-sized EV in cold (heating) and hot (cooling) weather conditions, applying a
conventional HVAC system [4]
To address the challenge of enhancing driving range, the synergies of a technology portfolio in the areas of user-
centric design (with enhanced passenger comfort and safety), lightweight materials (with enhanced thermal insulation
properties), and optimized vehicle energy management have been exploited.
Hence, the present work aims to reduce the energy needed for cooling and heating the cabin of an electric vehicle
under different driving conditions, by at least 30 % compared to a state of the art (SotA) electric vehicle (EV),
particularly a Honda Fit EV. Additionally, a weight reduction of about 20 % of vehicle components (e.g. doors,
windshields, seats, heating and air conditioning) is also addressed. These efforts will lead at the end to a minimum of
25 % driving range increase under both hot (+40 °C) and cold (-10 °C) weather conditions.
2. Methodology of the QUIET Project
To increase the driving range of an EV, reducing the energy required for the thermal management system while
preserving or even increasing thermal passenger comfort at the same time is a potential method. Hence, effort must be
put into the design of novel and innovative components to reach this goal. For the groundwork all components which
are relevant (e.g. doors, seats, windshield, heating- and cooling modules and the overall vehicle) are modelled in a
simulation tool, validated and optimized to meet the desired criteria also under various environmental conditions.
Furthermore, the developed simulation models are the basis for analyzing the integration of the components into the
vehicle e.g. by investigating their interaction and the synergetic effects of the different subsystems, and to estimate the
entire EV’s energy consumption.
The acquired data of the research demonstrator (i.e. Honda FIT EV) and the resulting baseline performances are
used to validate the modelled components and to identify improvement potentials of the Honda Fit EV. The analysis
of the potential and the feasibility of possible innovations is initially performed by using mathematical equations and
1D models of the analyzed systems.
The design and simulation phases are followed by assembling the components and subsystems on test beds to test
and optimize them individually until all modules are satisfying the required criteria. Further topics which are
investigated in this work are novel refrigerants for cooling, combined with an energy-saving heat pump operation for
heating, advanced thermal storages based on phase change materials, powerfilms for infrared radiative heating, and
materials for enhanced thermal insulation of the cabin.
Further focus is put on lightweight glasses and composites for windows and chassis, as well as light-metal
aluminium or magnesium seat components. The thermal performance of the vehicle is additionally enhanced by
optimized energy management strategies, such as pre-conditioning and zonal cooling/heating the passenger cabin as
well as user-centric designed cooling/heating modules.
This holistic approach enables finally to qualify and realize an improved QUIET demonstrator used for proof of
concept, vehicle testing, and comparison with the reference EV regarding thermal comfort and entire vehicle energy
consumption.
HighTech and Innovation Journal Vol. 2, No. 1, March, 2021
69
3. Requirement Definition and Simulation Approach
The measured vehicle data and the resulting baseline performances were the first benchmark for conceiving the
requirements for novel solutions, leading to the targeted efficiency improvements of the vehicle and therefore to an
enlarged usable electric driving range.
To find improvement potentials of the Honda Fit EV, a virtual analysis of the potential of innovations was
performed by means of 1D Modelica models created in Dymola [5], a software tool which allows to create any kind of
multi-physical models based on ordinary, algebraic differential equations.
3.1. Modelica Vehicle Model
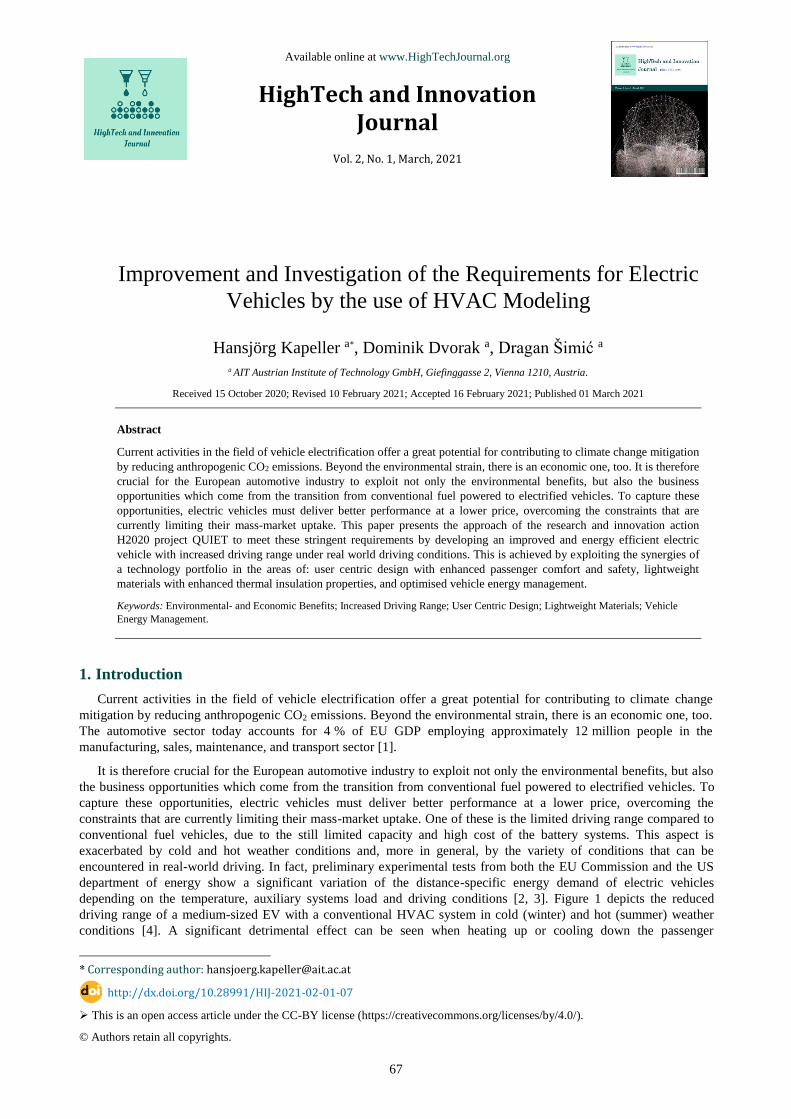
In Figure 2 a screenshot of the developed Modelica vehicle model is depicted, which was realized in the simulation
environment Dymola. The implementation represents the entire vehicle model of a fully electric driven Honda Fit EV
consisting of several sub-models which are interconnected via mechanical and electrical connectors and interfaces and
a bus system.
Figure 2. Reference vehicle model of the Honda Fit EV modelled in Dymola/Modelica
Since the Honda Fit EV car is available as study subject, a large amount of measurement data is available to ensure
validity of the vehicle model but also to provide real-life data (like driving cycles, velocities, etc.) as realistic target
values for the simulation. This data is available in the ‘Measurements’ block whereas different data sets can be loaded
before simulation starts. Different driving cycles (e.g. WLTP cycle [6]) can be used in simulations to predict relevant
performance values such as energy consumption and losses of transmissions, electric engines, batteries, auxiliaries
(like heating, ventilation and air conditioning systems ‘HVAC’, etc.).
A parameter extraction script developed in the numerical computing environment MatLab was applied to
measurement data (like vehicle speed, rotational speed and torque of the e-machine as well as voltage and current of
the e-machine and the battery) to get relevant parameters for the vehicle model and its sub components. The most
important parameters which have been extracted were (i) the driving resistance coefficients, (ii) the e-machine- and
inverter parameters and their operating maps and (iii) the battery parameters.
Driver
A
Trans
Ambience
Chassis
AxleFront AxleRear
MG
MG1
Battery
EES
Cycle
MG
Strategy
ECU
Measurements
HVAC
Bus
HighTech and Innovation Journal Vol. 2, No. 1, March, 2021
70
3.2. Thermal Vehicle Model – HVAC Modeling
The importance of proper thermal management is highlighted by the fact that heating in cold winter conditions or
cooling in warm summer conditions (e.g. at an ambient temperature of -10 °C and +40 °C, respectively), can consume
up to 60 % of the batterie’s capacity, which in turn reduces the maximum driving range of the vehicle by 60 % (cp.
Figure 1). To deal with this issue, protracted real life test can be used for designing and testing new HVAC systems
and components. Another, more cost time-saving option (i.e. economic benefit) would be to base the design of the
HVAC system or its operating strategy on simulation models. Hence, this work addresses also the design the HVAC
system by using a model-based design approach to increase on the one hand the efficiency of the conventional (air-
based) HVAC system and on the other hand by adapting novel technologies such as infrared heating panel.
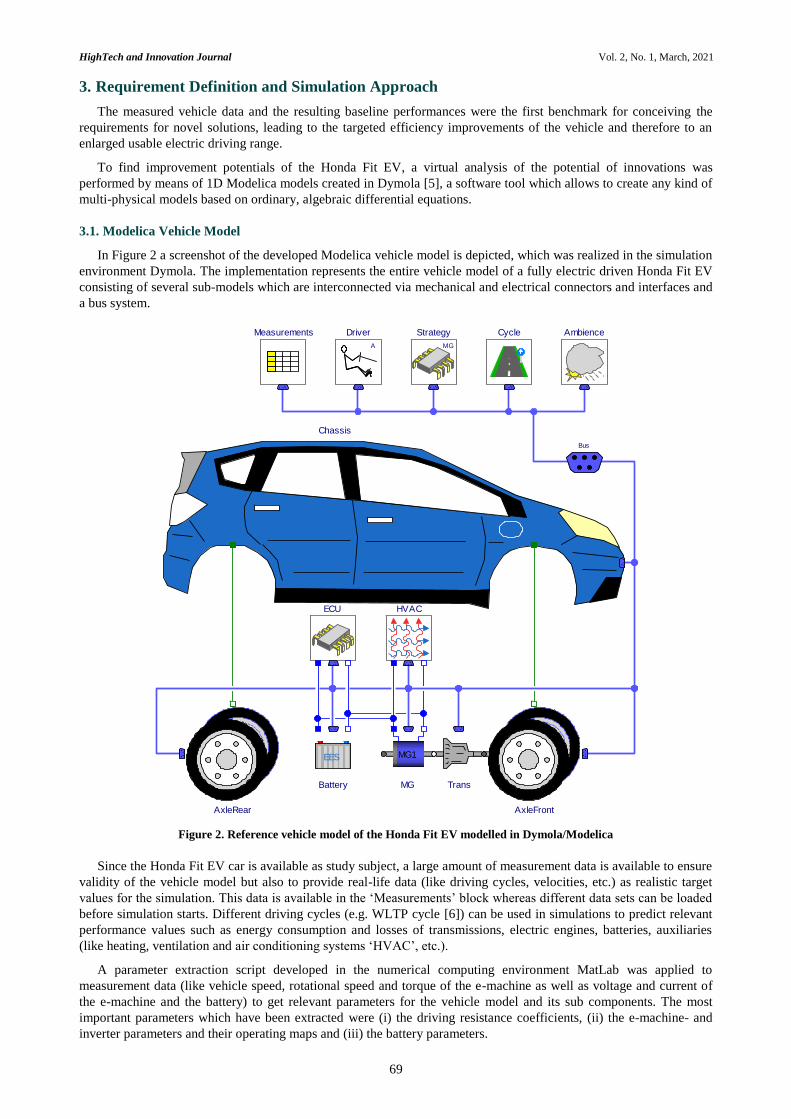
In order to investigate the operating behaviour of the HVAC system in different application scenarios (i.e. heat
pump operation at low ambient temperatures and cooling operation at high ambient temperatures), an entire Propane-
based (R290) HVAC model has been implemented in Dymola/Modelica using components from the model library
TIL Suite [7]. TIL is a commercial library for steady-state and transient simulation of thermodynamic systems. The
thermodynamic properties are obtained through TILMedia, a library for the calculation of thermophysical substance
properties, providing an interface with the Modelica Media library (MSL). The TIL library includes a variety of
models for thermodynamic components (e.g. heat exchangers, pumps, expanders). The implemented HVAC model is
depicted in Figure 3.
Figure 3. Implemented HVAC model in Dymola/Modelica using components from the model library TIL Suite

HighTech and Innovation Journal Vol. 2, No. 1, March, 2021
71
Each single component has been parameterised separately. Therefore, measurement data has been used. The
boundary conditions, such as pressure and temperature, in different operating points have been defined based on the
measurements. Then, characteristic quantities that are relevant for the respective component (i.e. mass flow, heat
transfer, outlet temperature, outlet pressure) have been analysed during simulation. Based on the comparison between
measured and simulated values, the quality of the chosen model parameters was determined by using an automated
adaptive tree search algorithm for parameter tuning tasks which has been implemented by the AIT. Afterwards, the
parameterized single models have been connected step-by-step to get the final HVAC model which is depicted in Figure 3.
The model is structured in three different parts: refrigerant cycle (green), water cycles (blue) and air cycles (orange).
The refrigerant cycle considers the compressor, condenser, separator, internal heat exchanger, expansion valve and
evaporator. The water cycles (for cooling power electronics and for HVAC system) consist of the water side of the
condenser, evaporator and front heat exchanger, a PTC heater, pumps and valves. By switching the water cycle valves the
refrigerant cycle can be either used in cooling or in heat pump mode. The air cycle considers the front heat exchanger (the
heat exchanger is divided into four parts, where one quarter is used for the power electronics and three quarters are used for
the HVAC system), the cabin heat exchangers (heater core and low temperature radiator), the front vehicle fan and cabin
fan and a cabin volume.
4. Comparison of Simulation Results with Measurement Data
4.1. Validation of the Modelica Vehicle Model
With the vehicle model depicted in Figure 2 a detailed identification of the energy flows of the reference and the
improved QUIET vehicle has been carried out. Thereby, possible energy-saving potentials have been determined and
validated with measurement data gained from worldwide harmonized light vehicles test procedures (WLTP). The
WLTP cycle used for validation and verification of developed simulation model (i.e. identification of reference Fit EV
vehicle) is a class 3 cycle aimed for high-power vehicles classified by a power-weight ratio PWr > 34 kW/t [6]. The
cycle (cp. Figure 4 can divided in four parts for low, medium, high, and extra high speed and is periodically applied to
the entire vehicle model during different ambient conditions (norm @ +23 °C, cold @ -10 °C, hot @ +40 °C) and
different operation modes (i.e. without HVAC, heating mode, cooling mode).
Figure 4. Single WLTP cycle
Table 1 summarizes the performed validation for all different driving modes based on the applied WLTP cycle and
for the additional modes MAX heat-up and MAX cool-down (both carried out at 40 km/h constant vehicle speed). The
simulated values show only minor differences compared to the measured ones which could be achieved by recursive
improvements of the vehicle simulation model during its development and due to suitable selection of different
iteration algorithms provided in Dymola.
HighTech and Innovation Journal Vol. 2, No. 1, March, 2021
72
Table 1. Measured vs. simulated (baseline) driving ranges
Driving mode Driving range
(measured)
Driving range
(simulated)
SOC remaining
(measured)
SOC remaining
(simulated)
WLTP norm 155.56 km 155.56 km 0.00 % 1.86 %
WLTP cold 68.40 km 68.43 km 0.00 % 4.86 %
WLTP hot 137.00 km 135.74 km 0.00 % 1.01 %
MAX heat-up* 43.64 km 43.64 km 22.9 % 25.07 %
MAX cool-down* 35.37 km 35.37 km 80.5 % 81.96 %
*Constant vehicle speed (40 km/h)
To identify the energy flows of the reference EV and the improved QUIET vehicle, the validated entire vehicle
model was used to fine-tune various key parameters (e.g. reduction of the energy consumption of auxiliaries or weight
reduction of vehicle components, etc.). By varying systematically, the key parameters (e.g. the weight of vehicle
components) the maximum driving range could be identified, and outperforming impacts became visible.
4.2. Validation of the HVAC Model
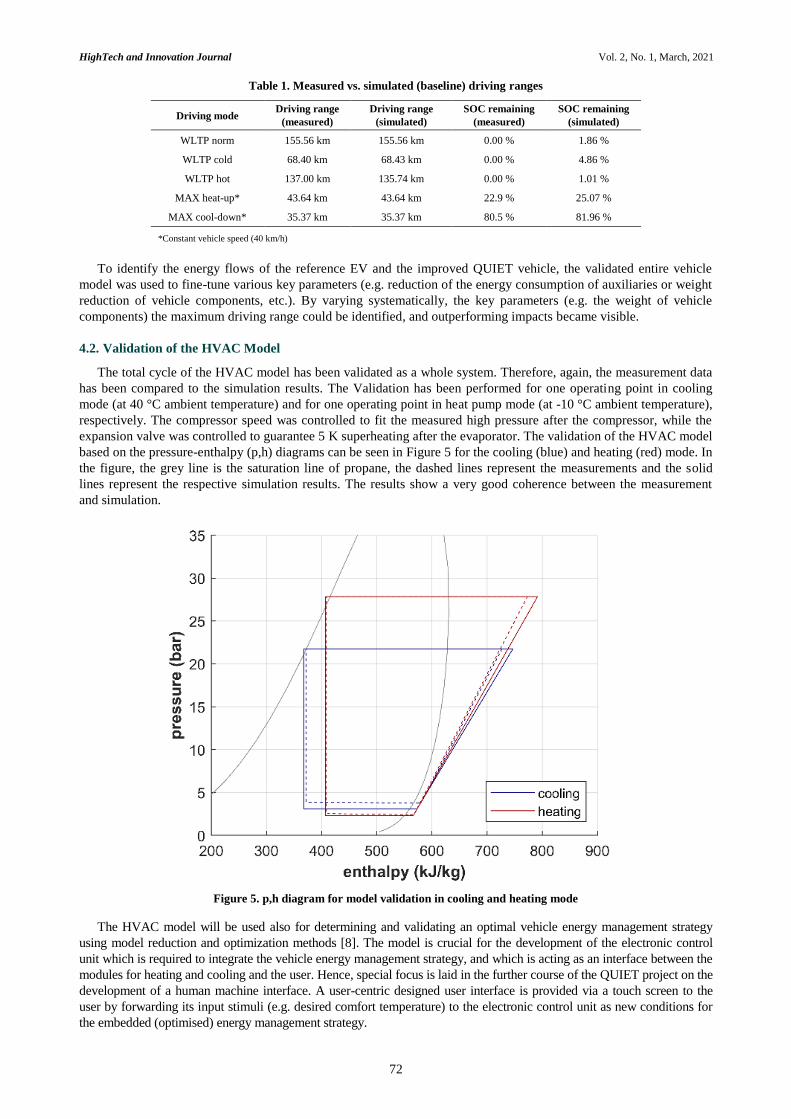
The total cycle of the HVAC model has been validated as a whole system. Therefore, again, the measurement data
has been compared to the simulation results. The Validation has been performed for one operating point in cooling
mode (at 40 °C ambient temperature) and for one operating point in heat pump mode (at -10 °C ambient temperature),
respectively. The compressor speed was controlled to fit the measured high pressure after the compressor, while the
expansion valve was controlled to guarantee 5 K superheating after the evaporator. The validation of the HVAC model
based on the pressure-enthalpy (p,h) diagrams can be seen in Figure 5 for the cooling (blue) and heating (red) mode. In
the figure, the grey line is the saturation line of propane, the dashed lines represent the measurements and the solid
lines represent the respective simulation results. The results show a very good coherence between the measurement
and simulation.
Figure 5. p,h diagram for model validation in cooling and heating mode
The HVAC model will be used also for determining and validating an optimal vehicle energy management strategy
using model reduction and optimization methods [8]. The model is crucial for the development of the electronic control
unit which is required to integrate the vehicle energy management strategy, and which is acting as an interface between the
modules for heating and cooling and the user. Hence, special focus is laid in the further course of the QUIET project on the
development of a human machine interface. A user-centric designed user interface is provided via a touch screen to the
user by forwarding its input stimuli (e.g. desired comfort temperature) to the electronic control unit as new conditions for
the embedded (optimised) energy management strategy.
HighTech and Innovation Journal Vol. 2, No. 1, March, 2021
73
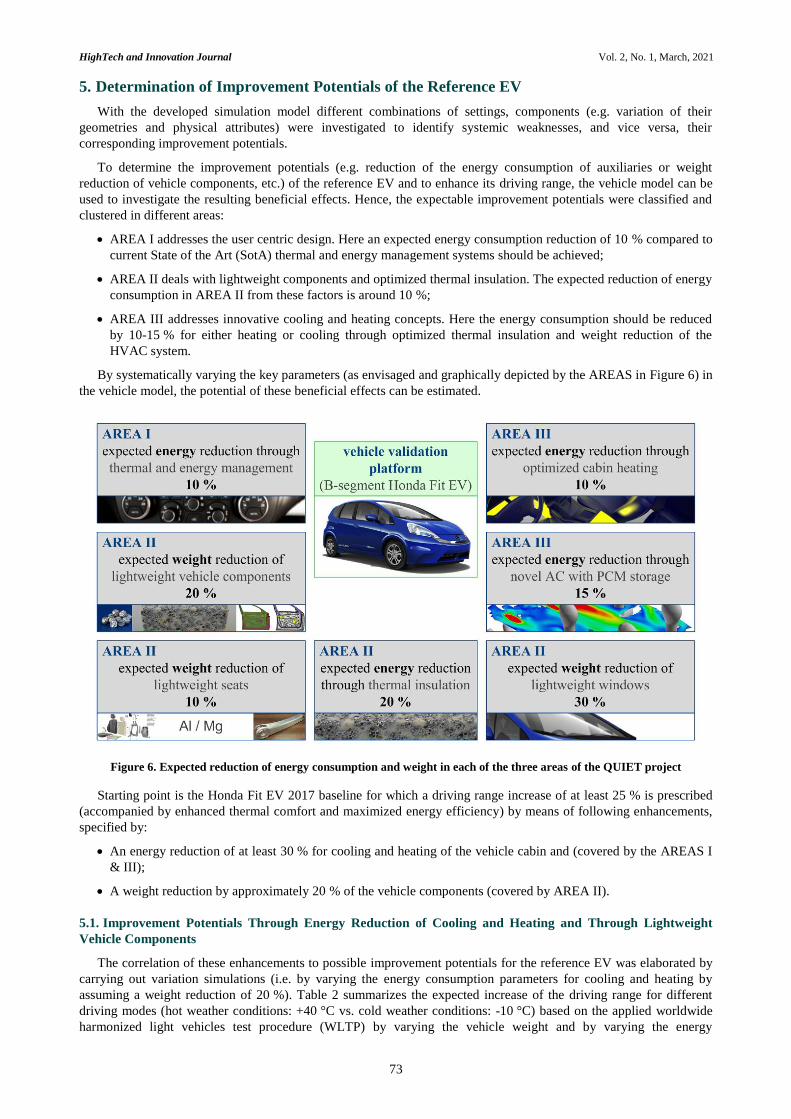
5. Determination of Improvement Potentials of the Reference EV
With the developed simulation model different combinations of settings, components (e.g. variation of their
geometries and physical attributes) were investigated to identify systemic weaknesses, and vice versa, their
corresponding improvement potentials.
To determine the improvement potentials (e.g. reduction of the energy consumption of auxiliaries or weight
reduction of vehicle components, etc.) of the reference EV and to enhance its driving range, the vehicle model can be
used to investigate the resulting beneficial effects. Hence, the expectable improvement potentials were classified and
clustered in different areas:
AREA I addresses the user centric design. Here an expected energy consumption reduction of 10 % compared to
current State of the Art (SotA) thermal and energy management systems should be achieved;
AREA II deals with lightweight components and optimized thermal insulation. The expected reduction of energy
consumption in AREA II from these factors is around 10 %;
AREA III addresses innovative cooling and heating concepts. Here the energy consumption should be reduced
by 10-15 % for either heating or cooling through optimized thermal insulation and weight reduction of the
HVAC system.
By systematically varying the key parameters (as envisaged and graphically depicted by the AREAS in Figure 6) in
the vehicle model, the potential of these beneficial effects can be estimated.
Figure 6. Expected reduction of energy consumption and weight in each of the three areas of the QUIET project
Starting point is the Honda Fit EV 2017 baseline for which a driving range increase of at least 25 % is prescribed
(accompanied by enhanced thermal comfort and maximized energy efficiency) by means of following enhancements,
specified by:
An energy reduction of at least 30 % for cooling and heating of the vehicle cabin and (covered by the AREAS I
& III);
A weight reduction by approximately 20 % of the vehicle components (covered by AREA II).
5.1. Improvement Potentials Through Energy Reduction of Cooling and Heating and Through Lightweight
Vehicle Components
The correlation of these enhancements to possible improvement potentials for the reference EV was elaborated by
carrying out variation simulations (i.e. by varying the energy consumption parameters for cooling and heating by
assuming a weight reduction of 20 %). Table 2 summarizes the expected increase of the driving range for different
driving modes (hot weather conditions: +40 °C vs. cold weather conditions: -10 °C) based on the applied worldwide
harmonized light vehicles test procedure (WLTP) by varying the vehicle weight and by varying the energy
HighTech and Innovation Journal Vol. 2, No. 1, March, 2021
74
consumption needed for cooling (AC mode) and for heating mode, respectively. The highlighted values within the
blue cells are representing the driving range increase in percent. Under the assumption of an achievable weight
reduction of the vehicle of about 75 kg the simulation results have shown, that reducing the cooling energy by 45 %
(in hot weather conditions: +40 °C) would lead to a driving range increase of about 10 % (baseline driving range is
137 km). Reducing the heating energy by 40 % (in cold weather conditions: -10 °C) would lead to a driving range
increase of about 27 % (baseline driving range is 68 km).
The highest improvement potential to increase the vehicle driving range of about 25 % can be reached if merely a
reduction of the heating energy of about 40 % will be realized. When supposing a weight reduction by approximately
20 % of the vehicle components (i.e. a further vehicle weight reduction of more than 75 kg due to introduction of
lightweight materials [9, 10] for doors, seats, and polycarbonate glazing) the target results have been exceeded for hot
conditions (range increase over 27 %).
Table 2. Expected increase of the driving range (cp. blue cells, in percent) under different driving conditions
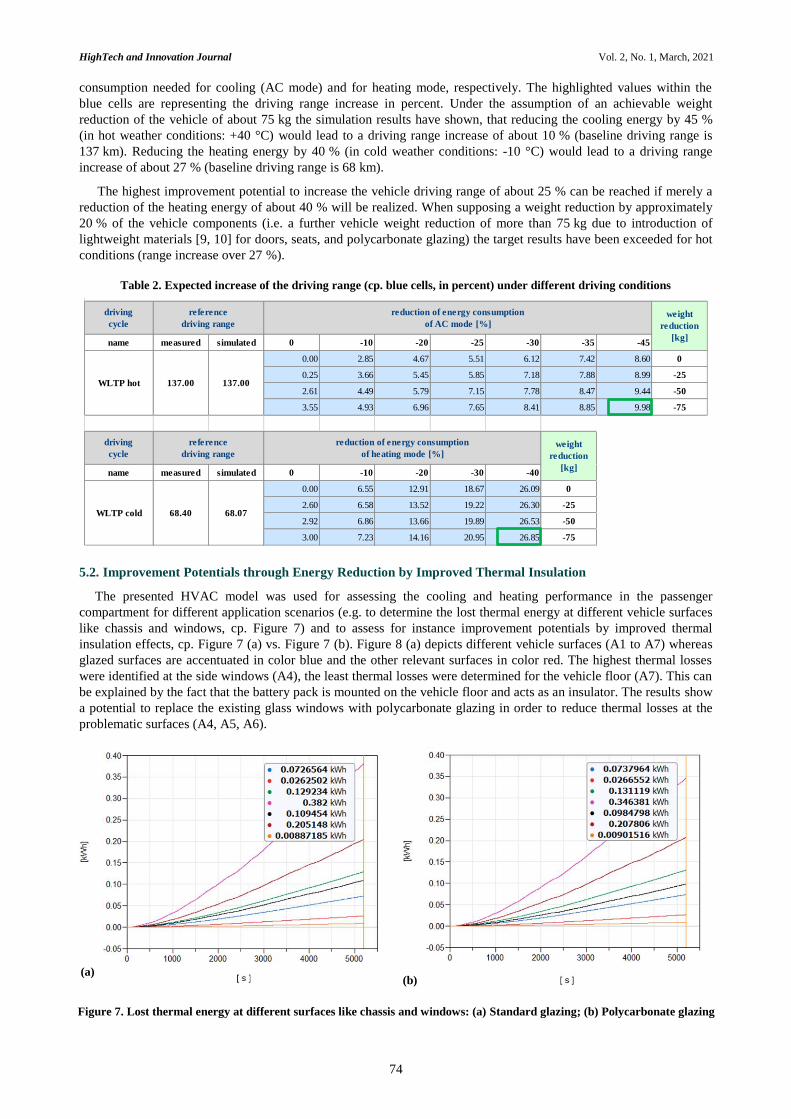
5.2. Improvement Potentials through Energy Reduction by Improved Thermal Insulation
The presented HVAC model was used for assessing the cooling and heating performance in the passenger
compartment for different application scenarios (e.g. to determine the lost thermal energy at different vehicle surfaces
like chassis and windows, cp. Figure 7) and to assess for instance improvement potentials by improved thermal
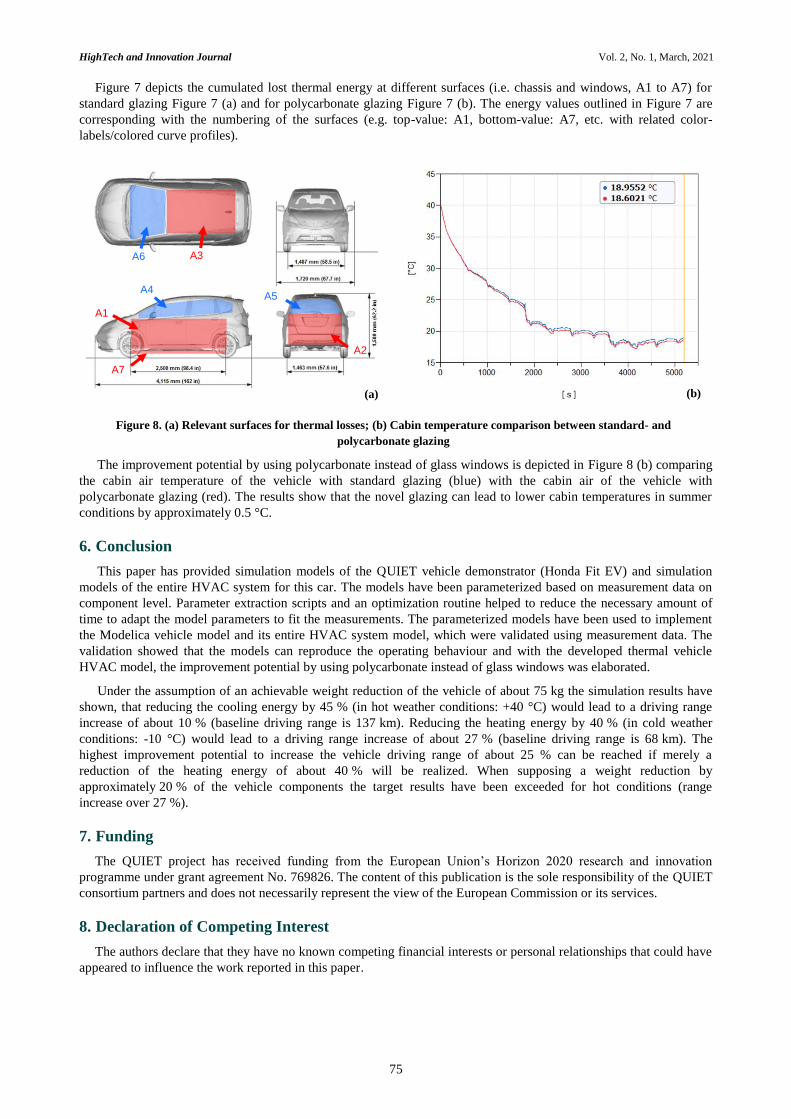
insulation effects, cp. Figure 7 (a) vs. Figure 7 (b). Figure 8 (a) depicts different vehicle surfaces (A1 to A7) whereas
glazed surfaces are accentuated in color blue and the other relevant surfaces in color red. The highest thermal losses
were identified at the side windows (A4), the least thermal losses were determined for the vehicle floor (A7). This can
be explained by the fact that the battery pack is mounted on the vehicle floor and acts as an insulator. The results show
a potential to replace the existing glass windows with polycarbonate glazing in order to reduce thermal losses at the
problematic surfaces (A4, A5, A6).
Figure 7. Lost thermal energy at different surfaces like chassis and windows: (a) Standard glazing; (b) Polycarbonate glazing
driving
cyclewithout
name measured simulated HVAC
0.00 0
0.48 -25
0.93 -50
1.45 -75
driving
cycle
name measured simulated 0 -10 -20 -25 -30 -35 -45
0.00 2.85 4.67 5.51 6.12 7.42 8.60 0
0.25 3.66 5.45 5.85 7.18 7.88 8.99 -25
2.61 4.49 5.79 7.15 7.78 8.47 9.44 -50
3.55 4.93 6.96 7.65 8.41 8.85 9.98 -75
driving
cycle
name measured simulated 0 -10 -20 -30 -40
0.00 6.55 12.91 18.67 26.09 0
2.60 6.58 13.52 19.22 26.30 -25
2.92 6.86 13.66 19.89 26.53 -50
3.00 7.23 14.16 20.95 26.85 -75
reference
driving rangeweight
reduction
[kg]
WLTP norm 155.60 155.58
reference
driving range
reduction of energy consumption
of AC mode [%]weight
reduction
[kg]
WLTP hot 137.00 137.00
reference
driving range
reduction of energy consumption
of heating mode [%]weight
reduction
[kg]
WLTP cold 68.40 68.07
(a)
(b)
HighTech and Innovation Journal Vol. 2, No. 1, March, 2021
75
Figure 7 depicts the cumulated lost thermal energy at different surfaces (i.e. chassis and windows, A1 to A7) for
standard glazing Figure 7 (a) and for polycarbonate glazing Figure 7 (b). The energy values outlined in Figure 7 are
corresponding with the numbering of the surfaces (e.g. top-value: A1, bottom-value: A7, etc. with related color-
labels/colored curve profiles).
Figure 8. (a) Relevant surfaces for thermal losses; (b) Cabin temperature comparison between standard- and
polycarbonate glazing
The improvement potential by using polycarbonate instead of glass windows is depicted in Figure 8 (b) comparing
the cabin air temperature of the vehicle with standard glazing (blue) with the cabin air of the vehicle with
polycarbonate glazing (red). The results show that the novel glazing can lead to lower cabin temperatures in summer
conditions by approximately 0.5 °C.
6. Conclusion
This paper has provided simulation models of the QUIET vehicle demonstrator (Honda Fit EV) and simulation
models of the entire HVAC system for this car. The models have been parameterized based on measurement data on
component level. Parameter extraction scripts and an optimization routine helped to reduce the necessary amount of
time to adapt the model parameters to fit the measurements. The parameterized models have been used to implement
the Modelica vehicle model and its entire HVAC system model, which were validated using measurement data. The
validation showed that the models can reproduce the operating behaviour and with the developed thermal vehicle
HVAC model, the improvement potential by using polycarbonate instead of glass windows was elaborated.
Under the assumption of an achievable weight reduction of the vehicle of about 75 kg the simulation results have
shown, that reducing the cooling energy by 45 % (in hot weather conditions: +40 °C) would lead to a driving range
increase of about 10 % (baseline driving range is 137 km). Reducing the heating energy by 40 % (in cold weather
conditions: -10 °C) would lead to a driving range increase of about 27 % (baseline driving range is 68 km). The
highest improvement potential to increase the vehicle driving range of about 25 % can be reached if merely a
reduction of the heating energy of about 40 % will be realized. When supposing a weight reduction by
approximately 20 % of the vehicle components the target results have been exceeded for hot conditions (range
increase over 27 %).
7. Funding
The QUIET project has received funding from the European Union’s Horizon 2020 research and innovation
programme under grant agreement No. 769826. The content of this publication is the sole responsibility of the QUIET
consortium partners and does not necessarily represent the view of the European Commission or its services.
8. Declaration of Competing Interest
The authors declare that they have no known competing financial interests or personal relationships that could have
appeared to influence the work reported in this paper.
A1
A2
A3
A7
A4 A5
A6
(b)
(a)
HighTech and Innovation Journal Vol. 2, No. 1, March, 2021
76
9. Nomenclature
EV Electric Vehicle GDP Gross Domestic Product
HMI Human Machine Interface HVAC Heating Ventilation and Air Conditioning
PTC Positive Temperature Coefficient rH Relative Humidity
SotA State of the Art WLTP World-wide harmonized Light-duty Test Procedure
QUIET QUalifying and Implementing a user-centric designed and EfficienT electric vehicle
10. References
[1] EU Commission DG Growth. Automotive Industry. Available online: https://ec.europa.eu/growth/sectors/automotive_en
(accessed on September 2020).
[2] De Gennaro, M., Paffumi, E., Martini, G., Manfredi, U., Vianelli, S., Ortenzi, F., & Genovese, A. (2015). Experimental Test
Campaign on a Battery Electric Vehicle: Laboratory Test Results (Part 1). SAE International Journal of Alternative
Powertrains, 4(1), 100–114. doi:10.4271/2015-01-1167.
[3] Paffumi, E., De Gennaro, M., Martini, G., Manfredi, U., Vianelli, S., Ortenzi, F., & Genovese, A. (2015). Experimental Test
Campaign on a Battery Electric Vehicle: On-Road Test Results (Part 2). SAE International Journal of Alternative Powertrains,
4(2), 277–292. doi:10.4271/2015-01-1166.
[4] U.S. Department of Energy (2016). Vehicle Systems 2015 Annual Report. DOE/EE-1304. Available online:
www.vehicles.energy.gov (accessed on September 2020).
[5] Elmquist, H., Mattsson, S. E. & Otter, M. (2001). Object-Oriented and Hybrid Modeling in Modelica. Journal Européen des
systèmes automatisés, 35 (4), 395-404.
[6] UNECE Website (Retrieved 15-10-2013). Worldwide harmonized Light vehicles Test Procedure (WLTP). Available online:
https://www2.unece.org/wiki/pages/viewpage.action?pageId=2523179 (accessed on September 2020).
[7] TIL Suite: Software package to simulate thermal systems (2019). TLK-Thermo GmbH, Braunschweig.
[8] Cvok, I., Škugor, B., & Deur, J. (2020). Control trajectory optimisation and optimal control of an electric vehicle HVAC system
for favourable efficiency and thermal comfort. Optimization and Engineering, 22(1), 83–102. doi:10.1007/s11081-020-09515-w.
[9] Weise, J. (2019). Porous materials for thermo management. EPMA (European Powder Metallurgy Association) Functional
Materials Seminar in Bremen, Germany.
[10] Takács, L. (2019). Mechanical Characterization of Composite Structures with Adhesive Joints. JEC WORLD Event. Paris,
France. Available online: https://www.jec-world.events/ (accessed on September 2020).