Improved understanding of physics processes in …phoenix.ps.uci.edu/zlin/bib/groebner13.pdfNucl....
19
IOP PUBLISHING and INTERNATIONAL ATOMIC ENERGY AGENCY NUCLEAR FUSION Nucl. Fusion 53 (2013) 093024 (19pp) doi:10.1088/0029-5515/53/9/093024 Improved understanding of physics processes in pedestal structure, leading to improved predictive capability for ITER R.J. Groebner 1 , C.S. Chang 2 , J.W. Hughes 3 , R. Maingi 2 , P.B. Snyder 1 , X.Q. Xu 4 , J.A. Boedo 5 , D.P. Boyle 2 , J.D. Callen 6 , J.M. Canik 7 , I. Cziegler 5 , E.M. Davis 3 , A. Diallo 2 , P.H. Diamond 5 , J.D. Elder 8 , D.P. Eldon 5 , D.R. Ernst 3 , D.P. Fulton 9 , M. Landreman 3 , A.W. Leonard 1 , J.D. Lore 7 , T.H. Osborne 1 , A.Y. Pankin 10 , S.E. Parker 11 , T.L. Rhodes 12 , S.P. Smith 1 , A.C. Sontag 7 , W.M. Stacey 13 , J. Walk 3 , W. Wan 11 , E.H.-J. Wang 4 , J.G. Watkins 14 , A.E. White 3 , D.G. Whyte 3 , Z. Yan 6 , E.A. Belli 1 , B.D. Bray 1 , J. Candy 1 , R.M. Churchill 3 , T.M. Deterly 1 , E.J. Doyle 12 , M.E. Fenstermacher 4 , N.M. Ferraro 1 , A.E. Hubbard 3 , I. Joseph 4 , J.E. Kinsey 1 , B. LaBombard 3 , C.J. Lasnier 4 , Z. Lin 9 , B.L. Lipschultz 3 , C. Liu 1 , Y. Ma 3 , G.R. McKee 6 , D.M. Ponce 1 , J.C. Rost 3 , L. Schmitz 12 , G.M. Staebler 1 , L.E. Sugiyama 3 , J.L. Terry 3 , M.V. Umansky 4 , R.E. Waltz 1 , S.M. Wolfe 3 , L. Zeng 12 and S.J. Zweben 2 1 General Atomics, PO Box 85608, San Diego, CA 92186–5608, USA 2 Princeton Plasma Physics Laboratory, PO Box 451, Princeton, NJ 08543-0451, USA 3 Massachusetts Institute of Technology, 77 Massachusetts Avenue, Cambridge, MA 02139-4307 USA 4 Lawrence Livermore National Laboratory, PO Box 808, Livermore, CA 94551, USA 5 University of California San Diego, 9500 Gilman Dr., La Jolla, CA 92093, USA 6 College of Engineering, University of Wisconsin, Madison, WI 53706-1390, USA 7 Oak Ridge National Laboratory, PO Box 2008, Oak Ridge, TN 37831, USA 8 Institute for Aerospace Studies, University of Toronto, Toronto, Ontario, M3H 576, Canada 9 Department of Physics and Astronomy, University of California, Irvine, CA 92616–6050, USA 10 Tech-X, Boulder, CO 80303, USA 11 Department of Physics, University of Colorado Boulder, Boulder, CO 80309, USA 12 Department of Physics and Astronomy, and PSTI, University of California, Los Angeles, CA 90095, USA 13 Georgia Institute of Technology, Atlanta, GA 30332, USA 14 Sandia National Laboratory, PO Box 5800, Albuquerque, NM 87185, USA E-mail: [email protected] Received 28 February 2013, accepted for publication 26 July 2013 Published 21 August 2013 Online at stacks.iop.org/NF/53/093024 Abstract Joint experiment/theory/modelling research has led to increased confidence in predictions of the pedestal height in ITER. This work was performed as part of a US Department of Energy Joint Research Target in FY11 to identify physics processes that control the H-mode pedestal structure. The study included experiments on C-Mod, DIII-D and NSTX as well as interpretation of experimental data with theory-based modelling codes. This work provides increased confidence in the ability of models for peeling–ballooning stability, bootstrap current, pedestal width and pedestal height scaling to make correct predictions, with some areas needing further work also being identified. A model for pedestal pressure height has made good predictions in existing machines for a range in pressure of a factor of 20. This provides a solid basis for predicting the maximum pedestal pressure height in ITER, which is found to be an extrapolation of a factor of 3 beyond the existing data set. Models were studied for a number of processes that are proposed to play a role in the pedestal n e and T e profiles. These processes include neoclassical transport, paleoclassical transport, electron temperature gradient turbulence and neutral fuelling. All of these processes may be important, with the importance being dependent on the plasma regime. Studies with several electromagnetic gyrokinetic codes show that the gradients in and on top of the pedestal can drive a number of instabilities. (Some figures may appear in colour only in the online journal) 0029-5515/13/093024+19$33.00 1 © 2013 IAEA, Vienna Printed in the UK & the USA
Transcript of Improved understanding of physics processes in …phoenix.ps.uci.edu/zlin/bib/groebner13.pdfNucl....
IOP PUBLISHING and INTERNATIONAL ATOMIC ENERGY AGENCY NUCLEAR FUSION
Nucl. Fusion 53 (2013) 093024 (19pp) doi:10.1088/0029-5515/53/9/093024
Improved understanding of physicsprocesses in pedestal structure, leading toimproved predictive capability for ITERR.J. Groebner1, C.S. Chang2, J.W. Hughes3, R. Maingi2, P.B. Snyder1, X.Q. Xu4,J.A. Boedo5, D.P. Boyle2, J.D. Callen6, J.M. Canik7, I. Cziegler5, E.M. Davis3,A. Diallo2, P.H. Diamond5, J.D. Elder8, D.P. Eldon5, D.R. Ernst3, D.P. Fulton9,M. Landreman3, A.W. Leonard1, J.D. Lore7, T.H. Osborne1, A.Y. Pankin10,S.E. Parker11, T.L. Rhodes12, S.P. Smith1, A.C. Sontag7, W.M. Stacey13, J. Walk3,W. Wan11, E.H.-J. Wang4, J.G. Watkins14, A.E. White3, D.G. Whyte3, Z. Yan6,E.A. Belli1, B.D. Bray1, J. Candy1, R.M. Churchill3, T.M. Deterly1, E.J. Doyle12,M.E. Fenstermacher4, N.M. Ferraro1, A.E. Hubbard3, I. Joseph4, J.E. Kinsey1,B. LaBombard3, C.J. Lasnier4, Z. Lin9, B.L. Lipschultz3, C. Liu1, Y. Ma3,G.R. McKee6, D.M. Ponce1, J.C. Rost3, L. Schmitz12, G.M. Staebler1, L.E. Sugiyama3,J.L. Terry3, M.V. Umansky4, R.E. Waltz1, S.M. Wolfe3, L. Zeng12 and S.J. Zweben2
1 General Atomics, PO Box 85608, San Diego, CA 92186–5608, USA2 Princeton Plasma Physics Laboratory, PO Box 451, Princeton, NJ 08543-0451, USA3 Massachusetts Institute of Technology, 77 Massachusetts Avenue, Cambridge, MA 02139-4307 USA4 Lawrence Livermore National Laboratory, PO Box 808, Livermore, CA 94551, USA5 University of California San Diego, 9500 Gilman Dr., La Jolla, CA 92093, USA6 College of Engineering, University of Wisconsin, Madison, WI 53706-1390, USA7 Oak Ridge National Laboratory, PO Box 2008, Oak Ridge, TN 37831, USA8 Institute for Aerospace Studies, University of Toronto, Toronto, Ontario, M3H 576, Canada9 Department of Physics and Astronomy, University of California, Irvine, CA 92616–6050, USA10 Tech-X, Boulder, CO 80303, USA11 Department of Physics, University of Colorado Boulder, Boulder, CO 80309, USA12 Department of Physics and Astronomy, and PSTI, University of California, Los Angeles, CA 90095, USA13 Georgia Institute of Technology, Atlanta, GA 30332, USA14 Sandia National Laboratory, PO Box 5800, Albuquerque, NM 87185, USA
E-mail: [email protected]
Received 28 February 2013, accepted for publication 26 July 2013Published 21 August 2013Online at stacks.iop.org/NF/53/093024
AbstractJoint experiment/theory/modelling research has led to increased confidence in predictions of the pedestal height inITER. This work was performed as part of a US Department of Energy Joint Research Target in FY11 to identifyphysics processes that control the H-mode pedestal structure. The study included experiments on C-Mod, DIII-Dand NSTX as well as interpretation of experimental data with theory-based modelling codes. This work providesincreased confidence in the ability of models for peeling–ballooning stability, bootstrap current, pedestal width andpedestal height scaling to make correct predictions, with some areas needing further work also being identified. Amodel for pedestal pressure height has made good predictions in existing machines for a range in pressure of a factorof 20. This provides a solid basis for predicting the maximum pedestal pressure height in ITER, which is found tobe an extrapolation of a factor of 3 beyond the existing data set. Models were studied for a number of processesthat are proposed to play a role in the pedestal ne and Te profiles. These processes include neoclassical transport,paleoclassical transport, electron temperature gradient turbulence and neutral fuelling. All of these processes maybe important, with the importance being dependent on the plasma regime. Studies with several electromagneticgyrokinetic codes show that the gradients in and on top of the pedestal can drive a number of instabilities.
(Some figures may appear in colour only in the online journal)
0029-5515/13/093024+19$33.00 1 © 2013 IAEA, Vienna Printed in the UK & the USA

Nucl. Fusion 53 (2013) 093024 R.J. Groebner et al
1. Introduction
The H-mode pedestal will have a profound effect on plasmaperformance in ITER [1], the Fusion National Science Facility(FNSF) [2] and other fusion machines. The pedestal willgovern the performance both through the confinement ofthe pedestal itself and by providing an important boundarycondition for core confinement; higher values of pedestalpressure provide higher values of core pressure. For successfuloperation of fusion machines, the characteristics of the pedestalmust be optimized to simultaneously meet several criteria.These criteria include sufficient pedestal pressure, small orno edge localized modes (ELMs), shielding of impurities andthe ability to be fuelled by gas puffing or pellet injection.A predictive pedestal capability is required to optimize anddesign operating scenarios in ITER and to assist in the designof future fusion machines so that the pedestal properties canbe modelled realistically.
To assist with the development of predictive capability,the US Department of Energy established an activity in fiscalyear 2011, called the FY11 Joint Research Target for PedestalPhysics (JRT), to foster an increased effort to study pedestalphysics. This activity resulted in a coordinated effort betweenexperiment, theory and modelling communities to identify andimprove predictive capability for important physics processescontrolling pedestal structure. A major goal of this work wasto compare pedestal physics results on C-Mod, DIII-D andNSTX in order to discern physics common to all three devices.This was accomplished partly by performing coordinatedexperiments to study the pedestal on all three devices and byusing the same set of software tools to analyze the pedestaldata from the three devices. Another means to meet this goalwas to use several simulation codes to model pedestal physicsin two or all three of these devices.
This work has led to increased confidence that a paradigmfor understanding the ultimate limits to the pedestal pressureprofile, based on two different physics criteria, is correct.One criterion is that finite-n, ideal peeling–ballooning modesprovide a global limit to pedestal pressure; the second is thatsmaller scale and more localized kinetic ballooning modes(KBMs) provide a limit to the pedestal pressure gradient.Both of these physics processes are controlled by the interplaybetween the pressure profile and the current density profile.Quantitative models exist for each of these two criteria andare used to predict if a given pedestal pressure profile is stableto peeling–ballooning modes or KBMs. These models havesufficient quantitative accuracy for the conventional aspectratio C-Mod and DIII-D devices that they have been combinedinto a single model, the EPED model [3], which successfullypredicts the pedestal width and height in type-I ELMingdischarges in these machines to within about 20% over a widerange of parameters. The EPED model provides a good basisfor predicting the pedestal height in ITER. Significant progresswas made to extend this capability towards the low aspect ratioNSTX machine; but due to challenges of modelling low aspectratio devices, the width physics is not yet adequately modelledfor good quantitative predictive capability.
Successfully optimizing the pedestal for multiple criteriain ITER and other future machines will require an improvedunderstanding of individual density and temperature profiles.
0.85 0.90 0.95 1.00ψN
0
2
4
6
8
10
12
Pressure
Current density
0.0
0.2
0.4
0.6
0.8
1.0
1.2M
A/m
2kPa
Figure 1. Profiles of edge current density (peaked at edge) and totalplasma pressure for DIII-D discharge 144981 with total plasmacurrent = 1.5 MA. The region of large pressure gradient(ψN ∼ 0.96–1.0) drives a large bootstrap current.
A significant effort was made as part of the JRT to develop andcompare theoretical models for these profiles to experimentaldata. These include models for neoclassical transport,paleoclassical and fuelling physics to explain the densitypedestal, models for paleoclassical transport and electrontemperature gradient (ETG) turbulence for the electrontemperature profile and electromagnetic gyrokinetic modelsfor fluctuation-driven transport in the pedestal. None of theexamined models was ruled out as a possible contributor topedestal structure, at least in some regimes. Rather, the resultssuggest that several processes may play a role in pedestalstructure and integrated pedestal models will need to includemultiple processes in a self-consistent way to make satisfactorypredictions of detailed pedestal structure.
The outline for this paper is as follows: section 2 describesthe theoretical and experimental work performed to understandthe limits to the total pedestal pressure profile. Section 3discusses the comparison of theoretical models to experimentaldata for temperature and density profiles. Section 4 providesa summary and conclusions.
2. Limits to pedestal pressure
A defining characteristic of an H-mode discharge is a pedestalin the edge pressure profile (figure 1) which is a region ofsteep pressure gradient just inboard of the last closed fluxsurface. Experiments have shown that higher pedestals intemperature or pressure are associated with higher total storedplasma energy, due both to increases of energy stored in thepedestal and due to improved core confinement [4–6]. Theory-based modelling shows that this effect is a logical consequenceof the core transport being determined by critical gradientphysics [7, 8]. Thus, the height of the pressure pedestal plays amajor role in the performance of current tokamak devices andis predicted to have major impact on the performance of ITER.For instance, calculations based on the TGLF model predictthat the fusion power in ITER will increase nearly as the squareof the pedestal pressure [9]. Therefore, there is an importantneed to predict and to optimize the pedestal height in ITER.
The JRT research has added to a worldwide body ofresearch that supports a picture of the physics processes that
2

Nucl. Fusion 53 (2013) 093024 R.J. Groebner et al
0.02 0.03 0.04 0.05 0.06 0.07 0.080
5
10
15
20
Pedestal Width (∆ψN)
Pede
stal
Hei
ght (
p ped
, kPa
)
PB unstable
KBM unstable
Predicted
Stable
Figure 2. Example of peeling–ballooning and kinetic-ballooningconstraints on pedestal pressure, predicted to limit the attainablepressure in a space of pedestal pressure height versus pedestalpressure width. For this model, height is defined as 2Te,pedne,ped, andwidth is the average of the Te and ne widths, where all parametersare evaluated with a tanh function. Allowed (stable) operating spaceis below both constraints. A type-I ELM is predicted to occur at theintersection of the two constraints. Calculation is for a DIII-Ddischarge.
provide upper limits on the evolution of the pedestal pressureprofile [10, 11]. In this picture, the two primary physicselements determining the limits are the pressure profile itselfand the pedestal current density profile, which has an importantcontribution from the bootstrap current, driven by pressuregradient. Global limits to the pedestal pressure profile are setby finite-n ideal peeling–ballooning modes. Smaller scale andmore localized modes, KBMs, limit the local pressure gradient.The EPED model [3], which combines these processes, hassuccessfully predicted pedestal width and height in existingmachines. Figure 2 provides a schematic view in a spaceof pressure height and width of how the constraints limit theoperating space, which is that region which is stable for boththe global and more local modes. Several tests of the physicselements in the model have been performed in this researcheffort and these are discussed here.
The model was developed to predict the pedestal pressure(and width) obtained just prior to the onset of a type-I ELM.The model would need additional physics to describe mostother H-mode regimes of operation, such as ELM-free regimesor type-III ELM regimes. Some other regimes might havephysics that provide pressure limits at levels below the peeling–ballooning threshold. In these cases, the EPED model wouldnot be expected to provide a calculation of the pedestaloperating point. However, the global limits to the pressureset by peeling–ballooning modes are expected to apply to allregimes of H-mode operation in the sense that these regimesare not expected or known to operate at pressures above thepeeling–ballooning threshold. There is some discussion ofpressure limits for some ELM-free regimes in section 2.1.2;depending on the regime, the pedestal is observed to operate ator below the peeling–ballooning threshold. It is also possiblethat in some regimes of operation, some additional physicslimits the local pressure gradient to levels below the kinetic-ballooning threshold. In those cases, the model would notbe expected to apply either. Most of the experimental datapresented here are obtained from type-I ELMing regimes,which is the appropriate regime for testing the model.
2.1. Global limits to pressure
2.1.1. Pedestal bootstrap current. Large pressure gradientsin the pedestal drive an edge bootstrap current. This currentplays an important role in the physics of peeling–ballooningmodes and must be known accurately in order to compute thestability threshold. The magnetic shear, strongly modifiedby the bootstrap current, is also an important quantity inseveral pedestal transport models. The bootstrap current iscomputed from theoretical neoclassical models, such as theSauter model [12] or the NCLASS model [13] for use in modelsof peeling–ballooning stability. Due to the important role of thebootstrap current, it is important that these theoretical modelsbe validated, preferably against experiment. There have beensome measurements of bootstrap current on DIII-D [14, 15]and MAST [16] and neoclassical models have been found tobe in close agreement with these measurements in steady state.
In the JRT activity, there was significant work tobenchmark new kinetic models for the bootstrap current againstthe simpler models in general use. This work was done withthe XGC0 [17] code, the NEO [18] code and a global pedestaldrift-kinetic code (denoted GPDKC here) [19]. All of thesecodes perform kinetic calculations in realistic geometry.
XGC0 is a full-f drift-kinetic particle code, whichis equipped with a mass–momentum–energy conservingcollision operator, and has been used to compute the edgebootstrap current in a realistic diverted magnetic field geometrywith a self-consistent radial electric field [20, 21]. Forpedestals in the weakly collisional banana-plateau regime(electron collisionality ν∗e � 1), this code finds agreementwith the Sauter model within several per cent, except for athin layer, adjacent to the separatrix, with a width of about1% of the minor radius. This agreement is found for C-Mod,DIII-D and NSTX. However, for pedestals in the plateau-collisional regime (ν∗e � 1), the bootstrap current computedwith XGC0 can differ by tens of per cent from the Sauterresult. This effect is attributed to physics of the interactionsbetween passing and trapped particles in the boundary layer.The sign of the difference with the Sauter result is dependenton aspect ratio. XGC0 computations for the low aspect ratiodevice NSTX predict a bootstrap current that is significantlylarger than obtained from the Sauter model. In contrast,the XGC0 bootstrap current for the conventional aspect ratioDIII-D device at high collisionality is smaller than that fromthe Sauter model [20]. This aspect ratio effect is attributed tothe much tighter spiralling of field lines on the high field side ofa low aspect ratio device as compared to a conventional aspectratio machine. An analytic model, based on the formulation ofthe Sauter model, has been developed to compute the XGC0bootstrap current [20].
NEO is a δf drift-kinetic code that implements the fullylinearized Fokker–Planck collision operator [18]. The codeemploys a sophisticated numerical algorithm that accuratelytreats the disparate velocity scales that arise in the case ofmulti-species plasmas and thus allows modelling of a plasmawith an impurity species. Calculations with NEO including thefull linearized Fokker–Planck collision operator and a carbonimpurity find small but significant (∼10–20%) differences inthe bootstrap current from that calculated in simplified modelssuch as NCLASS or Sauter.
3

Nucl. Fusion 53 (2013) 093024 R.J. Groebner et al
A new global pedestal drift-kinetic code (GPDKC) usesa continuum (Eulerian) framework and includes the exactlinearized Fokker–Planck–Landau collision operator [19].Non-local effects are incorporated in a numerically efficientmanner, including both radial variation and strong poloidalvariation, together with the pedestal radial electric field, Er .The code uses a δf ordering that allows the ion density andelectron temperature scale lengths rn and rTe to be comparableto the ion poloidal gyroradius ρθ , while the ion temperaturescale length rTi is assumed greater than rn, as has beenobserved in several tokamaks. In scans over a wide range ofcollisionality, the Sauter bootstrap current formula is found toagree with results of this code within 10% at low collisionality,ν∗e < 0.5, for DIII-D. However, the Sauter model can givea bootstrap current more than twice the value of the codewhen ν∗e � 4. The discrepancy in the bootstrap currentat high collisionality does not depend on finite-orbit-widthor Er effects, persisting even in the rn, rTe , rTi � ρθ locallimit employed by conventional neoclassical theory and codes.Thus, GPDKC and XGC0 provide qualitatively similar resultsfor a conventional aspect ratio: the Sauter model agrees withthese codes at sufficiently low collisionality but provides highervalues of bootstrap current at sufficiently high collisionality.
A comparison of the predictions of the analytic Hirshmanmodel [22], a new analytic model by Callen [23], the Sautermodel and the analytic XGC0 model has been performedfor representative DIII-D and NSTX discharges [24]. Thiscomparison finds that the bootstrap current predictions of thesemodels agree within about 10% for the DIII-D discharges butdiffer by more than a factor of two for NSTX. Variations withcollisionality were not studied.
Taken together, the work described here indicates thatthe Sauter model is in good agreement with newer models,including the XGC0 and GPDKC models, for sufficientlylow collisionalities. At higher collisionalities (ν∗e � 1),the models can give significantly different results, withthe differences being larger for the low aspect ratio ofNSTX. These results provide increased confidence in theuse of the Sauter model for calculations of bootstrap currentat low collisionality, a common H-mode application, andindicate a need for caution in use of bootstrap currentmodels at higher collisionality, particularly at low aspectratio. Although there are large differences between somemodels for bootstrap current predictions at high collisionality,the uncertainty is not expected to have large effects onpredictions of pedestal performance if the bootstrap currentis relatively small compared to its collisionless value. Anissue which may be of equal or greater importance forbootstrap current predictions is an improved characterizationof pedestal impurities from the experimental side and animproved understanding of the impurity effects on bootstrapcurrent on the theoretical side. The presence of impuritiescan have significant effects on the bootstrap current, certainlythrough changes of collisionality. Ultimately, though, giventhe importance of the bootstrap current in the pedestal physics,experimental measurements of the bootstrap current are neededto allow benchmarking of codes with high confidence. Asnoted previously, measurements of pedestal current densityhave been made on both DIII-D [14, 15] and MAST [16].Significant improvements have been made to diagnostics on
DIII-D as part of the JRT to measure the pedestal currentdensity. These include upgrades to a lithium Zeemanspectroscopy/polarimetry system [15], which obtained data inFY12, now being analyzed.
2.1.2. Peeling–ballooning limits to pedestal pressure.Intermediate wavelength MHD instabilities driven by the sharppressure and current gradients in the edge barrier (‘peeling–ballooning’ modes) have been proposed as a mechanism fordriving ELMs and constraining the pedestal [25]. Modelsbased on peeling–ballooning (PB) theory have been successfulin predicting the observed boundary for instability to type-IELMs within experimental uncertainties on a number ofmachines [11]. It has also been empirically observed thatpeeling–ballooning physics provides the ultimate limits toattainable pedestal pressure in the H-mode regime. Thatis, no machine has reported operating in the unstable regionpredicted by PB theory. As part of the JRT research, models ofpeeling–ballooning modes have been extended for applicationsto the compact, high-field C-Mod device and the low-field,low aspect ratio NSTX device. Peeling–ballooning stabilityanalysis of type-I ELMing regimes and regimes in which ELMswere suppressed or not observed was performed on all threemachines. The results support the premise that these modelsare able to quantitatively predict the ultimate limits to thepedestal pressure.
In the experimental studies reported here, a standardanalysis methodology was adopted to process and comparedata from C-Mod, DIII-D and NSTX. The analysis workflowwas to: obtain measurements of pedestal Te and ne
profiles from high resolution Thomson scattering systems[26–28]; obtain measurements of pedestal Ti and low-Z impurity density with high resolution charge exchangerecombination spectroscopy when available [29–31]; obtainmagnetic equilibria with the EFIT [32] code; use a set ofpython software tools to fit analytic functions to edge profiledata [33]; generate ‘kinetic’ equilibria with the EFIT codewhere the pressure profile was constrained by experimentalmeasurements and the edge bootstrap current was calculatedfrom experimental measurements with the Sauter [12] model.For calculations of peeling–ballooning thresholds, a series ofGrad–Shafranov equilibria were generated to map out a spaceof pedestal pressure gradient and current density by perturbingthe pressure and current density profiles used to represent theactual experiment.
Type-I ELMy H-mode discharges on C-Mod, spanninga broad range of operational parameters, including plasmacurrent (0.4–1 MA), toroidal magnetic field (3.5–8 T), andplasma shaping, were performed as part of this research [34].Peeling–ballooning stability calculations have been made fora subset of these ELMy discharges, verifying proximity ofthe pedestal to the calculated stability boundary for medium-nmodes. As an example, figure 3(a) shows that the experimentaloperating point for a C-Mod type-I ELMy discharge waswithin error bars of the computed threshold for the onsetof PB modes, as calculated with the ELITE code [35].Figure 3(b) shows analysis from a companion discharge inDIII-D, which was performed as a pedestal dimensionlessparameter match to the C-Mod discharge. In the space ofnormalized edge current density versus normalized pressure
4

Nucl. Fusion 53 (2013) 093024 R.J. Groebner et al
1.5
1.0
0.5
0.51.01.5
2.0
0.5
1.0
1.5
Nor
mal
ized
Cur
rent
Den
sity
86 12104 2
Stable
UnstableNSTX
Lithiumno ELMs
1.0
1.5
0.5
1.5
1.00.5
NSTX
No LithiumELMy
Unstable
Stable
86 1210
Normalized Pressure Gradient (α)
4
2.0
0.5
1.0
1.5
Nor
mal
ized
Cur
rent
Den
sity
Stable
Unstable0.050
0.050
0.025
0.075
0.075
C-Mod
2.0
0.6
5.2 0.3 5.35.10.3
0.4
0.5
Nor
mal
ized
Cur
rent
Den
sity
Stable
Unstable
DIII-D
1.5 0.2 5.2 0.3 5.3
0.5
0.7
0.6
0.4
0.050
0.05
0
0.02
5
0.075
0.075
Nor
mal
ized
Cur
rent
Den
sity
(b)
(a)
n = 5 – 25, (γ/ωA) contours
n = 5 – 25, (γ/ωA) contours
n = 1 – 15, (γ/ω*i/2) contours
n = 1 – 15, (γ/ω*i/2) contours
(c)
(d)
Figure 3. Stability limits for peeling–ballooning modes, aspredicted with the ELITE code, for (a) ELMy discharge1101214029 in C-Mod, (b) ELMy discharge 145716 in DIII-D, (c)ELMy discharge in NSTX, (d) discharge without ELMs in NSTX,obtained with lithium wall coatings. Normalized current density isthe average pedestal current density divided by the average plasmacurrent density. Normalized pressure gradient is the MHD αparameter, defined in [36]. Boxes are experimental operating points.In (a)–(c), these are points just before the onset of a type-I ELM.Thick solid contours show model criteria for instability thresholds.
gradient, the operating points and stability diagrams for theC-Mod and DIII-D discharges were very similar. In thiscomparison, the threshold for instability is obtained from thecriterion γ /ωα > 0.05, where ωα is the Alfven frequency andγ is the linear growth rate for the fastest growing peeling–ballooning mode. The calculated n = 25 mode structure
is also found to be very similar for the equilibria from thetwo machines. This comparison used the instability thresholdcriterion γ /ωα > 0.05 rather than the more common criterionγ /(1/2ω∗
pi) > 1, where ω∗pi is the ion diamagnetic drift
frequency. The comparison was done in this way becausediamagnetic effects can be strong in C-Mod pedestals anda more sophisticated diamagnetic model may be needed toaccurately compute the instability threshold in C-Mod. Thecomparison of thresholds in terms of the Alfven frequency ismore direct since the code outputs the threshold in terms ofthis parameter. For DIII-D like conditions, the two criteriagive similar results.
The NSTX device obtained a significant data set todocument the effects on pedestal stability due to variousthicknesses of lithium coatings on the walls of the machine[37]. Initial studies of edge stability with ELITE showedthat ELMy discharges in this study were all near thekink/peeling boundary, far from the ballooning boundary;ELM-free discharges were in the stable operating space ascomputed by the model [38]. For these studies, the thresholdcondition for ELM onset was found to be approximatelyγ /(1/2ω∗
pi) > 0.1. This threshold was notably lowerthan the diamagnetic criterion typically used in DIII-D andother machines: γ /(1/2ω∗
pi) > 1 [3]. Subsequently, twoimprovements to the analysis have been identified whichresolve this difference, as demonstrated in figure 3(c). Thisfigure shows that for a type-I ELMing discharge, the NSTXoperating point before an ELM was consistent with the usualthreshold for instability. One change in the analysis wasthe use of the bootstrap current from the XGC0 model,which computes a significantly higher current than the Sautermodel, used for the original stability calculations. The secondand possibly more important change in the analysis was theinclusion of mode numbers down to n = 1 in the analysis, asopposed to a minimum n = 5, typically used for conventionalaspect machines. This work has shown that the PB calculationsare significantly more complex at low aspect ratio than atmoderate aspect ratio. Thus, more work is needed to obtain afirmer understanding of the PB threshold at low aspect ratio.
Pedestals that clearly lie in the predicted unstable regionshave not been observed in this work. However, all threemachines observed good confinement regimes without ELMsthat operated at or below the predicted PB threshold. Stabilityanalysis of DIII-D discharges showed that the QH-moderegime operates near the PB threshold and the ELM-suppressedregimes obtained with the application of resonant magneticperturbations lie below the limit [33]. ELM-free regimesin NSTX obtained with the application of lithium coatingsoperated below the PB limit (figure 3(d)) [38]. In C-Mod, discharges in the I-mode regime [39] exhibit H-mode like gradients in Te, L-mode like gradients in ne andoperate well below the predicted PB limit [40]. EnhancedDα (EDA) discharges [41] in C-Mod operate close tobut below the PB threshold [40]. In summary, peeling–ballooning theory provides an upper limit to the attainablepedestal pressure in the experiments performed in thesemachines.
5

Nucl. Fusion 53 (2013) 093024 R.J. Groebner et al
2.2. Limits to local pressure gradient
A model, based on nearly local KBMs, has been proposed toprovide a second constraint on the pedestal pressure profile [3].The hypothesis behind this model is that these modes turn onstrongly when the pedestal pressure gradient reaches a criticalvalue αc. These modes are smaller in scale than peeling–ballooning modes and do not cause a collapse of the pedestal asan ELM does, but keep the pressure gradient clamped to nearthe KBM threshold value. For typical tokamak operation, thisthreshold value has a dependence on the current density givenby αc ∼ 1/s1/2, where s is the local magnetic shear at theoutboard plane. Thus, the pressure profile and current densityprofile are important physics elements in this model, as theyare in the model for peeling–ballooning stability. Various testsof this model have been performed and are discussed below.
2.2.1. Pedestal width scaling. To leading order, the physics inthe model implies that the pedestal width has the form ψN =β
1/2p,pedG(ν∗, ε, . . .) where βp,ped is the pedestal beta poloidal
and the function of G has a weak dependence on collisionalityν∗, aspect ratio ε and other dimensionless parameters [42] witha value of the order of 0.1. The width ψN in this scaling isdefined as the average of the Te and ne widths, evaluated withfits of a tanh function to the pedestal profiles and is measuredin normalized poloidal flux. The pressure required to evaluateβp,ped is obtained from 2Te,pedne,ped, where Te,ped and ne,ped,
are the pedestal values for Te and ne, as determined from fitswith the tanh function.
Prior to the JRT, the equation for ψN was evaluatedanalytically with G being used as a constant obtained fromexperiment. A newer model, called the ‘ballooning criticalpedestal’ (BCP) technique, has been developed to computeψN [42] without the need for a free parameter. This modelis based on the assumption that the KBM critical pedestalpressure gradient is well approximated by the critical gradientfor the onset of infinite-n ideal ballooning modes. In practice,the BALOO code [43] is used to evaluate ideal ballooningstability in the pressure profile and the model width is takenas twice the width of the region whose pressure gradient is ator beyond the threshold for excitation of these modes. Thewidth obtained from the numerical BCP technique is usuallyvery close to the width obtained from the original analyticexpression.
Systematic pedestal width measurements from all threemachines have been obtained and used to test these modelsfor pedestal width. Data for each of the machines were fit tothis analytic width expression to obtain empirical values forG. For the moderate aspect ratio machines C-Mod [34] andDIII-D [3, 44], the best values of G are nearly identical, 0.088and 0.076, respectively. For the low aspect ratio NSTX [45]device, the best value is 0.17. The BCP technique has alsobeen used to derive best model values for c for the scalingexpression ψN = cβa
p,ped for the three machines, as illustratedin figure 4. In this work, a was fixed at 0.5 for C-Mod andDIII-D and at 0.8 for NSTX. The value of 0.5 is obtainedfrom analytic approximations used in the original version ofthe EPED model [3] and later found to be consistent with theupgraded version of the model, using the BCP technique [42].The value of 0.8, used for NSTX, is obtained from initial BCP
Pede
stal
Wid
th (∆
ψN
)
0.10
0.010.10 1.0
βpol,ped
Model: ∆ψN = c βpaol,ped
NSTX 0.203 0.80
DIII-D 0.076 0.50C-Mod 0.083 0.50
c a
Figure 4. Pedestal width, defined as the average of the Te and ne
widths versus pedestal beta-poloidal, where pressure is defined as2Te,pedne,ped. Symbols show experimental measurements fromC-Mod, DIII-D and NSTX. Lines show predictions of the BCPmodel, using the equation shown.
calculations that evaluate the dependence of pedestal width onaspect ratio. These calculations, which are very challengingat low aspect ratio, have not yet reached the aspect ratio ofNSTX, and it is possible that improvements to the coefficientwill be obtained in future work. Best values of c are 0.083 forC-Mod, 0.076 for DIII-D and 0.203 for NSTX. Figure 4 showsthat the experimental width scaling for C-Mod and DIII-Dlie along nearly the same trajectory, that the BCP techniquefor the KBM-based width provides a very good fit to C-Modand DIII-D, that there is an aspect ratio dependence to theexperimental widths with the NSTX widths being larger thanthose of the other two devices, and that the BCP partially butnot totally captures this aspect ratio dependence. The BCP linefor the NSTX data was obtained from application of the BCPmodel to a couple of experimental points and thus provides anaverage predicted trend over the existing experimental data,shown in the plot.
These results indicate that the same underlying physicscontrols the width of the pedestal and that it contains asignificant dependence on aspect ratio. Models based on theassumption that KBM physics controls the width provide a verygood description of measurements in the conventional aspectratio machines C-Mod and DIII-D. These models capturemuch of the scaling in the low aspect NSTX device. KBMcalculations are highly challenging at low aspect ratio and itis possible that further work will improve the agreement ofthe model with the data. Confidence in these scaling results,particularly in comparing the results from the machines, isaided by the fact that the same diagnostics, high resolutionThomson scattering systems [26–28], and the same profilefitting code [33] were used in obtaining and analyzing thesedata. Thus, possible systematic errors due to the use ofdifferent diagnostic measurements or different fitting codesare greatly reduced in these comparisons.
2.2.2. Temporal evolution of pressure gradient. The buildupof the pedestal between ELMs provides another test forhypotheses that KBMs limit the pedestal pressure gradient.
6

Nucl. Fusion 53 (2013) 093024 R.J. Groebner et al
Previous studies on DIII-D [46, 47], AUG [48, 49] and MAST[50] have provided evidence that the pedestal pressure gradientrises to near its maximum level quickly after recovery from anELM and then evolves slowly or is saturated until the onset ofthe next ELM. During the ELM cycle (recovery of one ELMto onset of the next ELM), the pedestal width, particularly forthe density profile, has been observed to increase [46, 47, 50].As illustrated in figure 5, similar new observations were madeon NSTX [45] (figure 5(a)), C-Mod [40] (figure 5(b)) andDIII-D [51] (figure 5(c)) as part of this research. In particular,for ELM cycles during which time-resolved measurementscould be made, the maximum pedestal pressure gradient isobserved to come to saturation or near-saturation early in theELM cycle with the pedestal observed to increase in width atnearly constant pressure gradient during the ELM cycle.
Given these observations, it is of interest to comparethe pressure gradient evolution during the ELM cycleto the predictions for the KBM limits to the gradient.Previous measurements in a discharge with long ELM periods(∼100 ms) have shown that the pedestal width and heightevolve along a trajectory as expected if KBM modes arelimiting the pressure gradient [47]. New measurements,obtained with improved spatial resolution from an upgradedThomson system on DIII-D [27], have confirmed theseobservations for a 1 MA discharge [51]. As shown in figure 6,good agreement of the constraint with the measured pedestalevolution is also observed in a scan of plasma current Ip
where the current was varied from 0.5–1.5 MA. The constraintpredicts the qualitative and quantitative trends of the pedestalevolution for all three currents with reasonable agreement withthe measurements. In these discharges, the maximum pressuregradient varied by about a factor of 8. Agreement of themodel with the data over this range of conditions is strongconfirmation that the model is capturing the dominant trendsin the data. In the context of this model, it is plausible that thepressure gradient could lie below the KBM limit under someconditions, possibly early in the ELM cycle immediately afteran L–H transition. This is a topic of current research.
2.2.3. Search for KBMs in experiment. Improved confidencethat KBMs limit the pressure gradient requires observationof KBM fluctuations in experiment and confirmation thatthey have the qualitative and quantitative characteristicspredicted from simulations of these modes. Both experimentaland simulation work have been performed to address theseissues. High frequency coherent (HFC) modes [52], withthe characteristics expected for KBMs, have been observedin some conditions in QH-mode discharges. The HFC modesturned on during an increase in the pedestal pressure, whichthen stopped rising. KBM-like features included a modefrequency of 0.2–0.3 times the ion diamagnetic frequency,a propagation direction in the ion diamagnetic direction inthe plasma frame, a mode decorrelation rate exceeding theE × B shearing rate and a medium-n mode number (n ∼10–25). The intensity of broadband density turbulence has alsobeen observed to increase rapidly after an ELM crash, asthe pedestal pressure is increasing, and to saturate at aboutthe same time as the pedestal pressure saturates [53]. Thesefluctuations also exhibited characteristics expected for KBMs,including propagating in the ion diamagnetic direction in the
Electron pressure (kPa)
Electron pressure (kPa)
Phase of ELM cycle:
Phase of ELM cycle:
NSTX
C-Mod
DIII-D
0.7 0.8 0.9 1.00
5
10
15
20Total pressure (kPa)
Phase of ELM cycle:0-10% 20-40% 80-99%
(a)
(b)
(c)
ψN
0.1 1.19.08.07.00
10
20
30
40
0-20% 30-50% 50-99%
20-40% 80-99%
0.1 1.19.08.07.00
2
4
6
8
Figure 5. Evolution of pedestal pressure profiles from early in theELM cycle to late in the ELM cycle for (a) NSTX, (b) C-Mod and(c) DIII-D. Electron pressure shown in (a) and (b); total pressure in(c). As used here, the ELM cycle starts at completion of an ELMcrash and finishes at the next crash. Thus, the 50–99% or 80–99%phase represents pedestal conditions near the onset of an ELM.
plasma frame and exhibiting a turbulence decorrelation ratethat exceeds the equilibrium E × B shearing rate.
The relation between density fluctuations and theevolution of the pedestal pressure gradient has also beenexamined in DIII-D in the ELM-free period after a transitionto H-mode. These data were obtained with the heating powernear the threshold power with the goal of maintaining theevolution of the pedestal as slow as possible to aid in makingtime-resolved measurements. Figure 7(a) shows Dα emissionfor a discharge in which the L–H transition occurred at about4965 ms. After the end of a short phase of type-III ELMsthat followed the transition, the intensity of long wavelengthdensity fluctuations with poloidal wavenumber kθ < 0.4 cm−1,
7
Nucl. Fusion 53 (2013) 093024 R.J. Groebner et al
0.00 0.02 0.04 0.06 0.080
5
10
15
20Pe
dest
al P
ress
ure
Hei
ght (
kPa)
1.5 MA
0.5 MA
1.0 MA
Pedestal Width (∆ψN)
Figure 6. Theoretical limits on pedestal pressure width and heightas set by peeling–ballooning constraints (solid curves) andkinetic-ballooning constraints (dashed curves) as computed for threedifferent plasma currents in DIII-D. Solid diamonds are predictedoperating points achieved at the onset of type-I ELM. Solid squaresare measured operating points achieved just before the type-I ELMcrash actually occurred. For each current, the data points showexperimental progression of pedestal structure parameters duringpedestal buildup between ELMs. The progression in time is fromlowest height/width points to the points just before the ELM onset.Within error bars, the measured operating points follow the KBMconstraint during pedestal buildup to the ELM crash.
measured with a beam emission spectroscopy (BES) diagnostic[54], dropped to a very low level, remained low for about 15–20 ms and then exhibited an abrupt turn-on of multi-harmoniccoherent fluctuations at about 4990 ms (figure 7(c)). As shownby a profile of the intensity fluctuation level, these fluctuationswere localized to the pedestal (figure 8). The electron pressuregradient, as measured with a high spatial resolution Thomsonscattering system showed a rapid increase of more than anorder of magnitude during the time when the density fluctuationlevel was low (figure 7(b)). Coincident with the turn-on of thecoherent density fluctuations, the rate of rise of the electronpressure gradient decreased markedly, as would be expected ifthe fluctuations were increasing pedestal transport. Figure 7(b)also shows the critical pressure gradient for the onset of KBMsas predicted by the analytic model for the width of the pedestalrelated to the pedestal height. The critical threshold wassignificantly above the experimental value of the gradient inthe L-mode. Early in the H-mode, the experimental gradientrose to and started to track the threshold. This data set isconsistent with the idea that the fluctuations in the H-modewere signatures of KBMs and that the KBMs constrained thepressure gradient. Definitive proof for this assertion requiresdevelopments in theoretical models to show clearly that theobserved fluctuations are those expected for KBMs.
2.2.4. Search for KBMs in simulation. Simulations withappropriate modelling codes are needed to determine if thesimple assumptions of the EPED model regarding KBMs arecorrect. Such simulations have been performed for the lowaspect ratio MAST spherical tokamak and the results supportthe main assumptions for the implementation of the KBMconstraint in the EPED1.6 model [50]. Several modellingstudies of KBM physics were performed as part of the JRTresearch [55–57]. The results provide some support for thepresence of KBMs in the pedestal, but overall the results arenot as consistent as in MAST.
0.006
6.7x10⁻⁷
50
100
150
200
f (kH
z)
(a)
(c)
(b)
4900 4950 5000 5050 5100 5150 5200Time (ms)
∇Pe experiment
∇Pe KBM model
Dα
1
2
3
4
20
40
60
80
0au
kPa/
ψN
Figure 7. (a) Divertor Dα waveform; (b) solid circles show the timehistory of ∇Pe; the solid line shows theoretical threshold pressuregradient for the onset of KBM modes; (c) contour plot of intensityof density fluctuations in pedestal. After L–H transition at 4965 ms,∇Pe rises rapidly, increasing by more than an order of magnitudeuntil the onset of coherent density fluctuations, as denoted by thevertical dashed green line. After turn-on of fluctuations, the rate ofrise of ∇Pe decreases markedly. In (b), ∇Pe in L-mode is wellbelow the theoretical threshold for the onset of KBM modes. But,after L–H transition, ∇Pe rises to approximately the thresholdwithin a few milliseconds and then tracks the threshold during theELM-free phase of the discharge, during which density fluctuationscontinue. Data for DIII-D discharge 148698.
In the MAST studies, the pedestal evolution is similar tothat described previously; the pressure gradient reached a nearsteady state early in the ELM cycle and the pedestal widthexpanded with time [50]. Calculations with the HELENA[58] code showed that much of the steep gradient region wasunstable to ideal infinite-n ballooning modes and that the widthof this region expanded as the pedestal grew in width. Linear,local simulations were performed with the GS2 gyrokineticcode [59] to examine the KBM stability. These modes werefound to be the dominant instability in the pedestal and theirexistence closely followed the region that was unstable toinfinite-n ideal ballooning modes.
Similar calculations [57] were performed for NSTX, alow aspect ratio machine as is MAST. In contrast to the MASTresults, most of the pedestal was found to be in the second stableregime for ideal, infinite-n ballooning modes. Linear, local
8

Nucl. Fusion 53 (2013) 093024 R.J. Groebner et al
0.85 0.90 0.95 1.00 1.05Normalized ψ
0.0
0.2
0.4
0.6
0.8n~ /n
(%)
(50–150 kHz)
Figure 8. Amplitude of low-k density fluctuations normalized toline-averaged density as a function of ψN, measured with a BESsystem for DIII-D discharge 148698 at 5030 ms. Densityfluctuations are localized to the pedestal.
calculations were performed with the GS2 code to examine thestability of KBMs over a range of magnetic shear and pressuregradient. The growth rates were found to be maximum near thefirst stability limit for ideal ballooning modes and to decreaseas the pressure gradient was increased towards second stabilityfor ideal ballooning modes. Similar to the MAST case, theregion of instability for KBMs corresponded closely to that forideal ballooning modes. However, these results do not supportthe idea that KBMs limit the pressure gradient since most ofthe pedestal was in the second stable region and the growthrates are predicted to decrease significantly for the increasedpressure gradients of the second stable region. A future step inthis analysis will be to determine if the inclusion of non-localeffects would change the stability picture so that KBMs wouldbe predicted to be the dominant modes in the pedestal [57].
Linear, local simulations were performed with theeigenvalue solver of the GYRO code [60] on a DIII-D dischargeto study the stability properties of KBMs in the pedestal [55].A major goal of these studies was to determine if the thresholdfor KBMs was approximately the same as the threshold forideal infinite-n ballooning modes. Because the experimentaldata set represented conditions near the threshold for an ELM,the bootstrap current was artificially reduced in the analysis (toabout half of its experimental value) to ensure that peeling–ballooning modes were stable in the simulations. A scanof pressure gradient from 50% to 120% of the experimentalvalue was performed and similar thresholds were found for theonset of the kinetic ballooning and ideal ballooning modes.As shown in figure 9, onset of ideal modes, computed withBALOO, was at about 70% of the experimental pressure andthe threshold for KBMs, computed with GYRO, was at apressure of about 60% of the experimental pressure. In thisrespect, the results are consistent with NSTX and MAST in thatthe two modes have approximately the same threshold. But,the KBMs were found to be subdominant and an unnamedgroup of drift waves were predicted to have significantlyhigher growth rates. The use of the GYRO eigensolver wasnecessary for finding the KBM, given that it was not the fastestgrowing mode. Important future analysis would be to perform
0.0 0.5 1.0 1.5Pressure/Experimental Pressure
0.00
0.05
0.10
0.15
0.20
0.25
Gro
wth
Rat
e (c
s/a)
Threshold, infinite-nballooning modes (BALOO) Growth Rate
KBMs (GYRO)
Figure 9. Solid circles are the linear growth rate for KBM (in unitsof ion sound speed over minor radius) as a function of pedestalpressure normalized to the experimental pressure, as computed withGYRO. KBM mode turns on at about 60% of the experimentalpressure. The vertical dashed line shows the threshold for the onsetof the infinite-n ideal ballooning mode, as computed with BALOO.All calculations performed with bootstrap current reduced below theexperimental value to avoid peeling–ballooning modes insimulations. Analysis is for DIII-D discharge 131997.
calculations with the full plasma current and to extend thecalculations to include non-local effects.
Global calculations were performed [56] for two DIII-Ddischarges with the GEM electromagnetic gyrokinetic code[61]. The current density and pressure gradient in thesedischarges were initially taken as the experimental values,which were obtained by standard analysis shortly before theonset of a type-I ELM. In both cases, the strongest growingmode was an intermediate-n mode, a kinetic version of thepeeling–ballooning mode, and was called a kinetic peeling–ballooning mode (KPBM). The relation between this modeand the ELM instability was not examined. However, in asecond study, the q-profiles were artificially flattened in asmall region around the point of maximum pressure gradientso that the magnetic shear was locally reduced to zero. Theseconditions stabilized the KPBM and slightly destabilized theKBM so that it was found to be the dominant mode in bothdischarges. These results suggest that global simulations maybe important to properly study the KBM but they also pointto the need to measure the current density or q profile or to atleast develop an improved understanding of the uncertaintiesin existing reconstructions.
From these studies, it is clear that the role of KBMs is notfully established by code modelling and more work is needed.Several of these studies do provide evidence that the thresholdfor KBMs is approximately the same as for infinite-n modes.The existence of KBMs in a pedestal that is second stableto infinite-n modes is problematic and needs to be resolved.Global simulations may be part of the solution. The role ofuncertainties of experimental measurements in these studiesneeds to be assessed and there is a clear need for measurementsof the pedestal current density or q profile.
2.3. Tests of EPED model for pedestal height and width
The EPED model [3, 42] combines models of the constraintsfor both PB physics and KBM physics, discussed in the
9

Nucl. Fusion 53 (2013) 093024 R.J. Groebner et al
previous sections, to simultaneously predict pedestal width andpedestal height (for pressure) for type-I ELMing discharges.The EPED model is depicted in figure 2, which shows the twoconstraints between height and width. The predicted operatingpoint for the pedestal at the onset of an ELM is that point wherethe two constraints cross, i.e. where they are both active. Asnoted elsewhere [3, 42], the constraints for the two models aredeveloped from a series of model profiles and equilibria whichare developed from eight scalar input parameters: the toroidalfield BT, the plasma current Ip, the geometric major radiusR, the minor radius a, triangularity δ, elongation κ , pedestalelectron density ne,ped and βN,global, the global normalizedTroyon β. The first six parameters can be considered machinecontrol parameters. If the final two parameters, ne,ped andβN,global can be achieved in an experiment, the EPED modelcan be used to predict the pedestal height and width eitherbefore or after an experiment. This model has previously beenapplied to data from a number of machines and found to providea good prediction of pedestal height in these devices [10]. Forthe JRT work, significant advances were made in the modeland new data sets from C-Mod and DIII-D provided tests ofthe model in new parameter ranges, as will be discussed below.
For the JRT research, the EPED model was upgraded (toversion 1.6) to use the BCP model (section 2.2.1) to computethe constraint for KBM physics. The use of the BCP modeldoes not produce significant differences from the originalversion of the model (version 1). However, EPED1.6 alsocontains an update to the diamagnetic stabilization criterionused to determine the threshold for the onset of PB modes [42].This updated criterion is important for modelling high-fielddevices, such as C-Mod, in which diamagnetic effects can bequite strong in the pedestal.
The EPED 1.6 model has been tested against data fromC-Mod and DIII-D and found to provide good predictions ofpedestal height. Figure 10(a) shows results from application ofthe model to a number of recent discharges from C-Mod [34]and DIII-D [51] in which new data significantly extend therange for model testing. Data from C-Mod extended themaximum pedestal pressure by about a factor of two overprevious tests of the EPED model. In the new data set, themeasured pedestal pressure varies by a factor of about 20and the quantitative agreement of the predictions with thesemeasurements is typically within 20% or better. In addition,new data from DIII-D have significantly increased the dataset of measured large widths in the range 0.06–0.08 in unitsof normalized poloidal flux of ψN, as shown in figure 10(b).These data are well matched by the EPED model.
2.4. Implications for ITER
The success of the EPED model in predicting pedestal structureover a wide range of parameters in existing machines providesa good basis for using the model to predict pedestal structure inITER and predictions for the height and width of the pedestalin the ITER baseline scenario are shown in figure 10(a). Thepedestal height is an extrapolation of a factor of 3 from theexisting dataset, which spans more than an order of magnitude,and the predicted normalized pedestal width lies well withinthe existing data set.
Model profiles for the simulation of the ITER baselinescenario [42] are shown in figure 11. For an assumed
1 10 100EPED Predicted Pedestal Height (kPa)
1
10
100
Mea
sure
d Pe
d. H
eigh
t (kP
a)
ITER predictionDIII-DDIII-D (C-Mod identity)C-Mod
(a)
0.00 0.02 0.04 0.06 0.08 0.100.00
0.02
0.04
0.06
0.08
0.10
EPED1 Predicted Pedestal Width (∆ψN)
Mea
sure
d Pe
dest
al W
idth
(∆
ψN
)Comparison of EPED1 with measured pedestal width
DIII-D 2011ITER prediction
(b)
Figure 10. (a) Measured pedestal pressure height (2neTe) versuspredicted height from the EPED model for C-Mod and DIII-Dexperimental data from 2011. The solid line is the unity line. Alsoshown is the prediction for pedestal pressure in the ITER baselinescenario. (b) Measured pedestal width (average of ne and Tewidths)versus predicted width for DIII-D. The solid line is the unity line;upper and lower lines are ±20%. Also shown is the prediction forpedestal width in the ITER baseline scenario.
0.85 0.90 0.95 1.0002468
10121416
Normalized Poloidal Flux (ψN)
Density (1019 m–3)
Temperature (keV)
Pressure (104 Pa)
Figure 11. Pedestal density, temperature (Te = Ti) and pressureprofiles for the ITER baseline scenario, as predicted with the EPEDmodel.
ne,ped ∼ 7 × 10¹⁹ m−3, the pedestal height is predicted to haveβN,ped ∼ 0.6 and the width to beψN ∼ 0.04 (∼4.4 cm). Theseconditions imply a Ti,ped of about 4.5 keV. The implicationsfor these pedestal conditions for the ITER fusion performancedepend on the core transport model used in simulations.However, this modelled temperature is in the range neededto achieve fusion Q = 10, as implied by several transportmodels [1].
The EPED model has been used to perform optimizationstudies for the ITER pedestal. Given that the shape of ITER
10
Nucl. Fusion 53 (2013) 093024 R.J. Groebner et al
is established and has little flexibility, optimization studiespredict that higher pedestal densities would provide a route tohigher pedestal pressure [62]. This effect originates from theprediction that the ITER pedestal will be limited by the peelingboundary of PB modes. Thus, increasing the density at agiven pressure increases the collisionality, which decreases thebootstrap current at a given pressure, which provides a stabilityboundary that increases with density. This effect does have alimit; at sufficiently high density, the pedestal is predicted to belimited by the ballooning side of the PB curve and the pressureis expected to decrease with increasing density. For the ITERbaseline scenario, the highest pedestal pressure is predicted atnped ∼ 13 × 1019 m−3 [62].
3. Studies of transport processes for individualprofiles
The thesis of the preceding section is that there nowexists a good framework for understanding the limits to thepedestal pressure profile. In order to fully simulate tokamakperformance and to optimize future machines, it is necessaryto have a much deeper understanding of the physics oftemperature and density profiles. This is true even in thecontext of the EPED model, which takes the global beta andthe pedestal density as given plasma parameters. However,it cannot be known if these parameters can be obtained infuture machines unless a better understanding exists of howprofiles respond to sources of heat and particles. An improvedunderstanding of the physics of individual profiles is neededfor a number of other reasons, such as predicting the dynamicbuildup of pedestal density and temperature in response togiven sources, predicting the development of the bootstrapcurrent, which is strongly affected by the evolution of thepedestal density and temperature profiles and knowing howeffective various fuelling schemes will be in building up thepedestal density. As part of the JRT work, research was doneon a number of physics processes that are proposed to play arole in controlling temperature or density profiles. This workis briefly summarized here.
3.1. Neoclassical transport
The XGC0 [17] code has been used to simulate the densitypedestal buildup and the model includes combined effectsof neoclassical particle transport, due to ion collisions, andneutral fuelling. The code qualitatively reproduces severalfeatures of the experiments, including the steep densitygradients observed in the H-mode pedestal. Quantitativecomparisons to data from C-Mod and DIII-D show thatsome anomalous particle transport is required in additionto neoclassical transport to match the experimental densityprofiles [63, 64].
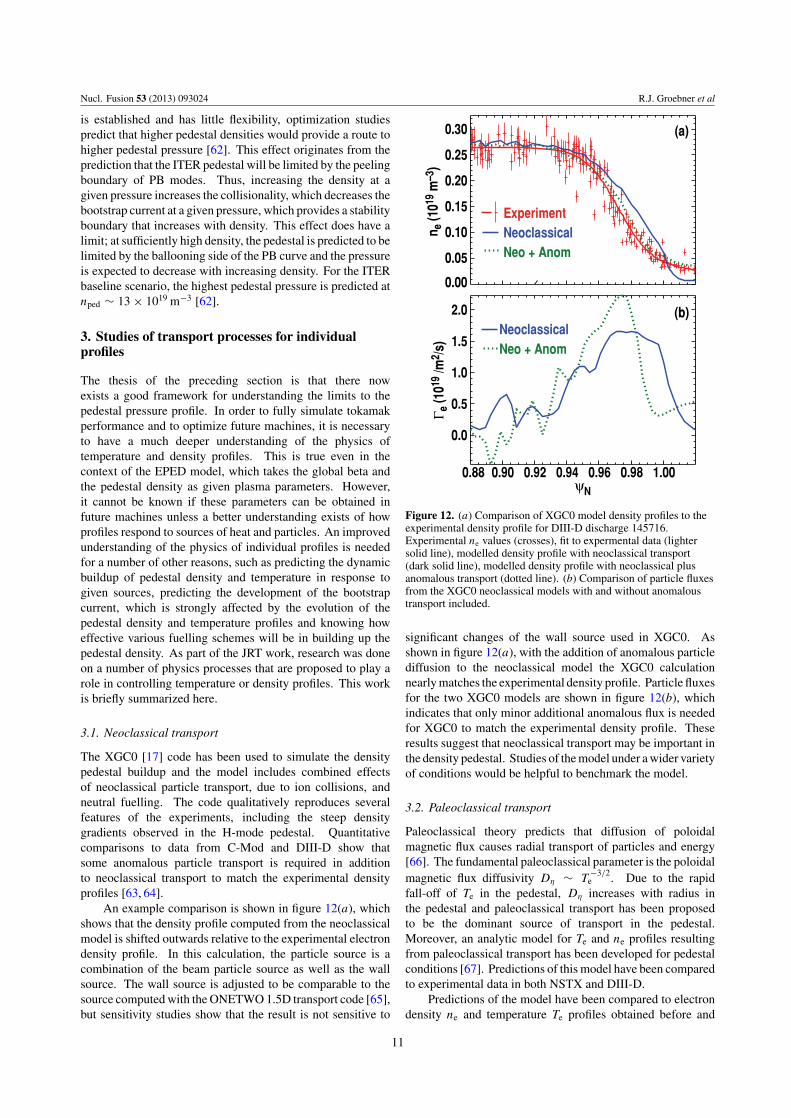
An example comparison is shown in figure 12(a), whichshows that the density profile computed from the neoclassicalmodel is shifted outwards relative to the experimental electrondensity profile. In this calculation, the particle source is acombination of the beam particle source as well as the wallsource. The wall source is adjusted to be comparable to thesource computed with the ONETWO 1.5D transport code [65],but sensitivity studies show that the result is not sensitive to
0.00
0.05
0.10
0.15
0.20
0.25
0.30
0.88 0.90 0.92 0.94 0.96 0.98 1.00
0.0
0.5
1.0
1.5
2.0
Γ e (1
019 /m
2 /s)
ExperimentNeoclassicalNeo + Anom
NeoclassicalNeo + Anom
(a)
(b)
ψN
n e (1
019 m
–3)
Figure 12. (a) Comparison of XGC0 model density profiles to theexperimental density profile for DIII-D discharge 145716.Experimental ne values (crosses), fit to expermental data (lightersolid line), modelled density profile with neoclassical transport(dark solid line), modelled density profile with neoclassical plusanomalous transport (dotted line). (b) Comparison of particle fluxesfrom the XGC0 neoclassical models with and without anomaloustransport included.
significant changes of the wall source used in XGC0. Asshown in figure 12(a), with the addition of anomalous particlediffusion to the neoclassical model the XGC0 calculationnearly matches the experimental density profile. Particle fluxesfor the two XGC0 models are shown in figure 12(b), whichindicates that only minor additional anomalous flux is neededfor XGC0 to match the experimental density profile. Theseresults suggest that neoclassical transport may be important inthe density pedestal. Studies of the model under a wider varietyof conditions would be helpful to benchmark the model.
3.2. Paleoclassical transport
Paleoclassical theory predicts that diffusion of poloidalmagnetic flux causes radial transport of particles and energy[66]. The fundamental paleoclassical parameter is the poloidalmagnetic flux diffusivity Dη ∼ T
−3/2e . Due to the rapid
fall-off of Te in the pedestal, Dη increases with radius inthe pedestal and paleoclassical transport has been proposedto be the dominant source of transport in the pedestal.Moreover, an analytic model for Te and ne profiles resultingfrom paleoclassical transport has been developed for pedestalconditions [67]. Predictions of this model have been comparedto experimental data in both NSTX and DIII-D.
Predictions of the model have been compared to electrondensity ne and temperature Te profiles obtained before and
11

Nucl. Fusion 53 (2013) 093024 R.J. Groebner et al
Pre-Li Expt.
(b)
(a)
0.5
0
2
4
6
8
10
0.4
0.3
0.2
0.1
0.00.80 0.85 0.90
ψN
0.95 0.10
n e (1020
m-3
)χ e (m
2 /s)
Post-Li Expt.Pre-Li PaleoPost-Li Paleo
Pre-Li Expt.Post-Li Expt.Pre-Li PaleoPost-Li Paleo
Figure 13. Experimental and paleoclassical values of (a) χeff and(b) ne profile for NSTX discharges without lithium and with lithium.(Reprinted with permission from [37]. Copyright 2011 by theAmerican Institute of Physics.)
after the application of lithium coatings in NSTX [37]. Inthis experiment, increasing lithium coatings on the wall ofthe vessel caused a profound change in the ne profile, whosegradient was reduced and width increased with the additionof lithium. The pedestal Te profile was not significantlychanged with the coatings. The model made good quantitativepredictions of the pedestal electron thermal diffusivity χe andof the shape of the pedestal density profile in NSTX dischargesbefore and after lithium injection (figure 13). The modelcaptured an increase of χe and a significant broadening of thene profile with the application of lithium.
The model has been evaluated for a large set of data inDIII-D covering a wide parameter range, including data fromall pedestal experiments performed in 2011 [68]. Over thisset of data, the average electron temperature gradient and theaverage electron density are predicted to be 1.7 ± 1.1 and2.1 ± 0.7, respectively, times the experimental values. Thesecomparisons were performed at the location of the steepestTe gradient in the pedestal. Thus, the model predicts theminimum observed electron transport for many cases. In othercases, additional electron thermal transport or particle transportmust be invoked to explain the results. If this is a correctmodel for pedestal transport, it is important to understandunder what conditions the model applies. For this purpose,the ratio of the model to experimental temperature gradientwas examined for several parameters [68]. The ratio tendedto be close to unity for high confinement times, as measuredfrom the ITER98y2 scaling [69], at lower values of globalbeta poloidal and at low pedestal Te. At this time, it is notclear if one of these correlations captures an underlying physics
trend. Comparisons of the model to data have also been doneduring various parts of an ELM cycle. These comparisonshave been performed to examine the idea that paleoclassicaltransport might be the dominant transport early in the ELMcycle and that fluctuation-driven transport might turn on anddominate later in the cycle. An example of such comparisons isshown in figure 14, which shows comparisons of experimentalvalues versus model predictions for ne, ∇ne, Te and ∇Te duringELM cycles from four discharges at three different currents(0.5, 1.0 and 1.5 MA). There is agreement of the temperaturequantities for all cases except the lowest current case, whichcorresponds to the highest beta-poloidal in the study. For thehigher currents, there is no sign of the model starting to under-predict late in the ELM cycle.
In summary, the paleoclassical model makes goodpredictions of the observed electron thermal transport undersome conditions and under-predicts the observed transport inother conditions. Thus, the model represents the minimumamount of observed transport in these studies. For someconditions, additional transport mechanisms are required toexplain the observations.
3.3. Fluctuation-driven transport—modelling
While fluctuation-driven transport is often invoked as a likelysource of transport in the pedestal, modelling the relevantphysics processes has proven to be very challenging. Someof the reasons include the need to model small spatial scalesover which parameters change rapidly, the need to accuratelyaccount for plasma geometry and the need to account forkinetic effects in ions and electrons. There are also concernsabout whether expansions used in existing fluid and gyrokineticcodes, which are logical tools for study of fluctuations inthe pedestal, are valid for pedestal conditions. Despite theseproblems, there was a significant effort during the JRT to applymodelling tools to study fluctuations in the pedestal. Theprimary efforts were to perform linear simulations in order toobtain an idea of what modes might be unstable in the pedestal.
3.3.1. Electromagnetic gyrokinetic benchmarking. A bench-marking exercise was performed to compare electromagneticgyrokinetic codes under pedestal conditions [55]. This com-parison was performed between GEM [61], GYRO [60] andHD7 [70] with the DIII-D data discussed in section 2.2.4 asinput. One of the major results was that each code has itsown scheme for modelling the magnetic equilibrium and thedetails of how plasma geometry is modelled play a significantrole in setting the growth rate in and near the pedestal. Whenit was possible to compare two codes with the same geometri-cal model, reasonable agreement was found between the codeswhen computing the growth rates and frequencies of the fastestgrowing linear modes. When GEM’s shaping scheme was im-plemented in GYRO with calculations performed at ψN = 0.9and 0.95, the growth rates from GEM and GYRO were nearlyequal and the real frequencies agreed within a factor of two orless for modes with normalized wavenumbers kθρs = 0.2–0.8,where ρs is the ion Larmor radius. This range of wavenum-bers corresponds to the longest wavelength and most dangerousmodes expected to be present in the pedestal. When the circu-lar geometry of HD7 was implemented in GYRO, the agree-ment between growth rates and real frequencies from HD7 and
12

Nucl. Fusion 53 (2013) 093024 R.J. Groebner et al
144981_3000
144977_4270
144981_3000
144981_3000
144981_3000
144977_3250
144977_3250
144977_3250
144977_3250
144987_3350
144987_3350
144987_3350
144987_3350
Mean ratio = 1.19 ± 0.790.35
Mean ratio = 2.02 ± 0.48corr=0.94
corr=0.27
0.25
0.30
0.20
0.15
0.05
0.10
Expe
rimen
tal T
e|ρ T (k
eV)
0.7
0.5
0.6
0.4
0.3
0.1
0.2
0.0Expe
rimen
tal n
e|ρ T (1
020 /
m3 )
0.0 0.1 0.2 0.3 0.4 0.5Paleoclassical Te|ρT;
(Pe+Pi)/2
0.0 0.2 0.4 0.8 1.2 1.4Paleoclassical ne|ρT;
a–(a) → a–(ρT) (1020/m3)
0.6 1.0
Mean ratio = 1.22 ± 0.85
Mean ratio = 3.93 ± 4.81corr=0.61
corr=0.31
0 5 10 15 20 30Paleoclassical –∇Te|ρT;
(Pe+Pi)/2
0 20 40 60 80 100Paleoclassical –∇ne|ρT;a–(a) → a–(ρT) (1020/m3)
25
25
20
15
10
0
5
Expe
rimen
tal –
∇T e
|ρT (k
eV/m
)
30
25
20
15
5
10
0Expe
rimen
tal –
∇n e
|ρT (1
020 /
m4 )
(a)
(c)
(b)
(d)
144977_4270
144977_4270
144977_4270
Figure 14. Comparisons of experiment to predictions from thepaleoclassical model for (a) ne, (b) ∇ne, (c) Te and (d) ∇Te. Allquantities evaluated at the steepest part of the Te pedestal. Datashown for three different currents: DIII-D discharges 144977(1.0 MA), 144891 (1.5 MA), and 144987 (0.5 MA). For each dataset, points are obtained during evolution of an ELM cycle withmeasured parameters trending upwards with time.
–2.0
–1.5
–1.0
–0.5
0.0
0.5
1.0
1.5
2.0
2.5
0.95 0.96 0.97 0.98 0.99
GYROGEMHD7
GYROGEMHD7
Growth rates
Real frequencies
ψN
Freq
uenc
y (c
s/a)
Figure 15. Spatial profiles of linear growth rates and real frequnciesfor most unstable modes at kθρs = 0.25, as calculated with threedifferent gyrokinetic codes (GYRO, GEM, HD7). Each code is runwith its native plasma equilibrium model. Simulations are forDIII-D discharge 131997.
GYRO was within 20% for the same parameter scan. In orderto examine the importance of geometry in gyrokinetic mod-elling, a comparison of all three codes was performed, wherethe native geometry of each code was used in its calculations.A radial scan of frequencies was performed at kθρs = 0.25,the approximate normalized wavenumber where KBMs areexpected. Figure 15 shows that qualitatively the results aresimilar for the three codes except that HD7 finds no unstablemodes beyond ψN ∼ 0.97. The frequencies from GYRO andGEM agree to within a factor of 2, even in the steep gradientregion at ψN > 0.97. Differences between the three codes arelikely due primarily to differences in how the codes implementplasma geometry [55]. GEM used a Miller [71] representa-tion of the geometry, GYRO used a generalization of Millergeometry that includes squareness and elevation [72] and HD-7 used an (s − α) geometry consisting of toroidal circular fluxsurfaces with Shafranov shifts [73].
3.3.2. Unstable modes. The gyrokinetic modelling of aDIII-D pedestal, discussed above, has provided some resultson what modes might be unstable on top of the pedestal andin the pedestal. On the pedestal top, GYRO found the iontemperature gradient (ITG) modes to be the most unstablemodes for kθρs < 1.5 and that this transitioned to microtearing(MT) modes for kθρs > 1.5 [55]. In NSTX, calculations withGS2 predicted that MT modes were unstable in dischargeswithout lithium and that these modes were stabilized andtransitioned into trapped electron modes (TEM) with theapplication of lithium [57]. In the steep gradient region ofDIII-D, GYRO found two unnamed modes competing fordominance for kθρs = 0.1–0.8 [55]. The wavefunctionsfor these modes were found to be extended in ballooningangle, to be peaked off the outboard midplane and to havefine radial scale lengths. The modes have twisting parity, witha small electromagnetic component. They are not observed inelectrostatic simulations. In NSTX, ETG modes were foundto be unstable in the steep gradient region; these modes were
13

Nucl. Fusion 53 (2013) 093024 R.J. Groebner et al
0.01 0.100.01
0.10
L n/L T
=0.5
L n
L n/L T
=1L n
/L T=2
L n/L T
=3
NSTXC-ModDIII-D
LT
Figure 16. Scale length for electron density Lne versus scale lengthfor electron temperature LTe for NSTX, C-Mod and DIII-D. Scalelengths expressed in terms of ψN and data measured at the steepestpart of the electron pressure profile. Straight lines are lines ofconstant ηe = Lne/LTe .
more unstable in the discharges with lithium-coated walls [57].The findings are more complicated than can be fully describedhere. The interested reader is referred to the references formore detail. These results show that the steep gradients of thepedestal can drive a host of instabilities. More work is neededto determine if there is a unified picture of which modes areunstable and what role, if any, these modes play in controllingthe pedestal structure.
EDA discharges in C-Mod [40] have been modelled withthe BOUT++ code [74, 75]. This work finds that unstablemodes exist in the EDA pedestal when resistivity and ∇P
are high. These predictions are consistent with experimentaldiagnosis of the quasi-coherent mode (QCM), which appearsat high collisionality and high ∇P . A possible interpretationof the QCM is that it is a resistive analogue of the KBM andthat it limits pedestal gradients in EDA discharges.
3.4. ETG turbulence
Small scale turbulence due to ETG modes has been proposedas a process to drive electron thermal transport in thesteep pedestal [76]. Modelling of ETG modes with theGENE code [77] has predicted levels of electron thermaltransport comparable to the measured transport in AUG [76].Experiments have shown some qualitative and quantitativefeatures expected for ETG modes. In particular, values ofηe = Lne/LTe , where Lne and LTe are the ne and Te scalelengths, have been measured to be in the range where thesemodes are expected to be excited. An example is shown infigure 16, which is a plot of Lne versus LTe for data obtainedfrom C-Mod, DIII-D and NSTX. These values, evaluated atthe steepest part of the electron pressure gradient, are mostlyin the range of 1–3. Simulations with the GENE code predictthat an ηe value of about 1.2 is the threshold for the onsetof ETG turbulence [76]. Thus, essentially all of the pedestalsrepresented by figure 16 are predicted to have ETG turbulence.
Studies were performed in DIII-D where strong electronheating, particularly from electron cyclotron heating (ECH),was applied to determine if the pedestal ∇Te showed evidenceof reaching a ‘critical gradient’ beyond which it would notevolve much, as would be expected for sufficiently strong
0
10
20
30∇Te (keV/m)
0
5
10
15
∇ne (1020/m4)
0 2 4 5Pheat,e (MW)
0.0
0.5
1.0
1.5
2.0ηe = Lne / LTe
31
(a)
(b)
(c)
Figure 17. Variations of pedestal (a) ∇Te, (b) ∇ne and (c) ηe withelectron power flow into the pedestal in the power scan in DIII-D.Heating power is a combination of beam power into the electronsand ECH power, deposited on top of the pedestal.
ETG turbulence. Most of the power was applied with ECHjust inboard of the pedestal top; thus, much of this powerwas expected to flow directly through the electrons into thepedestal. Figure 17 illustrates that as the power into theelectrons was increased by about a factor of 4, the pedestal∇Te increased by about 50%, the density gradient droppedby about 30% and ηe was near unity but increased slightlyduring the scan. These results could be consistent with thepresence of ETG turbulence; if present, it was not so strong asto completely clamp the electron temperature.
As part of this experiment, a high-k backscatteringsystem [78] was used to measure density fluctuations atsmall spatial scales, kθ = 35 cm−1, where signatures ofETG turbulence would be expected. The relative densityfluctuation level showed a weak decrease with increasedheating power (figure 18). This trend is opposite to simpleexpectations of ETG modes increasing in magnitude withincreased heating power. However, the dominant effect ofincreased power on ETG modes should be observed in theelectron temperature fluctuations, which were not measured,and the density fluctuations might not show much effect fromincreased power. An important systematic issue is that thespatial resolution of the instrument was several centimeters;this is wider than the pedestal and thus the exact localizationof the fluctuations is not known. Further interpretation ofthese results requires detailed non-linear modelling of ETGturbulence and of the predicted signals for the high-k scatteringsystem.
The lithium experiment on NSTX was also used to look forevidence that ETG turbulence affected the pedestal structure[37]. In this experiment, the Te profile was observed tobe quite stiff in the pedestal, for ψN > 0.95, when thelithium coating was applied, even though the negradient inthe same region was reduced significantly (by ∼50% or
14
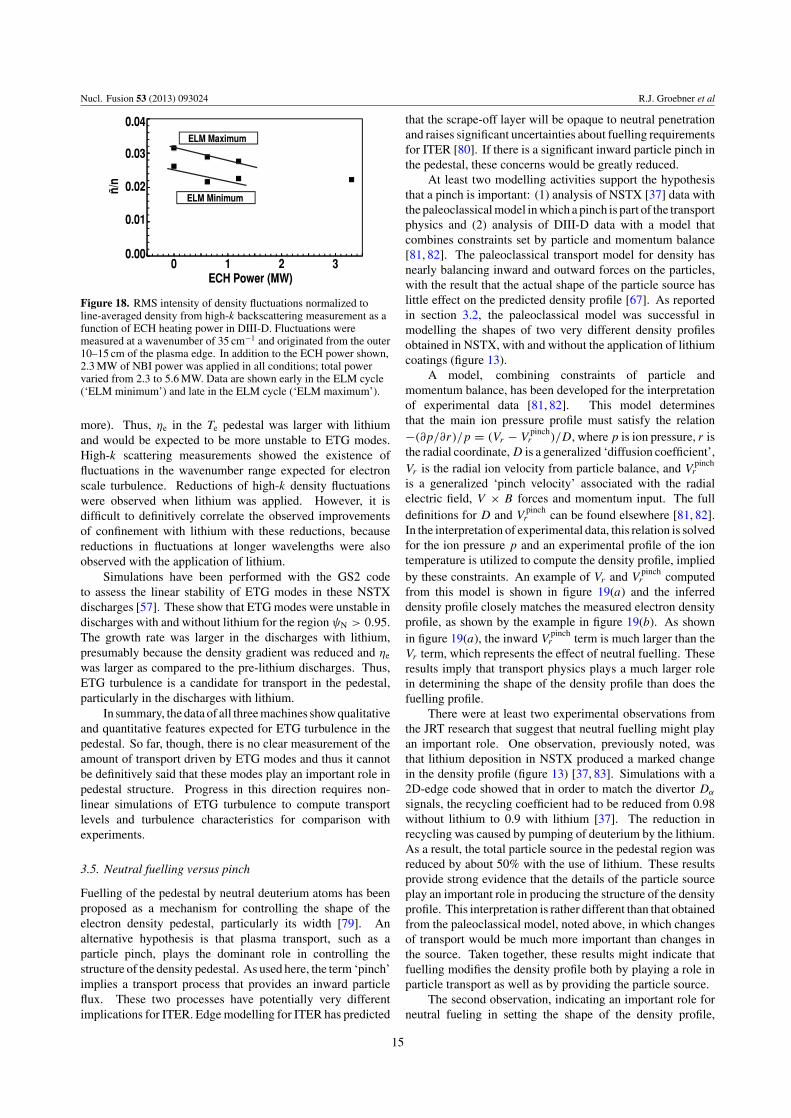
Nucl. Fusion 53 (2013) 093024 R.J. Groebner et al
0.00
0.01
0.02
0.03
0.04ELM Maximum
ELM Minimum
0 1 2 3ECH Power (MW)
ñ/n
Figure 18. RMS intensity of density fluctuations normalized toline-averaged density from high-k backscattering measurement as afunction of ECH heating power in DIII-D. Fluctuations weremeasured at a wavenumber of 35 cm−1 and originated from the outer10–15 cm of the plasma edge. In addition to the ECH power shown,2.3 MW of NBI power was applied in all conditions; total powervaried from 2.3 to 5.6 MW. Data are shown early in the ELM cycle(‘ELM minimum’) and late in the ELM cycle (‘ELM maximum’).
more). Thus, ηe in the Te pedestal was larger with lithiumand would be expected to be more unstable to ETG modes.High-k scattering measurements showed the existence offluctuations in the wavenumber range expected for electronscale turbulence. Reductions of high-k density fluctuationswere observed when lithium was applied. However, it isdifficult to definitively correlate the observed improvementsof confinement with lithium with these reductions, becausereductions in fluctuations at longer wavelengths were alsoobserved with the application of lithium.
Simulations have been performed with the GS2 codeto assess the linear stability of ETG modes in these NSTXdischarges [57]. These show that ETG modes were unstable indischarges with and without lithium for the region ψN > 0.95.The growth rate was larger in the discharges with lithium,presumably because the density gradient was reduced and ηe
was larger as compared to the pre-lithium discharges. Thus,ETG turbulence is a candidate for transport in the pedestal,particularly in the discharges with lithium.
In summary, the data of all three machines show qualitativeand quantitative features expected for ETG turbulence in thepedestal. So far, though, there is no clear measurement of theamount of transport driven by ETG modes and thus it cannotbe definitively said that these modes play an important role inpedestal structure. Progress in this direction requires non-linear simulations of ETG turbulence to compute transportlevels and turbulence characteristics for comparison withexperiments.
3.5. Neutral fuelling versus pinch
Fuelling of the pedestal by neutral deuterium atoms has beenproposed as a mechanism for controlling the shape of theelectron density pedestal, particularly its width [79]. Analternative hypothesis is that plasma transport, such as aparticle pinch, plays the dominant role in controlling thestructure of the density pedestal. As used here, the term ‘pinch’implies a transport process that provides an inward particleflux. These two processes have potentially very differentimplications for ITER. Edge modelling for ITER has predicted
that the scrape-off layer will be opaque to neutral penetrationand raises significant uncertainties about fuelling requirementsfor ITER [80]. If there is a significant inward particle pinch inthe pedestal, these concerns would be greatly reduced.
At least two modelling activities support the hypothesisthat a pinch is important: (1) analysis of NSTX [37] data withthe paleoclassical model in which a pinch is part of the transportphysics and (2) analysis of DIII-D data with a model thatcombines constraints set by particle and momentum balance[81, 82]. The paleoclassical transport model for density hasnearly balancing inward and outward forces on the particles,with the result that the actual shape of the particle source haslittle effect on the predicted density profile [67]. As reportedin section 3.2, the paleoclassical model was successful inmodelling the shapes of two very different density profilesobtained in NSTX, with and without the application of lithiumcoatings (figure 13).
A model, combining constraints of particle andmomentum balance, has been developed for the interpretationof experimental data [81, 82]. This model determinesthat the main ion pressure profile must satisfy the relation−(∂p/∂r)/p = (Vr − V
pinchr )/D, where p is ion pressure, r is
the radial coordinate, D is a generalized ‘diffusion coefficient’,Vr is the radial ion velocity from particle balance, and V
pinchr
is a generalized ‘pinch velocity’ associated with the radialelectric field, V × B forces and momentum input. The fulldefinitions for D and V
pinchr can be found elsewhere [81, 82].
In the interpretation of experimental data, this relation is solvedfor the ion pressure p and an experimental profile of the iontemperature is utilized to compute the density profile, impliedby these constraints. An example of Vr and V
pinchr computed
from this model is shown in figure 19(a) and the inferreddensity profile closely matches the measured electron densityprofile, as shown by the example in figure 19(b). As shownin figure 19(a), the inward V
pinchr term is much larger than the
Vr term, which represents the effect of neutral fuelling. Theseresults imply that transport physics plays a much larger rolein determining the shape of the density profile than does thefuelling profile.
There were at least two experimental observations fromthe JRT research that suggest that neutral fuelling might playan important role. One observation, previously noted, wasthat lithium deposition in NSTX produced a marked changein the density profile (figure 13) [37, 83]. Simulations with a2D-edge code showed that in order to match the divertor Dα
signals, the recycling coefficient had to be reduced from 0.98without lithium to 0.9 with lithium [37]. The reduction inrecycling was caused by pumping of deuterium by the lithium.As a result, the total particle source in the pedestal region wasreduced by about 50% with the use of lithium. These resultsprovide strong evidence that the details of the particle sourceplay an important role in producing the structure of the densityprofile. This interpretation is rather different than that obtainedfrom the paleoclassical model, noted above, in which changesof transport would be much more important than changes inthe source. Taken together, these results might indicate thatfuelling modifies the density profile both by playing a role inparticle transport as well as by providing the particle source.
The second observation, indicating an important role forneutral fueling in setting the shape of the density profile,
15

Nucl. Fusion 53 (2013) 093024 R.J. Groebner et al
0.86 0.88 0.90 0.92 0.94 0.96 0.98 1.00 1.02
–500
–400
–300
–200
–100
0
Velo
city
(m/s
)
Normalized Radius
Vrad Vpinch
98889 ELMing H-mode80-99% inter-ELM interval
0.93 0.94 0.95 0.96 0.97 0.98 0.99 1.00 1.010.5
1.0
1.5
2.0
2.5
3.0
Elec
tron
Den
sity
(x10
19 m
–3)
Normalized Radius
ModelExp. Thomson
98889 ELMing H-mode80-99% inter-ELM interval
(a)
(b)
Figure 19. (a) Spatial variation of radial ion velocity Vr (squares)and generalized pinch velocity V pinch
r (circles), as discussed in thetext, for DIII-D discharge 98889; (b) spatial variation ofexperimental electron density (circles) and modelled density(squares) obtained from interpretive analysis based on combinedconstraints of momentum and particle balance. (Adapted withpermission from [82]. Copyright 2012 by IOP Publishing andInternational Atomic Energy Agency.
was a pedestal similarity experiment performed in ELMingdischarges in C-Mod and DIII-D. The goal of the experimentwas to produce pedestals with the same dimensionlessparameters (shape, q, collisionality, beta) on the pedestal topand this was achieved. As a result, the properly scaled Te
profiles matched but the scaled density profile in DIII-D wassomewhat broader than in C-Mod. This result suggests thatfueling was important in setting the density shape, given theexpectation that the fueling profiles were quite different inthe two machines. This result is in contrast to a similarityexperiment between the two machines in which the densityand temperature profiles were matched in EDA H-modeconditions [84].
Studies were performed on DIII-D with the goal ofproviding definitive experimental proof that an inward particlepinch exists inside the pedestal [85]. These studies evaluatedthe ion continuity equation ∇ · � = S − ∂n/∂t to determinewhere in the plasma the flow of particles reversed from netoutwards to net inwards. In this equation, � is the particle
0.0
0.2
0.4
0.6
0.8
1.0
Den
sity
(1020
m–3
)
0
10
20
30
40
50
10 20 s –1
Radial ion flux timesRadial ion flux timessurface areasurface areaRadial ion flux timessurface area
Total ionization inside a surface
Total dni/dt inside a surface
Density
0.90 0.95 1.00 1.05ψN
Figure 20. Spatial profiles of terms in the volume integral ofparticle balance equation �⊥(ψ)A = ∫ ψ
0 (S − ∂n/∂t) dV , where�⊥(ψ)A = perpendicular ion flux times surface area,∫ ψ
0 S dV = total ionization inside a surface and∫ ψ
0 (∂n/∂t) dV = total dni/dt inside a surface. Units for thesequantities are shown on right-hand vertical axis. Data points areexperimental measurements of electron density and the fit curve ismodelled density, obtained from OEDGE analysis of a DIII-Ddischarge. Units of density are shown on left-hand vertical axis.
flux, S is the ionization rate (including ionization of beamparticles and neutrals from the wall), n is the ion density andt is time. This equation can be integrated over volume V toprovide the rate at which particles flow through a flux surface,�⊥(ψ)A = ∫ ψ
0 (S − ∂n/∂t) dV , where ψ is normalizedpoloidal flux at the outermost surface of the integral, �⊥(ψ) isthe particle flux through that surface and A is the area of thatsurface. The ionization rate of wall neutrals was obtained frominterpretive analysis with the OEDGE code [86]. Details of thefull analysis procedure are discussed elsewhere [85]. Figure 20shows the results for the three terms in the volume-integratedcontinuity equation, as determined from this analysis for adischarge with a long ELM cycle, which allowed for good timehistory measurements of density evolution. The radial ion fluxis positive (outwards) for ψN greater than 0.93 and becomesnegative (inwards) at smaller radii, where the volume integralof the ionization source cannot account for the increase in thetotal number of ions inside a flux surface. The negative flux isinterpreted as a sign of an inward particle pinch. However, inthe pedestal, a pinch cannot be inferred from this analysis. Thisresult does not rule out the possibility of a pinch in the pedestal.This research underscores the difficulties of experimentallyproving that there is a pinch in the pedestal.
4. Summary and discussion
Joint experiment/theory/modelling research has led toimproved understanding of the limits to the H-mode pedestalpressure profile, increased confidence in predictions of thepedestal height in ITER and new tests of models for pedestaltemperature and density profiles. This work was performedas part of a US DOE Joint Research Target in fiscal year2011 and included experimental research from C-Mod, DIII-Dand NSTX as well as interpretation of experimental datawith several theory-based modelling codes. The goal of
16
Nucl. Fusion 53 (2013) 093024 R.J. Groebner et al
the research was to identify important physics processesthat control pedestal structure and work towards improvedpredictive capability.
Two significant results of this work are that theoreticalconstraints on the pedestal pressure profile are consistent witha wide range of observations in these three machines andthese constraints provide a good basis for understanding andpredicting the pressure profile. The interplay between thetotal pressure profile and the edge current density profile, witha large contribution from the bootstrap current, provides thedominant physics for these constraints. One constraint is setby ideal finite-n peeling–ballooning modes, which are non-local modes, predicted to be the MHD modes that trigger type-IELMs. Significant work was performed to extend models forthese modes to the high-field C-Mod device and the low aspectratio NSTX device. In all three machines, within error bars, theoperating space is never observed to extend past the instabilityboundaries predicted for these modes.
The second constraint is that kinetic ballooning modesprovide a limit to the local pedestal pressure gradient. Thesemodes are smaller scale and less virulent than peeling–ballooning modes. However, these modes are predicted to turnon robustly when a critical pressure gradient is reached and tolimit the gradient to near the critical value. Kinetic ballooningphysics has provided a successful quantitative description ofthe pedestal width scaling in C-Mod and DIII-D. The modelqualitatively captures the experimental trend that widths arehigher in the low aspect ratio NSTX device than in theconventional aspect ratio machines.
These two constraints on the pedestal pressure profile havebeen combined into one model (EPED) which predicts pedestalwidth and height at the onset of a type-I ELM. The model makesgood predictions of the pedestal pressure widths and heightsobserved in C-Mod and DIII-D over a wide range of conditions.The C-Mod data have increased the highest pressure at whichthe model has been tested by a factor of two. A new DIII-D dataset has provided improved tests of the model at large widths.These predictions are accurate to about 20% and provide agood basis for predicting the pedestal height in ITER, which ispredicted to have a pressure that is an extrapolation of a factorof 3 from the existing data set.
An important input to peeling–ballooning models andkinetic ballooning models is the current density profile, whichis typically obtained from calculations using neoclassicalbootstrap current models such as the Sauter model. Newkinetic models with more complete physics have been usedto compute the bootstrap current. Predictions of the Sautermodel are in general agreement with the newer models forsufficiently collisionless conditions. However, there are oftendifferences for collisional pedestals. An important open issueis that measurements of the edge current density are needed tobenchmark predictive models.
Searches for the presence of kinetic ballooning modeshave been performed in both experiment and simulations.Density fluctuations have been reported in some experimentsthat have signatures expected of kinetic ballooning modes,including frequency, localization to the pedestal andpropagation direction. There have also been observations thatthe rate of change of the pedestal electron pressure gradientslows or is halted at the time that density fluctuations turn
on in the pedestal. These observations are consistent withexpectations for KBMs but it has not been shown that they areindeed caused by KBMs. Simulations have been performedfor NSTX and DIII-D with electromagnetic gyrokinetic codesto determine if experimental profiles are unstable to KBMs.For calculations with a local model, KBMs have been foundto be either subdominant to faster growing modes or to lie in aregion expected to be second stable to these modes. In a globalcalculation, the modes were found to be unstable when theexperimental reconstructed q-profile was artificially flattened.More experimental and simulation work is needed to clarifywhether these modes play a role in the pedestal.
A number of models for other physics processes,particularly those relating to the structure of density ortemperature profiles were also tested. The XGC0 code,employing models for kinetic ions and neutral fueling, hasbeen used to examine the combined effect of neoclassicaltransport and neutral fueling on the density pedestal. The codequalitatively reproduces several features of the experiments,including the steep density gradients observed in the H-modepedestal but typically produces density pedestals that areusually narrower than observed. Some anomalous particletransport is required in addition to neoclassical transport toexplain the observations.
An analytic model for paleoclassical transport has beenused to predict features of pedestal electron temperature anddensity profiles in NSTX and DIII-D. The model has madegood predictions of the electron thermal diffusivity and theshape of the pedestal density profile in NSTX discharges withsignificant lithium injection. For a range of discharges inDIII-D, the model predicts the minimum observed electronthermal diffusivity. In other cases, additional electron thermaltransport must be invoked to explain the results. The modelpredicts densities that are typically about 2 times larger thanobserved in DIII-D. Thus, some additional particle transportmust be invoked to explain the observations.
There are qualitative and quantitative observations inall machines that have features expected for ETG modes,predicted to limit the pedestal Te gradient. For instance,the ratio of the electron density scale length to the electrontemperature scale length in the pedestal is ∼1–3, a magnitudethat is expected to destabilize ETG modes. In addition, shortwavelength fluctuations, in a range expected for ETG modes,have been observed at the edge of both NSTX and DIII-D.So far, though, there is no clear measurement of the amountof transport driven by ETG modes. Thus, they remain ascandidates for important pedestal processes.
Linear calculations with electromagnetic gyrokineticcodes have been made to identify important fluctuationprocesses in and near the pedestal. These efforts find evidenceof ITG and/or microtearing instabilities on the pedestal top andsmaller scale, electron modes in the steep gradient region ofthe pedestal. However, the results are complex and machine-dependent and it is not yet clear if there is a consistent set ofmodes present in and on top of the pedestal. This work showedthat edge magnetic geometry is important in the physics ofthese instabilities and must be properly modelled for accurateresults. Simulations of EDA discharges in C-Mod with a two-fluid turbulence code predict that unstable modes exist in thepedestal when the resistivity is high. These modes have several
17
Nucl. Fusion 53 (2013) 093024 R.J. Groebner et al
characteristics of the quasi-coherent (QC) modes observed inthe C-Mod pedestal in these discharges.
Experimental and modelling evidence suggest that bothatomic physics and a pinch play a role in controlling the densitypedestal. Some of the strongest evidence in favour of a pinchis interpretive modelling, based on combined constraints ofparticle and momentum balance, which implies that a stronginward force plays a dominant role in molding the densityprofile. Some of the strongest evidence in favour of fueling wasan experiment in NSTX in which the density profile shape wasdramatically changed when the deuterium recycling coefficientwas reduced by about an order of magnitude. However, it hasso far not been possible to directly measure a pinch in thepedestal in experiments. In combination, these results suggestthat both transport (pinch) and fueling effects play a role in thedensity profile shape and that the importance of these effectsmay be regime dependent.
Overall, these results provide increased confidence thatsome elements of pedestal structure (P-B stability, bootstrapcurrent and pedestal gradient limits) are sufficiently wellunderstood to allow for an understanding of limits to thepedestal pressure profile. This understanding can be used topredict the pedestal height in ITER with good confidence. Forthe ITER baseline scenario, the predicted pedestal temperatureis in the range needed to get fusion Q = 10, as implied byseveral transport models [1]. In addition, this understandingprovides the important ability to perform pedestal optimizationstudies in existing and future machines. An important next stepfor pedestal modelling is an understanding of the physics ofthe density and/or temperature profile. A predictive capabilityfor one or both of these profiles will provide a more completeand powerful capability for designing and optimizing the nextgeneration of machines.
Acknowledgments
This work was supported in part by the US Department ofEnergy under DE-FC02-04ER54698, DE-FG02-95ER54309,DE-FG02-00ER54538, DE-AC52-07NA27344, DE-FC02-93ER54186, DE-AC05-00OR22725, DE-AC02-09CH11466,DE-AC04-94AL85000, DE-FG03-94ER54271, DE-FG02-08ER54984, DE-FG02-07ER54917, DE-FC02-05ER54816,DE-FG02-89ER53296, DE-FG02-08ER54999 and workperformed at the University of Toronto was funded bythe Natural Sciences and Engineering Research Council ofCanada.
References
[1] Doyle E.J. et al 2007 Progress in the ITER Physics Basis:chapter 2. Plasma confinement and transport Nucl. Fusion47 S18
[2] Chan V.S. et al 2011 Nucl. Fusion 51 083019[3] Snyder P.B., Groebner R.J., Leonard A.W., Osborne T.H. and
Wilson H.R. 2009 Phys. Plasmas 16 056118[4] Osborne T.H., Groebner R.J., Lao L.L., Leonard A.W.,
Maingi R., Miller R.L., Porter G.D., Thomas D.M. andWaltz R.E. 1997 Proc. 24th EPS Conf. on Controlled Fusionand Plasma Physics (Berchtesgaden, Germany, 1997) vol21A (Petit-Lancy: European Physical Society) p 1101
[5] Greenwald M. et al 1997 Nucl. Fusion 37 793[6] Suttrop W. et al 1997 Plasma Phys. Control. Fusion 39 2051
[7] Kotschenreuther M., Dorland W., Liu Q.P., Hammett G.W.,Beer M.A., Smith S.A., Bondeson A. and Cowley S.C. 1997Proc. 16th Int. Conf. on Fusion Energy 1996 (Montreal,Canada, 1996) vol 2 (Vienna: IAEA) p 371 and www-naweb.iaea.org/napc/physics/FEC/STIPUB1004 VOL2.pdf
[8] Kinsey J.E., Bateman G., Onjun T., Kritz A.H., Pankin A.,Staebler G.M. and Waltz R.E. 2003 Nucl. Fusion 43 1845
[9] Kinsey J.E., Staebler G.M., Candy J., Waltz, R.E. and BudnyR.V. 2011 Nucl. Fusion 51 083001
[10] Snyder P.B. et al 2012 39th EPS Conf. on Plasma Physics and16th Int. Congress on Plasma Physics 2012 (Stockholm,Sweden) vol 36F (Madrid: European Physical Society)P4.029 and http://ocs.ciemat.es/epsicpp2012pap/html/
[11] Snyder P.B. et al 2009 Nucl. Fusion 49 085035[12] Sauter O., Angioni C. and Lin-Liu Y.R. 1999 Phys. Plasmas
6 2834[13] Houlberg W.A., Shaing K.C., Hirshman S.P. and
Zarnstorff M.C. 1997 Phys. Plasmas 4 3230[14] Wade M.R., Murakami M. and Politzer P.A. 2004 Phys. Rev.
Lett. 92 235005[15] Thomas D.M., Leonard A.W., Groebner R.J., Osborne T.H.,
Casper T.A., Snyder P.B. and Lao L.L. 2005 Phys. Plasmas12 056123
[16] De Bock M.F.M., Citrin J., Saarelma S., Temple D.,Conway N.J., Kirk A., Meyer H., Michael C.A. andthe MAST Team 2012 Plasma Phys. Control. Fusion54 025001
[17] Chang C.S., Ku S. and Weitzner H. 2004 Phys. Plasmas11 2649
[18] Belli E.A. and Candy J. 2008 Plasma Phys. Control. Fusion50 095010
[19] Landreman M. and Ernst Darin R. 2012 Plasma Phys. Control.Fusion 54 115006
[20] Koh S., Chang C.S., Ku S., Menard J.E., Weitzner H. andChoe W. 2012 Phys. Plasmas 19 072505
[21] Chang C.S., Koh S., Choe W., Ku S., Parker S., Wan W. andChen Y. 2012 Proc. 24th Int. Conf. on Fusion Energy 2012(San Diego, CA, 2012) TH/P4-12 and www-naweb.iaea.org/napc/physics/FEC/FEC2012/index.htm
[22] Hirshman S.P. 1988 Phys. Fluids 31 3150[23] Callen J.D. 2010 Viscous forces due to collisional parallel
stresses for extended MHD codes Univ. Wisconsin ReportsUW-CPTC 09-6R; 2011 Parallel neoclassical resistivityevaluation Univ. Wisconsin Reports UW-CPTC 11-05
[24] Pankin A.Y. et al 2012 Proc. 24th Int. Conf. on Fusion Energy2012 (San Diego, CA, 2012) TH/P4-07 and www-naweb.iaea.org/napc/physics/FEC/FEC2012/index.htm
[25] Hegna C.C., Connor J.W., Hastie R.J. and Wilson H.R. 1996Phys. Plasmas 3 584
[26] Hughes J.W., Mossessian D., Zhurovich K., DeMaria M.,Jensen K. and Hubbard A. 2003 Rev. Sci. Instrum.74 1667
[27] Eldon D. et al 2012 Rev. Sci. Instrum. 83 10E343[28] LeBlanc B.P., Bell R.E., Johnson D.W., Hoffman D.E.,
Long D.C. and Palladino R.W. 2003 Rev. Sci. Instrum.74 1659
[29] McDermott R.M. et al 2009 Phys. Plasmas 16 056103[30] Gohil P., Burrell K.H., Groebner R.J., Kim J., Martin W.C.,
McKee E.L. and Seraydarian R.P. 1991 Proc. 14th Symp. onFusion Engineering (San Diego, CA) vol 2 (New York:Institute of Electrical and Electronics Engineers) p 1199
[31] Bell R.E., Andre R., Kaye S.M., Kolesnikov R.A.,LeBlanc B.P., Rewoldt G., Wang W.X. and Sabbagh S.A.2010 Phys. Plasmas 17 082507
[32] Lao L.L., Ferron J.R., Groebner R.J., Howl W., St. John H.,Strait E.J. and Taylor T.S. 1990 Nucl. Fusion 30 1035
[33] Osborne T.H., Snyder P.B., Burrell K.H., Evans T.E.,Fenstermacher M.E., Leonard A.W., Moyer R.A.,Schaffer M.J. and West W.P. 2008 J. Phys.: Conf. Ser.123 012014
[34] Walk J.R., Snyder P.B., Hughes J.W., Terry J.L., Hubbard A.E.and Phillips P.E. 2012 Nucl. Fusion 52 063011
18

Nucl. Fusion 53 (2013) 093024 R.J. Groebner et al
[35] Wilson H.R., Snyder P.B., Huysmans G.T.A. and Miller R.L.2002 Phys. Plasmas 9 1277
[36] Snyder P.B. and Wilson H.R. 2003 Plasma Phys. Control.Fusion 45 1671
[37] Canik J.M. et al 2011 Phys. Plasmas 18 056118[38] Boyle D.P., Maingi R., Snyder P.B., Manickam J.,
Osborne T.H., Bell R.E., LeBlanc B.P. and the NSTX Team2011 Plasma Phys. Control. Fusion 53 105011
[39] Whyte D.G. et al 2010 Nucl. Fusion 50 105005[40] Hughes J. et al 2013 Nucl. Fusion 53 043016[41] Greenwald M. et al 1999 Phys. Plasmas 6 1943[42] Snyder P.B., Groebner R.J., Hughes J.W., Osborne T.H.,
Beurskens M., Leonard A.W., Wilson H.R. and Xu X.Q.2011 Nucl. Fusion 51 103016
[43] Miller R.L., Lin-Liu Y.R., Turnbull A.D., Chan V.S.,Pearlstein L.D., Sauter O. and Villard L. 1997 Phys.Plasmas 4 1062
[44] Groebner R.J., Leonard A.W., Snyder P.B., Osborne T.H.,Maggi C.F., Fenstermacher M.E., Petty C.C. and OwenL.W. 2009 Nucl. Fusion 49 085037
[45] Diallo A., Maingi R., Kubota S., Sontag A., Osborne T.,Podesta M., Bell R.E., LeBlanc B.P., Menard J. andSabbagh S. 2011 Nucl. Fusion 51 103031
[46] Groebner R.J., Osborne T.H., Leonard A.W. andFenstermacher M.E. 2009 Nucl. Fusion 49 045013
[47] Groebner R.J. et al 2010 Nucl. Fusion 50 064002[48] Wolfrum E., Burckhart A., Fischer R., Hicks N., Konz C.,
Kurzan B., Langer B., Putterich T., Zohm H. and theASDEX Upgrade Team 2009 Plasma Phys. Control. Fusion51 124057
[49] Burckhart A., Wolfrum E., Fischer R., Lackner K., Zohm H.and the ASDEX Upgrade Team 2010 Plasma Phys.Control. Fusion 52 105010
[50] Dickinson D., Saarelma S., Scannell R., Kirk A., Roach C.M.and Wilson H.R. 2011 Plasma Phys. Control. Fusion53 115010
[51] Snyder P.B., Osborne T.H., Burrell K.H., Groebner R.J.,Leonard A.W., Nazikian R., Orlov D.M., Schmitz O.,Wade M.R. and Wilson H.R. 2012 Phys. Plasmas19 056115
[52] Yan Z., McKee G.R., Groebner R.J., Snyder P.B., OsborneT.H. and Burrell K.H. 2011 Phys. Rev. Lett. 107 055004
[53] Yan Z., McKee G.R., Groebner R.J., Snyder P.B.,Osborne T.H., Beurskens M.N. and Burrell K.H. 2011 Phys.Plasmas 18 056117
[54] McKee G.R., Fonck R.J., Gupta D.K., Schlossberg D.J.,Shafer M.W., Boivin R.L. and Solomon W.M. 2007 PlasmaFusion Research 2 S1025
[55] Wang E., Xu X., Candy J., Groebner R.J., Snyder P.B.,Chen Y., Parker S.E., Wan W., Lu G. and Dong J.Q. 2012Nucl. Fusion 52 103015
[56] Wan W., Parker S.E., Chen Y., Yan Z., Groebner R.J. andSnyder P.B. 2012 Phys. Rev. Lett. 109 185004
[57] Canik J.M., Guttenfelder W., Maingi R., Osborne T.H.,Kubota S., Ren Y., Bell R.E., Kugel H.W., LeBlanc B.P. andSouhkanovskii V.A. 2013 Edge plasma transport andmicrostability analysis with lithium-coated plasma-facingcomponents in NSTX, Nucl. Fusion submitted
[58] Huysmans G.T.A, Goedbloed J.P and Kerner W.O.K 1991 Int.J. Mod. Phys. C 02 371
[59] Kotschenreuther M., Rewoldt G. and Tang W.M. 1995Comput. Phys. Commun. 88 128
[60] Candy J. and Waltz R.E. 2003 J. Comput. Phys.186 545
[61] Chen Y. and Parker S.E. 2007 J. Comput. Phys.220 839
[62] Snyder P.B. et al 2012 Proc. 24th Int. Conf. on Fusion Energy2012 (San Diego, CA, 2012) TH/P3-17 and www-naweb.iaea.org/napc/physics/FEC/FEC2012/index.htm
[63] Pankin A.Y. et al 2011 Kinetic modeling of H-mode pedestalwith effects from anomalous transport and MHD stabilityProblems of Atomic Science and Technology 2011 No. 1.Series: Plasma Physics (17) 8–12
[64] Pankin A.Y. et al 2011 Stress tests of transport models usingFACETS code AIP Conf. Proc. 1392 110
[65] St John H., Taylor T.S., Lin-Liu Y.R. and Turnbull A.D. 1994Proc. 15th Int. Conf. on Plasma Physics and ControlledNuclear Fusion Research 1994 (Seville, 1994) vol 3(Vienna: IAEA) p 60 www-naweb.iaea.org/napc/physics/FEC/STIPUB948 VOL3.pdf
[66] Callen J.D. 2005 Nucl. Fusion 45 1120[67] Callen J.D., Canik J.M. and Smith S.P. 2012 Phys. Rev. Lett.
108 245003[68] Smith S.P., Callen J.D., Groebner R.J., Osborne T.H., Leonard
A.W., Eldon D., Bray B.D. and the DIII-D Team 2012 Nucl.Fusion 52 114016
[69] ITER Physics Expert Group on Confinement, Transport, ITERPhysics Expert Group on Confinement Modelling,Database, and ITER Physics Basis Editors 1999 Plasmaconfinement and transport Nucl. Fusion 39 2175 chapter 2
[70] Dong J.Q., Guzdar P.N. and Lee Y.C. 1987 Phys. Fluids30 2694
[71] Miller L., Chu M.S., Green J.M., Lin-Liu Y.R. and Waltz R.E.1998 Phys. Plasmas 5 973
[72] Candy J. 2009 Plasma Phys. Control. Fusion 51 105009[73] Dong J.Q., Chen L., Zonca F. and Jian G.D. 2004 Phys.
Plasmas 11 997[74] Xu X.Q., Cohen R.H., Rognlien T.D. and Myra J.R. 2000
Phys. Plasmas 7 1951[75] Dudson D., Umansky M.V., Xu X.Q., Snyder P.B. and Wilson
H.R. 2009 Comput. Phys. Commun. 180 1467[76] Jenko F., Told D., Xanthopoulos P., Merz F. and Horton L.D.
2009 Phys. Plasmas 16 055901[77] Jenko F., Dorland W., Kotschenreuther M. and Rogers B.N.
2000 Phys. Plasmas 7 1904[78] Rhodes T.L., Peebles W.A., Nguyen X., Van Zeeland M.A.,
deGrassie J.S., Doyle E.J., Wang G. and Zeng L. 2006 Rev.Sci. Instrum. 77 10E922
[79] Mahdavi M.A., Maingi R., Groebner R.J., Leonard A.W.,Osborne T.H. and Porter G. 2003 Phys. Plasmas 10 3984
[80] Kukushkin A.S., Pacher H.D., Loarte A., Komarov V., KotovV., Merola M., Pacher G.W. and Reiter D. 2009 Nucl.Fusion 49 075008
[81] Stacey W.M. and Groebner R.J. 2009 Phys. Plasmas16 102504
[82] Stacey W.M., Groebner R.J. and Evans T.E. 2012 Nucl. Fusion52 114020
[83] Maingi R. et al 2012 Nucl. Fusion 52 083001[84] Mossessian D.A., Groebner R.J., Moyer R.A., Osborne T.H.,
Hughes J.W., Greenwald M., Hubbard A., Rhodes T.L.2003 Phys. Plasmas 10 689
[85] Leonard A.W., Elder J.D., Canik J.M., Groebner R.J. andOsborne T.H. 2013 J. Nucl. Mater. 438 (Suppl.) S246–9
[86] Lisgo S. et al 2005 J. Nucl. Mater. 337–339 139
19