Improved Performance of Jointed Plain Concrete Pavements ... · Improved Performance of Jointed...
93
Improved Performance of Jointed Plain Concrete Pavements (JPCP) Through a Better Awareness of Drying Shrinkage FINAL REPORT 12/31/2013 COMMONWEALTH OF PENNSYLVANIA DEPARTMENT OF TRANSPORTATION CONTRACT # 4400004037 WORK ORDER # PIT WO 6 By N. Dufalla J. M. Vandenbossche (PI), P.E., Ph.D K. Alland And S. Sachs
Transcript of Improved Performance of Jointed Plain Concrete Pavements ... · Improved Performance of Jointed...

Improved Performance of Jointed Plain Concrete Pavements (JPCP) Through a Better Awareness of Drying Shrinkage
FINAL REPORT
12/31/2013
COMMONWEALTH OF PENNSYLVANIA
DEPARTMENT OF TRANSPORTATION
CONTRACT # 4400004037 WORK ORDER # PIT WO 6
By N. Dufalla J. M. Vandenbossche (PI), P.E., Ph.D K. Alland And S. Sachs

1. Report No.
FHWA-PA-2013-011-PIT WO 6
2. Government Accession No.
3. Recipient’s Catalog No.
4. Title and Subtitle
Improved Performance of Jointed Plain Concrete Pavements (JPCP) Through a Better Awareness of Drying Shrinkage
5. Report Date: 12/31/2013
6. Performing Organization Code
N/A
7. Author(s)
N. Dufalla, J.M. Vandenbossche, K. Alland, and S. Sachs
8. Performing Organization Report No.
N/A
9. Performing Organization Name and Address
University of Pittsburgh Department of Civil Engineering 735 Benedum Hall 3700 O’Hara Street Pittsburgh, PA 15261
10. Work Unit No. (TRAIS)
11. Contract or Grant No.
4400004037, PIT WO 6
12. Sponsoring Agency Name and Address
The Pennsylvania Department of Transportation Bureau of Planning and Research Commonwealth Keystone Building 400 North Street, 6th Floor Harrisburg, PA 17120-0064
13. Type of Report and Period Covered
Final Report: 4/12/13 – 12/31/13
14. Sponsoring Agency Code
15. Supplementary Notes
Technical liaisons: S. Marsinko, [email protected], (724) 439-7238
16. Abstract
Long-term drying shrinkage and early-age plastic shrinkage cracking can affect the performance of jointed plain concrete pavements (JPCPs). While plastic shrinkage cracking affects the durability, long-term drying shrinkage affects the fatigue life. This study evaluates current Pennsylvania Department of Transportation specifications and practices pertaining to the paving mix design and construction, specifically finishing and curing, and their effects on long-term performance. This specification review was supplemented by a laboratory study to evaluate curing and mix design enhancements. Based on the results from the study, it is recommended that PennDOT require a curing compound with a poly alpha methylstyrene resin rather than the currently required wax-based compound. A maximum shelf life of 6 months for the curing compound should also be enforced. The application of the curing compound should be performed exclusively with mechanized equipment for mainline paving to ensure a uniform application. Regarding the finishing of JPCPs, the practice of pulling a wet burlap drag immediately behind the paving equipment but before the finishing should be eliminated. If used, the wet burlap drag should occur after finishing and only to add texture but without adding excessive water to the surface. A denser aggregate gradation should be used for pavement mix designs to reduce the cement demand thereby reducing drying shrinkage and increase durability. The Shilstone methodology can be used for establishing this gradation. Finally, a target 0.40 water-to-cement ratio is recommended for paving mixes to improve durability.

Form DOT F 1700.7 (8-72) Reproduction of completed page authorized
17. Key Words
Concrete pavement curing, pavement construction, concrete shrinkage cracking, plastic shrinkage cracking.
18. Distribution Statement
No restrictions. This document is available from the National Technical Information Service, Springfield, VA 22161
19. Security Classif. (of this report)
Unclassified
20. Security Classif. (of this page)
Unclassified
21. No. of Pages
85
22. Price
N/A
i
Acknowledgments
The authors would like to extend thanks to the PennDOT project managers who extended invitations for
site visits and were very cooperative and informative: Mr. William Snyder, Ms. Roxanne Rossi, and Mr.
David Schaeffer. The authors are also extremely grateful to Mr. Steven Marsinko, Mr. Leonard Kubitza
and Mr. William Kovach with PennDOT District 12-0 and their assistance with the completion of this
project. Additionally, the help of students Feng Mu and Zichang Li was greatly appreciated.
Disclaimer
The contents of this report reflect the views of the author(s) who is (are) responsible for the facts and the
accuracy of the data presented herein. The contents do not necessarily reflect the official views or
policies of the US Department of Transportation, Federal Highway Administration, or the
Commonwealth of Pennsylvania at the time of publication. This report does not constitute a standard,
specification or regulation.
Statement of Credit
This work was sponsored by the Pennsylvania Department of Transportation and the U.S. Department of
Transportation, Federal Highway Administration.
ii
Table of Contents
1. INTRODUCTION ................................................................................................................. 1
2. BACKGROUND .................................................................................................................... 1
2.1. Contributing Factors...................................................................................................... 2
2.1.a. Plastic shrinkage cracking ...................................................................................... 2
2.1.b. Drying shrinkage...................................................................................................... 6
3. SPECIFICATION REVIEW ................................................................................................ 7
3.1 Mixture Design ............................................................................................................... 8
3.2 Finishing and Curing ................................................................................................... 12
4. SITE VISITS ........................................................................................................................ 15
4.1 I-79 South Section 20-H, Washington County, PA ................................................... 15
4.3 Route 119-South Section 10K, Fayette County, PA .................................................. 19
4.4 I-80, Reynoldsville, PA ................................................................................................. 21
5. FINDINGS FROM SPECIFICATION REVIEW AND SITE VISITS .......................... 27
5.1 Construction ................................................................................................................. 27
5.2 Mixture design .............................................................................................................. 30
6. LABORATORY INVESTIGATION ................................................................................. 34
6.1. Curing compound study .............................................................................................. 34
6.1.a. Description of the curing study ............................................................................. 34
6.1.b. Results from the curing study ................................................................................ 40
6.2. Mix design study ........................................................................................................... 57
6.2.a. Description of the mix design study ...................................................................... 57
6.2.b. Results from the mix design study ......................................................................... 63
7. RECOMMENDATIONS .................................................................................................... 71
7.1. Construction ................................................................................................................. 34
7.1.a. Curing ..................................................................................................................... 34
7.1.b. Concrete finishing .................................................................................................. 74
7.2. Mixture Design ............................................................................................................. 75
7.1.a. Aggregate gradation ............................................................................................... 75
7.1.b. w/cm ratio ............................................................................................................... 75
iii
List of Tables
Table 1. Weather conditions for Pittsburgh, PA. ........................................................................... 5
Table 2. Rate of evaporation estimated for Pittsburgh, PA. .......................................................... 5
Table 3. Specification review of concrete mix design parameters. ............................................... 8
Table 4. Minnesota DOT Incentive/Disincentive program for w/c ratio. ...................................... 9
Table 5. Coarse aggregate gradations from selected state construction specifications, given as
percent passing. ............................................................................................................................. 10
Table 6. Minnesota DOT incentive coarse aggregate gradations. ............................................... 11
Table 7. ASTM C309 specifications for liquid membrane forming curing compounds. ............ 14
Table 8. Specific curing compound characteristics for select states. ........................................... 14
Table 9. Characteristics of the curing compounds included in this study. .................................. 35
Table 10. Batch quantities for the mortar mixes. ......................................................................... 35
Table 11. Significant relationships for cumulative moisture loss for control curing methods. ... 43
Table 12. Significant relationships for cumulative moisture loss by solids type......................... 44
Table 13. Significant relationships for cumulative moisture by solids type and percentage
against two control methods. ........................................................................................................ 45
Table 14. Significant relationships for cumulative moisture by solids type and percentage. ...... 46
Table 15. Significant relationships for compressive strength testing against two control methods.
....................................................................................................................................................... 48
Table 16. Significant relationships for compressive strength testing. ......................................... 49
Table 17. Significant relationships for compressive strength testing for specific solids type and
percentage against two control methods. ...................................................................................... 51
Table 18. Significant relationships for compressive strength testing for specific solids type and
percentage. .................................................................................................................................... 52
Table 19. Significant relationships for permeability testing against two control methods .......... 55
Table 20. Significant relationships for permeability testing. ....................................................... 55
Table 21. Material used for concrete mixes. ................................................................................ 58
Table 22. PennDOT Specification for concrete paving mixes. ................................................... 58
Table 23. Coarse aggregate gradations for PennDOT paving projects. ....................................... 59
Table 24. Mix design for the two mixes considered, per cubic yard. .......................................... 59
Table 25. Aggregate gradations used for the PennDOT and the revised mixes. ......................... 60
Table 26. 4 in × 8 in cylinder 28 day test results for Revised and PennDOT mixes. ................. 64
Table 27. Requirement for poly alpha methylstyrene curing compound. .................................... 72

iv
List of Figures
Figure 1. Typical plastic shrinkage cracking (Kostmatka 2002). .................................................. 3
Figure 2. Relationship between air temperature, concrete temperature, wind velocity, and
relative humidity to the rate of evaporation from a concrete surface (Kostmatka 2002). .............. 4
Figure 3. Effect of water content of concrete mix on drying shrinkage. ....................................... 6
Figure 4. Aggregate gradations. ..................................................................................................... 7
Figure 5. Wet burlap drag for texturing following finishing. ...................................................... 16
Figure 6. Application of curing compound. Note nonuniform application. ................................ 17
Figure 7. Striking off the concrete and hand finishing. ............................................................... 18
Figure 8. White polyethylene sheet used for curing the roadway section. .................................. 19
Figure 9. Paving placement equipment. ....................................................................................... 20
Figure 10. Application of curing compound with hand wand on work bridge. ........................... 21
Figure 11. Curing compound on the pavement surface. .............................................................. 21
Figure 12. Main paver with burlap drag. ..................................................................................... 22
Figure 13. Excess surface water during hand finishing. .............................................................. 23
Figure 14. Tining the pavement surface. ..................................................................................... 23
Figure 15. Spray nozzles and wind screen on the cure cart. ........................................................ 24
Figure 16. Field specimen for measuring the application rate of the curing compound. ............ 25
Figure 17. Five specimens for measuring the curing compound application rate. ...................... 25
Figure 18. Pavement with applied curing compound. ................................................................. 26
Figure 19. Sheeting used in addition to the curing compound due to impending rain. ............... 26
Figure 20. Segregation found in cores pulled from pavements in Pennsylvania. ........................ 27
Figure 21. Plastic shrinkage cracking on I-80 in Clinton County, PA. ....................................... 29
Figure 22. Plastic shrinkage cracking on SR 202 in Chester County, PA. .................................. 29
Figure 23. Plastic shrinkage cracking on US 22 in Murrysville, PA. .......................................... 30
Figure 24. Wear/erosion of the pavement surface on the surface of core form US 22 in
Westmoreland County, PA. .......................................................................................................... 30
Figure 25. Revised Shilstone coarseness factor chart (Shilstone and Shilstone Jr., 1997). ......... 33
Figure 26. Mortar specimens placed in lifts on vibration table. .................................................. 36
Figure 27. Grooves cut in mortar specimens following dry brush texturing. .............................. 37
Figure 28. Silicone sealed specimens following groove cutting.................................................. 37
Figure 29. Finished specimens placed in environmental chamber. ............................................. 38
Figure 30. Mortar cubes being cut from the curing specimens.................................................... 39
Figure 31. Typical 2 in mortar cube tested for compression strength. ........................................ 39
Figure 32. The permeability testing setup.................................................................................... 40
Figure 33. Moisture loss per area vs. time for 3 days. ................................................................. 41
Figure 34. Moisture loss per area vs time for 7 days. .................................................................. 42
Figure 35. Average 3-day compressive strengths based on solids type. ...................................... 47
Figure 36. Average 7-day compressive strengths based on solids type. ...................................... 48

v
Figure 37. Average 3-day compressive strength vs cure treatment. ............................................ 50
Figure 38. Average 7-day compressive strength vs cure treatment. ............................................ 50
Figure 39. Moisture loss per area vs compressive strength at 3 days. ......................................... 53
Figure 40. Moisture loss per area vs compressive strength at 7 days. ......................................... 53
Figure 41. Permeability results for each curing treatment. .......................................................... 54
Figure 42. Surface images from 28-day samples for all curing methods. ................................... 56
Figure 43. Location of aggregate gradations on Shilestone coarseness factor chart. .................. 61
Figure 44. Location of sensors in instrumented beams. ............................................................... 62
Figure 45. Typical instrumented beams following casting. ......................................................... 62
Figure 46. Typical instrumented beams following casting. ......................................................... 63
Figure 47. Temperature and humidity data for Beam 1 of the PennDOT mix. ........................... 64
Figure 48. Temperature and humidity data for Beam 2 of the PennDOT mix. ........................... 65
Figure 49. Temperature and humidity data for Beam 3 of the PennDOT mix. ........................... 65
Figure 50. Temperature and humidity data for Beam 1 of the revised mix. ................................ 66
Figure 51. Temperature and humidity data for Beam 2 of the revised mix. ................................ 66
Figure 52. Temperature and humidity data for Beam 3 of the revised mix. ................................ 67
Figure 53. Drying shrinkage measured for the two mixes. .......................................................... 69
Figure 54. Relative humidity measured for the two mixes. ......................................................... 70
Figure 55. Difference in strain between the revised and PennDOT mixes. ................................. 71
1
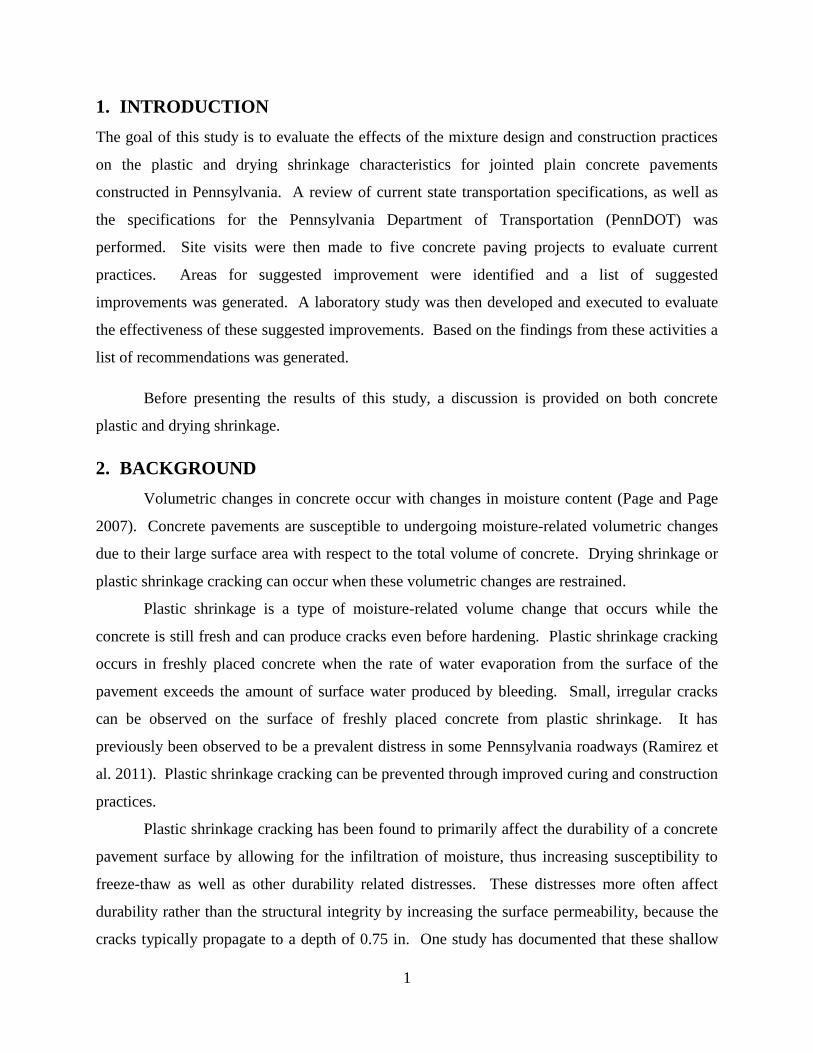
1. INTRODUCTION
The goal of this study is to evaluate the effects of the mixture design and construction practices
on the plastic and drying shrinkage characteristics for jointed plain concrete pavements
constructed in Pennsylvania. A review of current state transportation specifications, as well as
the specifications for the Pennsylvania Department of Transportation (PennDOT) was
performed. Site visits were then made to five concrete paving projects to evaluate current
practices. Areas for suggested improvement were identified and a list of suggested
improvements was generated. A laboratory study was then developed and executed to evaluate
the effectiveness of these suggested improvements. Based on the findings from these activities a
list of recommendations was generated.
Before presenting the results of this study, a discussion is provided on both concrete
plastic and drying shrinkage.
2. BACKGROUND
Volumetric changes in concrete occur with changes in moisture content (Page and Page
2007). Concrete pavements are susceptible to undergoing moisture-related volumetric changes
due to their large surface area with respect to the total volume of concrete. Drying shrinkage or
plastic shrinkage cracking can occur when these volumetric changes are restrained.
Plastic shrinkage is a type of moisture-related volume change that occurs while the
concrete is still fresh and can produce cracks even before hardening. Plastic shrinkage cracking
occurs in freshly placed concrete when the rate of water evaporation from the surface of the
pavement exceeds the amount of surface water produced by bleeding. Small, irregular cracks
can be observed on the surface of freshly placed concrete from plastic shrinkage. It has
previously been observed to be a prevalent distress in some Pennsylvania roadways (Ramirez et
al. 2011). Plastic shrinkage cracking can be prevented through improved curing and construction
practices.
Plastic shrinkage cracking has been found to primarily affect the durability of a concrete
pavement surface by allowing for the infiltration of moisture, thus increasing susceptibility to
freeze-thaw as well as other durability related distresses. These distresses more often affect
durability rather than the structural integrity by increasing the surface permeability, because the
cracks typically propagate to a depth of 0.75 in. One study has documented that these shallow

2
plastic shrinkage cracks can develop into full-depth fatigue cracks over time. This was observed
on I-80 in Clinton County, Pennsylvania (Ramirez et al. 2011). The plastic shrinkage cracks
reduce the effective thickness of the pavement and when they developed in the transverse
direction and in the middle third of the slab, some eventually developed into full-depth fatigue
cracks.
Both reversible and irreversible long-term drying shrinkage occurs in concrete
pavements. The irreversible drying shrinkage develops over the first 5 to 7 years after paving in
climates similar to Pennsylvania, while the reversible drying shrinkage is dictated by the
seasonal wetting/drying patterns (Nassiri et al. 2011). Throughout the life of the pavement, the
cyclic volumetric changes with changing moisture content are a function of the initial
irreversible, drying shrinkage. Stresses develop when these volumetric changes are restrained.
These slabs are restrained due to the friction between the slab and the supporting layer, tie and
dowel bars and the self-weight of the slab. The larger the drying shrinkage, the larger the
resulting stresses that develop do to these restraints.
As drying shrinkage occurs uniformly across the depth of the slab, contraction of the slab
is restrained and stresses develop at the bottom of the slab at mid-slab. It has been shown that
the moisture content in the upper 2 in of the slab fluctuates with the ambient relative humidity
and rain events. The middle portion of the slab has a relative humidity of approximately 85
percent while the bottom of the pavement is saturated (Janssen 1986). This moisture gradient
through the depth of the slab causes upward curvature. This curvature is restrained due to the
self-weight of the slab, thereby causing tensile stresses to generate at the top of the slab at
midslab. The magnitude of the drying shrinkage that develops is a function of both the concrete
mixture design and the curing conditions (Mindess et al. 2003).
2.1.Contributing Factors
2.1.a. Plastic shrinkage cracking
Plastic shrinkage cracking occurs in fresh concrete pavements, most often from excessive surface
evaporation when the evaporation rate exceeds the rate of bleed water rising to the pavement
surface. This surface evaporation causes the formation of menisci within the paste as previously
filled capillaries begin to drain. A capillary pressure arises as a result of the formation of the
menisci, which ultimately leads to contraction of the paste. The increasing build-up of pressure
reaches a critical point at which the unevenly distributed water rearranges itself to form distinct

3
areas of voids and water (Mindess et al 2003). Typical plastic shrinkage cracking on the surface
of the pavement is shown in Figure 1.
Figure 1. Typical plastic shrinkage cracking (Kostmatka 2002).
Plastic shrinkage cracking is frequently associated with hot weather paving due to the
accelerated evaporation rate produced by high ambient temperatures. However, there are four
primary climatic conditions that increase the rate of evaporation from the surface and thus the
potential for plastic shrinkage cracking (Kostmatka 2002):
1) High air temperature
2) High concrete temperature
3) Low relative humidity
4) High air speed
The nomograph provided in Figure 2 is commonly used to estimate the rate of evaporation.

4
Figure 2. Relationship between air temperature, concrete temperature, wind velocity, and
relative humidity to the rate of evaporation from a concrete surface (Kostmatka 2002).
This nomograph is based on the relationship developed by Menzel (1954) and is described by the
following equation:
𝐸 = (𝑇𝑐2.5 − 𝑟𝑇𝑎
2.5)(1 + 0.4𝑉) × 10−6 Equation 1.
Where,
𝐸= rate of evaporation on concrete surface, lb/ft2/hr
𝑇𝑐= concrete temperature, F
𝑟= relative humidity, percent
𝑇𝑎= ambient air temperature, F
𝑉= wind velocity, mph
This relationship provides insight into the variability of surface evaporation based on external
paving conditions, such as climate and environment. Typical weather data for the Pittsburgh
area is summarized in Table 1. The climatic data was obtained from
5
http://www.weather.com/weather/wxclimatology/monthly/USPA1290 (accessed November
2013) and the wind speed data from
http://www.windpoweringamerica.gov/images/windmaps/pa_80m.jpg (accessed November
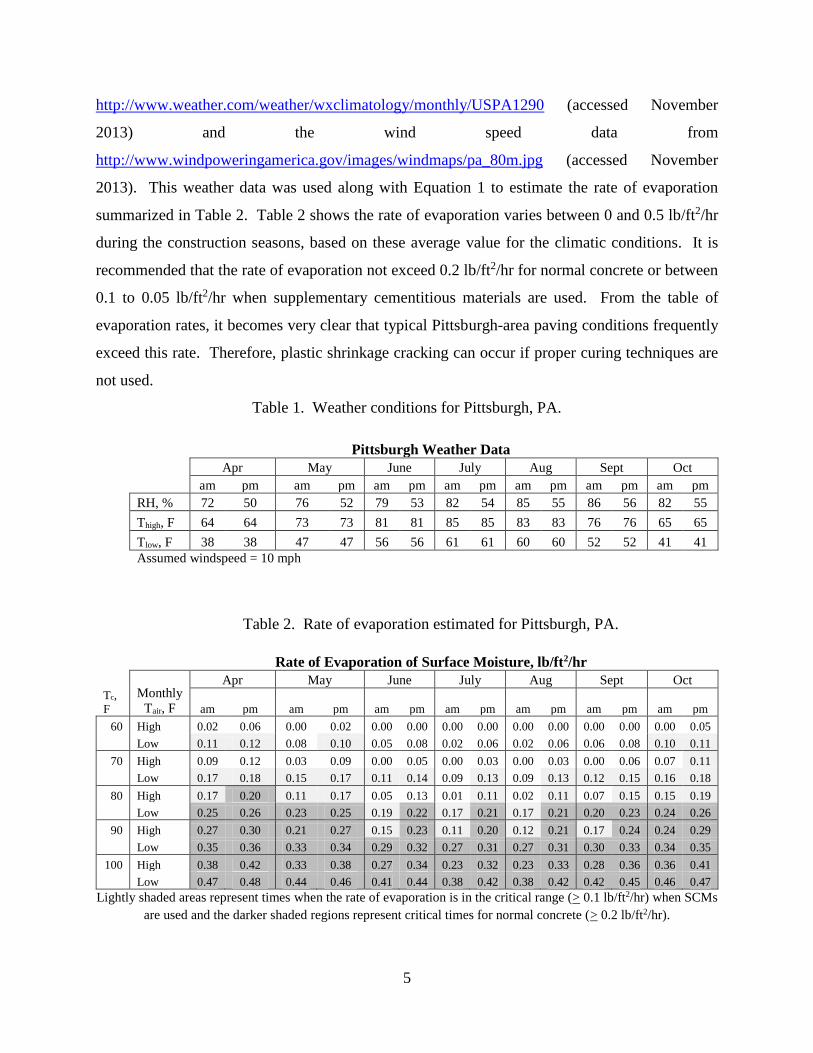
2013). This weather data was used along with Equation 1 to estimate the rate of evaporation
summarized in Table 2. Table 2 shows the rate of evaporation varies between 0 and 0.5 lb/ft2/hr
during the construction seasons, based on these average value for the climatic conditions. It is
recommended that the rate of evaporation not exceed 0.2 lb/ft2/hr for normal concrete or between
0.1 to 0.05 lb/ft2/hr when supplementary cementitious materials are used. From the table of
evaporation rates, it becomes very clear that typical Pittsburgh-area paving conditions frequently
exceed this rate. Therefore, plastic shrinkage cracking can occur if proper curing techniques are
not used.
Table 1. Weather conditions for Pittsburgh, PA.
Pittsburgh Weather Data
Apr May June July Aug Sept Oct
am pm am pm am pm am pm am pm am pm am pm
RH, % 72 50 76 52 79 53 82 54 85 55 86 56 82 55
Thigh, F 64 64 73 73 81 81 85 85 83 83 76 76 65 65
Tlow, F 38 38 47 47 56 56 61 61 60 60 52 52 41 41
Assumed windspeed = 10 mph
Table 2. Rate of evaporation estimated for Pittsburgh, PA.
Rate of Evaporation of Surface Moisture, lb/ft2/hr
Monthly
Tair, F
Apr May June July Aug Sept Oct Tc,
F am pm am pm am pm am pm am pm am pm am pm
60 High 0.02 0.06 0.00 0.02 0.00 0.00 0.00 0.00 0.00 0.00 0.00 0.00 0.00 0.05
Low 0.11 0.12 0.08 0.10 0.05 0.08 0.02 0.06 0.02 0.06 0.06 0.08 0.10 0.11
70 High 0.09 0.12 0.03 0.09 0.00 0.05 0.00 0.03 0.00 0.03 0.00 0.06 0.07 0.11
Low 0.17 0.18 0.15 0.17 0.11 0.14 0.09 0.13 0.09 0.13 0.12 0.15 0.16 0.18
80 High 0.17 0.20 0.11 0.17 0.05 0.13 0.01 0.11 0.02 0.11 0.07 0.15 0.15 0.19
Low 0.25 0.26 0.23 0.25 0.19 0.22 0.17 0.21 0.17 0.21 0.20 0.23 0.24 0.26
90 High 0.27 0.30 0.21 0.27 0.15 0.23 0.11 0.20 0.12 0.21 0.17 0.24 0.24 0.29
Low 0.35 0.36 0.33 0.34 0.29 0.32 0.27 0.31 0.27 0.31 0.30 0.33 0.34 0.35
100 High 0.38 0.42 0.33 0.38 0.27 0.34 0.23 0.32 0.23 0.33 0.28 0.36 0.36 0.41
Low 0.47 0.48 0.44 0.46 0.41 0.44 0.38 0.42 0.38 0.42 0.42 0.45 0.46 0.47
Lightly shaded areas represent times when the rate of evaporation is in the critical range (> 0.1 lb/ft2/hr) when SCMs
are used and the darker shaded regions represent critical times for normal concrete (> 0.2 lb/ft2/hr).

6
Proper construction and curing practices help reduce the effects of the climate on the rate
of evaporation of surface moisture. The timely application of a curing compound allows for the
retention of moisture while the concrete hardens. It is critical to apply the curing compound just
after the sheen evaporates from the surface. The curing operation should be within 100 ft behind
the paving operation and it is essential that the curing compound be of high quality so an
impermeable membrane is created.
2.1.b. Drying shrinkage
External moisture exposure is a key contributing factor for the development of drying shrinkage.
This is largely a function of the climatic factors (ambient air temperature, relative humidity,
frequency and duration of rain events and wind speed), which cannot be controlled. However,
the largest controllable factor that contributes to drying shrinkage in concrete pavements is the
water and paste content. The relationship between drying shrinkage and total water content is
shown in Figure 3 below (Kostmatka 2002). Figure 3 shows that a greater amount of drying
shrinkage occurs when the water content is higher.
Figure 3. Effect of water content of concrete mix on drying shrinkage.
The aggregate does not experience shrinkage and acts to physically restrain shrinkage.
Therefore, the shrinkage of the concrete is a function of the paste content. By decreasing the
cement, which also results in an increase in the aggregate content, the drying shrinkage
7
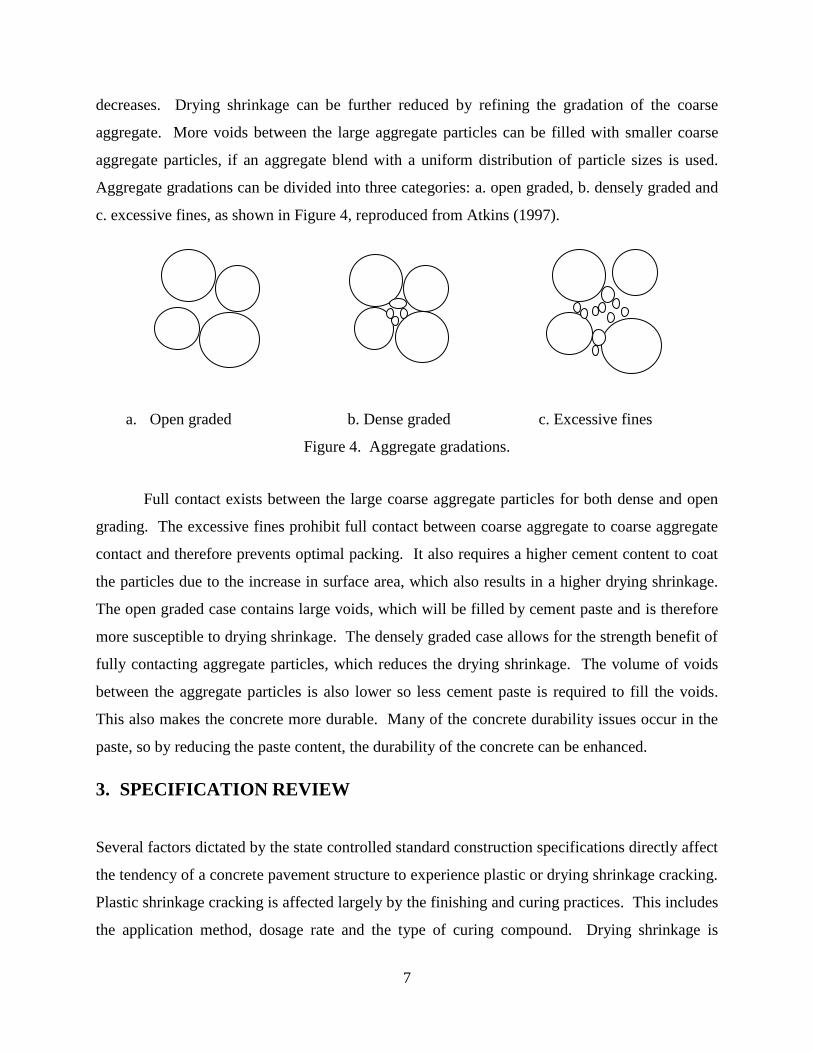
decreases. Drying shrinkage can be further reduced by refining the gradation of the coarse
aggregate. More voids between the large aggregate particles can be filled with smaller coarse
aggregate particles, if an aggregate blend with a uniform distribution of particle sizes is used.
Aggregate gradations can be divided into three categories: a. open graded, b. densely graded and
c. excessive fines, as shown in Figure 4, reproduced from Atkins (1997).
a. Open graded b. Dense graded c. Excessive fines
Figure 4. Aggregate gradations.
Full contact exists between the large coarse aggregate particles for both dense and open
grading. The excessive fines prohibit full contact between coarse aggregate to coarse aggregate
contact and therefore prevents optimal packing. It also requires a higher cement content to coat
the particles due to the increase in surface area, which also results in a higher drying shrinkage.
The open graded case contains large voids, which will be filled by cement paste and is therefore
more susceptible to drying shrinkage. The densely graded case allows for the strength benefit of
fully contacting aggregate particles, which reduces the drying shrinkage. The volume of voids
between the aggregate particles is also lower so less cement paste is required to fill the voids.
This also makes the concrete more durable. Many of the concrete durability issues occur in the
paste, so by reducing the paste content, the durability of the concrete can be enhanced.
3. SPECIFICATION REVIEW
Several factors dictated by the state controlled standard construction specifications directly affect
the tendency of a concrete pavement structure to experience plastic or drying shrinkage cracking.
Plastic shrinkage cracking is affected largely by the finishing and curing practices. This includes
the application method, dosage rate and the type of curing compound. Drying shrinkage is

8
affected by many factors, both regarding mix design and construction. The most prominent
factors include the water/cement ratio, paste content and the coarse aggregate gradation.
State specifications that dictate mixture design, construction practices and curing have an
effect on both plastic shrinkage and drying shrinkage cracking and were reviewed. Trends are
discussed and a complete summary table of specification information is given in the Appendix.
The mixture design and curing practices will be assessed separately.
3.1 Mixture Design
As previously discussed, the mixture design can also exacerbate the effect of plastic and drying
shrinkage. Drying shrinkage occurs as a result of a mechanism occurring in the paste only.
Therefore, by reducing the paste content, a reduction in drying shrinkage should logically follow.
The water-to-cement (w/c) ratio of a concrete mix, dictated by state specifications, would have a
potentially large impact on the development of drying shrinkage. Across states, the water
cement ratio ranged from a low of 0.40 to a high of 0.53. At present, the Pennsylvania DOT
dictates a maximum w/c ratio of 0.47.
Additional mix design considerations were compared across states including slump,
maximum cement content, air entraining, and required 28-day strength. Table 3 below gives
average values across the states for these factors along with the values given in PennDOT
Publication 408. A full summary of other state specifications included in the specification
review is provided in Table A in the Appendix.
Table 3. Specification review of concrete mix design parameters.
Criteria National Average Maximum Minimum Pennsylvania
Max. w/c ratio 0.47 0.53 0.40 0.47
Slump, in <2.5 2.5 to 4.5 <1 <5
Air entraining 4% to 7% 5.5% to 8% 2.5% to 5.5% 4.5% to 7.5%
Min.28-day
compressive
strength
3600 psi 4500 psi 3000 psi 3500 psi
Max. cement
content
730 lb/cyd 850 lb/cyd 600 lb/cyd 752 lb/cyd

9
As can be seen from Table 3, there is significant variability in the criteria used across the
country. Despite the fact that PennDOT has a w/c ratio equal to the national average, it is still
relatively high, especially considering the many benefits from lowering the w/c ratio with regard
to drying and plastic shrinkage cracking and overall durability. A lower w/c ratio is also desired
when the concrete will be exposed to freezing and thawing in a moist condition or deicer
chemicals. The lowest w/c ratio of less than 0.40 was specified by the Minnesota DOT. Similar
benefits are provided by minimizing the cement content. As shown in Table 3, the maximum
cement content for PennDOT is slightly above the national average.
The Minnesota DOT sponsors an incentive/disincentive program for concrete pavement
construction to ensure quality performance. Following on-site testing, a monetary incentive or
disincentive is assigned to the project cost. These w/c ratio payment incentives and disincentives
are given in Table 4 below (reproduced from MnDOT Table 2301-8, Standard Specification). It
can be seen from this table that adjustments to the price per cubic yard can be between - $3.00
and + $3.00 per cubic yard.
Table 4. Minnesota DOT Incentive/Disincentive program for w/c ratio.
W/c ratio Pavement incentive or
disincentive per cubic yard
≤0.37 + $3.00
0.38 + $1.75
0.39 + $0.50
0.40 $0.00
0.41 - $0.50
0.42 - $1.75
0.43 - $3.00
≥0.44 Determined by the concrete
engineer
Another important aspect of the mix design is the cement content. Using an insufficient
amount of cement will result in inadequate strengths but using an excessively high cement

10
content increases the shrinkage and decreases the overall durability of the concrete. Typically
when developing a mix design, the water content is selected to achieve the desired workability
and then the cement content is established such that the maximum allowable w/c ratio is met.
Consideration should also be given to limiting the cement content to minimize drying shrinkage
and maximize durability so that the cement content is limited to only that necessary to coat the
aggregate particles such that sufficient workability is achieved.
In addition to the w/c ratio and the cement content, consideration should be given to the
coarse aggregate gradation. Many states simply suggest ranges for a standard aggregate
gradation. The required gradations for several states, including Pennsylvania, are provided in
Table 5. Pennsylvania, as well as some other states, specify the American Association of State
Highway Transportation Officials (AASHTO) No. 57 aggregate gradation. Other states consider
this to be too open-graded and prescribe a more densely graded aggregate.
Table 5. Coarse aggregate gradations from selected state construction specifications, given as
percent passing.
Sieve VA CA WA IL MN PA
1 ½ in 100 100 99-100 100 100 100
1 ¼ in 95-100
1 in 95-100 90-100 95-100 90-100 95-100
¾ in 55-100 55-85
½ in 25-60 25-60 30-60 25-60
3/8 in 45-75 20-45
No. 4 0-10 35-60 0-10 0-10 0-7 0-10
No. 8 0-5 27-45 0-5 0-5
It can be seen that the use of the AASHTO No 57 gradation can potentially allow for up
to 60 percent of very similarly sized aggregates. Allowing the removal of the material between
the No. 4 sieve and the fines results in a gap graded mix that will require a higher paste content

11
to achieve the desired workability. It will also be more susceptible to segregation. To eliminate
the potential of having a gap graded aggregate, the Minnesota DOT narrowed the ranges of the
acceptable aggregate gradations. In addition, incentives are provided for aggregate gradations
that are even more densely graded. While the standard coarse aggregate gradation requirement is
included in Table 5, gradations defining this incentive are shown in Table 6.
Table 6. Minnesota DOT incentive coarse aggregate gradations.
Sieve Size
Option 1: +
$0.50 per cubic
yard, %
Option 2: +
$2.00 per cubic
yard
2 in 0% 0%
1 ½ in ≤9 % ≤9 %
1 in 7-18% 8-18%
¾ in 7-18% 8-18%
½ in 7-18% 8-18%
3/8 in 7-18% 8-18%
No 4. 7-18% 8-18%
No. 8 7-18% 8-18%
No. 16 7-18% 8-18%
No. 30 7-18% 8-18%
No. 50 ≤13 % ≤13 %
No. 100 ≤8 % ≤8 %
No. 200 ≤8 % ≤8 %
From Table 6, it can be seen that upwards of a $2.00 per cubic yard incentive can be paid.
No other state was found to have such an incentive program or such an even aggregate gradation
recommendation. This kind of incentive and suggested gradation would greatly contribute to

12
achieving a dense aggregate gradation and would help to prevent the occurrence of excessive
drying shrinkage and segregation.
3.2 Finishing and Curing
Curing practices for pavements are used to retain as much moisture as possible in the pavement.
A curing practice is generally considered effective if it is able to retain the surface moisture
above 80 percent relative humidity for seven days following construction to ensure full hydration
(Kostmatka 2002). Finishing and curing practices are known to affect both plastic shrinkage
cracking. The finishing and curing practices for several states have been collected and are
synthesized in Table B of the Appendix. Several of these components of the finishing and curing
practices will now be discussed.
Curing is performed after finishing of the concrete pavement surface. The most common
texturing among the states consisted of a combination of dragging burlap for providing micro
texture followed by tining or grooving for providing macro texture. Some states use an astrotruf
drag for providing micro texture. Most generally, curing practices were recommended to begin
following texturing and immediately after all free water has left the surface of the pavement.
This is often assumed to occur within 30 minutes after finishing but will be a function of the
mixture design and the ambient climatic conditions.
The recommendations for types of curing varied by state and acceptable methods of
curing include using water, wet burlap, white polyethylene sheeting, wet cotton, waterproof
paper, blankets, and a liquid membrane-forming concrete curing compound. The economics,
availability and ease of application of liquid membrane forming curing compounds (They can be
applied and do not require retrieval, unlike sheeting or blankets.) contributes to the popularity of
the liquid membrane-forming concrete curing compound among state specifications. The curing
compound application rate also varied between 1 gallon per 100 ft2 to 1 gallon per 200 ft2. The
most commonly recommended application rate was 1 gallon per 150 ft2 of concrete pavement.
This is the target curing application rate recommended by the Pennsylvania DOT standard
specification as well.
The method by which the liquid membrane curing compound was applied was extremely
consistent between states. It was important that the sprayers be mechanical, with an atomizing
nozzle (to ensure complete and uniform coverage) and that the tank have an agitator. Some
13
states also required an operational pressure gage and the ability to control the application
pressure. Almost all states only permitted hand spraying for irregular pavement sections with
odd widths and shapes. Pennsylvania’s requirements remained consistent here and included
requiring mechanical atomizing sprayers and allowing hand-spraying only for irregular sections,
although the site visits revealed that hand-spraying was commonly performed on mainline
paving as well.
States which specified a type of liquid membrane curing compound required those which
fulfilled the requirements outlined by the AASHTO M 148 specification (superseded by ASTM
C309). States required at least Type 1-D (clear with fugitive dye) or Type 2 (white pigmented).
It was more common for states to require Type 2 (white pigmented) curing compound. Two
classes of curing compounds exist within Type 2: Class A (any white pigmented curing
compound including wax-base) and Class B (curing compounds with a resin-base). Only
California, Idaho, Connecticut, Minnesota, North Dakota, Utah and Wyoming require
exclusively Type 2 Class B (resin based) curing compounds. The Pennsylvania DOT requires a
Type 1D or Type 2 curing compound. Additionally, several states had additional requirements
outside of the listed AASHTO M 148/ASTM C309 requirements, as discussed below.
General requirements are specified such that Type 1-D contains enough fugitive dye such
that it can be distinguished from the concrete surface for at least 4 hours following application
but no more than 7 days. Type 2, however, requires a uniform white appearance and the
formation of a continuous white film when applied. Several properties of the curing compounds
are specified by the ASTM C309 specification and include water loss, reflectance, drying time,
long-term settling, and nonvolatile content. The specification also dictates that liquid membrane
curing compounds should be stored for a maximum of 6 months.
Moisture loss testing indicates the effectiveness of a curing compound to retain moisture
within the specimen and can be measured in accordance with ASTM C156 procedure. The
ASTM C309 specification requires that water loss should be restricted to less than 2.79 lb/ft2 in
72 hours. Reflectance indicates the amount of light that is reflected from a surface treated with
the curing compound. A higher reflectance indicates less absorbed light (and consequently,
heat), which would impact curing. This property is measured through ASTM E1347 and must be
greater than 60 percent, according to ASTM C309. Drying time only indicates the duration of
time required for a curing compound to dry on the surface of the pavement, and is required to be

14
less than 4 hours. This ensures that the compound is dry before the final set of the concrete
occurs when the surface would be exposed to any traffic or contact. Long-term settling is
assessed to insure the curing compound can be stored for six months and then be re-agitated into
a homogenous solution with minimal settling of the solids. This property is tested in accordance
with ASTM D 1309 and all curing compounds must pass this test. Finally, the non-volatile
content must be measured because a high concentration of volatile content (VOC) can cause
respiratory problems (Kostmatka 2002). The VOC is monitored by the Environmental
Protection Agency (EPA), which has established a maximum allowable VOC of 2,620 oz/gal for
curing compounds when tested in accordance to ASTM D 2369. These testing requirements and
target values are summarized in Table 7.
Table 7. ASTM C309 specifications for liquid membrane forming curing compounds.
Property Required Test Required Value
Water Loss ASTM C156 2.79 lb/ft2
Reflectance ASTM E1347 >60%
Drying Time ASTM C309 < 4 hours
Long-Term Settling ASTM D1309 Pass
Non-volatile Content ASTM D2369 < 2,620 oz/gal
Some states have added additional requirements outside of the testing requirements
outlined in ASTM C309 for liquid membrane forming curing compounds. These states include
Minnesota, New York, North Dakota, and Ohio. Their additional requirements beyond the
requirements outlined in ASTM C309 are given in Table 8 below. Some states not only dictate
the minimum percent solid but also dictate that the resin must by poly alpha methylstyrene
(AMS). This would include California, Minnesota and Utah.
Table 8. Specific curing compound characteristics for select states.
State Minimum
solids
Water Retention Reflectance Settling Rate
Minnesota > 42% 0.73 lb/ft2 at 24 hrs
1.96 lb/ft2 at 72 hrs
> 65% 0.02 oz / 1 oz in 2
hrs
North
Dakota
42% 0.73 lb/ft2 at 24 hrs
1.96 lb/ft2 at 72 hrs
> 65% 0.02 oz / 1 oz in 2
hrs
Ohio 25% 0.73 lb/ft2 at 24 hrs
1.96 lb/ft2 at 72 hrs
> 65% > 4.9 oz in 2 hours
but < 4.23 oz in 24
hours
15
The Pennsylvania specifications could be improved by including requirements for percent solids,
water retention, reflectance, and settling rate. However, as shown by Vandenbossche (1999),
several factors can critically affect the application rate of a curing compound including the
presence of tining as well as the nozzle spacing and the height above the pavement. Therefore,
both the specification and the implementation is critical for obtaining a good cure.
4. SITE VISITS
In order to observe construction practices and procedures, several site visits were conducted
throughout western Pennsylvania. Construction practices, and curing procedures were observed
and documented for each site visit and a summary of the observations is provide below.
4.1 I-79 South Section 20-H, Washington County, PA
The first site visit took place on June 5, 2013 and was a ramp paving project off of I-79 at the I-
70/I-79 interchange in Washington County, Pennsylvania. Paving conditions were sunny and
warm and work began at 7:00 AM. The project involved placing 12 in of Portland cement
concrete (PCC) over 4 in of concrete stabilized base. The concrete arrived on site with a 1 in
slump, which is appropriate for slip-form paving.
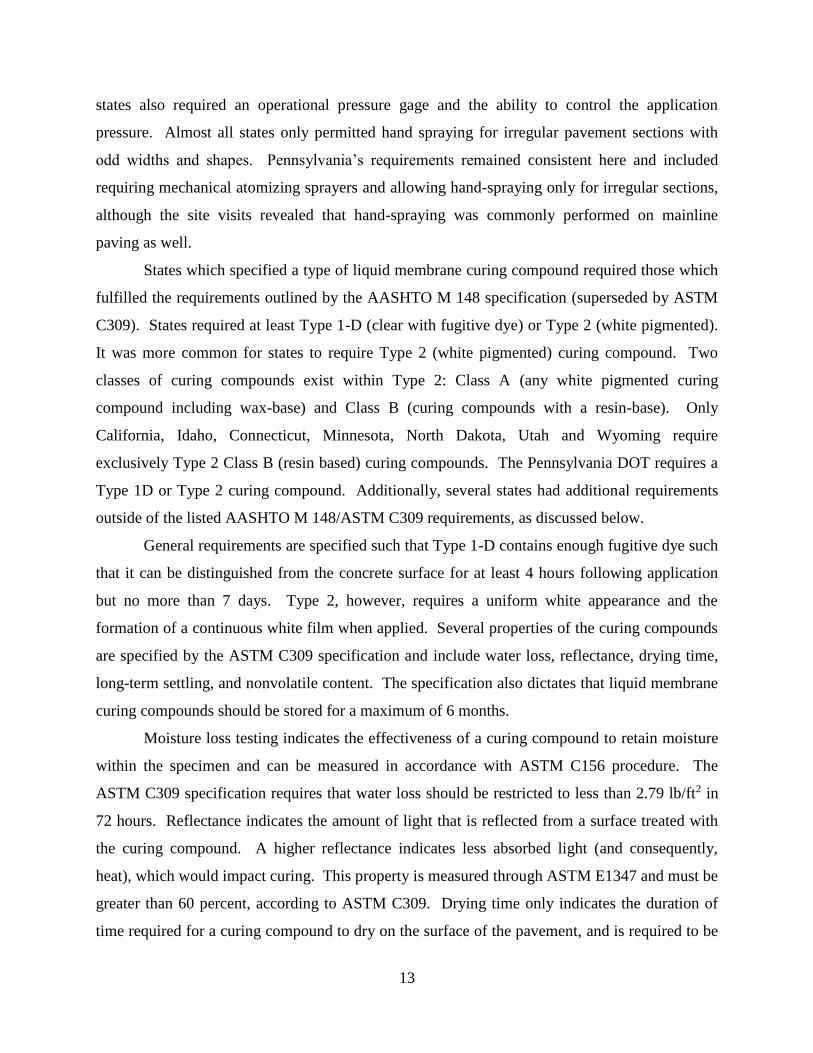
The paving procedure was generally smooth and the main paving equipment used a GPS
system rather than a stringline for alignment. The paving machine, however, lacked an auger-
style placer in the front of the paver and instead had a sliding drum, which caused the concrete to
mound at the edges of the pavement. A wet burlap was attached to the back of the paver for
texturing. The burlap appeared to be consistently (but not excessively) wet. It is not know why
the burlap texture was applied since floats were used behind the burlap, which removed any
texture provided by the burlap, as shown in Figure 5. The finishing was followed by hand-tining
with a rake.
16
Figure 5. Wet burlap drag for texturing following finishing.
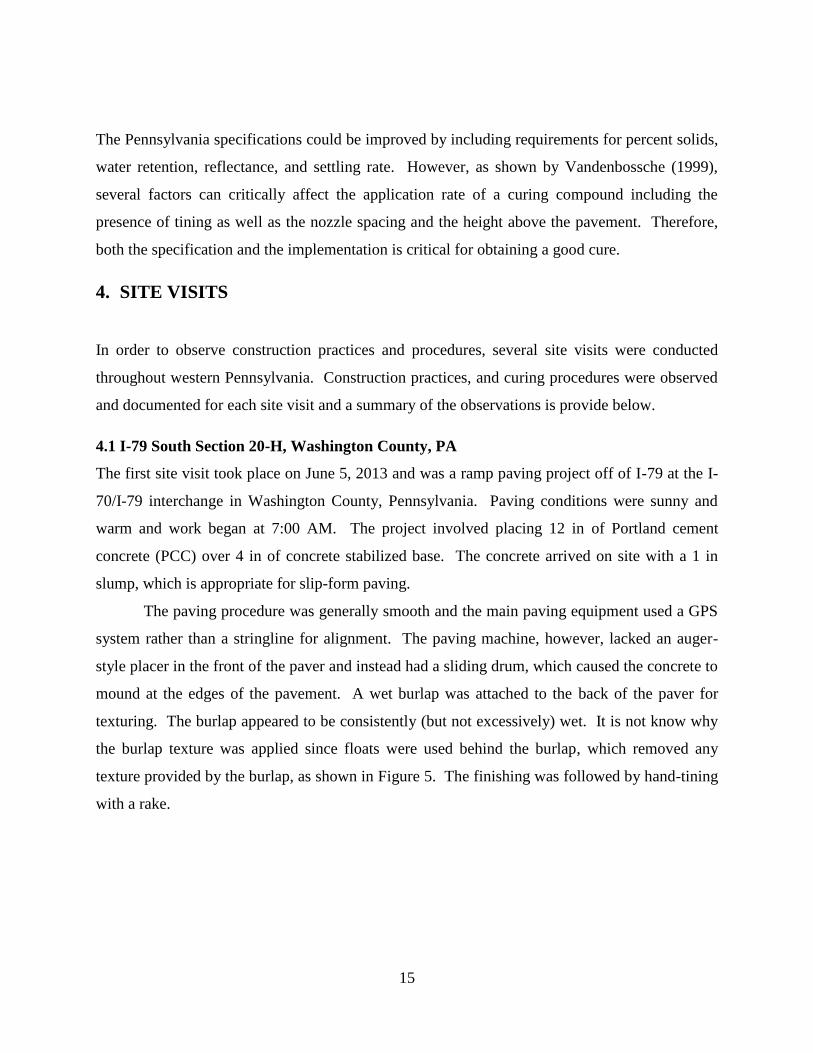
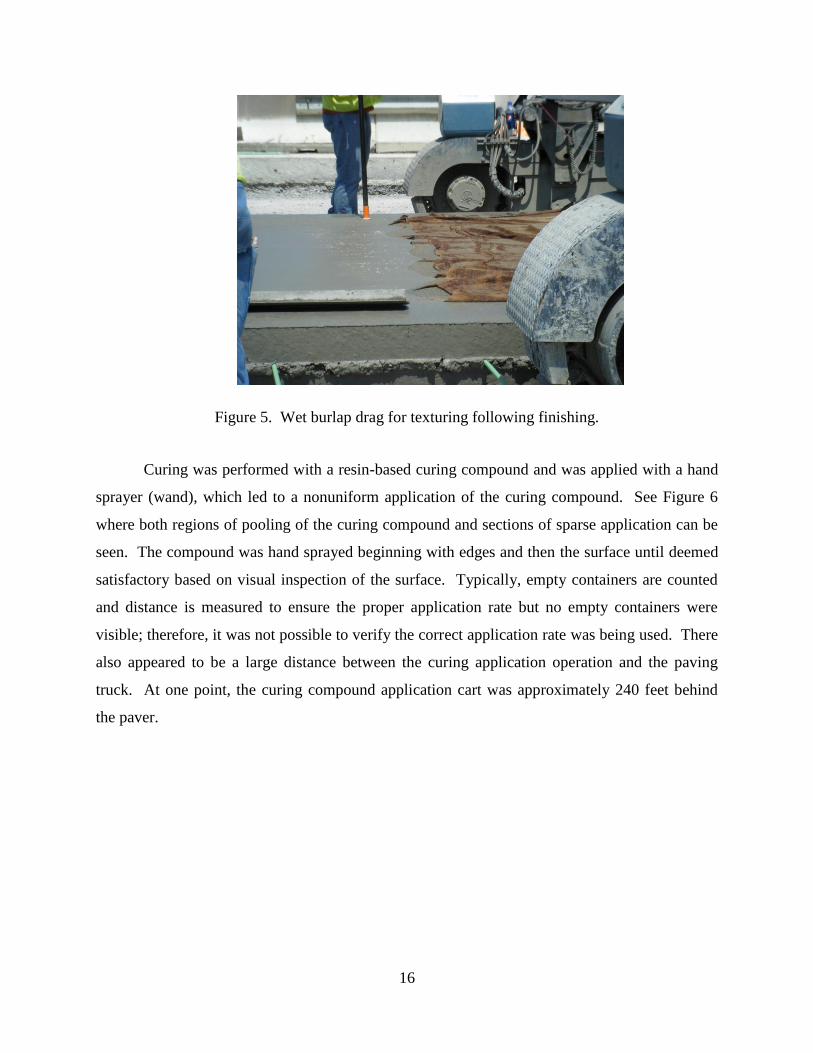
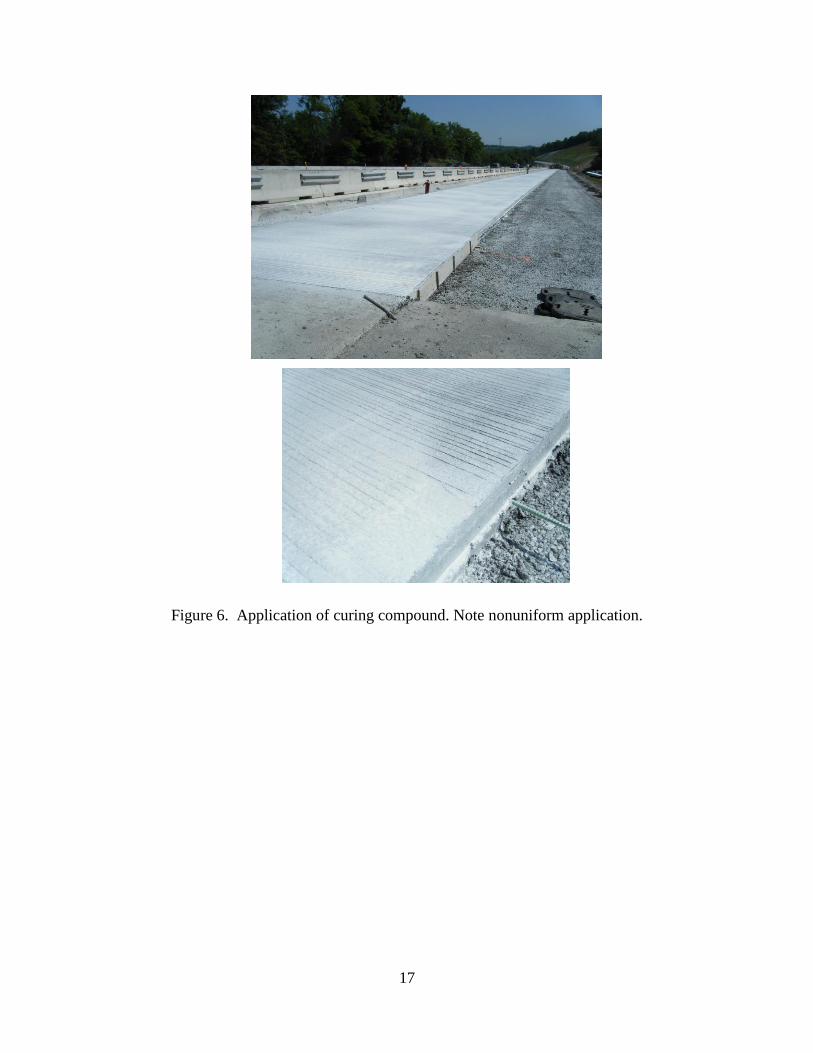
Curing was performed with a resin-based curing compound and was applied with a hand
sprayer (wand), which led to a nonuniform application of the curing compound. See Figure 6
where both regions of pooling of the curing compound and sections of sparse application can be
seen. The compound was hand sprayed beginning with edges and then the surface until deemed
satisfactory based on visual inspection of the surface. Typically, empty containers are counted
and distance is measured to ensure the proper application rate but no empty containers were
visible; therefore, it was not possible to verify the correct application rate was being used. There
also appeared to be a large distance between the curing application operation and the paving
truck. At one point, the curing compound application cart was approximately 240 feet behind
the paver.
17
Figure 6. Application of curing compound. Note nonuniform application.

18
4.2 Warrington Avenue, Allentown, PA
The second site visit occurred on June 6, 2013 and was a project located on Warrington Avenue
in the neighborhood of Allentown in Pittsburgh, Pennsylvania. This project was a cooperative
effort between the city of Pittsburgh and the Port Authority. Paving conditions were sunny and
warm. This project was unusual as it involved placing 4 in of concrete on a base prepared to
support the above-ground portion of the Pittsburgh subway system. The concrete mix contained
fibers. The concrete was placed and a roller screed was used to strike off the top of the pavement
surface flush with the top of the form, as shown in Figure 7. The finishing was performed using
hand trowels, as seen in Figure 7. The concrete pavement was then cured using white
polyethylene sheeting, as shown in Figure 8.
Figure 7. Striking off the concrete and hand finishing.

19
Figure 8. White polyethylene sheet used for curing the roadway section.
4.3 Route 119-South Section 10K, Fayette County, PA
The third site visit occurred on August 1, 2013 on 119-South at Section 10K. The paving was
being performed at the County Line Bridge in Fayette County, Pennsylvania. Paving conditions
were warm (approximately 75 oF) and cloudy. This section was to be paved at night; therefore,
paving began at 7:00 PM and continued until approximately 6:00 AM the next morning. The
project included an 11-in PCC placed over a 4-in bituminous treated base over 6 in of subbase.
The concrete was provided by two different plants to meet the supply demands required
to keep the paver moving at a constant rate since both traffic lanes and a shoulder were being
placed for a total paving width of 32 ft. The paving was fixed-form and a stringline was used to
align the work bridges that ran on top of the forms. A bridge paver with an auger mounted on
the front to move the concrete horizontally along the front of the paver was used. It also
contained vibrators and a roller screed for finishing the surface of the pavement off flush with the
top of the form. A super smoother is mounted on the back of the paver. See Figure 9. Manual
hand finishing of the edges was performed before the passing of the first work bridge. This was
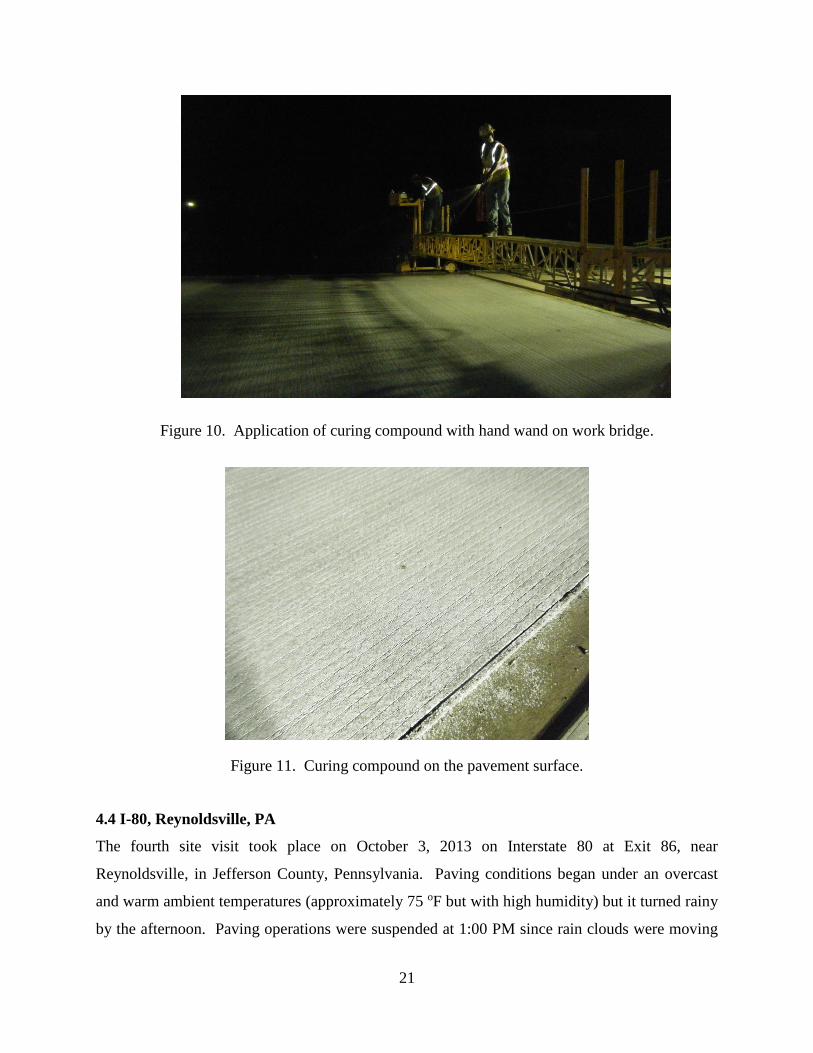
followed by the passing of two work bridges: the first used for hand finishing and tining and the
second work bridge was used for applying the curing compound using a hand wand, as shown in
Figure 10.

20
.
Figure 9. Paving placement equipment.
There was approximately 50 feet between the initial paving operations and the final curing
work bridge. The curing compound was a white pigmented wax-based curing compound. The
curing compound was applied manually with a hand wand and a relatively uniform coverage was
achieved. Empty containers were counted per distance to ensure an application rate of
approximately 150 square feet per gallon. The second work bridge, used for tining and the
application of the curing compound can be seen in Figure 10 and the final surface is shown in
Figure 11.
21
Figure 10. Application of curing compound with hand wand on work bridge.
Figure 11. Curing compound on the pavement surface.
4.4 I-80, Reynoldsville, PA
The fourth site visit took place on October 3, 2013 on Interstate 80 at Exit 86, near
Reynoldsville, in Jefferson County, Pennsylvania. Paving conditions began under an overcast
and warm ambient temperatures (approximately 75 oF but with high humidity) but it turned rainy
by the afternoon. Paving operations were suspended at 1:00 PM since rain clouds were moving
22
into the area. This project consisted of placing 14 in of PCC on a dense cement stabilized base
over 2 feet of undercut rock.
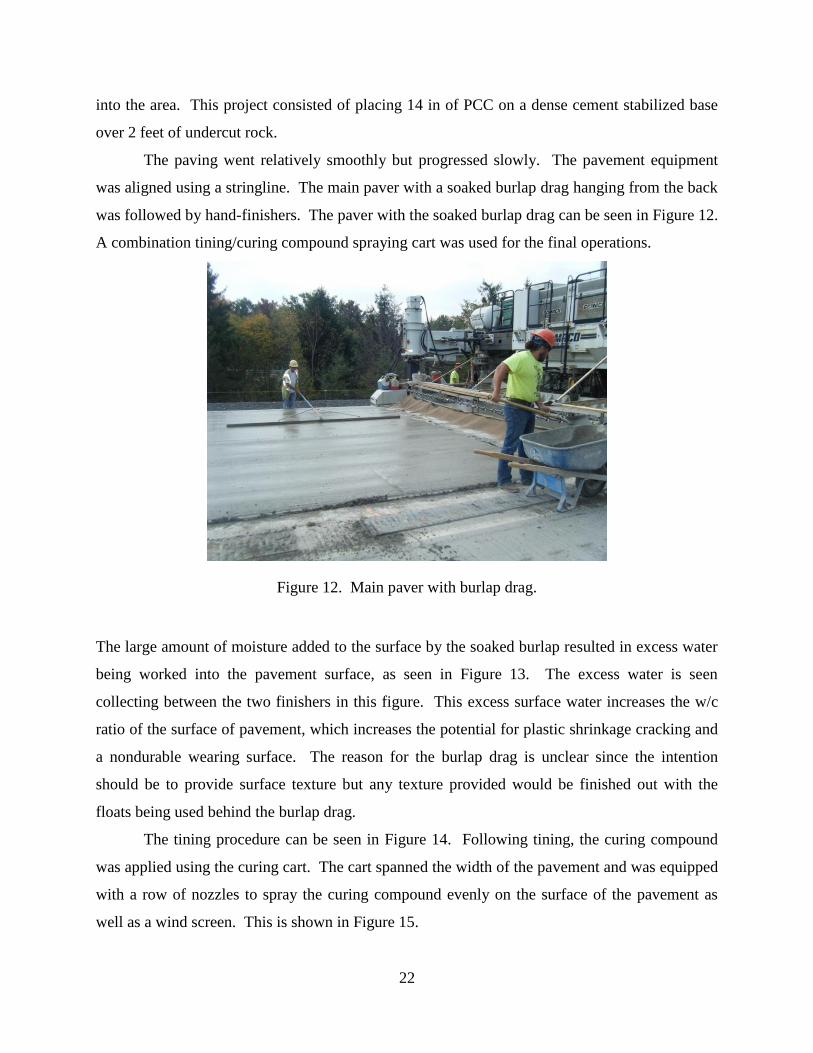
The paving went relatively smoothly but progressed slowly. The pavement equipment
was aligned using a stringline. The main paver with a soaked burlap drag hanging from the back
was followed by hand-finishers. The paver with the soaked burlap drag can be seen in Figure 12.
A combination tining/curing compound spraying cart was used for the final operations.
Figure 12. Main paver with burlap drag.
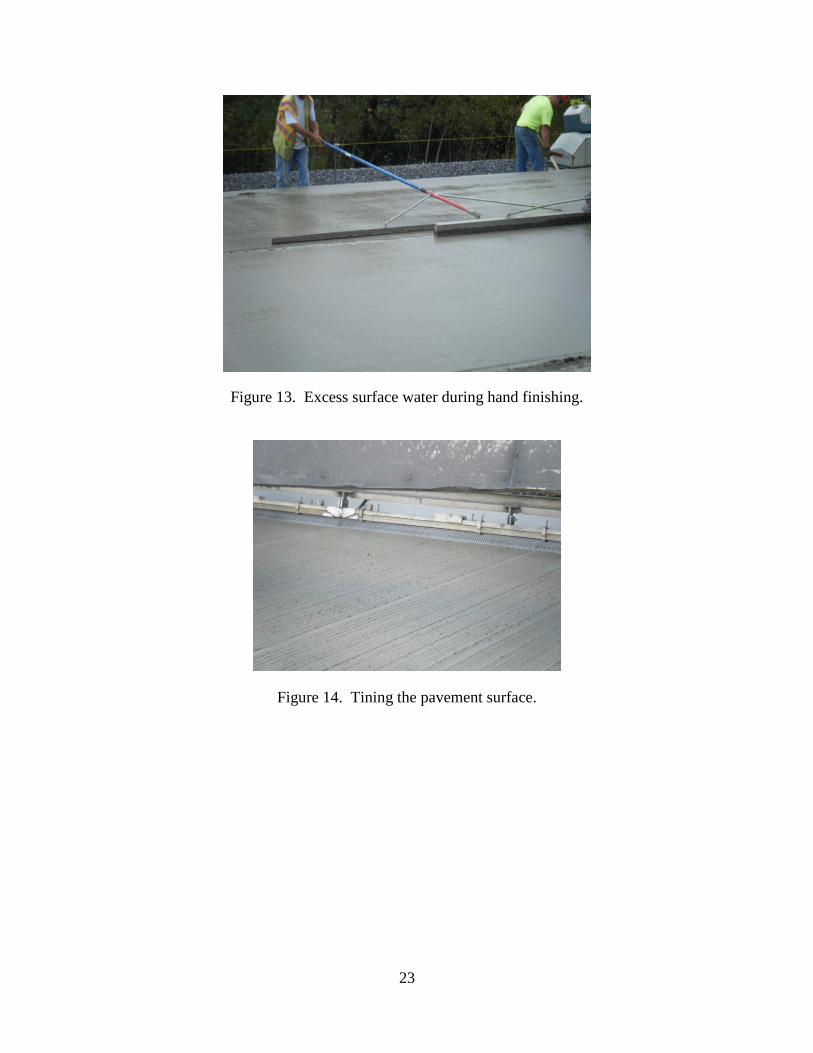
The large amount of moisture added to the surface by the soaked burlap resulted in excess water
being worked into the pavement surface, as seen in Figure 13. The excess water is seen
collecting between the two finishers in this figure. This excess surface water increases the w/c
ratio of the surface of pavement, which increases the potential for plastic shrinkage cracking and
a nondurable wearing surface. The reason for the burlap drag is unclear since the intention
should be to provide surface texture but any texture provided would be finished out with the
floats being used behind the burlap drag.
The tining procedure can be seen in Figure 14. Following tining, the curing compound
was applied using the curing cart. The cart spanned the width of the pavement and was equipped
with a row of nozzles to spray the curing compound evenly on the surface of the pavement as
well as a wind screen. This is shown in Figure 15.
23
Figure 13. Excess surface water during hand finishing.
Figure 14. Tining the pavement surface.
24
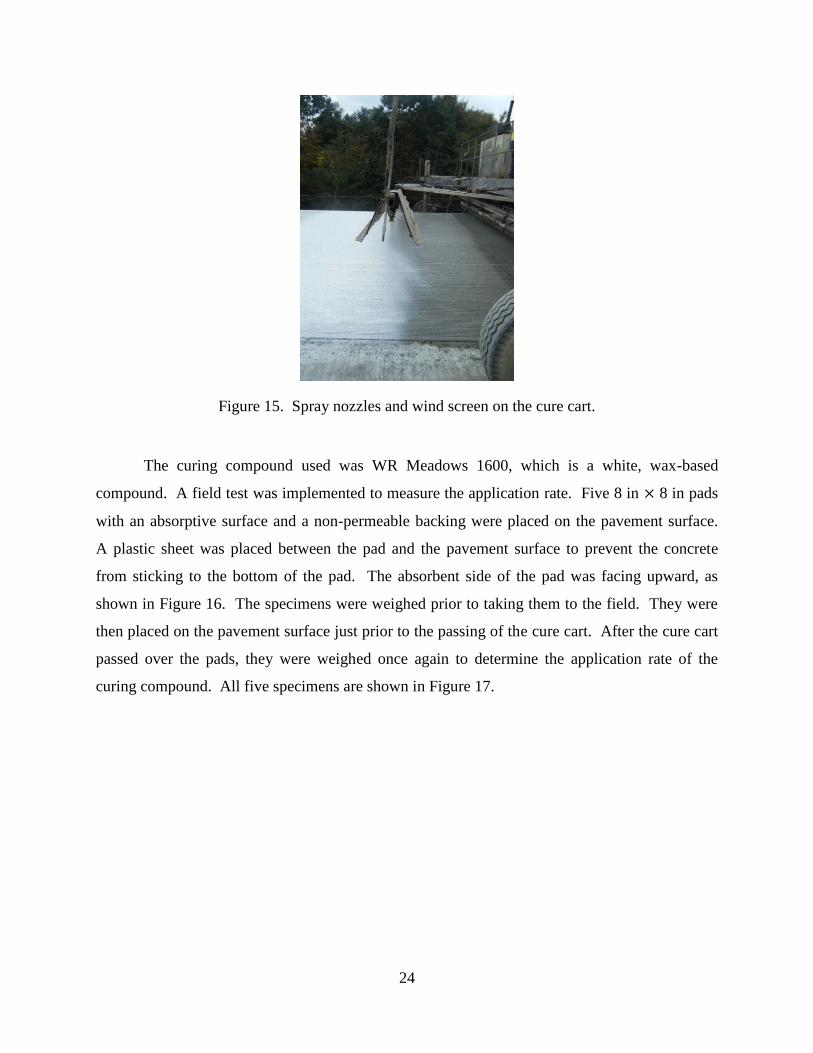
Figure 15. Spray nozzles and wind screen on the cure cart.
The curing compound used was WR Meadows 1600, which is a white, wax-based
compound. A field test was implemented to measure the application rate. Five 8 in × 8 in pads
with an absorptive surface and a non-permeable backing were placed on the pavement surface.
A plastic sheet was placed between the pad and the pavement surface to prevent the concrete
from sticking to the bottom of the pad. The absorbent side of the pad was facing upward, as
shown in Figure 16. The specimens were weighed prior to taking them to the field. They were
then placed on the pavement surface just prior to the passing of the cure cart. After the cure cart
passed over the pads, they were weighed once again to determine the application rate of the
curing compound. All five specimens are shown in Figure 17.
25
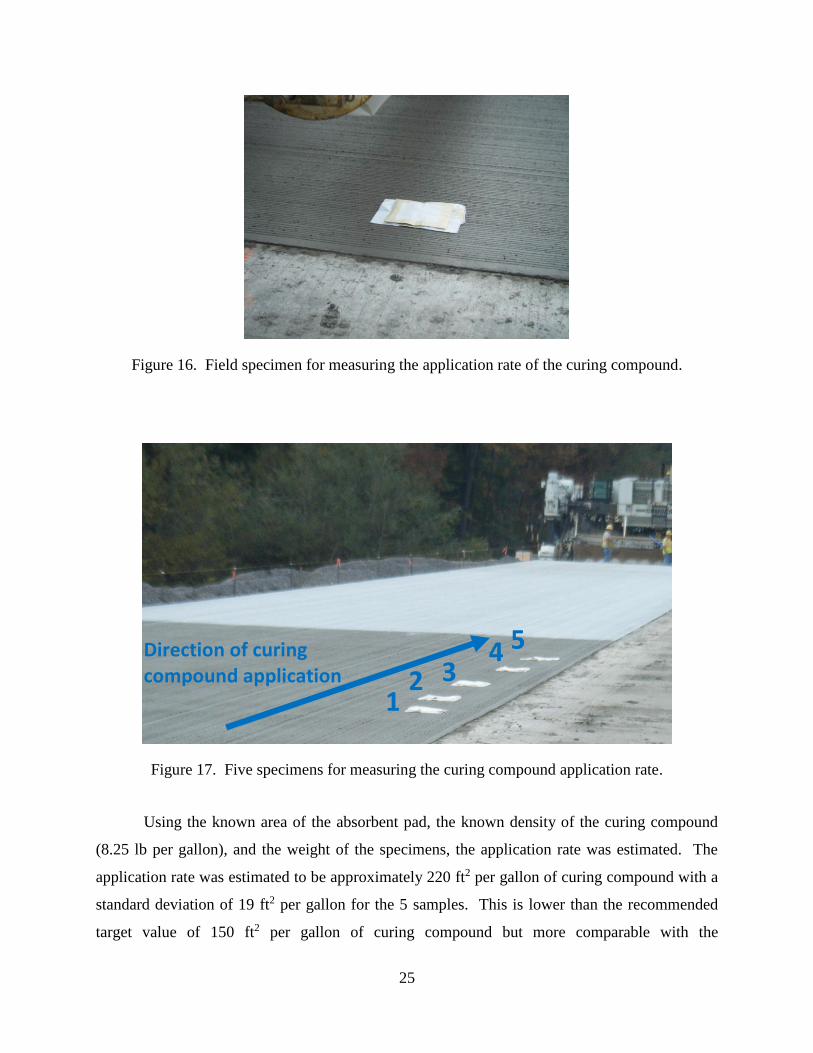
Figure 16. Field specimen for measuring the application rate of the curing compound.
Figure 17. Five specimens for measuring the curing compound application rate.
Using the known area of the absorbent pad, the known density of the curing compound
(8.25 lb per gallon), and the weight of the specimens, the application rate was estimated. The
application rate was estimated to be approximately 220 ft2 per gallon of curing compound with a
standard deviation of 19 ft2 per gallon for the 5 samples. This is lower than the recommended
target value of 150 ft2 per gallon of curing compound but more comparable with the
1 2
3 4 5 Direction of curing
compound application

26
manufacturer recommendation of 200 ft2 per gallon. The final appearance of the curing
compound can be seen in Figure 18. It is very clear that the curing cart was able to distribute the
curing compound more uniformly than was achievable using the hand wand. Following curing,
the project used an additional white plastic sheeting to cover the freshly cured concrete due to the
impending rain. This is shown in Figure 19.
Figure 18. Pavement with applied curing compound.
Figure 19. Sheeting used in addition to the curing compound due to impending rain.
27
5. FINDINGS FROM SPECIFICATION REVIEW AND SITE VISITS
A review of the specifications and the site visits provided an opportunity to assess current
practices and identify potential improvements. The two areas of focus were the mix design and
construction practices. Construction practices will be discussed first followed by a discussion on
mix designs.
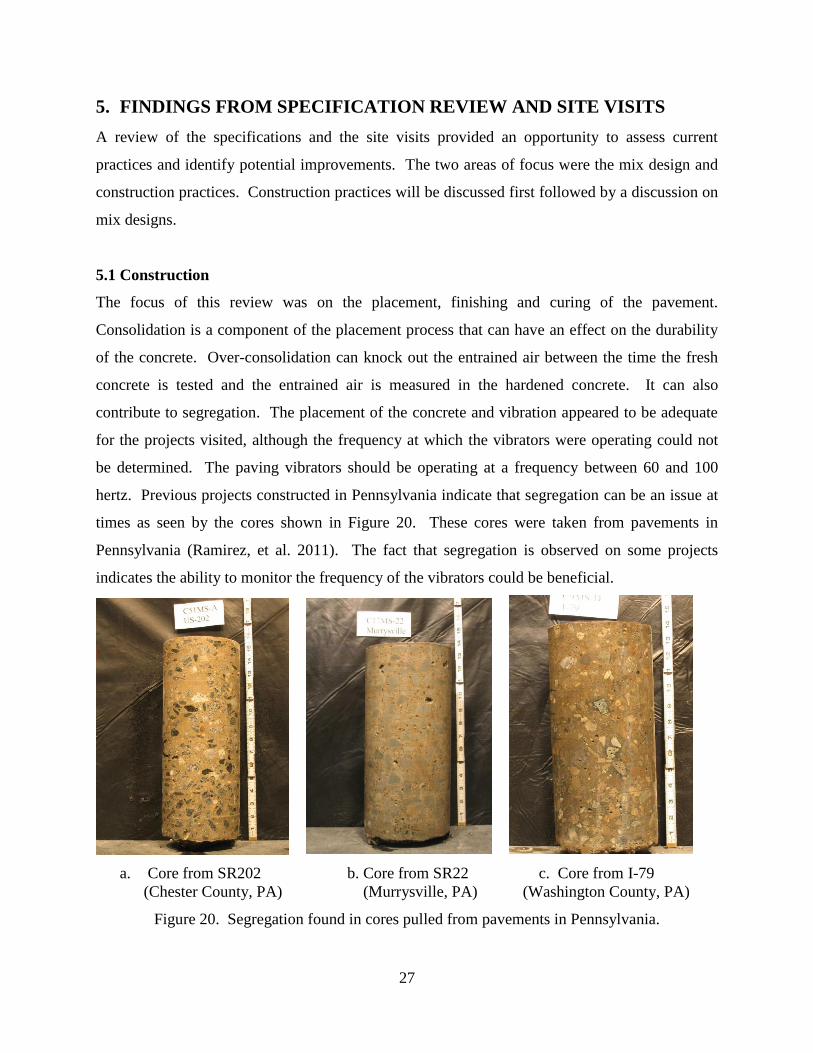
5.1 Construction
The focus of this review was on the placement, finishing and curing of the pavement.
Consolidation is a component of the placement process that can have an effect on the durability
of the concrete. Over-consolidation can knock out the entrained air between the time the fresh
concrete is tested and the entrained air is measured in the hardened concrete. It can also
contribute to segregation. The placement of the concrete and vibration appeared to be adequate
for the projects visited, although the frequency at which the vibrators were operating could not
be determined. The paving vibrators should be operating at a frequency between 60 and 100
hertz. Previous projects constructed in Pennsylvania indicate that segregation can be an issue at
times as seen by the cores shown in Figure 20. These cores were taken from pavements in
Pennsylvania (Ramirez, et al. 2011). The fact that segregation is observed on some projects
indicates the ability to monitor the frequency of the vibrators could be beneficial.
a. Core from SR202 b. Core from SR22 c. Core from I-79
(Chester County, PA) (Murrysville, PA) (Washington County, PA)
Figure 20. Segregation found in cores pulled from pavements in Pennsylvania.

28
The finishing process of each slipform paving project consisted of a wet burlap drag
behind the paver followed by approximately five or six people finishing the surface with floats.
Tining was then performed either in the transverse or longitudinal direction. The tining was
performed either manually or with automated equipment. Many times the burlap drag behind the
paver was so saturated that an excessive amount of water was being applied to the pavement
surface. The hand finishing removes the texture applied by the burlap so the sole purpose of the
burlap was to add water to the surface. The water is then worked into the surface by the
finishers. This practice creates a high w/c ratio at the surface which increases the potential for
plastic shrinkage cracking and reduces the overall durability of the surface by increasing the
porosity.
The effects of this practice can be seen in pavements across Pennsylvania. Figure 21a
shows a core taken from I-80 in Clinton County, PA as part of a study on the premature
deterioration of concrete pavements (Ramirez et al. 2011). Figure 21 also shows several
locations where plastic shrinkage cracking was observed on this section of I-80. Five of the six
pavements investigated as a part of this study exhibited plastic shrinkage cracking. Photos of
two of these pavements can be seen in Figures 22 and 23. These cracks typically propagate to a
depth of about 0.75 in. They typically are a greater concern in contributing to material-related
distress than fatigue cracking since, although the cracks do not propagate to a significant depth,
they make the surface of the pavement more porous. Several of these projects also exhibited
paste worn away at the surface, as seen in Figure 24. Although it is not common, plastic
shrinkage cracks that developed in the transverse direction and in the central portion of the slab
can contribute to the development of full depth fatigue cracks. This was observed on I-80
(Ramirez et al. 2011).
These cracks can be prevented through the adoption of proper curing and finishing
practices. Proper curing should include not only avoiding adding water to the pavement surface
to aid in finishing but also a uniform application of a curing compound at an appropriate
application rate. It is also critical that the curing compound used have sufficient water retention
characteristics. Special attention should also be paid to ensure the curing compound is less than
6 months old or it might not be possible to re-suspend the settled solids regardless of the
time/energy put into agitation. Based on the site visits, it was not apparent that tracking the age
of the cure was part of standard practice. Table 2 shows that pavements constructed in

29
Pennsylvania are susceptible to plastic shrinkage cracking for a significant portion of the
construction season if precautionary measures are not taken.
(a) Surface of core
(b) Plastic shrinkage crack number 27
(the crack has been digitally enhanced)
(c) Plastic shrinkage crack number 29
(the crack has been digitally enhanced)
Figure 21. Plastic shrinkage cracking on I-80 in Clinton County, PA.
Figure 22. Plastic shrinkage cracking on SR 202 in Chester County, PA.

30
Figure 23. Plastic shrinkage cracking on US 22 in Murrysville, PA.
Figure 24. Wear/erosion of the pavement surface on the surface of core form US 22 in
Westmoreland County, PA.
5.2 Mixture design
A refinement of the concrete mixture design specification should also be performed. Using a
more uniformly graded coarse aggregate along with using a lower w/cm ratio will help reduce
the potential for segregation. Using a more densely graded aggregate will reduce the voids
present between the aggregate particles and the corresponding volume of paste required to fill
those voids. Lowering the paste content then makes the concrete more durable and decreases the
31
long-term drying shrinkage. Reducing the allowable w/cm ratio also reduces the porosity of the
paste and therefore increases the durability but also increases the importance of proper curing.
The durability can also be increased by decreasing the paste to aggregate ratio as well by limiting
the total cement content for a defined w/cm ratio.
To improve the durability of the pavement and decrease the long-term drying shrinkage,
it is recommended that the w/cm be reduced to a maximum of 0.42 with possible incentives for
lower values down to a minimum of 0.38. The current maximum allowable w/cm ratio for
PennDOT is 0.47. A study conducted in 2011 by Nassiri and Vandenbossche included
measuring the w/cm ratio in the field using the microwave oven test for four different concrete
pavement projects in Pennsylvania. The average w/cm ratio established for Project 1, 2, 3 and 4
were 0.45, 0.47, 0.49 and 0.46, respectively. The corresponding standard deviation for each
project was 0.04, 0.01, 0.03 and 0.01. It is recommended that a maximum cement content of 600
lbs/cyd should be established to limit the drying shrinkage and increase the durability of the mix.
Finally, it is recommended that a more densely graded aggregate be used to help reduce the
cement demand and to reduce the potential for segregation. The following section discusses how
the Shilstone method can be used to establish a suitable aggregate gradation.
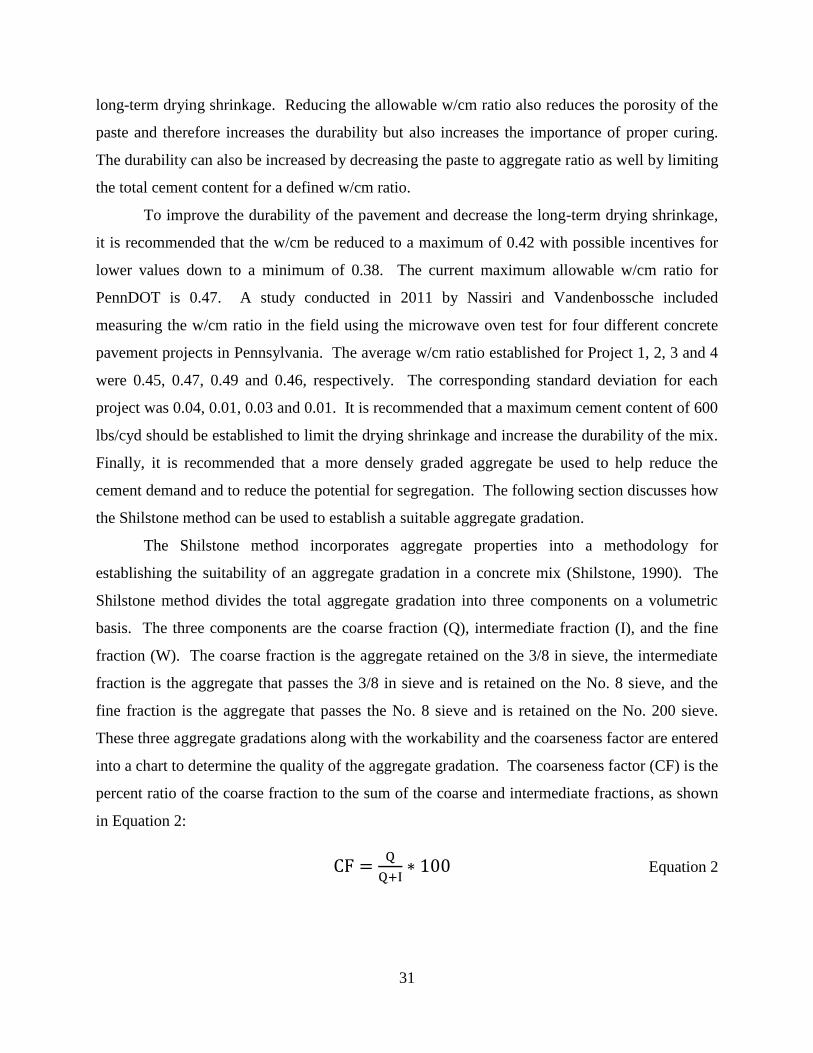
The Shilstone method incorporates aggregate properties into a methodology for
establishing the suitability of an aggregate gradation in a concrete mix (Shilstone, 1990). The
Shilstone method divides the total aggregate gradation into three components on a volumetric
basis. The three components are the coarse fraction (Q), intermediate fraction (I), and the fine
fraction (W). The coarse fraction is the aggregate retained on the 3/8 in sieve, the intermediate
fraction is the aggregate that passes the 3/8 in sieve and is retained on the No. 8 sieve, and the
fine fraction is the aggregate that passes the No. 8 sieve and is retained on the No. 200 sieve.
These three aggregate gradations along with the workability and the coarseness factor are entered
into a chart to determine the quality of the aggregate gradation. The coarseness factor (CF) is the
percent ratio of the coarse fraction to the sum of the coarse and intermediate fractions, as shown
in Equation 2:
CF =Q
Q+I∗ 100 Equation 2

32
Therefore, a CF of 100 would correspond to a completely gap graded aggregate with no
intermediate fraction (3/8 in to No. 8) and a CF of zero would represent an aggregate in which no
material is retained on the 3/8 in sieve.
The workability (W) is defined as the fine fraction or the percent material passing the No.
8 sieve. W is adjusted based upon the cement content of the mix. This parameter assumes that
six 94 pound bags of cement (564 lb) will be used in the mix. The adjustment to W that is used
is 2.5 percent per bag of cement or fraction of cement bag which deviates from the standard six
bags. This adjustment was derived from the fact that one bag of cement is approximately
equivalent to 2.5 percent of the absolute aggregate volume.
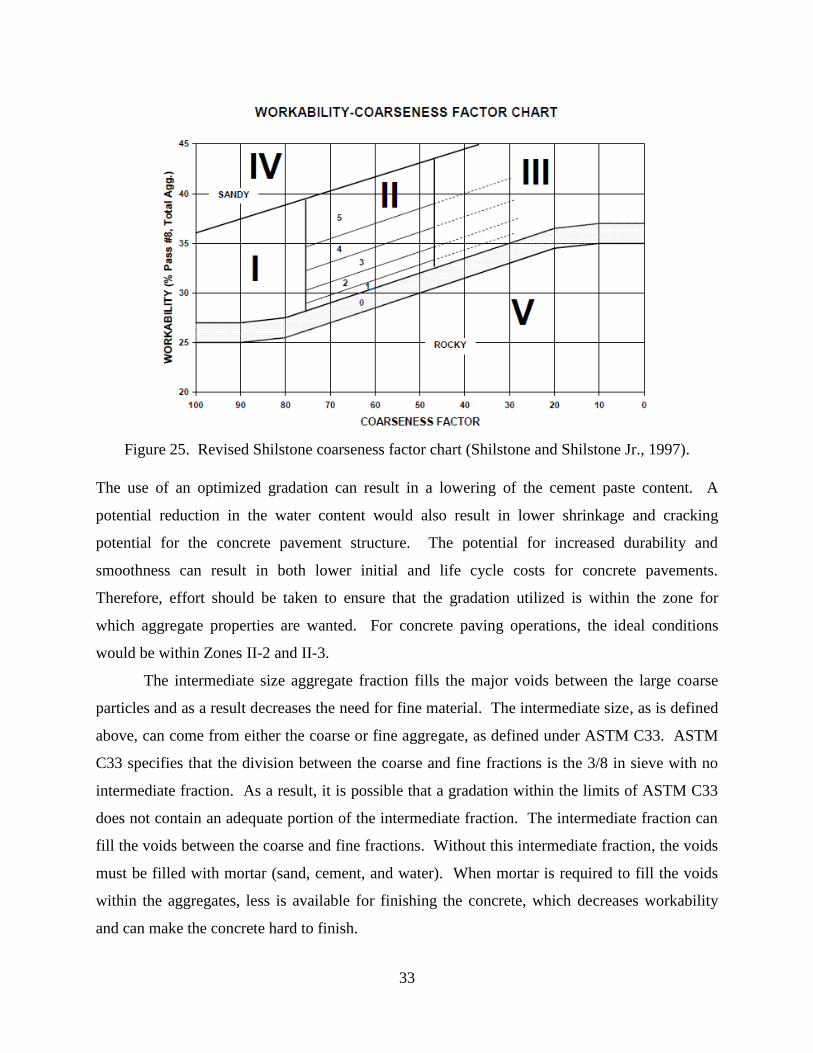
With the coarseness factor and the workability as defined above, Figure 25 can be used to
establish the quality of the aggregate gradation. This version of the CF chart is divided into
zones based upon the predicted aggregate properties. The zones are defined as follows:
Zone I: Coarse and gap graded aggregate which tends to segregate
Zone II: Well graded and best for every day mixes
Zone III: ¾ inch and finer for use in pea gravel mixes
Zone IV: Sandy and sticky mixes
Zone V: Rocky aggregate, which may be suitable for mass concreting
Zone I is the optimum range, however this should be avoided as a significant amount of control
over the quality of the mix is required, which is difficult to achieve. Zone II, which results in the
most well graded aggregates, is further divided into 5 subcategories. These zones are defined as
follows: II-1 is excellent but caution is required, II-2 is excellent for form paving and
slipforming, II-3 is for high quality slabs, II-4 is good for general concrete mixes, and II-5 varies
according to material and construction needs. From the figure, it can be observed that these
trends extend into Zone III as well.
33
Figure 25. Revised Shilstone coarseness factor chart (Shilstone and Shilstone Jr., 1997).
The use of an optimized gradation can result in a lowering of the cement paste content. A
potential reduction in the water content would also result in lower shrinkage and cracking
potential for the concrete pavement structure. The potential for increased durability and
smoothness can result in both lower initial and life cycle costs for concrete pavements.
Therefore, effort should be taken to ensure that the gradation utilized is within the zone for
which aggregate properties are wanted. For concrete paving operations, the ideal conditions
would be within Zones II-2 and II-3.
The intermediate size aggregate fraction fills the major voids between the large coarse
particles and as a result decreases the need for fine material. The intermediate size, as is defined
above, can come from either the coarse or fine aggregate, as defined under ASTM C33. ASTM
C33 specifies that the division between the coarse and fine fractions is the 3/8 in sieve with no
intermediate fraction. As a result, it is possible that a gradation within the limits of ASTM C33
does not contain an adequate portion of the intermediate fraction. The intermediate fraction can
fill the voids between the coarse and fine fractions. Without this intermediate fraction, the voids
must be filled with mortar (sand, cement, and water). When mortar is required to fill the voids
within the aggregates, less is available for finishing the concrete, which decreases workability
and can make the concrete hard to finish.

34
6. LABORATORY INVESTIGATION
Two areas to investigate further were identified after performing the site visits and the
specification review; 1. Effectiveness of curing compounds and 2. Mixture design refinements.
Two separate laboratory investigations were developed. The focus of the first was to better
quantify the effects of curing compound characteristics on water retention. The focus of the
second was to evaluate the effects of using a more densely graded aggregate and a lower w/cm
ratio on drying shrinkage. Both investigations are described below.
6.1.Curing compound study
The variables considered in the evaluation of curing compound effectiveness included, type of
curing compound (wax vs resin), percent resin and type of resin. Five different curing
compounds were tested. A wet cure and a dry cure were also included for comparison as control.
Both control specimens were placed in the environmental chamber with the curing compound
containing specimens: the dry cure had no compound applied and the wet cure was placed in a
water bath. The three performance parameters considered include moisture loss, compressive
strength and permeability. Moisture loss is generally considered to be the standard measure of
effectiveness of a curing compound. However, since pavement performance is also an important
consideration, compressive strength of the samples was measured. Likewise, to investigate the
potentail durability of the resulting pavement, permeability was also measured.
6.1.a. Description of the curing study
Curing compounds with wax, an unnamed resin and a poly alpha methylstyrene (AMS)
resin were considered. In addition to the type of resin or compound, the percent resin was also
considered an important factor. For this study, the percent of resin and the percent of total solids
is assumed to be the same. Technically, the solid component consists of both the pigment and
the resin but the percent pigment is assumed to be relatively consistent between the curing
compounds considered and the overall percentage is quite small. Table 9 lists characteristics of
each curing compound considered, including percent solids, the VOC and the reflectance. VOC
and reflectance are dictated by specification and provide an indication into curing compound
performance. The values provided in Table 9 were not measured as part of this effort but are
those reported by the manufacturer. As noted above, two additional curing regimes were
35
considered; a wet cure, where the specimen was placed in a water bath, and a dry cure, which
had no compound applied. The environmental conditions in this curing chamber are described in
a subsequent section.
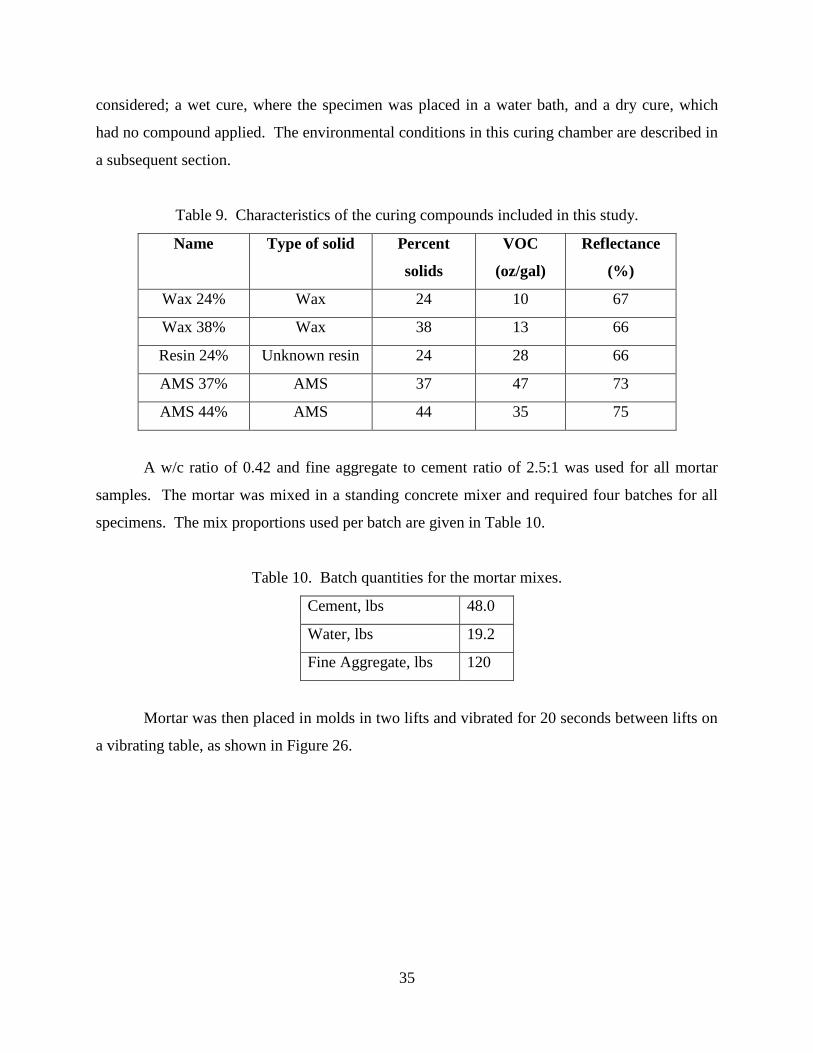
Table 9. Characteristics of the curing compounds included in this study.
Name Type of solid Percent
solids
VOC
(oz/gal)
Reflectance
(%)
Wax 24% Wax 24 10 67
Wax 38% Wax 38 13 66
Resin 24% Unknown resin 24 28 66
AMS 37% AMS 37 47 73
AMS 44% AMS 44 35 75
A w/c ratio of 0.42 and fine aggregate to cement ratio of 2.5:1 was used for all mortar
samples. The mortar was mixed in a standing concrete mixer and required four batches for all
specimens. The mix proportions used per batch are given in Table 10.
Table 10. Batch quantities for the mortar mixes.
Cement, lbs 48.0
Water, lbs 19.2
Fine Aggregate, lbs 120
Mortar was then placed in molds in two lifts and vibrated for 20 seconds between lifts on
a vibrating table, as shown in Figure 26.

36
Figure 26. Mortar specimens placed in lifts on vibration table.
Four samples were cast for each curing method: three 14 in × 2 in round pans and one 8 in × 2
in round pan. After the samples were cast, they were placed in the environmental chamber at a
temperature of 100 oF +/- 2 degrees, with 32 percent relative humidity +/- 2 percent and a
windspeed established based on the permeability cup test (ASTM C1653) of 0.07-0.12 oz/hour in
accordance with ASTM C 156. The specification requires the samples be removed for finishing
once the bleed water has fully evaporated and a moisture sheen is no longer visible on the
surface. This took approximately 1.5 hours for each sample. Finishing procedures then followed
by brushing the samples with a dry paint brush to create texture and then a small groove was cut
into the edge of the mortar, as shown in Figure 27. A silicone sealant was used to seal the gap
between the mortar sample and the pan. This ensured that moisture loss would occur only from
the surface of the sample and not from drying that may occur between the edge of the specimen
and the pan. The finished sample is shown in Figure 28. The initial mass was then measured.
Finally, the curing compound was then sprayed on the surface of the samples using a hand wand
sprayer and the final mass and time were recorded. Specimens were then immediately returned
to the controlled environmental chamber, as shown in Figure 29.

37
Figure 27. Grooves cut in mortar specimens following dry brush texturing.
Figure 28. Silicone sealed specimens following groove cutting.

38
Figure 29. Finished specimens placed in environmental chamber.
The mass of the specimens was measured daily for determining moisture loss. At 3, 7 and 28
days following casting, specimens were removed from the controlled environmental chamber, a
final mass was taken, and the specimens were demolded and then cut into compression and
permeability specimens. Three compression strength cubes (2 in × 2 in × 2 in cubes) were cut
from the mortar samples for 3-, 7- and 28-day testing. A typical demolded specimen to be sawed
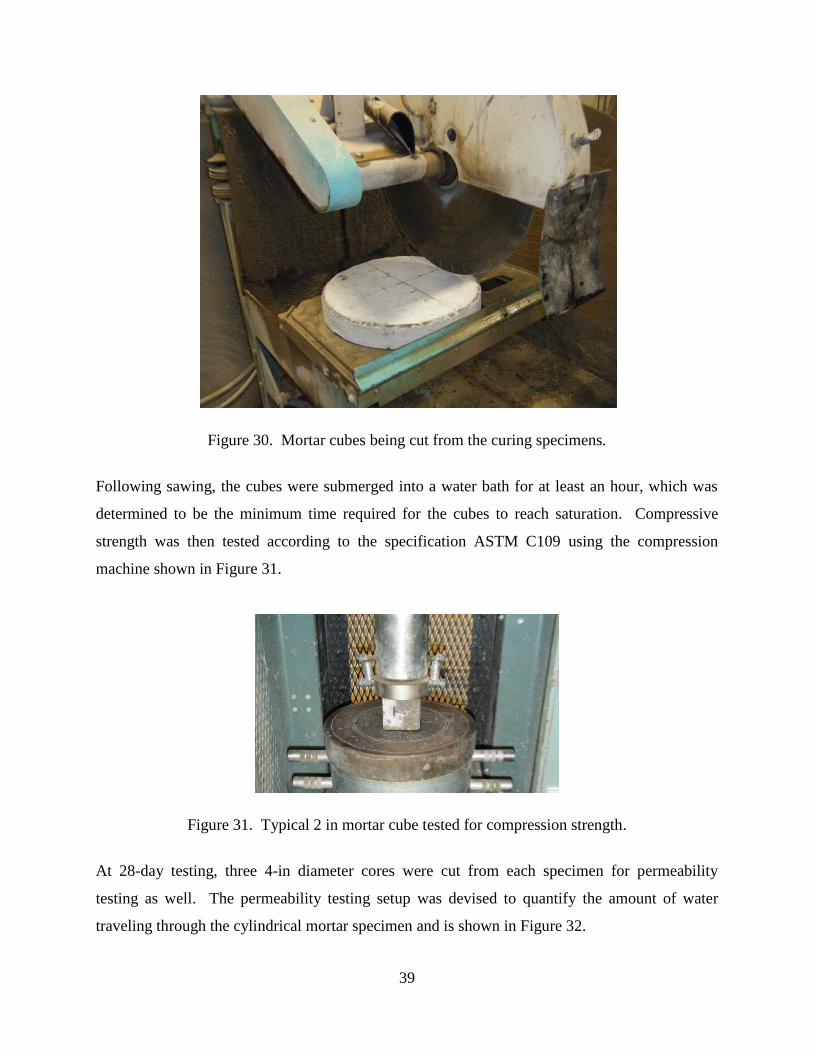
is shown in Figure 30.
39
Figure 30. Mortar cubes being cut from the curing specimens.
Following sawing, the cubes were submerged into a water bath for at least an hour, which was
determined to be the minimum time required for the cubes to reach saturation. Compressive
strength was then tested according to the specification ASTM C109 using the compression
machine shown in Figure 31.
Figure 31. Typical 2 in mortar cube tested for compression strength.
At 28-day testing, three 4-in diameter cores were cut from each specimen for permeability
testing as well. The permeability testing setup was devised to quantify the amount of water
traveling through the cylindrical mortar specimen and is shown in Figure 32.

40
Once the permeability specimens were cored from the mortar specimens, they were then
submerged for one day to ensure complete saturation before being placed in the permeability
apparatus. This was to ensure water flow through all specimens would occur in a fully saturated
condition. The specimens were then blotted dry to a saturated surface dry condition and the
outside was coated with a thin layer of petroleum jelly. The top and bottom funnels of the
apparatus were attached and tightly wrapped in plastic to prevent moisture loss from the sides.
Water was then pumped into the funnel, until reaching the desired level on the pipette. The drop
in the water level within the pipette was then measured over a period of several days.
Figure 32. The permeability testing setup.
6.1.b. Results from the curing study
The moisture loss, compressive strengths and permeability measurements and surface
observations for each of the curing methods is provided below with a discussion of the results.
Figure 33 shows the cumulative moisture loss for the specimens in pounds per square foot of
surface area versus time for the first 3 days. This is the required test duration for the ASTM C
156 specification but values extending to 7 days are given in Figure 34. The moisture loss for
each of the treatments is consists of the average of the samples treated with each specific curing
method. From all three plots, it can be seen that the dry treatment resulted in the greatest
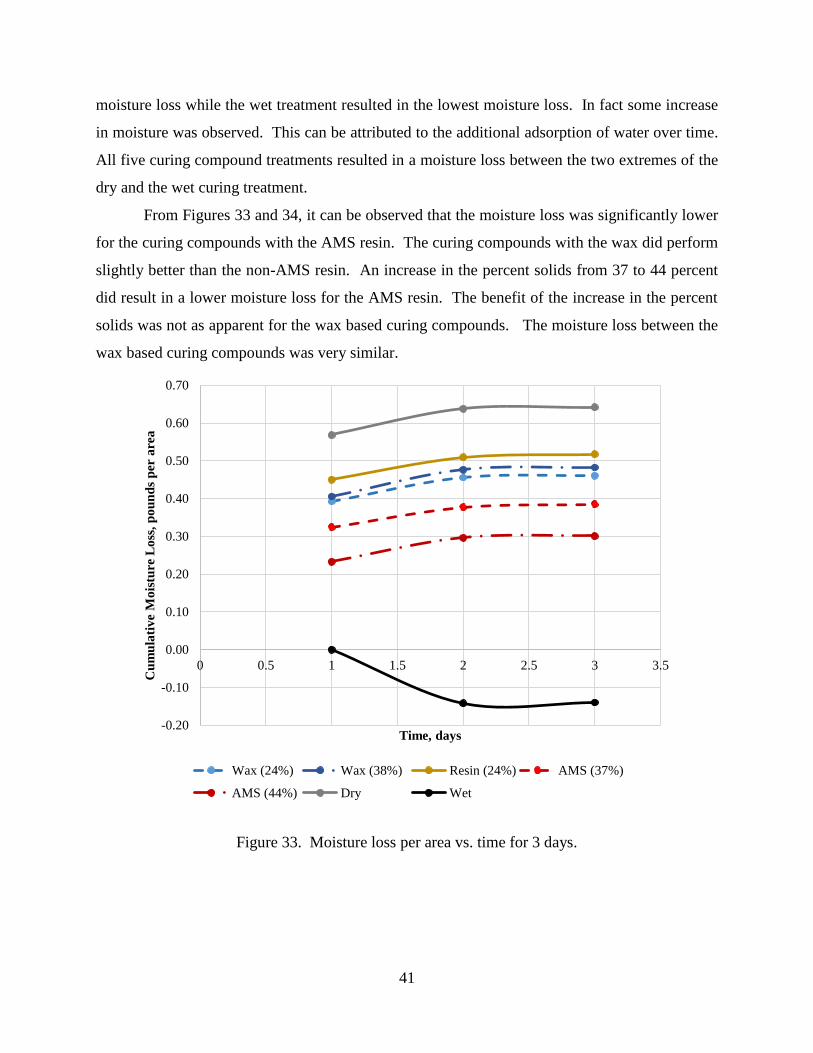
41
moisture loss while the wet treatment resulted in the lowest moisture loss. In fact some increase
in moisture was observed. This can be attributed to the additional adsorption of water over time.
All five curing compound treatments resulted in a moisture loss between the two extremes of the
dry and the wet curing treatment.
From Figures 33 and 34, it can be observed that the moisture loss was significantly lower
for the curing compounds with the AMS resin. The curing compounds with the wax did perform
slightly better than the non-AMS resin. An increase in the percent solids from 37 to 44 percent
did result in a lower moisture loss for the AMS resin. The benefit of the increase in the percent
solids was not as apparent for the wax based curing compounds. The moisture loss between the
wax based curing compounds was very similar.
Figure 33. Moisture loss per area vs. time for 3 days.
-0.20
-0.10
0.00
0.10
0.20
0.30
0.40
0.50
0.60
0.70
0 0.5 1 1.5 2 2.5 3 3.5
Cu
mu
lati
ve
Mo
istu
re L
oss
, p
ou
nd
s p
er a
rea
Time, days
Wax (24%) Wax (38%) Resin (24%) AMS (37%)
AMS (44%) Dry Wet

42
Figure 34. Moisture loss per area vs time for 7 days.
Hypothesis testing was then completed for moisture loss for the cumulative values of moisture
loss per unit area for the 3- and 7-day results. As seen in Figures 33 and 34 above, the average
values for similar solid type (ie, wax, resin, or specifically, the AMS resin) are quite close.
Therefore, the data was initially divided by the resin type in order to observe statistically
significant trends. Data from both wax based curing compounds was combined for the “Wax”
category and data from both AMS curing compounds was combined for the “AMS” category,
while the unnamed resin was averaged by itself and is labeled “Resin.” The P-values from
significant observations (defined as having a P-value of less than 0.1), which emerged from this
one-tailed hypothesis testing analysis will be discussed.
First, significant relationships relative to the two control curing methods will be
discussed. The wet cure and the dry cure methods provided control methods for this curing
compound study and provided boundaries between which all other moisture loss values fell. The
wet cure would be considered an ‘ideal’ curing method and should optimally have no moisture
-0.20
-0.10
0.00
0.10
0.20
0.30
0.40
0.50
0.60
0.70
0.80
0 1 2 3 4 5 6 7 8Cu
mu
lati
ve
Mo
istu
re L
oss
, p
ou
nd
s p
er a
rea
Time, days
Wax (24%) Wax (38%) Resin (24%) AMS (37%)
AMS (44%) Dry Wet

43
loss at all. The dry cure would be considered the worst curing method and would experience the
greatest level of moisture loss. Table 11 below shows the significant relationships between
different curing methods and both control curing methods for both 3-day and 7-day moisture
loss.
Table 11. Significant relationships for cumulative moisture loss for control curing methods.
Compared curing methods P-value
3-day
Dry cure > Wax 0.0040
Dry cure > Resin 0.0162
Dry cure > AMS 0.0003
Wet cure < Wax 0.0000
Wet cure < Resin 0.0000
Wet cure < AMS 0.0000
Wet cure < Dry cure 0.0000
7-day
Dry cure > Wax 0.0276
Dry cure > Resin 0.0661
Dry cure > AMS 0.0020
Wet cure < Wax 0.0000
Wet cure < Resin 0.0000
Wet cure < AMS 0.0002
Wet cure < Dry cure 0.0013
From these values, it becomes evident that statistically, the dry cure experiences more moisture
loss than all other methods of curing for both the 3-day and the 7-day testing. The wet cure
experiences significantly less moisture loss than all curing methods for both 3-day and 7-day
moisture measurements. This implies both that any method of curing is better than no curing at
all and that wet curing remains the best curing method of any possible curing method.
Therefore, the curing compounds behaved as expected in relation to the control curing methods,
such that both control curing methods provided statistically significant boundaries for the other
curing methods. These significant relationships were all expected. The relationships between
the specific types of curing compound are given in Table 12 below.

44
Table 12. Significant relationships for cumulative moisture loss by solids type.
Compared compounds P-value
3-day
Wax < Resin 0.0208
Wax > AMS 0.0010
Resin > AMS 0.0010
7-day
Wax < Resin 0.0462
Wax > AMS 0.0266
Resin > AMS 0.0087
There are some expected significant relationships from the moisture loss results, which followed
ASTM C 156 testing. First of all, it can be seen that all curing compound performance
maintained the same trends across 3-day and 7-day moisture loss, albeit with different P-values.
It can be seen that the wax experienced more moisture loss than only the AMS resin: the
unnamed resin experienced more moisture loss than the wax for both 3-day and 7-day results.
Additionally, it can be seen that the AMS type resin always performed better, as in, experienced
less moisture loss, than the unnamed resin and finally, that the AMS resin always performed
better than the wax-based curing compounds. It is important to note that the AMS based curing
compound samples had statistically less moisture loss than the wax-based curing compounds
with a P-value of 0.0010 and 0.0266 for 3-day and 7-day results, respectively. All of these
relationships were statistically significant.
The data was then further divided by curing compound and specific percentage of solids
and hypothesis testing was then completed based on these categories. Again, all curing methods
will be first compared against the two control methods and the statistically significant
relationships are given in Table 13 below.

45
Table 13. Significant relationships for cumulative moisture by solids type and percentage
against two control methods.
Compared compounds P-value
3-day
Dry cure > Wax (24%) 0.0032
Dry cure > Wax (38%) 0.0080
Dry cure > Resin (24%) 0.0162
Dry cure > AMS (37%) 0.0244
Dry cure > AMS (44%) 0.0006
Wet cure < Wax (24%) 0.0001
Wet cure < Wax (38%) 0.0023
Wet cure < Resin (24%) 0.0000
Wet cure < AMS (37%) 0.0045
Wet cure < AMS (44%) 0.0010
Dry cure > Wet cure 0.0001
7-day
Dry cure > Wax (24%) 0.0173
Dry cure > Wax (38%) 0.0160
Dry cure > Resin (24%) 0.0661
Dry cure > AMS (37%) 0.0840
Dry cure > AMS (44%) 0.0123
Wet cure < Wax (24%) 0.0001
Wet cure < Wax (38%) 0.0023
Wet cure < Resin (24%) 0.0000
Wet cure < AMS (37%) 0.0216
Wet cure < AMS (44%) 0.0078
Dry cure > Wet cure 0.0002
It is clear that the trends discussed from the general results from Table 11 all hold consistently
here across both 3-day and 7-day moisture loss values. Again as expected, all curing methods
performed statistically better than the dry curing method control and all curing methods
performed statistically worse than the wet curing method control. All of the relationships were
consistent across 3-day and 7-day moisture loss but with different P-values. The curing
compounds were then compared against each other and the statistically significant results are
given in Table 14 below.

46
Table 14. Significant relationships for cumulative moisture by solids type and percentage.
Compared compounds P-value
3-day
Resin (24%) > Wax (24%) 0.0151
AMS (44%) < Wax (24%) 0.0172
Resin (24%) > Wax (38%) 0.0812
AMS (44%) < Wax (38%) 0.0353
AMS (44%) < Resin (24%) 0.0036
7-day
Resin (24%) > Wax (24%) 0.0579
AMS (44%) < Wax (24%) 0.0817
Resin (24%) > Wax (38%) 0.0668
AMS (44%) < Resin (24%) 0.0439
This hypothesis testing revealed similar expected, yet overall weaker, trends. This was
expected because when divided, there are overall fewer samples and the averages between the
same types of curing compounds are quite close. However, some consistent trends still emerged:
such as the AMS (44%) performed significantly better than both Wax (24%) and Wax (38%) and
Resin (24%). However, specific significant conclusions based on solids percentage within the
same solids type could not be reached. Again, the general trends remained consistent between
the 3- and 7-day results.
The effect of the curing treatment on the resulting compressive strength of the specimens
is shown in Figure 35 and Figure 36. Although the main parameter of concern when evaluating
the effectiveness of curing is moisture loss, compressive strength provides an indication of the
effectiveness of the curing on the performance of the concrete. For all treatments, three 2 in × 2
in × 2 in cubes were sawed from the specimens and tested with the average values and standard
deviations presented below. Again, as for the moisture loss data, the data was first divided by
the resin type in order to observe statistically significant trends. Data from both wax based
curing compounds was combined for the “Wax” category and data from both AMS curing
compounds was combined for the “AMS” category, while the unnamed resin was averaged by
itself and is labeled “Resin”. Each bar represents the compressive strength and the error bars
indicate one standard deviation above and below the mean. As expected, the two control curing
methods provide the extreme boundaries to frame the results of the curing compounds. This can
be seen in both figures with the greatest and least strength resulting from wet and dry cures,
respectively, and results from all compounds falling in between. It is also evident from the plots

47
that the wax based compounds produce the lowest strength of the liquid membrane forming
curing compounds while the AMS-based curing compounds produced the highest strength for
both 3 and 7 day testing.
Figure 35. Average 3-day compressive strengths based on solids type.
0
1000
2000
3000
4000
5000
6000
Resin Wax Wet Dry AMS
psi
Treatment

48
Figure 36. Average 7-day compressive strengths based on solids type.
To confirm these observed trends, hypothesis testing was completed for compression strength for
3 and 7-day strength values. Again, the data was first divided by the resin type in order to
observe statistically significant trends. First, the specimens were compared against the wet and
dry control curing methods only, again suspected to provide boundaries for the curing methods
to fall within. The P-values from significant observations (defined as less than 0.1) for all
specimens with respect to the two control curing methods are given in Table 15 below.
Table 15. Significant relationships for compressive strength testing against two control methods.
Compared compounds P-value
3-day
Dry cure < Wax 0.0163
Dry cure < Resin 0.0255
Dry cure < AMS 0.0005
Wet cure > Wax 0.0002
Wet cure > Resin 0.0128
Wet cure > AMS 0.0002
Wet cure > Dry cure 0.0004
7-day
Dry cure < Wax 0.0009
Dry cure < Resin 0.0039
Dry cure < AMS 0.0001
Wet cure > Wax 0.0005
Wet cure > Resin 0.0006
Wet cure > AMS 0.0011
Wet cure > Dry cure 0.0003
0
1000
2000
3000
4000
5000
6000
7000
Resin Wax Wet Dry AMS
psi
Treatment
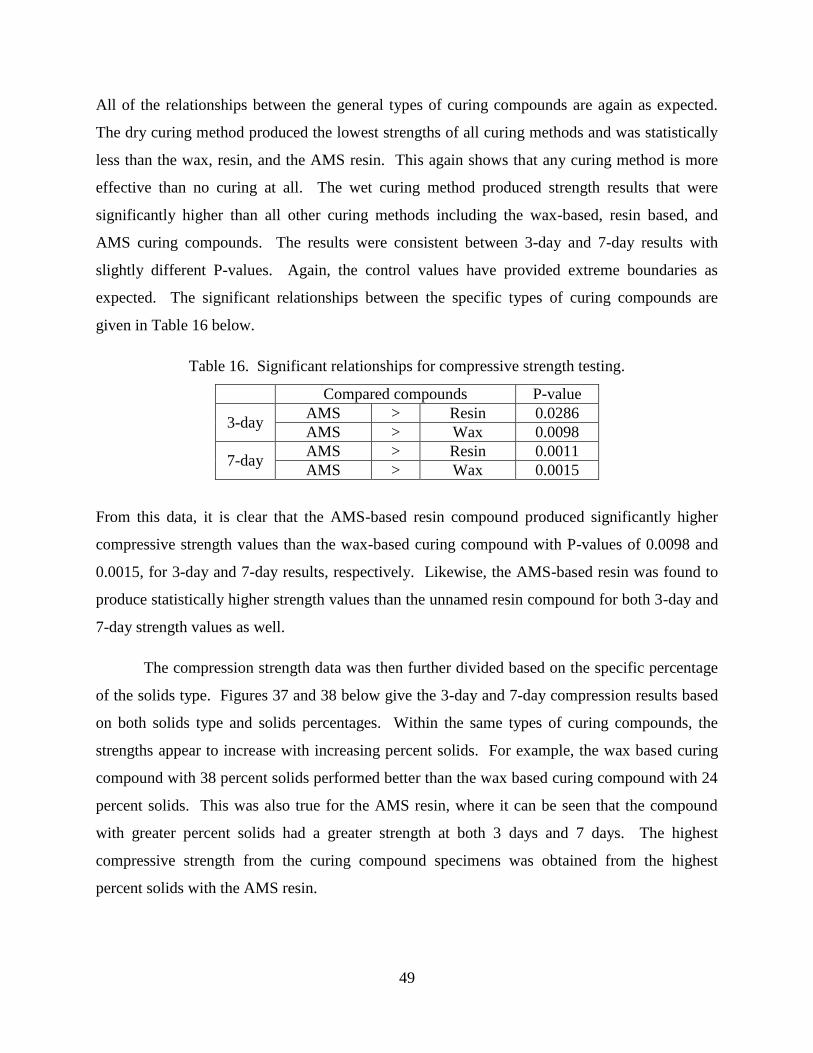
49
All of the relationships between the general types of curing compounds are again as expected.
The dry curing method produced the lowest strengths of all curing methods and was statistically
less than the wax, resin, and the AMS resin. This again shows that any curing method is more
effective than no curing at all. The wet curing method produced strength results that were
significantly higher than all other curing methods including the wax-based, resin based, and
AMS curing compounds. The results were consistent between 3-day and 7-day results with
slightly different P-values. Again, the control values have provided extreme boundaries as
expected. The significant relationships between the specific types of curing compounds are
given in Table 16 below.
Table 16. Significant relationships for compressive strength testing.
Compared compounds P-value
3-day AMS > Resin 0.0286
AMS > Wax 0.0098
7-day AMS > Resin 0.0011
AMS > Wax 0.0015
From this data, it is clear that the AMS-based resin compound produced significantly higher
compressive strength values than the wax-based curing compound with P-values of 0.0098 and
0.0015, for 3-day and 7-day results, respectively. Likewise, the AMS-based resin was found to
produce statistically higher strength values than the unnamed resin compound for both 3-day and
7-day strength values as well.
The compression strength data was then further divided based on the specific percentage
of the solids type. Figures 37 and 38 below give the 3-day and 7-day compression results based
on both solids type and solids percentages. Within the same types of curing compounds, the
strengths appear to increase with increasing percent solids. For example, the wax based curing
compound with 38 percent solids performed better than the wax based curing compound with 24
percent solids. This was also true for the AMS resin, where it can be seen that the compound
with greater percent solids had a greater strength at both 3 days and 7 days. The highest
compressive strength from the curing compound specimens was obtained from the highest
percent solids with the AMS resin.
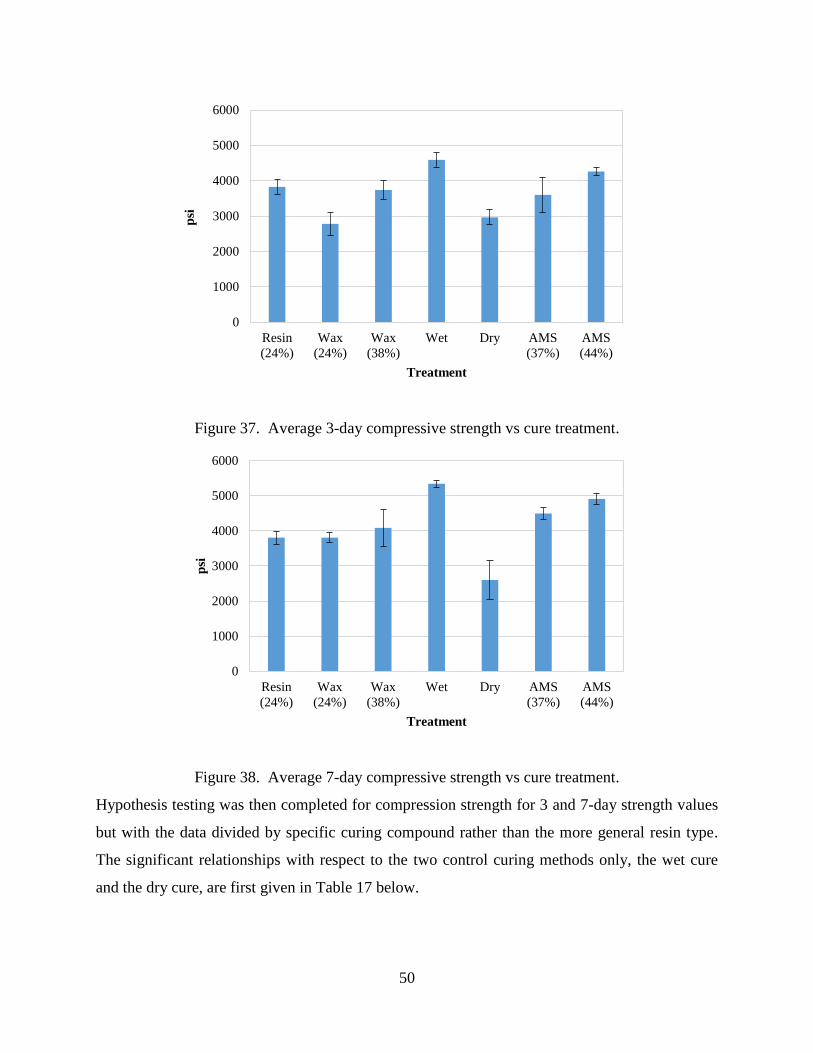
50
Figure 37. Average 3-day compressive strength vs cure treatment.
Figure 38. Average 7-day compressive strength vs cure treatment.
Hypothesis testing was then completed for compression strength for 3 and 7-day strength values
but with the data divided by specific curing compound rather than the more general resin type.
The significant relationships with respect to the two control curing methods only, the wet cure
and the dry cure, are first given in Table 17 below.
0
1000
2000
3000
4000
5000
6000
Resin
(24%)
Wax
(24%)
Wax
(38%)
Wet Dry AMS
(37%)
AMS
(44%)
psi
Treatment
0
1000
2000
3000
4000
5000
6000
Resin
(24%)
Wax
(24%)
Wax
(38%)
Wet Dry AMS
(37%)
AMS
(44%)
psi
Treatment

51
Table 17. Significant relationships for compressive strength testing for specific solids type and
percentage against two control methods.
Compared compounds P-value
3-day
Wet cure > Wax (24%) 0.0022
Wet cure > Wax (38%) 0.0126
Wet cure > Resin (24%) 0.0061
Wet cure > AMS (37%) 0.0431
Wet cure > AMS (44%) 0.0550
Dry cure < Wax (38%) 0.0161
Dry cure < Resin (24%) 0.0037
Dry cure < AMS (37%) 0.0885
Dry cure < AMS (44%) 0.0014
Dry cure < Wet cure 0.0004
7-day
Wet cure > Wax (24%) 0.0003
Wet cure > Wax (38%) 0.0270
Wet cure > Resin (24%) 0.0006
Wet cure > AMS (37%) 0.0028
Wet cure > AMS (44%) 0.0127
Dry cure < Wax (24%) 0.0335
Dry cure < Wax (38%) 0.0214
Dry cure < Resin (24%) 0.0349
Dry cure < AMS (37%) 0.0150
Dry cure < AMS (44%) 0.0099
Dry cure < Wet cure 0.0069
From the relationships given in Table 17, it is clear that, as expected, the wet cure produced
specimens with significantly higher compressive strength than all other curing methods. The dry
curing method produced a lower strength as compared to all five curing methods. Again, these
statistically significant trends are consistent between 3-day and 7-day compression strength
testing. The statistically significant relationships between the specific curing compounds only
are given in Table 18 below.

52
Table 18. Significant relationships for compressive strength testing for specific solids type and
percentage.
Compared compounds P-value
3-day
Wax (38%) > Wax (24%) 0.0064
AMS (44%) > AMS (37%) 0.0763
Resin (24%) > Wax (24%) 0.0097
AMS (37%) > Wax (24%) 0.0484
AMS (44%) > Wax (24%) 0.0095
AMS (44%) > Wax (38%) 0.0479
AMS (44%) > Resin (24%) 0.0263
7-day
AMS (37%) > Wax (24%) 0.0065
AMS (44%) > Wax (24%) 0.0013
AMS (37%) > Resin (24%) 0.0049
AMS (44%) > Resin (24%) 0.0020
AMS (44%) > Wax (38%) 0.0585
AMS (44%) > AMS (37%) 0.0257
Several additional trends emerge from the compressive strength data for the specific percentages
of curing compound. For 3-day compression strength data, it can be seen that higher percentages
of solids for the wax and for the AMS resin produced significantly higher strength results than
the lower percentages of either curing type. Specifically, the Wax (38%) produced stronger
specimens than the Wax (24%) with a P-value of 0.0064 while the AMS (44%) produced
stronger specimens than the AMS (37%) with a P-value of 0.0763. Additionally, for 3-day
compressive strength testing, the resin performed better than the lower percentage wax and the
higher percentage solids AMS performed better than both wax compounds and the unnamed
resin. For 7-day compressive strength data, it can be seen that specimens for both percentages of
AMS based curing compound produced higher strengths than both percentages of the wax-based
compounds and the unnamed resin.
Figures 39 and 40 below present the moisture loss per unit area versus the compressive
strength of the mortar samples at 3 and 7 days. From the plots, it is apparent that an inverse
relationship exists between the moisture loss and the resulting compressive strength. Both
regressions present high coefficients of determination indicating that a decrease in the moisture
lost from the mortar sample in turn results in a relative increase in compressive strength of the

53
samples regardless of the age of the specimens. The improved relationship exhibited for the 7-
day strengths can be attributed to the fact that the impact of the flaws in the concrete as a result
of micro cracking from insufficient curing will be greater when the strengths are higher.
Figure 39. Moisture loss per area vs compressive strength at 3 days.
Figure 40. Moisture loss per area vs compressive strength at 7 days.
R² = 0.65
0
0.1
0.2
0.3
0.4
0.5
0.6
0.7
0 1000 2000 3000 4000 5000
Mo
istu
re L
oss
per
are
a (
po
un
ds/
sq f
t)
Strength (psi)
R² = 0.74
0
0.1
0.2
0.3
0.4
0.5
0.6
0.7
0.8
0.9
0 1000 2000 3000 4000 5000 6000
Mo
istu
re L
oss
per
are
a (
po
un
ds/
sq f
t)
Strength (psi)
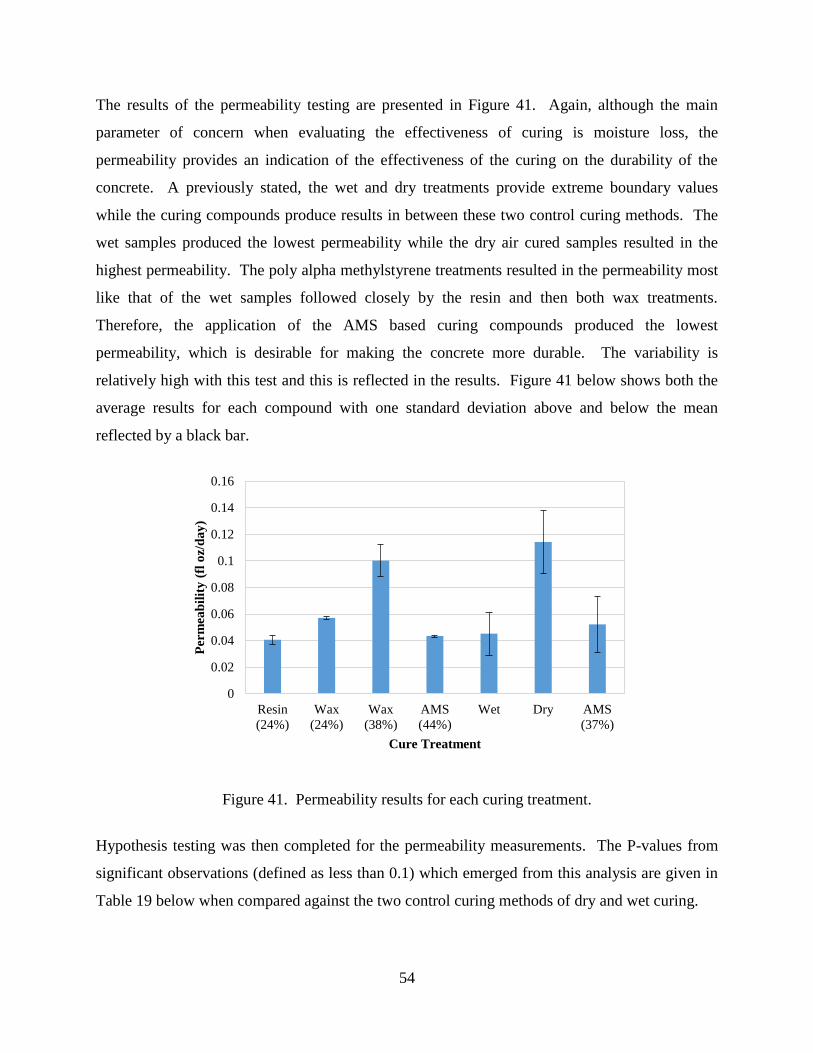
54
The results of the permeability testing are presented in Figure 41. Again, although the main
parameter of concern when evaluating the effectiveness of curing is moisture loss, the
permeability provides an indication of the effectiveness of the curing on the durability of the
concrete. A previously stated, the wet and dry treatments provide extreme boundary values
while the curing compounds produce results in between these two control curing methods. The
wet samples produced the lowest permeability while the dry air cured samples resulted in the
highest permeability. The poly alpha methylstyrene treatments resulted in the permeability most
like that of the wet samples followed closely by the resin and then both wax treatments.
Therefore, the application of the AMS based curing compounds produced the lowest
permeability, which is desirable for making the concrete more durable. The variability is
relatively high with this test and this is reflected in the results. Figure 41 below shows both the
average results for each compound with one standard deviation above and below the mean
reflected by a black bar.
Figure 41. Permeability results for each curing treatment.
Hypothesis testing was then completed for the permeability measurements. The P-values from
significant observations (defined as less than 0.1) which emerged from this analysis are given in
Table 19 below when compared against the two control curing methods of dry and wet curing.
0
0.02
0.04
0.06
0.08
0.1
0.12
0.14
0.16
Resin
(24%)
Wax
(24%)
Wax
(38%)
AMS
(44%)
Wet Dry AMS
(37%)
Per
mea
bil
ity
(fl
oz/
da
y)
Cure Treatment
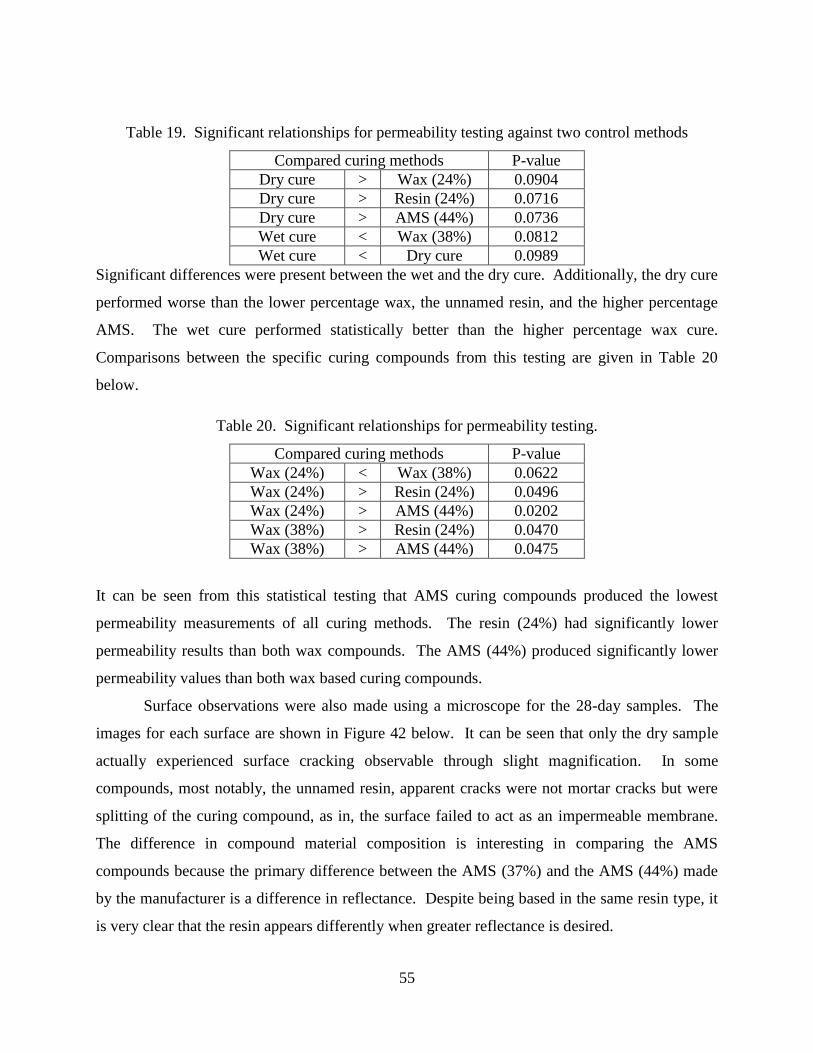
55
Table 19. Significant relationships for permeability testing against two control methods
Compared curing methods P-value
Dry cure > Wax (24%) 0.0904
Dry cure > Resin (24%) 0.0716
Dry cure > AMS (44%) 0.0736
Wet cure < Wax (38%) 0.0812
Wet cure < Dry cure 0.0989
Significant differences were present between the wet and the dry cure. Additionally, the dry cure
performed worse than the lower percentage wax, the unnamed resin, and the higher percentage
AMS. The wet cure performed statistically better than the higher percentage wax cure.
Comparisons between the specific curing compounds from this testing are given in Table 20
below.
Table 20. Significant relationships for permeability testing.
Compared curing methods P-value
Wax (24%) < Wax (38%) 0.0622
Wax (24%) > Resin (24%) 0.0496
Wax (24%) > AMS (44%) 0.0202
Wax (38%) > Resin (24%) 0.0470
Wax (38%) > AMS (44%) 0.0475
It can be seen from this statistical testing that AMS curing compounds produced the lowest
permeability measurements of all curing methods. The resin (24%) had significantly lower
permeability results than both wax compounds. The AMS (44%) produced significantly lower
permeability values than both wax based curing compounds.
Surface observations were also made using a microscope for the 28-day samples. The
images for each surface are shown in Figure 42 below. It can be seen that only the dry sample
actually experienced surface cracking observable through slight magnification. In some
compounds, most notably, the unnamed resin, apparent cracks were not mortar cracks but were
splitting of the curing compound, as in, the surface failed to act as an impermeable membrane.
The difference in compound material composition is interesting in comparing the AMS
compounds because the primary difference between the AMS (37%) and the AMS (44%) made
by the manufacturer is a difference in reflectance. Despite being based in the same resin type, it
is very clear that the resin appears differently when greater reflectance is desired.
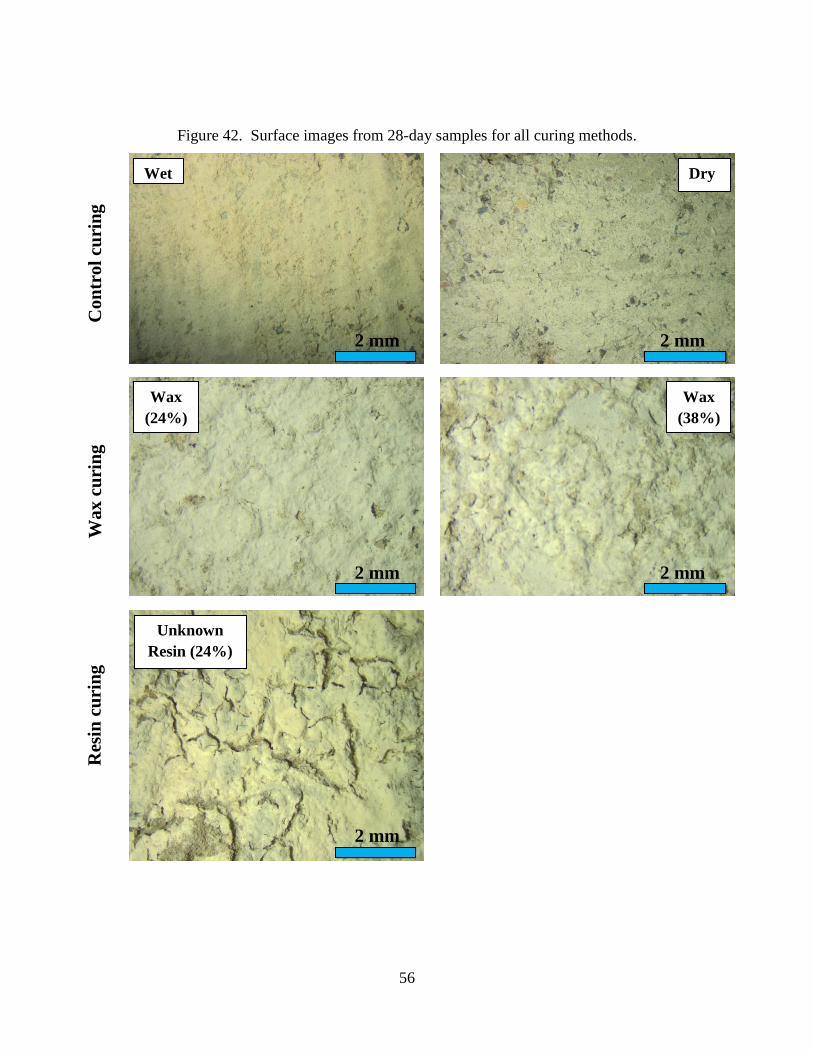
56
Figure 42. Surface images from 28-day samples for all curing methods.
Wet Dry
Wax
(24%)
Wax
(38%)
Unknown
Resin (24%)
Con
tro
l cu
rin
g
Wax
cu
rin
g
Res
in c
uri
ng
2 mm 2 mm
2 mm 2 mm
2 mm
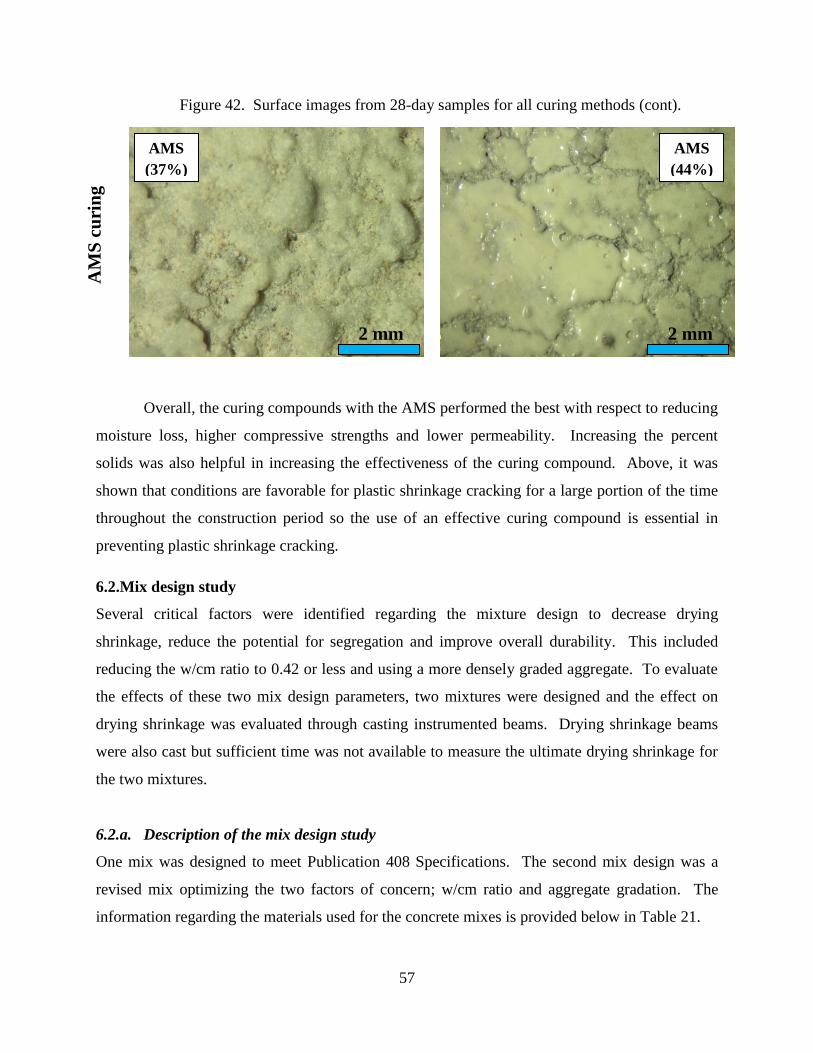
57
Figure 42. Surface images from 28-day samples for all curing methods (cont).
Overall, the curing compounds with the AMS performed the best with respect to reducing
moisture loss, higher compressive strengths and lower permeability. Increasing the percent
solids was also helpful in increasing the effectiveness of the curing compound. Above, it was
shown that conditions are favorable for plastic shrinkage cracking for a large portion of the time
throughout the construction period so the use of an effective curing compound is essential in
preventing plastic shrinkage cracking.
6.2.Mix design study
Several critical factors were identified regarding the mixture design to decrease drying
shrinkage, reduce the potential for segregation and improve overall durability. This included
reducing the w/cm ratio to 0.42 or less and using a more densely graded aggregate. To evaluate
the effects of these two mix design parameters, two mixtures were designed and the effect on
drying shrinkage was evaluated through casting instrumented beams. Drying shrinkage beams
were also cast but sufficient time was not available to measure the ultimate drying shrinkage for
the two mixtures.
6.2.a. Description of the mix design study
One mix was designed to meet Publication 408 Specifications. The second mix design was a
revised mix optimizing the two factors of concern; w/cm ratio and aggregate gradation. The
information regarding the materials used for the concrete mixes is provided below in Table 21.
AMS
(37%)
AMS
(44%)
AM
S c
uri
ng
2 mm 2 mm

58
Table 21. Material used for concrete mixes.
Coarse aggregate
Type River gravel
Top size 1.0 in
Bulk specific gravity (SSD) 2.50
Absorption capacity 2.07 %
Los Angeles abrasion value 34%
Fine aggregate
Fineness modulus 2.86
Absorption capacity 1.24%
Bulk specific gravity (SSD) 2.62
Cement
Type ASTM Type I Portland
Chemical Admixtures
Air Entrainer CATEXOL AE 360
Superplasticizer Sikament SPMN
The standard PennDOT mix followed the requirements given in Section 704.1 of the 408
Standard Specification. The requirements from the specification for Type AA (paving) concrete
are summarized in Table 22.
Table 22. PennDOT Specification for concrete paving mixes.
Criteria Value
Water/cement ratio 0.47
Slump, in <51
Entrained air content 4.5% to 7.5%
Min. 28-day
compressive strength
3500 psi
Minimum cement
content
587.5 lbs/yd3
1 Pennsylvania’s requirement states that the slump be less than 5 inches for all concrete
but can be less than 6.5 inches for concrete containing a water reducing admixture, and
less than 8 inches for concrete containing a superplasticizer.
The aggregate gradation required for PennDOT paving projects follows a standard AASHTO
No. 57 gradation and is provided in Table 23. However, the only exception from the standard
gradation is that for paving concrete, a minimum of 35% must pass the ½ in sieve.

59
Table 23. Coarse aggregate gradations for PennDOT paving projects.
Sieve Size Percent Passing
1 ½ in 100
1 ¼ in
1 in 95-100
¾ in
½ in 35-60
3/8 in
No. 4 0-10
No. 8 0-5
The revised mix also fell within these specifications but additional constraints were imposed. A
lower w/c ratio of 0.4 was used along with a densely graded Shilstone gradation. A summary of
both mix designs is given in Table 24.
Table 24. Mix design for the two mixes considered, per cubic yard.
PennDOT Mix Revised Mix
W/c ratio 0.47 0.4
Target air content, % 6 6
Target slump, in 5 2.5
Water, lbs/yd3 276 232
Cement, lbs/yd3 588 580
Air Entrainer, oz/ yd3 8.81 10.44
Superplasticizer, oz/ yd3 --- 87
Fine aggregate, lbs/yd3 881 1330
Coarse aggregate, lbs/yd3 1962 1903
The two aggregate gradations used for the standard mix design and the revised mix design are
given in Table 25. Their location on the Shilstone coarseness factor chart is shown in Figure 43.

60
Table 25. Aggregate gradations used for the PennDOT and the revised mixes.
CA Gradation for the Revised
Mix
CA Gradation for the PennDOT
Mix
Sieve
size % passing
Cumulative
% retained
%
retained % passing
Cumulative
% retained
%
retained
1.5 in 100 0 100 0
1 in 97.86 2.14 2.14 96.98 3.02 3.02
0.75 in 86.59 13.41 11.26 81.1 18.9 15.88
0.5 in 70.15 29.85 16.44 57.93 42.07 23.17
0.375 in 59.71 40.29 10.44 43.22 56.78 14.71
No 4 46.93 53.07 12.79 34.21 65.79 9.01
No 8 36.51 63.49 10.42 24.89 75.11 9.32
No 16 28.58 71.42 7.92 19.49 80.51 5.4
No 30 19.19 80.81 9.4 13.08 86.92 6.41
No 50 6 94 13.19 4.09 95.91 8.99
No 100 1.21 98.79 4.79 0.83 99.17 3.26
No 200 0.4 99.6 0.81 0.27 99.73 0.55

61
Figure 43. Location of aggregate gradations on Shilestone coarseness factor chart.
Test batches were made and the admixture dosage rates were adjusted until the target slump and
air content were reached for each mixture design. Three types of specimens were then cast from
each mix. Standard 4 in × 8 in cylinders were cast from each to measure both 28-day
compressive strength as well as the elastic modulus for each mix. Additionally, three 4 in × 4 in
× 11 in drying shrinkage beams were cast for each mix to be tested in accordance with
AASHTO T 160: Standard Method of Test for Length Change of Hardened Hydraulic Cement
Mortar and Concrete. Finally, three 3 in × 4 in × 16 in beams were cast for each mix type and
were instrumented with both Geokon 4200 strain gages and Sensirion SHT75 relative humidity
sensors. The strain gages measure both strain and temperature, while the relative humidity
sensors measure both temperature and relative humidity. Each instrumented beam contained one
strain gage and six relative humidity sensors with the dimensions for the layout given in Figure
20
25
30
35
40
45
0102030405060708090100
Wo
rkab
ilit
y F
acto
r, %
Coarseness Factor, %
Coarseness Factor Chart
Standard
Revised
IV
I
IIIII
V
Zone I: Coarse gap-graded tends to segregateZone II: Well graded 2" thru 3/4"Zone II-A: Well-graded aggegate gradation incentiveZone III: 3/4" minus mixtures
IV
I
IIIII
V
Zone IV: Sticky - excessive finesZone V: Rocky - non-plastic
II-A

62
44. The instrumented beam prior to casting is shown in Figure 45 and the instrumented beams
following casting are given in Figure 46.
Figure 44. Location of sensors in instrumented beams.
Figure 45. Typical instrumented beams prior to casting.
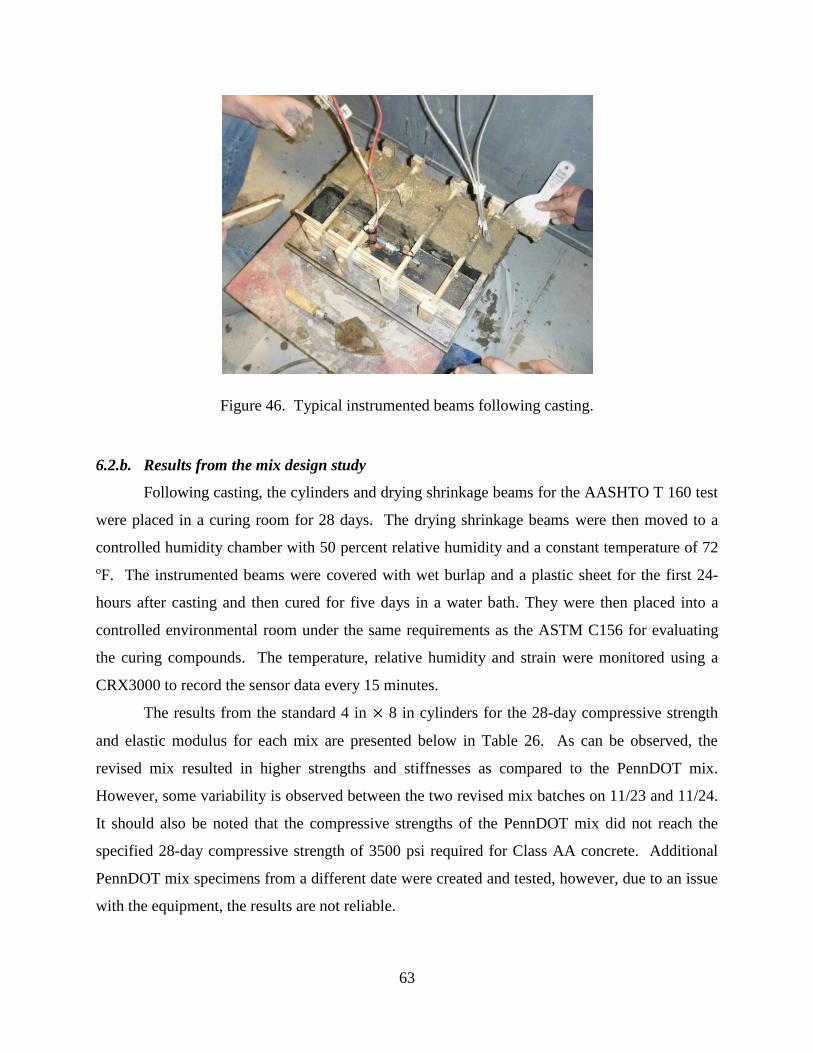
63
Figure 46. Typical instrumented beams following casting.
6.2.b. Results from the mix design study
Following casting, the cylinders and drying shrinkage beams for the AASHTO T 160 test
were placed in a curing room for 28 days. The drying shrinkage beams were then moved to a
controlled humidity chamber with 50 percent relative humidity and a constant temperature of 72
oF. The instrumented beams were covered with wet burlap and a plastic sheet for the first 24-
hours after casting and then cured for five days in a water bath. They were then placed into a
controlled environmental room under the same requirements as the ASTM C156 for evaluating
the curing compounds. The temperature, relative humidity and strain were monitored using a
CRX3000 to record the sensor data every 15 minutes.
The results from the standard 4 in × 8 in cylinders for the 28-day compressive strength
and elastic modulus for each mix are presented below in Table 26. As can be observed, the
revised mix resulted in higher strengths and stiffnesses as compared to the PennDOT mix.
However, some variability is observed between the two revised mix batches on 11/23 and 11/24.
It should also be noted that the compressive strengths of the PennDOT mix did not reach the
specified 28-day compressive strength of 3500 psi required for Class AA concrete. Additional
PennDOT mix specimens from a different date were created and tested, however, due to an issue
with the equipment, the results are not reliable.

64
Table 26. 4 in × 8 in cylinder 28 day test results for Revised and PennDOT mixes.
Revised Mix
11/23
Revised Mix
11/24
PennDOT Mix
11/24
Compressive
strength
Average 4120 psi 4960 psi 3140 psi
Standard deviation 100 psi N/A N/A
Number of samples 4 2 2
Elastic modulus Average 3.4 ×10⁶ psi 4.3 ×10⁶ psi 2.4 ×10⁶ psi
Standard deviation 2.5 ×10⁵ psi N/A N/A
Number of samples 4 1 2
The temperature and relative humidity data for each beam is plotted in Figures 47
through 52. It is important to note that different mixes were cast on different days in order to
randomize the mixing procedures. Therefore, instrumented beams were cast across several days
and the plots have been zeroed by the age of the specimen to when each was cast.
Figure 47. Temperature and humidity data for Beam 1 of the PennDOT mix.

65
Figure 48. Temperature and humidity data for Beam 2 of the PennDOT mix.
Figure 49. Temperature and humidity data for Beam 3 of the PennDOT mix.
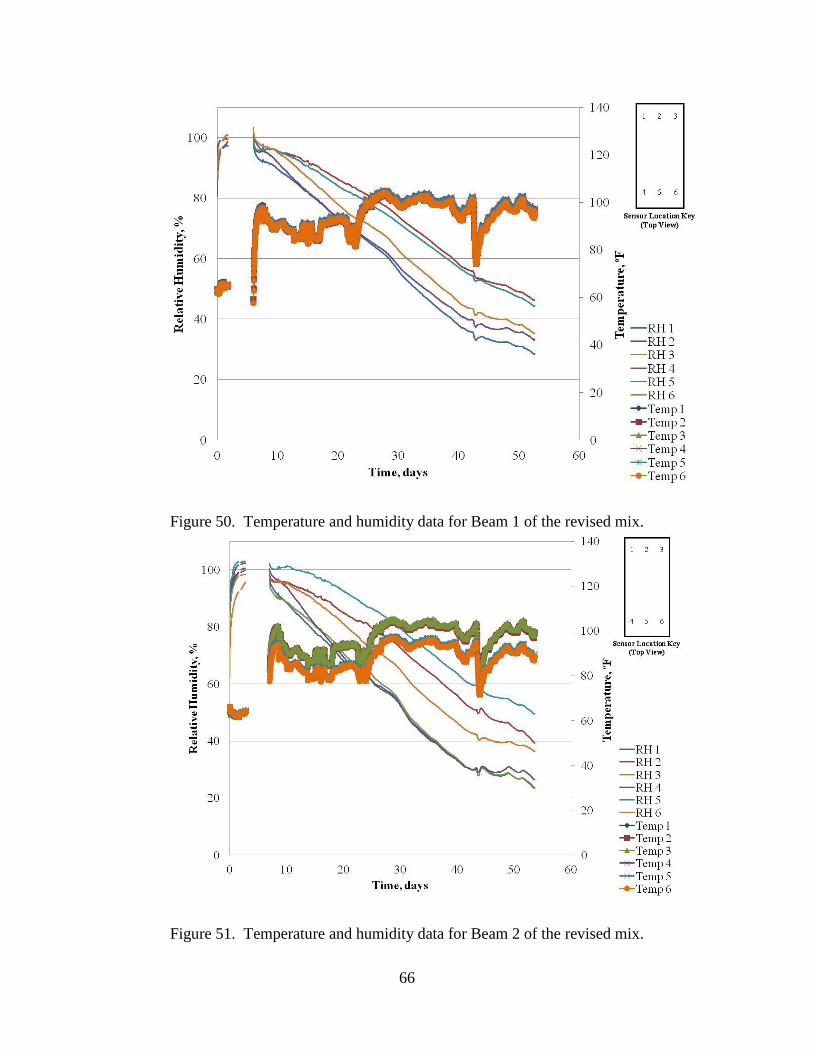
66
Figure 50. Temperature and humidity data for Beam 1 of the revised mix.
Figure 51. Temperature and humidity data for Beam 2 of the revised mix.

67
Figure 52. Temperature and humidity data for Beam 3 of the revised mix.
It can be seen in these figures that the relative humidity is initially 100 percent when
originally cast and then decreases over time due to the high temperature and low relative
humidity in the curing chamber. The sensors show the relative humidity in the central portion of
the beam to be higher than that measured near the surface. As the beams continue to be exposed
to these conditions in the chamber, the moisture content in the beam will become constant.
These specimens can then be re-exposed to wet conditions so that the recoverable drying
shrinkage can be established for each mixture design. Therefore, all results thus far only
represent the total strain, and currently there is no method of knowing the portion of recoverable
strain.
It should be noted that the placement of the beams within the controlled environmental
room had some effect on the results. Due to limitations of the cord lengths of the relative
humidity sensors, the specimens were located near the door of the environmental room which
resulted in some observed temperature fluctuation over the course of the experiment. Therefore,
while the relative humidity measurements on either edge of the instrumented beam should be
theoretically very close, a gradient present due to the exposure conditions for the PennDOT mix
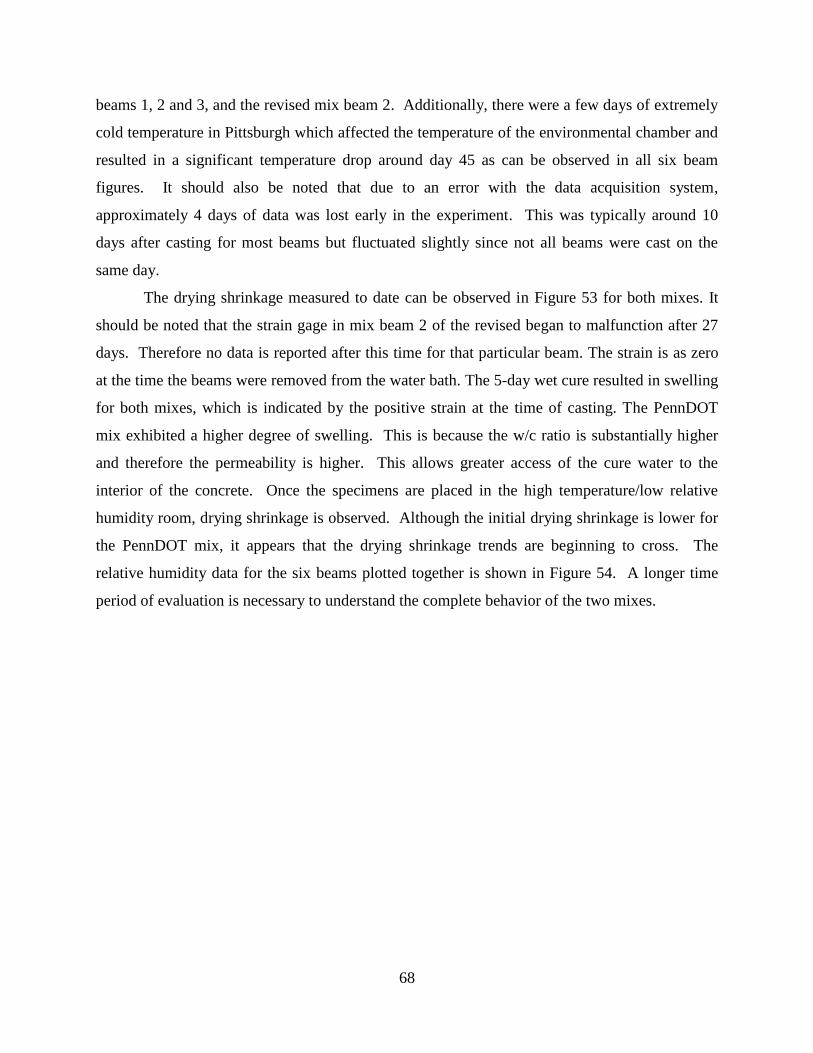
68
beams 1, 2 and 3, and the revised mix beam 2. Additionally, there were a few days of extremely
cold temperature in Pittsburgh which affected the temperature of the environmental chamber and
resulted in a significant temperature drop around day 45 as can be observed in all six beam
figures. It should also be noted that due to an error with the data acquisition system,
approximately 4 days of data was lost early in the experiment. This was typically around 10
days after casting for most beams but fluctuated slightly since not all beams were cast on the
same day.
The drying shrinkage measured to date can be observed in Figure 53 for both mixes. It
should be noted that the strain gage in mix beam 2 of the revised began to malfunction after 27
days. Therefore no data is reported after this time for that particular beam. The strain is as zero
at the time the beams were removed from the water bath. The 5-day wet cure resulted in swelling
for both mixes, which is indicated by the positive strain at the time of casting. The PennDOT
mix exhibited a higher degree of swelling. This is because the w/c ratio is substantially higher
and therefore the permeability is higher. This allows greater access of the cure water to the
interior of the concrete. Once the specimens are placed in the high temperature/low relative
humidity room, drying shrinkage is observed. Although the initial drying shrinkage is lower for
the PennDOT mix, it appears that the drying shrinkage trends are beginning to cross. The
relative humidity data for the six beams plotted together is shown in Figure 54. A longer time
period of evaluation is necessary to understand the complete behavior of the two mixes.
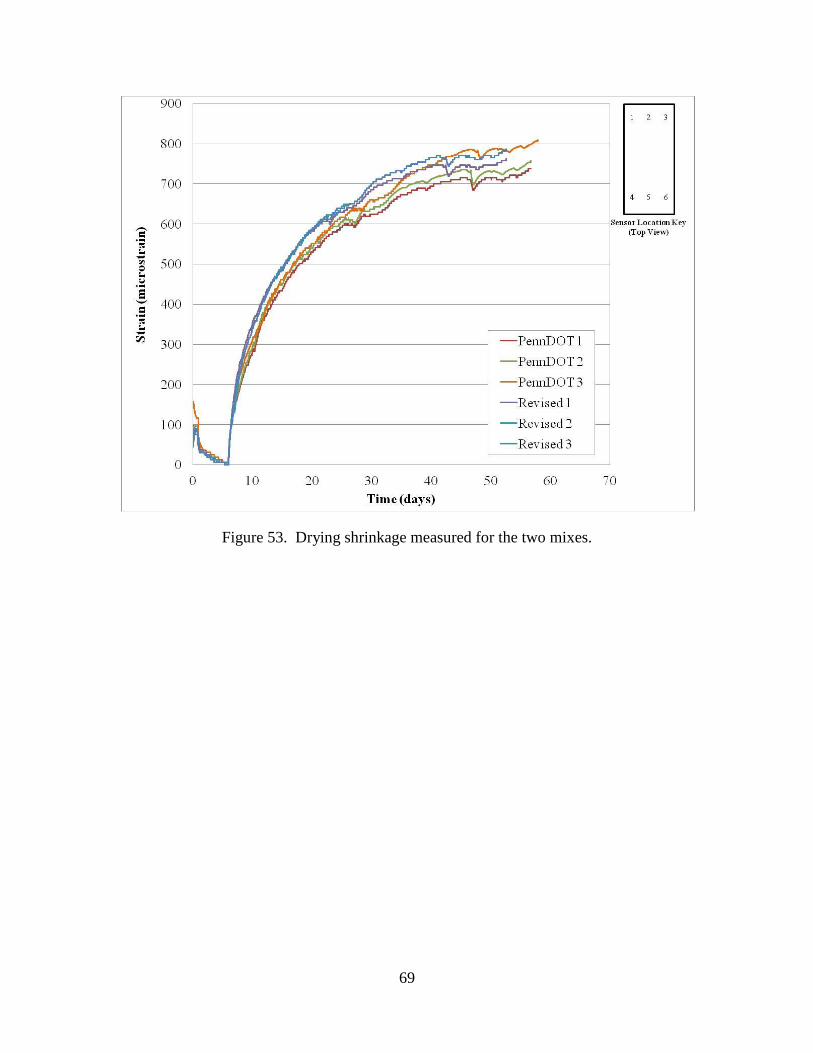
69
Figure 53. Drying shrinkage measured for the two mixes.

70
Figure 54. Relative humidity measured for the two mixes.
Figure 55 presents the difference in strain between the PennDOT and revised mix
designs. The average strain values from the three beams of each mix design was then used and
the difference was determined by subtracting the average for the revised beams from the average
of the PennDOT beams. The strain in the beams made with the PennDOT mix was higher than
the revised mix beams for the first 6 days. This indicated that the PennDOT mix beams showed
more swelling in the water bath than the revised mix beams. When the beams were removed
from the water bath and placed in the climate controlled environment, the average strain in the
revised mix beams increased faster than the average strain in the PennDOT mix beams for four
days. Ten days after paving the average strain in the revised mix beams was 60 microstrain
larger than the average strain in the PennDOT mix beams. From this time forward, the average
strain in the revised mix beams has been increasing slower than the PennDOT mix beams. It can
be seen in Figure 55 that the difference in strain between the revised mix and PennDOT mix is
decreasing with time and it appears that the drying shrinkage for the PennDOT will eventually
exceed that for the revised mix. It should be noted that this experiment has only considered the
71
total strain, and has made no distinction between recoverable and non-recoverable shrinkage
strain.
Figure 55. Difference in strain between the revised and PennDOT mixes.
7. RECOMMENDATIONS
As a result of the work performed under this project, the following recommendations are being
made regarding the current specifications and guidelines for Portland cement concrete
pavements. First the recommendations regarding construction will be presented followed by
recommendations for revising the concrete mix design used for slip form paving.

72
7.1 Construction
7.1.2 Concrete finishing
The use of a wet burlap drag behind the paver should be discontinued. The wet burlap is being
used to add a significant amount of moisture to the surface, which results in excess bleed water
being worked into the pavement surface. The excess surface water increases the w/cm ratio on
the surface, which increases the potential for plastic shrinkage cracking and a nondurable
wearing surface. Proper curing should include avoiding the addition of water to the pavement
surface to aid in finishing.
7.1.2 Curing
The current specification for curing compounds could be improved by including additional
requirements outside the straightforward testing requirements outlined in ASTM C309 for
percent solids, water retention, reflectance, and settling rate as some states have already included
these requirements. Additionally, the above study showed the use of poly alpha methylstyrene
resin improved the water retention characteristics. It is suggested that this resin be specified in
the future. The requirements shown in Table 27 should be incorporated into future
specifications. Greater attention should also be paid to the application rate actually being used in
the field. Finally, it has been shown in previous studies that after a 6-month shelf-life these
curing componds settle to the solids can no longer be suspended through agitation. Most
manufacturers also recommend a 6 month shelf life. It is recommended that this be enforced by
PennDOT. Another concern is that if is stored for over 6 months, there is a likelihood it could
have been stored outside and froze. This also reduces its effectiveness and should be avoided.
Table 27. Requirement for poly alpha methylstyrene curing compound.
Total Solids (% by weight of compound): 42 minimum
% Reflectance in 72 hours (ASTM E1347) 65 minimum
Loss of Water, lb/s.f. in 24 hours (ASTM C156) 0.03 maximum
Loss of Water, lb/s.f. in 72 hours (ASTM C156) 0.08 maximum
VOC content (lb/gal) 2.93 maximum
Infrared Spectrum, Vehicle 100% poly alpha methylstyrene

73
The use of hand wand sprayers is currently not allowed for mainline paving operations as control
of the application rate as well as the uniformity of cover is exceedingly difficult to control.
However, this is not being enforced in the field and a better attempt should be made to adhere to
this specification. The hand wand may still be the best alternative for certain applications, such
as spall repairs, concrete patching, and mountable curb and islands. In such cases, the
specifications should require strict guidance on how much compound should be used for certain
surface areas to avoid obtaining an uneven misting of the surface.
7.2 Mixture Design
7.2.a Aggregate gradation
Using a more uniformly graded coarse aggregate along with a lower w/cm ratio and cement
content will help reduce the potential for segregation and drying shrinkage and make the
concrete more durable. Currently most of the midsize aggregate is commonly scalped from the
aggregates used for concrete paving so that it can be used in asphalt concrete mixes. Retaining
this material so that the aggregate is more densely graded reduces the potential for segregation
and the paste demand, thereby increasing the durability. The Shilstone method can be used to
characterize the aggregate gradation. Using gradations that fall within Zone II on the workability
coarseness factor chart will reduce the cement demand needed to achieve the desired workability.
Reducing the cement content will reduce drying shrinkage and increase durability.
7.2.b w/cm ratio
Reducing the allowable w/cm ratio will reduce the porosity of the paste and therefore increase
the durability but increase the importance of proper curing. The durability can also be increased
by decreasing the paste to aggregate ratio. The maximum w/cm ratio of 0.40 should be targeted
with it not exceeding 0.42 or dropping below 0.38 for all Class AA concrete.

74
References
Atkins, H. N. (1997). Highway Materials, Soils, and Concretes. Prentice Hall, Inc. Upper Saddle
River, New Jersey.
Construction Manual (2011). Connecticut Department of Transportation Bureau of Engineering
and Construction, Office of Construction. Hartford, Connecticut.
Construction and Materials Specifications (2010). State of Ohio Department of Transportation,
Columbus, Ohio.
Janssen, D. (1986). Moisture in Portland cement concrete. Transportation Research Record
1121.
Kosmatka, S.H., B. Kerkhoff, and W.C. Paranese. (2002). Design and Control of Concrete
Mixtures. Portland Cement Association, Skokie, Illinois.
Maryland Department of Transportation State Highway Administration, Baltimore, Maryland.
Standard Specifications for Construction (2003). Michigan Department of Transportation,
Lansing, Michigan.
Materials Lab Supplemental Specifications for Construction (2014). Minnesota Department of
Transportation, St. Paul, Minnesota.
Menzel, C. A. (1954). Causes and Prevention of Crack Development in Plastic Concrete.
Proceedings of the Annual Meeting, Portland Cement Association, Skokie, Illinois.
Mindess, S., J. F. Young, and D. Darwin. (2003). Concrete, Prentice-Hall, Inc. Upper Saddle
River, New Jersey.
Nassiri, S. and J. Vandenbossche (2011), Establish Inputs for the New Rigid Component of the
Mechanistic-Empirical Pavement Design Guide (MEPDG)-Final Report, Contract 510601-PIT
013, Pennsylvania Department of Transportation, Harrisburg, PA.
Oregon Standard Specifications for Construction (2008) Oregon Department of Transportation,
Salem, Oregon.
Page, C.L., and M.M. Page. (2007). Durability of Concrete and Cement Composites. Woodhead
Publishing Limited, Cambridge, England.

75
Pennsylvania Publication 408: Construction Specifications (2013). Commonwealth of
Pennsylvania Department of Transportation, Harrisburg, Pennsylvania.
Ramirez, L., M. Geary, J. M. Vandenbossche, K. Gatti and F. Mu (2011), Premature
Deterioration of Jointed Plain Concrete Pavements. Commonwealth of Pennsylvania Department
of Transportation Contract 510601 Work Order 012..
Road and Bridge Specifications (2007). Virginia Department of Transportation, Richmond,
Virginia.
Roper, H. (1960). Volume Changes of Concrete Affected by Aggregate Type, Research
Department Bulletin RX 123, Portland Cement Association, Skokie, Illinois.
Standard Specifications (2010). State of California Business, Transportation and Housing
Agency Department of Transportation. Sacramento, California.
Standard Specifications (2002). State of Maine Department of Transportation. Augusta, Maine.
Standard Specifications (2008). State of New York Department of Transportation, Albany, New
York.
Standard Specifications for Construction (2012). Mississippi Department of Transportation,
Jackson, Mississippi.
Standard Specifications for Construction (2009). Oklahoma Department of Transportation and
Transportation Commission, Oklahoma City, Oklahoma.
Standard Specifications for Construction and Maintenance of Highways, Streets, and Bridges
(2004). Texas Department of Transportation, Austin, Texas.
Standard Specifications Construction of Transportation Systems (2013). Georgia Department of
Transportation. Atlanta, Georgia.
Standard Specifications for Highway Construction (2012). Alabama Department of
Transportation. Montgomery, Alabama.
Standard Specifications for Highway Construction (2013). State of Alaska Department of
Transportation and Public Facilities. Juneau, Alaska.
Standard Specifications for Highway Construction. (2003). Arkansas State Highway and
76
Transportation Department. Little Rock, Arkansas.
Standard Specifications for Highway Construction (2012). Idaho Department of Transportation.
Boise, Idaho.
Standard Specifications for Highway Construction (2007). Nebraska Department of Roads,
Lincoln, Nebraska.
Standard Specifications for Highway Construction (2007). South Carolina Department of
Transportation, Columbia, South Carolina.
Standard Specification for Highway and Bridge Construction (2007). New Mexico Department
of Transportation, Santa Fe, New Mexico.
Standard Specifications: Roads and Bridges (2010). West Virginia Division of Highways,
Charleston, West Virginia.
Standard Specifications for Roads and Bridges (2006). Louisiana Department of Transportation
and Development, Baton Rouge, Louisiana.
Standard Specifications for Roads and Bridges (2004). South Dakota Department of
Transportation, Pierre, South Dakota.
Standard Specifications for Road and Bridge Construction. (2008). Arizona Department of
Transportation. Phoenix, Arizona.
Standard Specifications for Road and Bridge Construction (2011). Colorado Department of
Transportation. Denver, Colorado.
Standard Specifications for Road and Bridge Construction (2001). Delaware Department of
Transportation. Dover, Delaware.
Standard Specifications for Road and Bridge Construction (2014) Florida Department of
Transportation. Tallahassee, Florida
Standard Specifications for Road and Bridge Construction (2012). Illinois Department of
Transportation, Springfield, Illinois.
Standard Specifications for State Road and Bridge Construction (2012). Kansas Department of
Transportation, Topeka, Kansas.

77
Standard Specifications for Road and Bridge Construction (2012). Kentucky Transportation
Cabinet, Frankfort, Kentucky.
Standard Specifications for Road and Bridge Construction (2006). Montana Department of
Transportation and Montana Transportation Commission. Helena, Montana.
Standard Specifications for Road and Bridge Construction (2001). Nevada Department of
Transportation, Carson City, Nevada.
Standard Specifications for Road and Bridge Construction (2010). New Hampshire Department
of Transportation, Concord, New Hampshire.
Standard Specification for Road and Bridge Construction (2007). State of New Jersey
Department of Transportation, Trenton, New Jersey.
Standard Specifications for Roads and Structures. (2012). North Carolina Department of
Transportation, Raleigh, North Carolina.
Standard Specifications for Road and Bridge Construction (2008). North Dakota Department of
Transportation, Bismark, North Dakota.
Standard Specifications for Road and Bridge Construction (2010). Rhode Island Department of
Transportation, Providence, Rhode Island.
Standard Specifications for Road and Bridge Construction (2006). Tennessee Department of
Transportation, Nashville, Tennessee.
Standard Specifications for Road and Bridge Construction (2010). State of Wyoming
Department of Transportation, Cheyenne, Wyoming.
Standard Specifications for Road, Bridge and Municipal Construction (2012). Washington State
Department of Transportation, Olympia, Washington.
Vandenbossche, J. M. (1999) A Review of the Curing Compounds and Application Techniques
Used by the Minnesota Department of Transportation for Concrete Pavements, Minnesota
Department of Transportation Final Report 2001-06. Office of Research Services, St. Paul,
Minnesota.
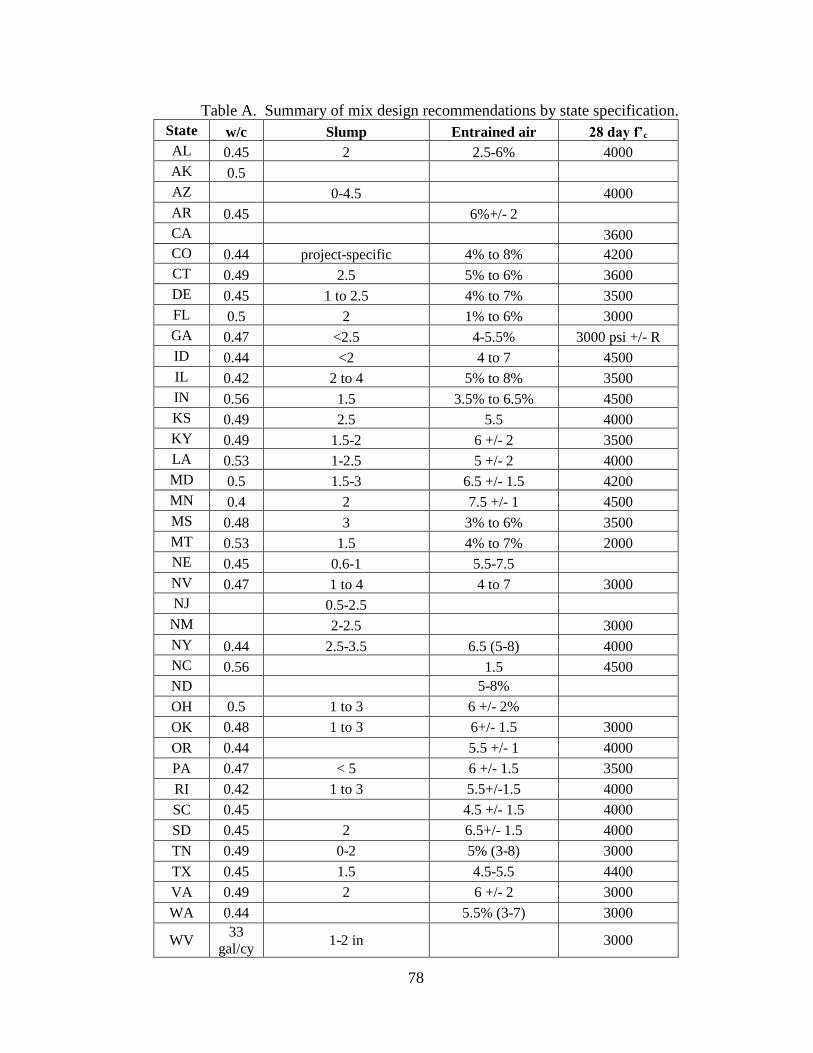
78
Table A. Summary of mix design recommendations by state specification.
State w/c Slump Entrained air 28 day f’c
AL 0.45 2 2.5-6% 4000
AK 0.5
AZ 0-4.5 4000
AR 0.45 6%+/- 2
CA 3600
CO 0.44 project-specific 4% to 8% 4200
CT 0.49 2.5 5% to 6% 3600
DE 0.45 1 to 2.5 4% to 7% 3500
FL 0.5 2 1% to 6% 3000
GA 0.47 <2.5 4-5.5% 3000 psi +/- R
ID 0.44 <2 4 to 7 4500
IL 0.42 2 to 4 5% to 8% 3500
IN 0.56 1.5 3.5% to 6.5% 4500
KS 0.49 2.5 5.5 4000
KY 0.49 1.5-2 6 +/- 2 3500
LA 0.53 1-2.5 5 +/- 2 4000
MD 0.5 1.5-3 6.5 +/- 1.5 4200
MN 0.4 2 7.5 +/- 1 4500
MS 0.48 3 3% to 6% 3500
MT 0.53 1.5 4% to 7% 2000
NE 0.45 0.6-1 5.5-7.5
NV 0.47 1 to 4 4 to 7 3000
NJ 0.5-2.5
NM 2-2.5 3000
NY 0.44 2.5-3.5 6.5 (5-8) 4000
NC 0.56 1.5 4500
ND 5-8%
OH 0.5 1 to 3 6 +/- 2%
OK 0.48 1 to 3 6+/- 1.5 3000
OR 0.44 5.5 +/- 1 4000
PA 0.47 < 5 6 +/- 1.5 3500
RI 0.42 1 to 3 5.5+/-1.5 4000
SC 0.45 4.5 +/- 1.5 4000
SD 0.45 2 6.5+/- 1.5 4000
TN 0.49 0-2 5% (3-8) 3000
TX 0.45 1.5 4.5-5.5 4400
VA 0.49 2 6 +/- 2 3000
WA 0.44 5.5% (3-7) 3000
WV 33
gal/cy 1-2 in 3000

79
Table B. Summary of curing recommendations by state specification.
State Allowable types Liquid forming
membrane cure spec Application rate Texturing Application method Application timeline
AL
Burlap cloth,
waterproof paper,
polyethylene sheet,
impervious membrane
AASHTO M 148,
Class A, Type 2
135 ft2/gallon in 2
applications
burlap drag, then
groove
mechanical sprayers with
fully atomizing type with
tank agitator. Hand
spraying for irregular
areas allowed.
must harden within
30 minutes, must
cure within 30
minutes of paving
AK
burlap cloth, sheet
materials, liquid
membrane forming
compounds
AASHTO M 148,
Type 1 (except linseed
oil)
1 coat, 2 passes,
135-150 ft2/gallon
brush, broom,
burlap drag OR
artifical turf
mechanical sprayers with
fully atomizing type with
tank agitator. Hand
spraying for irregular
areas allowed.
immediately after
finishing operations
and as soon as
surface marring will
not occur
AZ water, liquid
membrane
AASHTO M 148,
Class A, Type 2
1 or more
applications of
100 ft2/gallon
burlap drag,
tines,
calibrated sight glass
curing compound
container
within 15 minutes of
texturing,
AR
polyethylene-burlap
mats, liquid
membrane,
polyethylene sheeting,
copolymer blankets
AASHTO M 148,
Type 2 or Type 1-D 125 ft2/gallon
textured drag
followed by
grooving
mechanical sprayers with
fully atomizing type with
tank agitator. Hand
spraying for irregular
areas allowed.
immediately after
finishing
CA waterproof membrane
or curing compound
ASTM C 309 Type 2
Class B 150 ft2/gallon
burlap drag
followed by steel
tining
Use mechanical sprayers
with operational pressure
gage and the ability to
control the application
pressure.
immediately after
finishing before
moisture sheen
disappears
CO
burlap, impervious
membrane forming
compound, or sheet
AASHTO M 148 Type
2 150 ft2/gallon
plastic turf drag
and longitudinal
metal tining
fully automated spraying
equipment with a tank
agitator and wind guard.
Hand spraying of
irregular widths is
permitted.
within 30 minutes of
finishing
CT
moist curing, cover
sheet, liquid
membrane forming
(perferred)
AASHTO M 148 Type
2, class B OR water-
soluble linseed oil
conforming to Type 2
requirements
1 or 2
applications: 150
ft2/gallon
burlap drag
followed by
metal tining
approved self-propelled
mechanical pressured
sprayer to provide
agitation and to prevent
settlement. Approved
hand-held sprayers
within 30 minutes of
finishing and not
more than 30 minutes
between applications
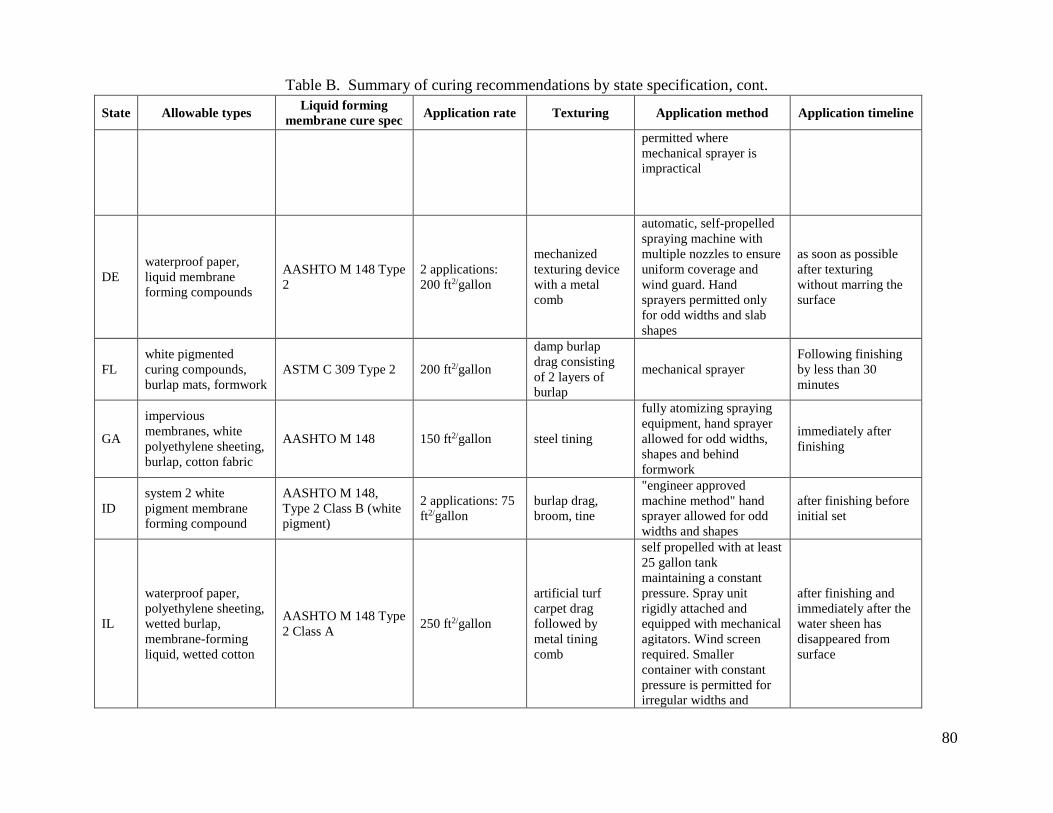
Table B. Summary of curing recommendations by state specification, cont.
80
State Allowable types Liquid forming
membrane cure spec Application rate Texturing Application method Application timeline
permitted where
mechanical sprayer is
impractical
DE
waterproof paper,
liquid membrane
forming compounds
AASHTO M 148 Type
2
2 applications:
200 ft2/gallon
mechanized
texturing device
with a metal
comb
automatic, self-propelled
spraying machine with
multiple nozzles to ensure
uniform coverage and
wind guard. Hand
sprayers permitted only
for odd widths and slab
shapes
as soon as possible
after texturing
without marring the
surface
FL
white pigmented
curing compounds,
burlap mats, formwork
ASTM C 309 Type 2 200 ft2/gallon
damp burlap
drag consisting
of 2 layers of
burlap
mechanical sprayer
Following finishing
by less than 30
minutes
GA
impervious
membranes, white
polyethylene sheeting,
burlap, cotton fabric
AASHTO M 148 150 ft2/gallon steel tining
fully atomizing spraying
equipment, hand sprayer
allowed for odd widths,
shapes and behind
formwork
immediately after
finishing
ID
system 2 white
pigment membrane
forming compound
AASHTO M 148,
Type 2 Class B (white
pigment)
2 applications: 75
ft2/gallon
burlap drag,
broom, tine
"engineer approved
machine method" hand
sprayer allowed for odd
widths and shapes
after finishing before
initial set
IL
waterproof paper,
polyethylene sheeting,
wetted burlap,
membrane-forming
liquid, wetted cotton
AASHTO M 148 Type
2 Class A 250 ft2/gallon
artificial turf
carpet drag
followed by
metal tining
comb
self propelled with at least
25 gallon tank
maintaining a constant
pressure. Spray unit
rigidly attached and
equipped with mechanical
agitators. Wind screen
required. Smaller
container with constant
pressure is permitted for
irregular widths and
after finishing and
immediately after the
water sheen has
disappeared from
surface
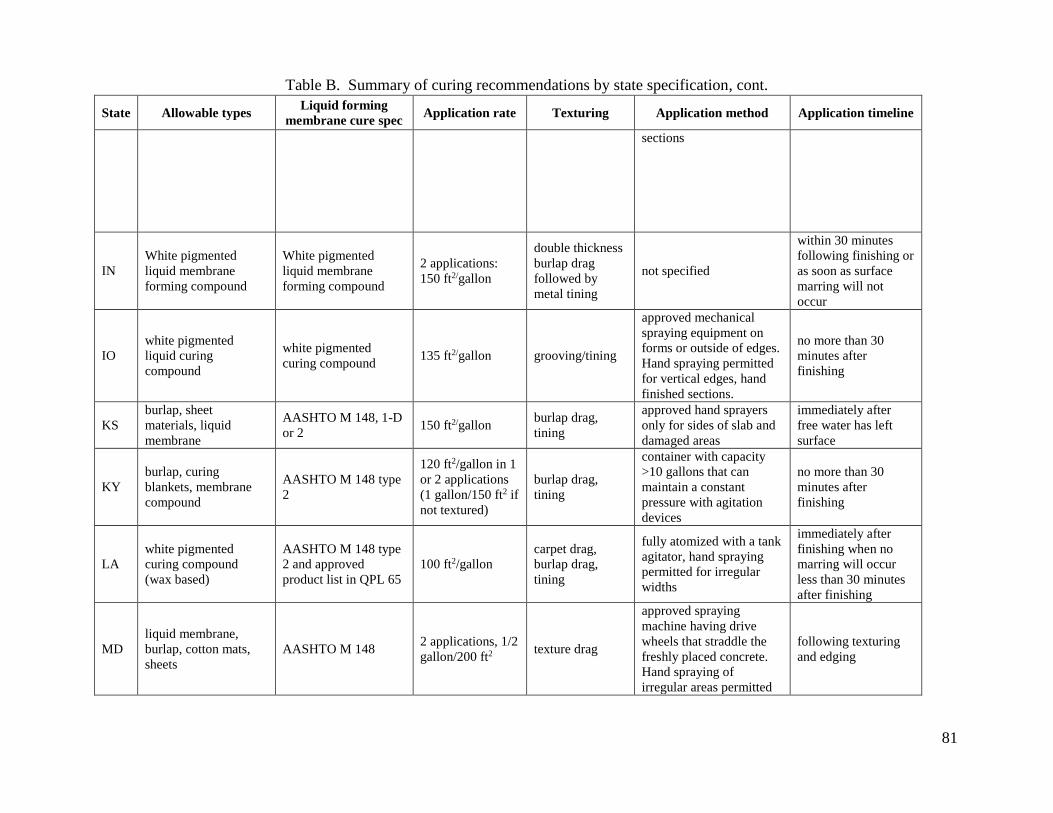
Table B. Summary of curing recommendations by state specification, cont.
81
State Allowable types Liquid forming
membrane cure spec Application rate Texturing Application method Application timeline
sections
IN
White pigmented
liquid membrane
forming compound
White pigmented
liquid membrane
forming compound
2 applications:
150 ft2/gallon
double thickness
burlap drag
followed by
metal tining
not specified
within 30 minutes
following finishing or
as soon as surface
marring will not
occur
IO
white pigmented
liquid curing
compound
white pigmented
curing compound 135 ft2/gallon grooving/tining
approved mechanical
spraying equipment on
forms or outside of edges.
Hand spraying permitted
for vertical edges, hand
finished sections.
no more than 30
minutes after
finishing
KS
burlap, sheet
materials, liquid
membrane
AASHTO M 148, 1-D
or 2 150 ft2/gallon
burlap drag,
tining
approved hand sprayers
only for sides of slab and
damaged areas
immediately after
free water has left
surface
KY
burlap, curing
blankets, membrane
compound
AASHTO M 148 type
2
120 ft2/gallon in 1
or 2 applications
(1 gallon/150 ft2 if
not textured)
burlap drag,
tining
container with capacity
>10 gallons that can
maintain a constant
pressure with agitation
devices
no more than 30
minutes after
finishing
LA
white pigmented
curing compound
(wax based)
AASHTO M 148 type
2 and approved
product list in QPL 65
100 ft2/gallon
carpet drag,
burlap drag,
tining
fully atomized with a tank
agitator, hand spraying
permitted for irregular
widths
immediately after
finishing when no
marring will occur
less than 30 minutes
after finishing
MD
liquid membrane,
burlap, cotton mats,
sheets
AASHTO M 148 2 applications, 1/2
gallon/200 ft2 texture drag
approved spraying
machine having drive
wheels that straddle the
freshly placed concrete.
Hand spraying of
irregular areas permitted
following texturing
and edging

Table B. Summary of curing recommendations by state specification, cont.
82
State Allowable types Liquid forming
membrane cure spec Application rate Texturing Application method Application timeline
MI white membrane
curing ASTM C 309 Type 2
2 applications of 1
gallon/225 ft2 each
drag with 1-2
layers of
approved damp
fabric followed
by grooving
Use mechanical sprayer
for concrete pavement
more than one lane width.
after texturing after
free water has left
surface
MN
linseed oil or
polyalphamethylstyren
e compound, plastic
curing blankets
ASTM C 309 Type 2,
class B: 100%
polyalphamethylstyren
e,
150 ft2/gallon
carpet or broom
drag with
specified texture
depth
fully automatic, self-
propelled mechanical
power sprayer with wind
shield
after finishing
MS burlap, sheeting, liquid
membrane
AASTHO M 148 Type
2 120 ft2/gallon
damp burlap or
cotton fabric
drag, broom, or
belt followed by
tining
fully atomizing type
spraying equipment with
a tank agitator. Hand
spraying permitted for
odd widths.
immediately after
finishing when no
marring will occur
MT membrane only AASTHO M 148 Type
2 150 ft2/gallon
artificial carpet
and burlap drag not specified
immediately after
free water has left
surface
NE liquid membrane,
burlap, sheets
AASTHO M 148 Type
2
200 ft2/gallon in 1
or 2 applications
(1 gallon/135 ft2 if
tined)
burlap, carpet, or
canvas texturing
drag, tining
approved mechanical
sprayer, hand power is
permitted in an
emergency and on narrow
or variable width sections
immediately after
free water has left
surface
NV
white pigmented wax-
based curing
compound, membrane
material
ASTM C 309 Type 2
A
150 ft2/gallon in 2
applications burlap drag
power operated spraying
equipment with an
operational pressure gage
to control the pressure
immediately after
free water has left
surface
NH
cotton mats, water,
burlap, liquid curing
compound, sheets
AASHTO M 148 Type
1D or 2, class B 200 ft2/gallon not specified
NJ curing compound, wet
burlap, sheeting
AASHTO M 148 Type
1D
200 ft2/gallon: 2
applications of
100 ft2/gallon
each
broom not specified
after float finishing
when marring will
not occur, applied
within 30 minutes
NM curing compound,
sheet materials
AASHTO M 148 Type
1D or 2, class B
as recommended
by manufacturer
tining or
grooving
pressure tank or pump
with a feed tank agitator
and a thoroughly
atomizing nozzle
immediately after
finishing as soon as
possible

Table B. Summary of curing recommendations by state specification, cont.
83
State Allowable types Liquid forming
membrane cure spec Application rate Texturing Application method Application timeline
NY
white pigmented
curing
compound,curing
cover
drying: within 4 hrs,
min temp 40 F.
permeability
<=0.04g/cm2/3 days.
Reflectance = 60%,
durability = intact for
7 days before powdery
150 ft2/gallon artificial turf
drag, tining
atomized mechanical
sprayers with consistent
pressure without hand
pumping equipped with
tank agitators to
continuously mix the
curing compound. Self-
propelled for slipform
paving.
apply to freshly
placed, damp
concrete
NC
curing compound,
burlap, polyethylene
sheeting
AASTHO M 148 Type
2 except water
retention test
AASHTO T 155
restricts water loss to
not more than 0.007
oz/in2
150 ft2/gallon burlap drag and
steel tining not specified
immediately after
free water has left
surface
ND wetted fabric or
impervious membrane
AASHTO M 148 Type
2, Class B white
pigmented.
Polyalphamethylstyren
e: total solids>-42%,
65% reflectance in 72
hrs, max 0.15 kg,m2
water loss in 24 hrs
and 0.40 in 72 hrs,
VOC < 350 and
Infrared show 100%
alpha=-methylstyrene
150 ft2/gallon grass carpet,
metal tining
self-powered machine
with a mechanical
pressure distribution
system. Hand sprayer may
be used for pavement
sides or areas where a
machine is impractical
immediately after
finishing when no
marring will occur
OH
wet burlap, waterproof
paper, polyethylene
sheeting
ASTM C 309 plus:
min 25% solids, water
loss less than 0.15
kg/m2 in 24 hrs and
0.4 at 72 hrs, min
reflectance of 65%,
rate of settling
150 ft2/gallon broom followed
by grooving
self propelled mechanical
sprayer with wind shield.
Agitate compound
thoroughly before use
immediately after
free water has left
surface

Table B. Summary of curing recommendations by state specification, cont.
84
State Allowable types Liquid forming
membrane cure spec Application rate Texturing Application method Application timeline
OK
cotton or bulap mats,
impervious membrane,
white polyethylene
sheeting
AASTHO M 148 Type
2 with at least 65%
reflectance according
to ASTM E 97 and at
least 90% water
retension in
accordance with OHD
L-17
200 ft2/gallon texture drag,
grooving
fully atomizing equipment
with a tank agitator. Hand
sprayer permitted for
vertical surfaces, irregular
areas, and edges
immediately after
finishing when no
marring will occur
OR
impervious membrane
or polyehtylene
sheeting
AASHTO M 148,
Type 2 class A 150 ft2/gallon steel tining mix thoroughly
immediately after
finishing while
concrete is still moist
PA
white polyethylene
sheet, burlap,
polypropylene backed
fiber, liquid membrane
forming curing
compound
AASHTO M 148,
Type 2 (white, but
black allowed if
overlayed)
150 ft2/gallon
provide a
textured finish
with specified
grooves
self-propelled mechanical
spreader with atomizing
spray equipment with a
tank agitator and a wind
hood. Manual spraying
permitted for small or
irregular areas.
immediately after
free water has left
surface
RI
water, curing
compound, waterproof
membrane, forms in
place
non-pigmented
chlorinated rubber
base-clear comforming
to AASHTO m 148
according to
manufacturer's
recommendation
broom, or belt,
or drag finish
power operated atomizing
spray equipment with
operational pressure
gauge and means of
controlling pressure
immediately after
free water has left
surface
SC
burlap cloth,
waterproof paper,
polyethylene sheet,
liquid membrane
forming compounds
AASHTO M 148 Type
2 150 ft2/gallon
grooving by
metal comb
mechanical sprayers
spanning the width of the
pavement for uniform
application with self-
propelled equipment
immediately after
finishing and after
surface water has
disappeared
SD
burlap, liquid
membrane curing,
linseed oil emulsion,
polyethylene sheeting
AASHTO M 148 Type
2 150 ft2/gallon
carpet drag,
tining
mechanical sprayers with
fully atomizing type with
tank agitator. Hand
spraying for irregular
areas allowed.
immediately after
finishing when no
marring will occur
less than 30 minutes
after finishing

Table B. Summary of curing recommendations by state specification, cont.
85
State Allowable types Liquid forming
membrane cure spec Application rate Texturing Application method Application timeline
TN
cotton or burlap mats,
waterproof paper,
impervious
membranes, white
polyethylene sheeting
AASHTO M 148 Type
2
according to
manufacturer's
recommendation
burlap drag,
grooving
Use mechanical sprayers
with operational pressure
gage and the ability to
control the application
pressure.
immediately after
finishing when no
marring will occur
less than 30 minutes
after finishing
TX white pigmented
curing compound
AASHTO M 148 Type
2
2 applications of
180 ft2/gallon
carpet drag,
tining
self-propelled machine
with pressurized spraying
equipment with atomizing
nozzles. Hand spray
allowed for small,
irregular areas
immediately after
texturing after free
moisture has
disappeared. Within
10 minutes of
texturing
VA
waterproof paper,
polyethylene film,
burlap, liquid
membrane curing
compound
White pigmented 100-150 ft2/gallon burlap drag,
tining
mechanical sprayers on
movable bridges with
fully atomizing equipment
with tank agitator and
gage
immediately
following texturing
WA
water, curing
compound,
polyethylene sheet
AASHTO M 148 Type
2 150 ft2/gallon
burlap drag,
broom, tine
pressure tank or pump
type equipped with a feed
tank agitator with two-
line nozzle
immediately after
finishing when no
marring will occur
WV
burlap mats,
waterproof paper,
straw, white
pigmented impervious
compound, white
polyethylene sheet
AASHTO M 148 Type
2 Class A
150 ft2/gallon
(burlap drag) and
125 ft2/gallon
(grooved)
either burlap
drag or groove
finish.
mechanical sprayers with
fully atomizing type with
tank agitator. Hand
spraying for irregular
areas allowed.
immediately after
finishing when no
marring will occur
WY
premium white
impervious curing
compound
AASHTO M 148 Type
2 Class B 150 ft2/gallon
burlap drag
followed by
carpet drag,
brooming, or
tining.
Use a mechanical sprayer after finishing