Improved Inference in Mediation Analysis: Introducing the ...
20
Improved Inference in Mediation Analysis: Introducing the Model-Based Constrained Optimization Procedure Davood Tofighi University of New Mexico Ken Kelley University of Notre Dame Abstract Mediation analysis is an important approach for investigating causal pathways. One approach used in mediation analysis is the test of an indirect effect, which seeks to measure how the effect of an independent variable impacts an outcome variable through 1 or more mediators. However, in many situations the proposed tests of indirect effects, including popular confidence interval-based methods, tend to produce poor Type I error rates when mediation does not occur and, more generally, only allow dichotomous decisions of “not significant” or “significant” with regards to the statistical conclusion. To remedy these issues, we propose a new method, a likelihood ratio test (LRT), that uses nonlinear constraints in what we term the model-based constrained optimization (MBCO) procedure. The MBCO procedure (a) offers a more robust Type I error rate than existing methods; (b) provides a p value, which serves as a continuous measure of compatibility of data with the hypothesized null model (not just a dichotomous reject or fail-to-reject decision rule); (c) allows simple and complex hypotheses about mediation (i.e., 1 or more mediators; different mediational pathways); and (d) allows the mediation model to use observed or latent variables. The MBCO procedure is based on a structural equation modeling framework (even if latent variables are not specified) with specialized fitting routines, namely with the use of nonlinear constraints. We advocate using the MBCO procedure to test hypotheses about an indirect effect in addition to reporting a confidence interval to capture uncertainty about the indirect effect because this combination transcends existing methods. Translational Abstract Mediation analysis has become one of the most important approaches for investigating causal pathways. One instrument used in mediation analysis is a test of indirect effects that seeks to measure how the effect of an independent variable impacts an outcome variable through one or more mediators. However, in many situations the proposed tests of indirect effects, including popular confidence interval-based methods, tend to produce too few or too many false positives (Type I errors) and are commonly used to make only dichotomous decisions about acceptance (“not significant”) or rejection (“significant”) of a null hypothesis. To remedy these issues, we propose a new procedure to test an indirect effect. We call this new procedure the model-based constrained optimization (MBCO) procedure. The MBCO procedure (a) more accurately controls the false positive rate than existing methods; (b) provides a p value, which serves as a continuous measure of compatibility of data with the hypothesized null model (not just a dichotomous reject or fail-to-reject decision rule); (c) allows simple and complex hypotheses about mediation (i.e., one or more mediators; different mediational pathways); and (d) allows the mediation model to use observed or latent variables common in psychological research. We advocate using the MBCO procedure to test hypotheses about an indirect effect in addition to reporting a confidence interval to capture uncertainty about the indirect effect. Keywords: indirect effect, mediation analysis, confidence interval, likelihood ratio, model-comparison test Supplemental materials: http://dx.doi.org/10.1037/met0000259.supp Mediation analysis has become one of the most important and widely used methods to study causal mechanisms in psychology, management, education, and other related fields (e.g., Ato García, Vallejo Seco, & Ato Lozano, 2014; Boies, Fiset, & Gill, 2015; Bulls et al., 2017; Carmeli, McKay, & Kaufman, 2014; Dekovic ´, Asscher, Manders, Prins, & van der Laan, 2012; Ernsting, Knoll, Schneider, & Schwarzer, 2015; Graça, Calheiros, & Oliveira, 2016; Haslam, Cruwys, Milne, Kan, & Haslam, 2016; Koning, Maric, MacKinnon, & Vollebergh, 2015; MacKinnon, 2008; Mo- lina et al., 2014). Researchers have proposed several methods to test for the presence of mediation (MacKinnon, Lockwood, Hoff- man, West, & Sheets, 2002), including the widely recommended (a) Monte Carlo confidence interval (CI; MacKinnon, Lockwood, & Williams, 2004; Tofighi & MacKinnon, 2016), also known as parametric bootstrap method (Efron & Tibshirani, 1993); (b) per- This article was published Online First March 19, 2020. X Davood Tofighi, Department of Psychology, University of New Mexico; X Ken Kelley, Department of Information Technology, Analyt- ics, and Operations, University of Notre Dame. Correspondence concerning this article should be addressed to Davood Tofighi, Department of Psychology, University of New Mexico, Logan Hall, MSC03-2220, Albuquerque, NM 87131– 0001. E-mail: [email protected] This document is copyrighted by the American Psychological Association or one of its allied publishers. This article is intended solely for the personal use of the individual user and is not to be disseminated broadly. Psychological Methods © 2020 American Psychological Association 2020, Vol. 25, No. 4, 496 –515 ISSN: 1082-989X http://dx.doi.org/10.1037/met0000259 496
Transcript of Improved Inference in Mediation Analysis: Introducing the ...

Improved Inference in Mediation Analysis: Introducing the Model-BasedConstrained Optimization Procedure
Davood TofighiUniversity of New Mexico
Ken KelleyUniversity of Notre Dame
AbstractMediation analysis is an important approach for investigating causal pathways. One approach used inmediation analysis is the test of an indirect effect, which seeks to measure how the effect of an independentvariable impacts an outcome variable through 1 or more mediators. However, in many situations the proposedtests of indirect effects, including popular confidence interval-based methods, tend to produce poor Type Ierror rates when mediation does not occur and, more generally, only allow dichotomous decisions of “notsignificant” or “significant” with regards to the statistical conclusion. To remedy these issues, we propose anew method, a likelihood ratio test (LRT), that uses nonlinear constraints in what we term the model-basedconstrained optimization (MBCO) procedure. The MBCO procedure (a) offers a more robust Type I error ratethan existing methods; (b) provides a p value, which serves as a continuous measure of compatibility of datawith the hypothesized null model (not just a dichotomous reject or fail-to-reject decision rule); (c) allowssimple and complex hypotheses about mediation (i.e., 1 or more mediators; different mediational pathways);and (d) allows the mediation model to use observed or latent variables. The MBCO procedure is based on astructural equation modeling framework (even if latent variables are not specified) with specialized fittingroutines, namely with the use of nonlinear constraints. We advocate using the MBCO procedure to testhypotheses about an indirect effect in addition to reporting a confidence interval to capture uncertainty aboutthe indirect effect because this combination transcends existing methods.
Translational AbstractMediation analysis has become one of the most important approaches for investigating causal pathways. Oneinstrument used in mediation analysis is a test of indirect effects that seeks to measure how the effect of anindependent variable impacts an outcome variable through one or more mediators. However, in manysituations the proposed tests of indirect effects, including popular confidence interval-based methods, tend toproduce too few or too many false positives (Type I errors) and are commonly used to make only dichotomousdecisions about acceptance (“not significant”) or rejection (“significant”) of a null hypothesis. To remedy theseissues, we propose a new procedure to test an indirect effect. We call this new procedure the model-basedconstrained optimization (MBCO) procedure. The MBCO procedure (a) more accurately controls the falsepositive rate than existing methods; (b) provides a p value, which serves as a continuous measure ofcompatibility of data with the hypothesized null model (not just a dichotomous reject or fail-to-reject decisionrule); (c) allows simple and complex hypotheses about mediation (i.e., one or more mediators; differentmediational pathways); and (d) allows the mediation model to use observed or latent variables common inpsychological research. We advocate using the MBCO procedure to test hypotheses about an indirect effectin addition to reporting a confidence interval to capture uncertainty about the indirect effect.
Keywords: indirect effect, mediation analysis, confidence interval, likelihood ratio, model-comparison test
Supplemental materials: http://dx.doi.org/10.1037/met0000259.supp
Mediation analysis has become one of the most important andwidely used methods to study causal mechanisms in psychology,management, education, and other related fields (e.g., Ato García,
Vallejo Seco, & Ato Lozano, 2014; Boies, Fiset, & Gill, 2015;Bulls et al., 2017; Carmeli, McKay, & Kaufman, 2014; Dekovic,Asscher, Manders, Prins, & van der Laan, 2012; Ernsting, Knoll,Schneider, & Schwarzer, 2015; Graça, Calheiros, & Oliveira,2016; Haslam, Cruwys, Milne, Kan, & Haslam, 2016; Koning,Maric, MacKinnon, & Vollebergh, 2015; MacKinnon, 2008; Mo-lina et al., 2014). Researchers have proposed several methods totest for the presence of mediation (MacKinnon, Lockwood, Hoff-man, West, & Sheets, 2002), including the widely recommended(a) Monte Carlo confidence interval (CI; MacKinnon, Lockwood,& Williams, 2004; Tofighi & MacKinnon, 2016), also known asparametric bootstrap method (Efron & Tibshirani, 1993); (b) per-
This article was published Online First March 19, 2020.X Davood Tofighi, Department of Psychology, University of New
Mexico; X Ken Kelley, Department of Information Technology, Analyt-ics, and Operations, University of Notre Dame.
Correspondence concerning this article should be addressed to DavoodTofighi, Department of Psychology, University of New Mexico, Logan Hall,MSC03-2220, Albuquerque, NM 87131–0001. E-mail: [email protected]
Thi
sdo
cum
ent
isco
pyri
ghte
dby
the
Am
eric
anPs
ycho
logi
cal
Ass
ocia
tion
oron
eof
itsal
lied
publ
ishe
rs.
Thi
sar
ticle
isin
tend
edso
lely
for
the
pers
onal
use
ofth
ein
divi
dual
user
and
isno
tto
bedi
ssem
inat
edbr
oadl
y.
Psychological Methods© 2020 American Psychological Association 2020, Vol. 25, No. 4, 496–515ISSN: 1082-989X http://dx.doi.org/10.1037/met0000259
496

centile and bias-corrected (BC) bootstrap resampling CI (Bollen &Stine, 1990; Efron & Tibshirani, 1993; MacKinnon et al., 2004;Shrout & Bolger, 2002); (c) profile-likelihood CI method (Folmer,1981; Neale & Miller, 1997; Pawitan, 2001; Pek & Wu, 2015); and(d) joint significance test (Kenny, Kashy, & Bolger, 1998; MacK-innon et al., 2002). Henceforth, we will use the term CI-basedmethods to emphasize a dual role that CIs have played in themediation analysis literature. In addition to providing a range ofplausible values for a population indirect effect, CIs have alsocontroversially been used to test the null hypothesis of no medi-ation (i.e., a zero indirect effect) at the � level with a (1-�) 100%CI. However, testing an indirect effect is complicated because theindirect effect is the product of the coefficients along the mediationchain (MacKinnon, 2008). Further, each of the methods mentionedearlier has key limitations, many of which researchers commonlyencounter. Thus, even though these procedures are currently rec-ommended, that recommendation in research is questionable.
Many popular testing methods in mediation models are limitedbecause they lack robustness of the observed Type I error rate.That is, the empirical probability of falsely rejecting the nullhypothesis about an indirect effect does not equal, and can fre-quently fall outside of, a robustness interval for the Type I errorrate, such as Bradley’s (1978) liberal interval [0.5�, 1.5�], where� is the nominal significance level (Biesanz, Falk, & Savalei,2010; Tofighi & Kelley, 2019). The idea of using .025–.075 as anacceptable departure from the idealized properties of the statisticalprocedures, when � � .05, acknowledges that a null hypothesisprocedure may not work perfectly but is still useful. Bradley’s(1978) liberal criterion accepts a procedure as robust when violationsof the model’s assumptions are small enough not to fundamentallychange the statistical conclusion. The importance of the conclusion inthe context of mediation, for example, is when sample size is less than100 and � � .05. Several methods, including widely recommendedCI-based methods, can result in Type I error rates that fall outside ofBradley’s liberal interval [0.025 .075] (Tofighi & Kelley, 2019) andare, therefore, unsatisfactory. We propose a method that is morerobust than other procedures because it better satisfies Bradley’s(1978) liberal criterion and has desirable statistical properties thatallow its wide use, including in situations beyond which existingmethods are applicable.
Currently used methods of testing mediation are limited becausethese tests are commonly used to make only dichotomous deci-sions about acceptance (“not significant”) or rejection (“signifi-cant”) of a null hypothesis. These dichotomous decisions providea false sense of certainty about a model and data and are notgenerally recommended (Amrhein, Trafimow, & Greenland, 2019;Wasserstein, Schirm, & Lazar, 2019). Further, these methods donot offer either a p value, a continuous measure of compatibilitybetween data and the null hypothesis (Greenland et al., 2016), oran additional means of measuring statistical evidence, such as alikelihood ratio (Blume, 2002). As recommended by Wilkinsonand the Task Force on Statistical Inference, American Psycholog-ical Association, Science Directorate (1999), reporting exact pvalues, CIs, and effect sizes, and not just noting “reject” or“fail-to-reject” is the ideal for science to progress. None of theCI-based tests, by their very nature, offers additional ways ofevaluating the strength of evidence against a null hypothesis of nomediation. A likelihood ratio, however, is a continuous measurethat can compare the goodness of fit of two competing models
under standard assumptions, as measured by the ratio of themodels’ maximized likelihoods. One model, a null model, repre-sents and satisfies the null hypothesis of no mediation (e.g., zeroindirect effect), and the other model, a full model, shows thatmediation does occur, as posited by a researcher (e.g., the indirecteffect is nonzero). Further, a likelihood value can be used tocompute information fit indices, such as Akaike information cri-terion (AIC; Akaike, 1974) and Bayesian information criterion(BIC; Schwarz, 1978); such indices compare the fit of the full andnull models while penalizing each model for a lack of parsimony(i.e., the number of model parameters).
To address these limitations, we propose a model-based con-strained optimization (MBCO) method as a new procedure that testsany function representing an indirect effect1 and that provides aformal way to recast testing simple and complex hypotheses about anindirect effect into a model-comparison framework. The MBCOprocedure offers two formal mechanisms to evaluate hypothesesabout indirect effects in the model-comparison framework. First, theMBCO procedure offers a likelihood ratio test (LRT) statistic, whichwe term LRTMBCO, that has a large sample chi-squared distributionand provides a p value to test hypotheses about an indirect effect.Second, the MBCO procedure compares the fit of two models interms of a likelihood ratio and information fit indices, such as the AICand BIC, as well as their generalizations.
In the model-comparison framework, we estimate the null and fullmodels representing different hypotheses about an indirect effectunder a null and an alternative hypothesis, respectively (see Maxwell,Delaney, & Kelley, 2018). A null model represents the null hypoth-esis about the indirect effect. Unlike existing approaches to modelcomparisons, the MBCO procedure can estimate the null mediationmodel by using nonlinear constraints for testing a null hypothesis inmediation models. This innovative application of nonlinear con-straints can be used to test both simple and complex hypotheses inmediation models. The MBCO procedure also allows the indirecteffect of a full model, posited by a researcher, to be freely estimated.For example, a full model is a mediation model shown in Figure 1.Although model comparisons using the likelihood ratio test are com-mon in techniques such as multilevel modeling (Raudenbush & Bryk,2002) and structural equation modeling (SEM; Kline, 2016), in almostall such situations the parameters are subject to linear constraints.Testing indirect effects is problematic because constraining the indi-rect effect, H0: �1�2 � 0, is inherently a nonlinear constraint optimi-zation problem as the constraint is the product of two parameters(Snyman, 2005).
The MBCO procedure offers several advantages over the exist-ing, recommended methods. First, the MBCO procedure offers thetest statistic LRTMBCO that has better statistical properties than thewidely recommended approaches in the literature. This test statis-tic, widely used in statistics, has desirable properties for testingcomplex null hypotheses (Cox & Hinkley, 2000). The LRTMBCO
yields more robust Type I error rates than the currently recom-mended methods when the null hypothesis of no mediation occurs.Second, the MBCO procedure offers researchers multiple ways ofevaluating a null hypothesis of an indirect effect rather than only
1 More formally, a function of model parameters should be a smoothfunction, which is a function that has continuous derivatives up to a desiredorder (Weisstein, 2018).
Thi
sdo
cum
ent
isco
pyri
ghte
dby
the
Am
eric
anPs
ycho
logi
cal
Ass
ocia
tion
oron
eof
itsal
lied
publ
ishe
rs.
Thi
sar
ticle
isin
tend
edso
lely
for
the
pers
onal
use
ofth
ein
divi
dual
user
and
isno
tto
bedi
ssem
inat
edbr
oadl
y.
497IMPROVED INFERENCE IN MEDIATION ANALYSIS

allowing a dichotomous reject or fail conclusion that has beencriticized by researchers (e.g., Cohen, 1994; Harlow, Mulaik, &Steiger, 1997; Wasserstein et al., 2019). The MBCO procedurealso allows researchers to test simple and complex hypotheses fora variety of mediation models involving multiple mediators (ob-served or latent) in a flexible manner. This flexibility aids re-searchers interested in complex causal models that are often pos-ited by theories and can be implemented in an SEM framework.Such flexibility and desirable statistical performance make theMBCO procedure a desirable advancement for mediation studies.To make our proposed method immediately available to research-ers, we provide detailed instructions along with the necessary R (RCore Team, 2019) code (see the online supplemental materials).Nonlinear constraint optimization algorithms to implement theMBCO procedure and to compute the LRTMBCO are alreadyimplemented in at least one R software package, and we expectother software packages to soon make such allowances as well.
The Model-Based Constrained Optimization Procedure
We begin by explaining the MBCO procedure conceptually andthen discussing the required steps required to perform this proce-dure. Without loss of generality, we elaborate on the MBCOprocedure to test the zero indirect effect null hypothesis, H0:�1�2 � 0, for the single-mediator model example (see Figure 1).In the Empirical Example of Using the MBCO Procedure on aComplex Mediation Model section, we discuss extensions of theMBCO procedure to the more elaborate, parallel two-mediatormodel (see Figure 2). In the Simulation Study section, we brieflyextend the MBCO procedure to a sequential two-mediator modeland then compare the performance of the MBCO procedure withthe most commonly used tests of indirect effects for both a single-mediator model and a sequential two-mediator model.
The MBCO procedure recasts hypotheses about indirect effectsinto a model-comparison framework. To illustrate, consider thesingle-mediator model (see Figure 1), which can be represented by thefollowing regression equations:
M � �0M � �1X � εM (1)
Y � �0Y � �2M � �3X � εY, (2)
where �1 is the effect of instruction (X � 1 corresponds toinstruction to use imagery rehearsal; X � 0 corresponds to instruc-tion to use repetition rehearsal) on the use of imagery (imagery);�2 is the effect of imagery on the number of words recalled (recall)controlling for instruction, and �3 is the direct effect of theinstruction on recall controlling for imagery. �0M and �0Y denotethe intercepts while εM and εY are residual terms. The indirecteffect of instruction on recall through imagery is defined aswhether instruction to use imagery increases the use of imageryand then, in turn, increases the number of words participantsrecalled. Under the no-omitted-confounder assumption, which as-sumes that a variable should not be omitted from the model thatwould influence both the mediator and the outcome variables, theindirect effect equals the product of two coefficients, �1�2 (Imai,Keele, & Tingley, 2010; Judd & Kenny, 1981; Valeri & Vander-Weele, 2013; VanderWeele, 2010). Suppose that we are interestedin testing whether the indirect effect of instruction on recallthrough imagery is zero. We can use the following null hypothesisto answer this question:
H0: �1�2 � 0
H1: �1�2 � 0
To recast the hypotheses about the indirect effect into a model-comparison framework, we estimate two mediation models: a full(alternative) model and a null (restricted) model (Maxwell et al.,2018). Which model to estimate first is arbitrary. For our example,the full model is the single-mediator model in (1)–(2). Note thatthe full model does not constrain the value of the indirect effect,�1�2. Next, for the null model, we estimate a mediation model inwhich the indirect effect �1�2 is constrained to equal 0. Both thefull and the null model can be represented by the set of equationsin (1) and (2) with the limitation that �1�2 is constrained to be 0in the null model. The null model is nested within the full model;
Figure 1. An example of a randomized single-mediator model. Instruction (X) is a random assignment with twoconditions: instruction to use mental imagery rehearsal (X � 1) versus instruction to use repetition (X � 0). Imageryis a self-reported score of using mental imagery to memorize words, and recall is the number of words out of a totalof 20 words that each student correctly remembered at the end of the experiment. A solid arrow between two variablesindicates a direct effect of the variable on the left on the other variable. Greek letters denote population values, where�s denote the regression (path) coefficients, with �1 being the treatment effect on imagery, �2 being the partial effectof imagery on recall controlling for treatment effect, and �3 is the partial effect of instruction on recall controlling forimagery. Terms εY and εM denote residuals that are assumed to be normally distributed.
Thi
sdo
cum
ent
isco
pyri
ghte
dby
the
Am
eric
anPs
ycho
logi
cal
Ass
ocia
tion
oron
eof
itsal
lied
publ
ishe
rs.
Thi
sar
ticle
isin
tend
edso
lely
for
the
pers
onal
use
ofth
ein
divi
dual
user
and
isno
tto
bedi
ssem
inat
edbr
oadl
y.
498 TOFIGHI AND KELLEY

that is, by setting the indirect effect to zero in the full model, wewould obtain the null model.
The final step of the MBCO procedure is to formally comparethe two models. One such approach compares the fit of the twomodels by computing LRTMBCO. To compute the LRTMBCO, wefirst calculate the deviance, denoted by D, for each model:
D � �2LL, (3)
where (LL) denotes the log-likelihood. The equation proposes thatdeviance equals twice the negative of the maximum value of thelog-likelihood (LL) of the corresponding model. Deviance is apositive number quantifying the “badness” of fit or the “misfit” ofa model. The larger the value of deviance for the same data set, theworse the fit of the model to that sample data.
Next, we compute the LRTMBCO as the difference between thedeviance for the null and full models. Under the null hypothesis,LRTMBCO has a large sample chi-squared distribution (Wilks,1938) as follows:
LRTMBCO � Dnull � Dfull � �2(df), (4)
where the degrees of freedom, df, equal the difference in the numberof the free parameters between the two models. The larger values ofthe LRTMBCO indicate that the null model, which estimates no indi-rect effect, fits the data worse than does the full model in which theindirect effect is freely estimated. To obtain a p-value for theLRTMBCO, we calculate the upper tail probability from the chi-squared distribution (i.e., the area larger than the observed chi-squaredstatistic) with the specified degrees of freedom. While using a likeli-hood ratio test is standard in SEM, the LRTMBCO uses the nonlinear
constraint of �1�2 � 0 that has not been previously explored fortesting the null hypothesis of no indirect effect. The nonlinear con-straint of �1�2 � 0 is, in fact, much more difficult to implement thanis simply fixing a single parameter to a specified value (such as zero).Because of this nonlinear constraint of �1�2 � 0, specialized algo-rithms must be used (discussed below), which at present are notimplemented in all programs.
Additionally, the MBCO procedure can compare the fit of thenull and full models in terms of information fit indices such as theAIC (Akaike, 1974) or BIC (Schwarz, 1978). Such indices con-sider the fit of the model (as measured by the maximized values oflikelihood for the model) to the data while penalizing the model forestimating more parameters. To clarify, consider the formulas forAIC and BIC:
AIC � D � 2 k (5)
BIC � D � 2 k ln(n), (6)
where k is the number of free parameters (e.g., degrees of freedom)and n is the sample size in a mediation model. Both the AIC andthe BIC penalize estimating more parameters in a model by addingthe term 2 k (for AIC) and 2 k ln(n) (for BIC) to deviance. If twomodels have the same deviance, the AIC favors the model withfewer free parameters (i.e., the more parsimonious model). For theBIC, if two models have the same deviance and sample size, theBIC favors the more parsimonious model. A lower AIC or BICvalue indicates a better fit.
The MBCO procedure and LRTMBCO have not previously beenexplored for testing the null hypothesis of no mediation for a fewreasons. First, the nonlinear constraints require a sophisticatedoptimization algorithm (e.g., Zahery, Maes, & Neale, 2017). Toour knowledge, the only structural equation modeling programsthat are equipped to implement the nonlinear constraint areOpenMx (Boker et al., 2011; Neale et al., 2016) and SAS PROCCALIS (SAS Institute Inc., 2016). Second, researchers commonlyrely on the CI-based tests because other researchers recommendthem (e.g., MacKinnon et al., 2004; Preacher & Hayes, 2008;Shrout & Bolger, 2002). Third, few researchers have realized theinfinite number of ways to realize and test the null hypothesis of noindirect effect, such as H0: �1�2 � 0. For example, �1 can be zerobut �2 may take on any value; �2 can be zero but �1 may take onany value; or �1 and �2 are both zero. Thus, in an infinite numberof ways, mediation does not happen. The MBCO procedure offersflexibility in testing and improvement in evaluating simple andcomplex hypotheses about indirect effects, which we demonstratenext using an empirical example.
Empirical Example of Using the MBCO Procedure ona Complex Mediation Model
The MBCO procedure can be applied to a mediation model withtwo parallel mediators; in fact, the MBCO procedure can test avariety of simple and complex hypotheses about indirect effectsand can offer flexibility in testing and improvement in evaluatingthese hypotheses. Using R (R Core Team, 2019) and the OpenMx(Boker et al., 2011; Neale et al., 2016) package, we apply andillustrate parts of the code and output to a sample problem. Fulldescriptions of the OpenMx code and output are given in theonline supplemental materials.
Figure 2. A randomized parallel (covarying) two-mediator model. In-struction (X) is a random assignment with two conditions: instruction to usemental imagery rehearsal (X � 1) versus instruction to use repetition (X �0). Repetition is a self-reported score of using a repetition rehearsal tomemorize words. Imagery is a self-reported score of using mental imageryto memorize words. Recall is the number of words out of a total of 20words that each student correctly remembered at the end of the experimentand is the outcome variable of interest. A solid arrow from one variable toanother indicates a direct effect of the variable on the other variable. Thecurved double-headed arrow shows covariance between two residual termsassociated with the mediators, εM1 and εM2. The numbers next to eacharrow denote regression (path) coefficient estimates while the numbers inparentheses denote the respective standard errors. The ε terms denoteresiduals, which we assume are normally distributed.
Thi
sdo
cum
ent
isco
pyri
ghte
dby
the
Am
eric
anPs
ycho
logi
cal
Ass
ocia
tion
oron
eof
itsal
lied
publ
ishe
rs.
Thi
sar
ticle
isin
tend
edso
lely
for
the
pers
onal
use
ofth
ein
divi
dual
user
and
isno
tto
bedi
ssem
inat
edbr
oadl
y.
499IMPROVED INFERENCE IN MEDIATION ANALYSIS

MacKinnon, Valente, and Wurpts (2018) discussed a studyon using mental imagery to improve the memorization ofwords. Table 1 shows descriptive statistics for this empiricalexample. Oliver, Bays, and Zabrucky (2016) showed individu-als who are instructed to create mental images of words appearto recall more of them than do individuals who were simplyinstructed to remember the words. MacKinnon et al. (2018)conducted another study to test the mediation hypothesis thatinstructions to participants to create mental images of wordswould increase their using mental imagery and, in turn, wouldincrease the number of words participants recalled (see Figure2). The study was replicated eight times, each with a differentgroup of undergraduate students enrolled in introductory psy-chology courses; the sample sizes were 77, 43, 24, 79, 22, 45,35, and 44. At the beginning of each assessment, the instructorinformed the students that they would hear a number of wordsand that they were to memorize the words using techniquesdescribed in the instructional sheets that they would receive.The students then were randomly assigned to receive instruc-tions on one of two different memorization techniques: repeti-tion or imagery rehearsal. The students who received repetitioninstructions were asked to memorize each word by repeating itto themselves. The students who received imagery instructionswere asked to memorize each word by forming a mental imageof the word along with other words they had heard during theexperiment. For example, upon hearing the word camel andafter hearing the word women, they might imagine a womanriding a camel. The students listened to 20 words with a 10-sinterval to rehearse each word. Ten seconds after hearing thelast word, the students were asked to write down as many wordsas they remembered. Next, the students were all asked to (a)rate the degree to which they formed images of the words inorder to memorize the words using a scale of 1 � not at all to9 � absolutely; and (b) rate the degree to which they memo-rized each word by repetition on a scale of 1 � not at all to 9 �absolutely.
For this mediation model, we were interested in testing thefollowing hypotheses:
Research Question 1: Does the instruction to create mentalimages of words increase use of mental imagery that, in turn,increases the number of words recalled?
Research Question 2: Does the instruction to repeat wordsincrease use of repetition to memorize the words that, in turn,
increases the number of words recalled over and above usingmental imagery?
Research Question 3: Is the indirect effect of instruction tocreate mental images on the number of words recalled throughuse of mental imagery greater than the indirect effect ofinstruction to repeat words on the number of words recalledthrough use of repetition?
To answer each research question, we implemented the MBCOprocedure in three steps:
Step 1: Specify and estimate the full mediation model.Step 2: Specify and estimate the null mediation model.Step 3: Compare fit of the full and null models using the MBCO
procedure.For Research Question 1, we briefly explain OpenMx (Boker et
al., 2011; Neale et al., 2016) syntax for conducting the MBCOprocedure and provide the relevant part of OpenMx code andoutput. For Research Questions 2 and 3, we summarize the MBCOprocedure statistical results.2
Research Question 1
Because we were interested in testing whether the indirect effectof instruction of recall through imagery is different from zero, weanswered this question by using the single-mediator model (seeFigure 1). We briefly introduced the key parts of OpenMx code(Boker et al., 2011; Neale et al., 2016) and R (R Core Team, 2019)and then followed the three steps outlined in the article to imple-ment the MBCO procedure.
Before reporting the formal modeling process, we show a glimpseof the data set and its structure using the glimpse function from thedplyr package (Wickham, François, Henry, & Müller, 2019):
2 All OpenMx scripts for the model along with a detailed explanation areprovided in the online supplemental materials, which can also be found athttps://github.com/quantPsych/mbco. For a comprehensive list of resourcesabout the OpenMx software, we encourage readers to visit the projectwebsite https://openmx.ssri.psu.edu. For a detailed document on eachfunction within R, use the help() function. For example, type help(mxModel) within the R console.
Table 1Means, Standard Deviations, and Correlations With Confidence Intervals
Variable M SD 1 2 3
1. Repetition 6.08 2.842. Recall 12.07 3.4 �.28 [�.37, �.19]3. Imagery 5.66 2.96 �.56 [�.63, �.49] .51 [.43, .58]4. Instruction 0.51 0.5 �.67 [�.72, �.61] .32 [.22, .41] .62 [.55, .68]
Note. M and SD are used to represent mean and standard deviation, respectively. Instruction (X) is a randomassignment with two conditions: instruction to use mental imagery rehearsal (X � 1) versus instruction to userepetition (X � 0). Repetition is a self-reported score of using a repetition rehearsal to memorize words. Imageryis a self-reported score of using mental imagery to memorize words. Recall is the number of words out of a totalof 20 words that each student correctly remembered at the end of the experiment and is the outcome variable ofinterest. Values in square brackets indicate the 95% confidence interval for each correlation.
Thi
sdo
cum
ent
isco
pyri
ghte
dby
the
Am
eric
anPs
ycho
logi
cal
Ass
ocia
tion
oron
eof
itsal
lied
publ
ishe
rs.
Thi
sar
ticle
isin
tend
edso
lely
for
the
pers
onal
use
ofth
ein
divi
dual
user
and
isno
tto
bedi
ssem
inat
edbr
oadl
y.
500 TOFIGHI AND KELLEY

Step 1The MBCO procedure begins by specifying the full single-mediator model (see Figure 1). We fit the full single-mediator model using
the code shown below:
Thi
sdo
cum
ent
isco
pyri
ghte
dby
the
Am
eric
anPs
ycho
logi
cal
Ass
ocia
tion
oron
eof
itsal
lied
publ
ishe
rs.
Thi
sar
ticle
isin
tend
edso
lely
for
the
pers
onal
use
ofth
ein
divi
dual
user
and
isno
tto
bedi
ssem
inat
edbr
oadl
y.
501IMPROVED INFERENCE IN MEDIATION ANALYSIS

In the first two lines of the script above, before specifying themodel parts with mxModel, we can simplify the process bygrouping the names of variables as a vector that will be used inmodel specification. For example, we specified a vector of thenames of observed variables and saved them as maniVar. Then,we specified a vector of the names of endogenous variables andsaved them as endVar. Next, we specified the full single-mediator model.
The main command to specify an SEM is mxModel. Thearguments provided to the mxModel function specified all theelements of the mediation model. For the single-mediator example,we specified the manifest (observed) variables, the paths (regres-sion coefficients), the indirect effect to be tested (or any functionof model parameters), the constraint distinguishing the full andnull models, and the variances and covariances among the vari-ables. The first argument to mxModel is single_med_full,which is a name we chose for the single-mediator model. The nextargument, type="RAM", specifies that OpenMx uses the retic-ular action model (RAM; McArdle & McDonald, 1984), a sym-bolic algebraic notation to specify an SEM. In the argumentmanifestVars, we introduced the vector of the names of theobserved (manifest) variables. The variable names must match thenames in the data set memory_df, as shown earlier in the outputfrom the glimpse function.
Next, we specified the paths between the variables usingmxPath, a function that corresponds to the graphical representa-tion of paths in an SEM such as the model in Figure 1. Forexample, we used mxPath to indicate a path (coefficient) corre-sponding to an arrow between the two variables specified in thearguments from (predictors) and to (response variables) in Fig-ure 1. The argument arrows=1 indicates a unidirectional arrowthat starts from the variable in the argument from and ends at thevariable specified in the argument as to. The argumentarrows=2 indicates a bidirectional arrow representing a covari-ance between the two variables. The argument free=TRUEindicates that the parameter is freely estimated; otherwise,
free=FALSE indicates that the parameter is fixed at the valuesset by the argument values. If the parameter is freely estimated,the argument values would provide starting values. The argu-ment labels provides labels for the coefficients. Because wespecified more than one coefficient in the arguments to andfrom, we could provide a vector of labels corresponding to thestated order of the coefficients. For our example, b1 is the coef-ficient for X ¡ imagery and b3 is the coefficient for X ¡ recall.
We used the function mxAlgebra to define the indirect effectthat, in general, is a function of model parameters. A function mayinclude combinations of mathematical operations, such as �, �, �,and / (e.g., b1�b2/(b1�b2+b3)), exponentials (e.g., exp), andlogarithms (e.g., log). The first argument to mxAlgebra was theproduct of two coefficients, b1�b2, in which b1 and b2 had beendefined in mxPath. The argument name="ind" named the indirecteffect. Next, we specified the data set for the model. The mxDataidentified the data set to be analyzed. The argument observed=memory_df specified the name of the data set in R. The secondargument, type="raw," indicated that the data set was in the rawformat, which meant that the data set included observations on theparticipants as opposed to being a summary statistic such as a cova-riance matrix.
Finally, we ran the model using mxRun, where the first argumentwas the name of the mxModel that was then saved as fit_single_med_full. Because we received a warning (not shown here) fromthe optimizer that the convergence criterion was not satisfied, we usedthe function mxTryHard. This function would either run the modelmultiple times until an acceptable solution, according to the conver-gence criterion set by the estimation algorithm, was found or it wouldrun a preset maximum number of times until an acceptable solutionwas reached. In the subsequent analysis, we first used mxRun and, ifthe model had convergence issues, we then used mxTryHard. Weused the function summary to save or print the summary of theresults. We saved the summary of the results as stat_single_med_full and then printed the summary. Below, is the relevant partof the summary results.
Below the title Model Statistics, the row that starts withModel gives the pertinent information for the full model. The outputshowed that the full single-mediator model had eight free parameters,with dfFull � 1099 and DFull � 4305.727. Under InformationCriteria, we present the estimates of the information indices. Theinformation indices that match the formulas in (5) and (6) are underthe Parameters Penalty column. For the full model, the infor-mation fit indices were AICFull � 4321.727 and BICFull � 4353.013.
Before proceeding, after fitting a mediation model, we checkedthe degree to which the statistical assumptions about normality ofthe residuals and the presence of outliers to ensure that the esti-
mates were unbiased and the inference about the parameters wasvalid (Cohen, Cohen, West, & Aiken, 2003). We checked fornormality of the residuals using QQ plots, which indicated that thenormality assumption for the residuals was reasonable. Using themethods described by Fox (2016), we did not find any outliers thatwould change the results.
Step 2
We ran the null model (code below), which is the single-mediatormodel in which the indirect effect of instruction on recall throughimagery is constrained to zero, �1�2 � 0.
Thi
sdo
cum
ent
isco
pyri
ghte
dby
the
Am
eric
anPs
ycho
logi
cal
Ass
ocia
tion
oron
eof
itsal
lied
publ
ishe
rs.
Thi
sar
ticle
isin
tend
edso
lely
for
the
pers
onal
use
ofth
ein
divi
dual
user
and
isno
tto
bedi
ssem
inat
edbr
oadl
y.
502 TOFIGHI AND KELLEY

Instead of specifying all parts of the null mediation model usingMxModel in the above code, we modified the full modelsingle_med_full, as specified in the argument model. Next,we specified the nonlinear constraint for the indirect effect throughmxConstraint. The first argument, ind = = 0, constrains the
indirect effect defined in the mxAlgebra statement to zero. Theargument name assigns a name to the constraint. Finally, we savedthe null model to single_med_null. Next, we ran the nullmodel and saved the results to fit_single_med_null. Rele-vant parts of the summary of the model results are shown below:
For the null model, dfNull � 1100 and DNull � 4481.493, and theinformation fit indices were AICNull � 4497.493 and BICNull �4528.779.
Step 3
We compared the full and null model both in terms ofthe LRTMBCO and the information fit indices to evaluate H0:�1�2 � 0. The LRTMBCO equals the difference between the
deviance of the two models: LRTMBCO � DNull � DFull �4481.493 � 4305.727 � 175.766. The degrees of freedom for theLRTMBCO equal the difference in the degrees of freedom associ-ated with each model; that is, dfLRT � dfNull � dfFull � 1100 �1099 � 1. Given that the LRTMBCO has a large sample �2
distribution with dfLRT � 1, we have the p-value � Pr(�2(1) �175.766) � 4.073738E � 40. More conveniently, we computedthe LRTMBCO using the mxCompare or anova function wherethe arguments are the names of the full and null models:
The first row of the above output shows the results for the fullmodel, which is the single-mediator model in Figure 1. The col-umns ep, minus2LL, df, and AIC show the number of estimatedparameters, deviance, degrees of freedom, and AIC, respectively.The columns diffLL, diffdf, and p represent the difference indeviance (not the log-likelihoods), the difference in degrees offreedom, and p-value for the two models being compared. Thesecond row shows the results for the null model under the columnsep, minus2LL, df, and AIC. The results of comparing the nulland full model are shown under the columns diffLL, diffdf,
and p. The value for the test statistic LRTMBCO � 175.766 islocated under the column diffLL. The degrees of freedom aredfLRT � 1 and the p-value � 4.073738E � 40; these amounts arelocated under the columns diffdf and p, respectively.
We used the following commands to compute the Monte CarloCI for the indirect effect. First, we used the functions coef andvcov to extract the path coefficients and covariance matrix of thecoefficients, respectively. Next, we used the ci function in theRMediation package (Tofighi & MacKinnon, 2011, 2016) to com-pute the Monte Carlo CI. The first argument mu to this function is
Thi
sdo
cum
ent
isco
pyri
ghte
dby
the
Am
eric
anPs
ycho
logi
cal
Ass
ocia
tion
oron
eof
itsal
lied
publ
ishe
rs.
Thi
sar
ticle
isin
tend
edso
lely
for
the
pers
onal
use
ofth
ein
divi
dual
user
and
isno
tto
bedi
ssem
inat
edbr
oadl
y.
503IMPROVED INFERENCE IN MEDIATION ANALYSIS

a vector of the coefficient estimates, and the second argumentSigma is a covariance matrix of the coefficient estimates. The
argument quant accepts a formula for the indirect effect that startswith the symbol “”.
The numbers below 2.5% and 97.5% show the lower and upperlimits of the 95% CI, [1.6, 2.682]; the numbers below Estimateand SE show the estimates of indirect effect and its standard error,�1�2 � 2.121 and SE � 0.276, respectively.
We next obtained R2 for the endogenous variables of the full andnull models using the rsq function available in the online sup-plemental materials.
The first argument model to rsq specifies an OpenMxmodel, and the second argument name specifies names ofendogenous variables (i.e., variables in which a single-headedarrow enters; namely those that are a function of anothervariable).
To summarize, the LRTMBCO result showed that the indirecteffect of instruction on recall through imagery appeared to begreater than zero, �1�2 � 2.121 (SE � 0.276), 95% MonteCarlo CI [1.6, 2.682], LRTMBCO � 175.766, dfLRT � 1, p �4.073738E � 40. We recommend researchers compute thedifference in R2s between the full and null models and thenexamine the change in the effect sizes that occurs as a result ofthe indirect effect through imagery. For recall, R2 remainedunchanged to four decimal places while for imagery R2 �.3779. Further, the information fit indices supported the asser-tion that the indirect effect was greater than zero because theAIC and the BIC for the full single-mediator model weresmaller than those of the null single-mediator model. This resultindicates that constraining the indirect effect to zero worsensthe fit of the full single-mediator model. On average, theinstruction to students to use mental imagery increased use ofmental imagery that, in turn, increased the number of wordsthey recalled by approximately two words. We have inferentialsupport that mediation occurred. Note these results are valid ifthe no-omitted confounder assumption is met. That is, an omit-ted variable may not exist that influences the relations betweeninstruction, imagery, and recall.
Research Question 2
Here, we were interested in whether the instruction to userepetition increased the use of repetition to memorize the wordsthat, in turn, improved participants’ memory over and above theindirect effect of instruction on recall through imagery. In otherwords, we wanted to test H0: �4�5 � 0 for the parallel two-mediator model in Figure 2. We again applied the three-stepMBCO procedure.
Step 1
We estimated the model with two parallel mediators in Figure 2,which is the full model for this research question. For this model,the two specific indirect effects associated with imagery andrepetition were freely estimated. Below are the regression equa-tions for the full parallel two-mediator model:
M1 � �0,M1 � �1X � εM1 (7)
M2 � �0,M2 � �4X � εM2 (8)
Y � �0,Y � �3X � �2M1 � �5M2 � εY, (9)
where �1 is the effect of the instruction (X) on imagery (M1), �4 isthe effect of the instruction on repetition (M2), �3 is the directeffect of the instruction on recall (Y), �2 is the effect of imagery onrecall controlling for the instruction and repetition, and �5 is theeffect of repetition on recall controlling for instruction and imag-
Thi
sdo
cum
ent
isco
pyri
ghte
dby
the
Am
eric
anPs
ycho
logi
cal
Ass
ocia
tion
oron
eof
itsal
lied
publ
ishe
rs.
Thi
sar
ticle
isin
tend
edso
lely
for
the
pers
onal
use
ofth
ein
divi
dual
user
and
isno
tto
bedi
ssem
inat
edbr
oadl
y.
504 TOFIGHI AND KELLEY
ery; �0,M1, �0,M2, �0,Y are the intercepts; εM1, εM2, and εY are theresiduals.
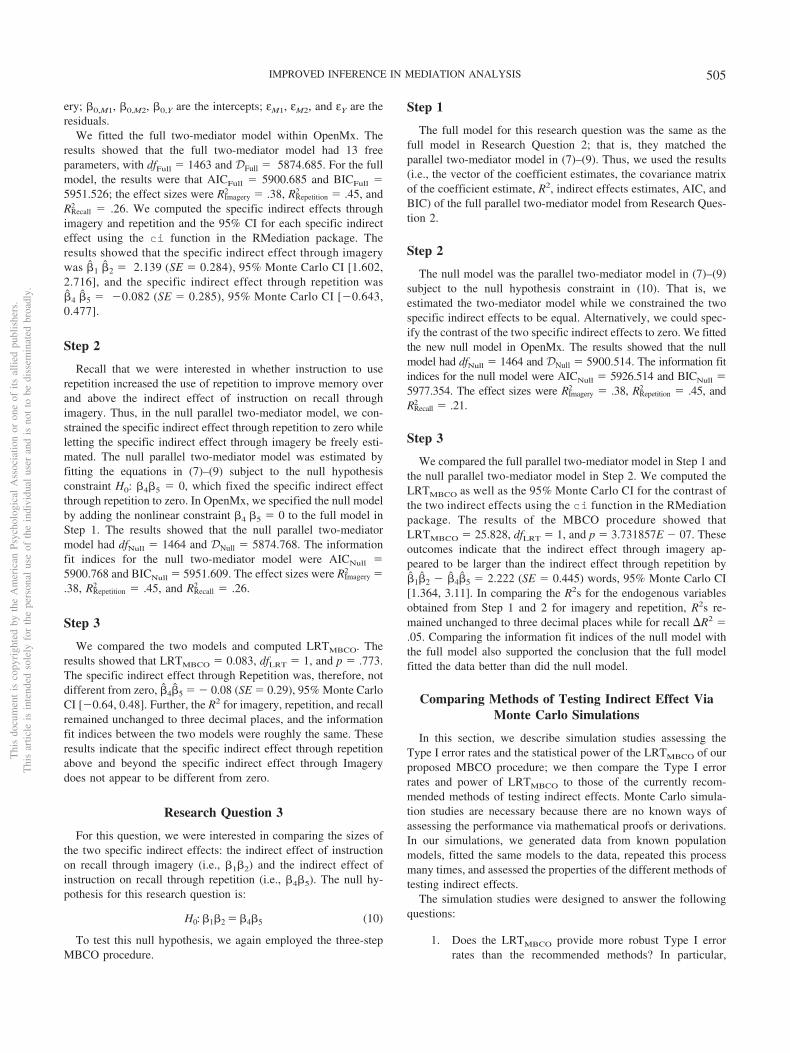
We fitted the full two-mediator model within OpenMx. Theresults showed that the full two-mediator model had 13 freeparameters, with dfFull � 1463 and DFull � 5874.685. For the fullmodel, the results were that AICFull � 5900.685 and BICFull �5951.526; the effect sizes were RImagery
2 � .38, RRepetition2 � .45, and
RRecall2 � .26. We computed the specific indirect effects through
imagery and repetition and the 95% CI for each specific indirecteffect using the ci function in the RMediation package. Theresults showed that the specific indirect effect through imagerywas �1 �2 � 2.139 (SE � 0.284), 95% Monte Carlo CI [1.602,2.716], and the specific indirect effect through repetition was�4 �5 � �0.082 (SE � 0.285), 95% Monte Carlo CI [�0.643,0.477].
Step 2
Recall that we were interested in whether instruction to userepetition increased the use of repetition to improve memory overand above the indirect effect of instruction on recall throughimagery. Thus, in the null parallel two-mediator model, we con-strained the specific indirect effect through repetition to zero whileletting the specific indirect effect through imagery be freely esti-mated. The null parallel two-mediator model was estimated byfitting the equations in (7)–(9) subject to the null hypothesisconstraint H0: �4�5 � 0, which fixed the specific indirect effectthrough repetition to zero. In OpenMx, we specified the null modelby adding the nonlinear constraint �4 �5 � 0 to the full model inStep 1. The results showed that the null parallel two-mediatormodel had dfNull � 1464 and DNull � 5874.768. The informationfit indices for the null two-mediator model were AICNull �5900.768 and BICNull � 5951.609. The effect sizes were RImagery
2 �.38, RRepetition
2 � .45, and RRecall2 � .26.
Step 3
We compared the two models and computed LRTMBCO. Theresults showed that LRTMBCO � 0.083, dfLRT � 1, and p � .773.The specific indirect effect through Repetition was, therefore, notdifferent from zero, �4�5 � � 0.08 (SE � 0.29), 95% Monte CarloCI [�0.64, 0.48]. Further, the R2 for imagery, repetition, and recallremained unchanged to three decimal places, and the informationfit indices between the two models were roughly the same. Theseresults indicate that the specific indirect effect through repetitionabove and beyond the specific indirect effect through Imagerydoes not appear to be different from zero.
Research Question 3
For this question, we were interested in comparing the sizes ofthe two specific indirect effects: the indirect effect of instructionon recall through imagery (i.e., �1�2) and the indirect effect ofinstruction on recall through repetition (i.e., �4�5). The null hy-pothesis for this research question is:
H0: �1�2 � �4�5 (10)
To test this null hypothesis, we again employed the three-stepMBCO procedure.
Step 1
The full model for this research question was the same as thefull model in Research Question 2; that is, they matched theparallel two-mediator model in (7)–(9). Thus, we used the results(i.e., the vector of the coefficient estimates, the covariance matrixof the coefficient estimate, R2, indirect effects estimates, AIC, andBIC) of the full parallel two-mediator model from Research Ques-tion 2.
Step 2
The null model was the parallel two-mediator model in (7)–(9)subject to the null hypothesis constraint in (10). That is, weestimated the two-mediator model while we constrained the twospecific indirect effects to be equal. Alternatively, we could spec-ify the contrast of the two specific indirect effects to zero. We fittedthe new null model in OpenMx. The results showed that the nullmodel had dfNull � 1464 and DNull � 5900.514. The information fitindices for the null model were AICNull � 5926.514 and BICNull �5977.354. The effect sizes were RImagery
2 � .38, RRepetition2 � .45, and
RRecall2 � .21.
Step 3
We compared the full parallel two-mediator model in Step 1 andthe null parallel two-mediator model in Step 2. We computed theLRTMBCO as well as the 95% Monte Carlo CI for the contrast ofthe two indirect effects using the ci function in the RMediationpackage. The results of the MBCO procedure showed thatLRTMBCO � 25.828, dfLRT � 1, and p � 3.731857E � 07. Theseoutcomes indicate that the indirect effect through imagery ap-peared to be larger than the indirect effect through repetition by�1�2 � �4�5 � 2.222 (SE � 0.445) words, 95% Monte Carlo CI[1.364, 3.11]. In comparing the R2s for the endogenous variablesobtained from Step 1 and 2 for imagery and repetition, R2s re-mained unchanged to three decimal places while for recall R2 �.05. Comparing the information fit indices of the null model withthe full model also supported the conclusion that the full modelfitted the data better than did the null model.
Comparing Methods of Testing Indirect Effect ViaMonte Carlo Simulations
In this section, we describe simulation studies assessing theType I error rates and the statistical power of the LRTMBCO of ourproposed MBCO procedure; we then compare the Type I errorrates and power of LRTMBCO to those of the currently recom-mended methods of testing indirect effects. Monte Carlo simula-tion studies are necessary because there are no known ways ofassessing the performance via mathematical proofs or derivations.In our simulations, we generated data from known populationmodels, fitted the same models to the data, repeated this processmany times, and assessed the properties of the different methods oftesting indirect effects.
The simulation studies were designed to answer the followingquestions:
1. Does the LRTMBCO provide more robust Type I errorrates than the recommended methods? In particular,
Thi
sdo
cum
ent
isco
pyri
ghte
dby
the
Am
eric
anPs
ycho
logi
cal
Ass
ocia
tion
oron
eof
itsal
lied
publ
ishe
rs.
Thi
sar
ticle
isin
tend
edso
lely
for
the
pers
onal
use
ofth
ein
divi
dual
user
and
isno
tto
bedi
ssem
inat
edbr
oadl
y.
505IMPROVED INFERENCE IN MEDIATION ANALYSIS

would the LRTMBCO remain robust across the combina-tion of the parameter values for smaller sample sizes?
2. Is the LRTMBCO as powerful as, if not more powerfulthan, the currently recommended methods across differ-ent effect sizes, sample sizes, and other types of media-tion models?
To answer these questions, we compared the Type I error rateand power of the LRTMBCO to five currently recommended meth-ods of testing indirect effects: (a) the percentile bootstrap CI(Bollen & Stine, 1990; Efron & Tibshirani, 1993; MacKinnon etal., 2004); (b) the bias-corrected (BC) bootstrap CI (Bollen &Stine, 1990; Efron & Tibshirani, 1993; MacKinnon et al., 2004);(c) the Monte Carlo CI (MacKinnon et al., 2004; Tofighi &MacKinnon, 2016); (d) the profile-likelihood CI (Folmer, 1981;Neale & Miller, 1997; Pawitan, 2001; Pek & Wu, 2015); and (e)the joint significance test (Kenny et al., 1998; MacKinnon et al.,2002). We describe these methods in the next section.3
For a two-path indirect effect, we did not separately considerdistribution of the product CI because its performance is similar tothat of the Monte Carlo CI (MacKinnon et al., 2004). We also didnot study the Wald (1943) (multivariate delta) z or the causal stepstest because research has shown that these two tests are overlyconservative and do not provide adequate power in smaller samplesizes and effect sizes (MacKinnon et al., 2002). For completenessof the simulation study and because of its popularity and endorse-ments (MacKinnon et al., 2004; Preacher & Hayes, 2008; Shrout& Bolger, 2002), we studied the bias-corrected (BC) bootstrap CI.However, we do not recommend using the BC bootstrap CI to testan indirect effect because it shows inflated Type I error rates forboth small and large samples (Falk & Biesanz, 2015; Koopman,Howe, Hollenbeck, & Sin, 2015).
In the simulation studies, we considered two types of indirecteffects commonly found in empirical research as well as in sim-ulation studies (Tofighi & Kelley, 2019): (a) a two-path indirecteffect (e.g., �1�2), which is the product of two coefficients for a
single-mediator chain, X ¡
�1M ¡
�2Y; and (b) a three-path indirect
effect (e.g., �1�2�3), which is the product of three coefficients for
a sequential two-mediator chain, X ¡
�1M1 ¡
�2M2 ¡
�3Y. We chose
these two population models because they have been extensivelydiscussed in both substantive and methodological literature (To-fighi & Kelley, 2019).
Percentile and Bias-Corrected Bootstrap CI
We now discuss two methods of computing a CI for nonpara-metric bootstrap (Bollen & Stine, 1990; Efron & Tibshirani, 1993).In this technique, many samples (e.g., R � 1,000) with replace-ment were drawn from the sample data. The hypothesized medi-ation model was fit to each resampled data set, and indirect effectswere computed for each model. This process resulted in R esti-mates of indirect effects, which is called the bootstrap samplingdistribution of the indirect effects. To compute a CI, we obtainedquantiles corresponding to 1 � �/2 and �/2 percentiles of thebootstrap sampling distribution, resulting in what is called a per-centile CI. As a modified version of the percentile bootstrap, theBC bootstrap uses adjusted percentiles 1 � �=/2 and �=/2 to obtainthe upper and lower limits of the CI, where �= is computed to
correct for potential bias due to skewness (Efron, 1987). Althoughnot in the context of mediation analysis, Efron (1987) argued that,for smaller sample sizes, the BC bootstrap CI yields a moreaccurate coverage (i.e., the proportion of times a CI contains truevalues of the parameter is closer to the nominal coverage of 1 ��) than does the percentile CI.
Monte Carlo CI
The Monte Carlo method, also known as the parametric boot-strap (Efron & Tibshirani, 1993), is another sampling-based tech-nique used to compute a CI for indirect effects (MacKinnon et al.,2004; Tofighi & MacKinnon, 2016). In this method, the samplingdistribution for each parameter is estimated by drawing R randomsamples from a multivariate normal distribution where the mean ofthe distribution is the vector of the coefficient estimates and thecovariance matrix of the distribution is the covariance matrix ofthe coefficient estimates. The Monte Carlo method is based on thetheory that the maximum likelihood (ML) estimates of the coef-ficients in an SEM asymptotically have a multivariate normaldistribution (Bollen, 1989). The population parameters (i.e., meanvector and covariance matrix) for this multivariate normal distri-bution are the parameter estimates from the estimated model. Thenumber of Monte Carlo samples, R, should be large, typically1,000 or more. The indirect effect is estimated within each sample,resulting in a total of R estimates. The mean and standard deviationof the R indirect effect estimates are then used to estimate theindirect effect and its standard error, respectively. To compute a(1 � �)100% CI, we obtained the �/2 and 1 � �/2 quantiles of theMonte Carlo sample of the indirect effects.
Profile Likelihood CI
In its simplest form, the profile-likelihood approach produces aCI for a single parameter using a profile-likelihood function (Fol-mer, 1981; Neale & Miller, 1997; Pawitan, 2001). In mediationanalysis, the profile-likelihood method has been extended to pro-duce a CI for the indirect effect in a single-mediator chain(Cheung, 2007; Pek & Wu, 2015). Let � be a vector of all the freeparameters in a single-mediator model. The profile-likelihoodfunction for a single-mediator model, L(� | �1�2), is computed byassuming that the indirect effect, �1�2, is a known value. Next, theprofile-likelihood function is maximized. In practice, the indirecteffect takes on different values, and the profile-likelihood functionis maximized while the indirect effect is fixed at specific values.
Next, we compared the deviance of the maximized profile-likelihood function and the deviance of the maximized likelihoodfunction, where deviance equals negative twice the maximizedlog-likelihood function as shown in (3). Asymptotically, the dif-ference in the deviance of the two functions had a chi-squareddistribution with degrees of freedom equaling the difference in thenumber of free parameters between the profile likelihood andlikelihood function for the model (Pawitan, 2001). For the indirecteffect, in general, this difference asymptotically had a chi-squareddistribution with one degree of freedom. The lower and upper
3 We do not name all the existing methods for single-mediator modelsbecause they are considered elsewhere (e.g., Falk & Biesanz, 2015; Mac-Kinnon et al., 2002).
Thi
sdo
cum
ent
isco
pyri
ghte
dby
the
Am
eric
anPs
ycho
logi
cal
Ass
ocia
tion
oron
eof
itsal
lied
publ
ishe
rs.
Thi
sar
ticle
isin
tend
edso
lely
for
the
pers
onal
use
ofth
ein
divi
dual
user
and
isno
tto
bedi
ssem
inat
edbr
oadl
y.
506 TOFIGHI AND KELLEY

limits for the 100 (1 � �)% profile-likelihood CI corresponded tothe minimum and maximum of all values of the indirect effect thatsatisfied the following equality:
D(�prof | �1�2) � D(�) � ��2(1) (11)
where �prof is the ML estimate of the model parameters given thatthe indirect effect is fixed and ��
2(1) denotes upper-tail � criticalvalue of the chi-squared distribution with one degree of freedom.For a specific mediation model, the values of D��� (computed byestimating the mediation model) and the critical value of thechi-squared distribution (e.g., �.05
2 (1) � 3.84) were known. A 95%profile-likelihood CI was computed by solving the expression in(11) for two values of �1�2 corresponding to the upper and lowerlimits.
Joint Significance Test
For a single-mediator model, MacKinnon, Lockwood, Hoffman,West, and Sheets (2002) proposed a joint significance test todescribe a variation of the causal steps test (Kenny et al., 1998).This method declares an indirect effect to be significantly differentfrom zero if every coefficient in the indirect effect is significantlydifferent from zero. The joint significance test does not produce arobust Type I error rate for smaller sample sizes, a CI, or a p valuefor the indirect effect (MacKinnon et al., 2002). While the jointsignificance test can be extended to test indirect effects that are theproducts of two or more coefficients in a mediational chain, themethod cannot be used to test a complex function of indirecteffects such as a contrast of two indirect effects (e.g., H0: �1�2 ��3�4 � 0). The joint significance test has been recommended totest indirect effects in single-mediator and two-mediator sequentialchains (Falk & Biesanz, 2015; Taylor, MacKinnon, & Tein, 2008;Yzerbyt, Muller, Batailler, & Judd, 2018).
Simulation Design and Population Values
In the simulation studies, we manipulated three factors: (a)effect size R2, which quantifies how well the predictors accountfor the variance in the endogenous variables; (b) sample size;and (c) the method of testing the indirect effect(s). Previouswork showed that sample size and the effect size R2 influencethe Type I error and the power of the existing tests of theindirect effect for single-mediator and sequential two-mediatorchains (MacKinnon et al., 2002, 2004; Williams & MacKinnon,2008). Based on Cohen’s (1988) guidelines, we specified thepopulation effect sizes in the simulation to be R2 � .02, .13, and.26, which leads to the corresponding nonzero population re-gression coefficients of 0.14, 0.39, and 0.59, respectively (seethe method described by Thoemmes, MacKinnon, & Reiser,2010, which we used).
Sample size took on the following values: N � 50, 75, 100,and 200. We chose these values to cover a range of sample sizesreported in the applied literature of psychology, in relateddisciplines, and in the simulation studies of mediation effects(e.g., MacKinnon et al., 2002; Tofighi & Kelley, 2019). Thesmallest sample size we considered, 50, might not be viewed asa best practice in the SEM literature, and a sample size of 200is roughly equal to the median sample size in an SEM (Jaccard& Wan, 1995; MacCallum & Austin, 2000). However, the
studies with a sample size of 50 do appear in the appliedliterature (Tofighi & Kelley, 2019). We do not report resultsfrom a sample size greater than 200 because our preliminarysimulation study for the LRTMBCO as well as the previoussimulation studies for the existing methods (e.g., MacKinnon etal., 2002, 2004; Taylor et al., 2008; Williams & MacKinnon,2008) found that the performance of the tests did not differbetween methods at larger sample sizes. In these large samples,all the methods (which are based on large sample theory)worked effectively.
The method conditions included six commonly used tests ofindirect effects for both the Type I error and power study. Theseconditions resulted in 168 conditions for the Type I error and 216conditions for the power study for the single-mediator model; and240 conditions for the Type I error and 648 conditions for thepower study for the sequential two-mediator model. We used amixed full factorial design for each simulation study where thefactors effect size and sample size were between-subjects factorsand the method was a within-subjects factor.
Data Generation
We generated 5,000 independent data sets for each combina-tion of the between-subjects factors using a known population
model, either X ¡
�1M ¡
�2Y for the single-mediator model or
X ¡
�1M1 ¡
�2M2 ¡
�3Y for the sequential two-mediator model. The
variables X, M1, M2, and Y were observed. Without loss of gen-erality, the population values for the intercepts were fixed at zerobut were estimated in the simulation study. Values for X weresampled from a binomial distribution with .5 probability of twocategories (i.e., treatment vs. control). Data for each residual termwere generated from the standard normal distribution.
We chose � � .05 to test the indirect effects, as is commonlydone in psychology and related areas. We used OpenMx Version2.9.6 (Boker et al., 2011; Neale et al., 2016) to conduct theLRTMBCO as well as the profile-likelihood CI.4 For the MonteCarlo, percentile and BC bootstrap CI, and for the joint signifi-cance test, we estimated the model using lavaan package Version0.5–23 (Rosseel, 2012). We then used the model estimates and ci()function in the RMediation package Version 1.1.4 (Tofighi &MacKinnon, 2011, 2016) to compute a Monte Carlo CI; both
4 We studied the software manual and references for the optimizationtechniques implemented in OpenMx (Boker et al., 2011; Neale et al., 2016;Zahery et al., 2017), communicated with the authors/programmers, andconducted an extensive simulation study to examine whether the LRTMBCO
can be implemented using different optimization methods in OpenMx. Inaddition, we examined whether the software packages lavaan Version0.5-23.1097, Mplus Version 8.0, and PROC CALIS (SAS Institute Inc.,2016) allowed nonlinear constraints to estimate the LRTMBCO. We alsocommunicated with the authors/programmers of Mplus and lavaan. Basedon our communications, at the time of writing, Mplus and lavaan do notguarantee obtaining optimal results for the mediation models with nonlin-ear constraints in the form of null hypothesis about the indirect effect. Wechose the NPSOL (Gill, Murray, Saunders, & Wright, 1986) optimizerinstead of the default CSOLNP (Zahery et al., 2017) optimizer in OpenMxbecause the CSOLNP showed convergence problems in our preliminarysimulation studies. Based on our personal communication with OpenMxdevelopers, they suggested that the SLSQP (Snyman, 2005) optimizer maybe successful as well. However, we did not formally evaluate this optionbecause it is beyond the scope of the current article.
Thi
sdo
cum
ent
isco
pyri
ghte
dby
the
Am
eric
anPs
ycho
logi
cal
Ass
ocia
tion
oron
eof
itsal
lied
publ
ishe
rs.
Thi
sar
ticle
isin
tend
edso
lely
for
the
pers
onal
use
ofth
ein
divi
dual
user
and
isno
tto
bedi
ssem
inat
edbr
oadl
y.
507IMPROVED INFERENCE IN MEDIATION ANALYSIS

percentile and BC bootstrap CI were estimated using the facilitiesprovided in the lavaan package. For the joint significance test, weused the z test to examine the joint significance of the coefficientsof the indirect effects.5
Results
For the simulation studies assessing the robustness of the TypeI error, the empirical Type I error rate is the proportion of times outof 5,000 replications that a test incorrectly rejects the null hypoth-esis of zero indirect effect. For the statistical power studies, theempirical power is the proportion of times out of 5,000 replicationsthat a test correctly rejects the null hypothesis of zero indirecteffect. The large sample size of 5,000 within each conditionprecluded the use of repeated measures ANOVA for the simulationresults. To determine if a test was robust, as discussed, we usedBradley’s (1978) liberal interval of .025 and .075 to determine aType I error rate that was “good enough” for practical purposes.We considered a test robust (i.e., good enough) according toBradley’s (1978) criteria if its empirical Type I error rate fellwithin the robustness interval. Otherwise, a test was consideredconservative or liberal depending on whether the Type I error ratewas smaller or greater than Bradley’s lower or upper bound,respectively.
Type I error. To facilitate comparison of the Type I errorrates across different combinations of the sample sizes and effectsizes, we created graphs showing the empirical Type I error rate asa function of sample size and size of nonzero coefficients. To savespace, we only present a few graphs (Figures 3–6). More graphscan be found in the online supplemental materials. For the two-path indirect effect where both coefficients were zero (see Figure3), the empirical Type I error rate for the LRTMBCO was robust asit fell within Bradley’s (1978) robustness interval. The other fivemethods were not robust across all sample sizes; that is, theirempirical Type I error rates were consistently below .01. TheLRTMBCO produced more robust Type I error rates because itestimated the null mediation model and the sampling distributionof the indirect effect under the null hypothesis.
As can be seen in Figure 4, when one of the coefficients waszero, the LRTMBCO was the most robust method across all com-binations of the nonzero coefficients and sample sizes; its Type Ierror rate remained close to the nominal .05 value and stayedwithin the limits of Bradley’s (1978) robustness interval. The BCbootstrap showed conservative Type I error rates or inflated TypeI error rates in certain conditions. For example, when �2 � 0.59and N � 50, and �2 � 0.39 and N � 100, the BC bootstrap showedan inflated Type I error rate; when �2 � 0.14 and N � 75, the BCbootstrap showed a conservative Type I error rate. In general, theType I error rates for the percentile bootstrap, Monte Carlo,profile-likelihood, and joint significance methods were all robustexcept when one of the nonzero coefficients was small (i.e., 0.14).More specifically, when the magnitude of the coefficient was smalland the sample size was 100, all four methods showed a con-servative Type I error rate. The results for CI-based and jointsignificance tests, when one of the coefficients was zero, essen-tially matched the results from previous studies (Biesanz et al.,2010; Falk & Biesanz, 2015), as would be expected. Finally, whichcoefficient was zero did not appear to change the overall conclu-sion about the Type I error rate robustness of the methods.
For the sequential two-mediator model, the LRTMBCO was themost robust test across the combinations of the sample sizes andeffect sizes. When all three coefficients were zero (see Figure 5) orwhen two of the coefficients were zero (see Figure 6), theLRTMBCO’s Type I error rate remained robust within the Bradley’s(1978) limits. The five other methods showed conservative Type Ierror rates. Finally, which coefficient was zero did not appear tochange the Type I error rates.
Power. The simulation study showed that the LRTMBCO wasas powerful as the other methods, except for the BC bootstrapmethod, for both two-path and three-path indirect effects. The BCbootstrap method showed slightly more power although that powerwas at the expense of yielding inflated Type I error rates. Thisresult is consistent with previous research (Biesanz et al., 2010;Falk & Biesanz, 2015; Taylor et al., 2008). The results of powersimulation studies were similar between the single-mediator modeland the sequential two-mediator model. We explain the similarpower between the CI-based methods and the LRTMBCO in thenext section.
Summary
One explanation for why the simulation studies showed that theLRTMBCO produces more robust empirical Type I error rates thanother CI-based methods is that the sampling distribution of theindirect effect tends to differ from the null sampling distribution ofthe indirect effect estimate. In the null sampling distribution, thepopulation value of the indirect effect is fixed to zero. The sam-pling distribution used by the CI-based methods is likely to reflectan alternative hypothesis of a nonzero population indirect effectrather than the null hypothesis of zero population indirect effect.As a result, the CI-based methods tend to produce nonrobustempirical Type I error rates, especially for smaller sample sizes.However, the LRTMBCO uses both the null and the full models totest an indirect effect and, thus, more appropriately maps thestatistical method onto the question of interest when seeking todetermine if a hypothesized mediator mediates the relationshipbetween X and Y. Hence, the LRTMBCO appears more appropriatethan other methods that have been recommended in the literaturein the conditions we studied.
The simulation results also showed that the LRTMBCO is aspowerful as the other recommended tests except for the BC boot-strap method; however, we do not recommend the BC bootstrapbecause of its inflated Type I error rate. On the other hand, theCI-based tests have adequate power when the null hypothesis isfalse (i.e., nonzero indirect effect) and the sampling distribution iscomputed under an estimated alternative hypothesis in which theindirect effect is nonzero. In other words, the estimated alternativesampling distribution of CI-based methods is more accurate whenthe null hypothesis is false as opposed to when the null hypothesisis true. In these cases, the CI-based tests and LRTMBCO appear toexhibit similar power.
5 The simulation study code scripts can be found at https://github.com/quantPsych/mbco.
Thi
sdo
cum
ent
isco
pyri
ghte
dby
the
Am
eric
anPs
ycho
logi
cal
Ass
ocia
tion
oron
eof
itsal
lied
publ
ishe
rs.
Thi
sar
ticle
isin
tend
edso
lely
for
the
pers
onal
use
ofth
ein
divi
dual
user
and
isno
tto
bedi
ssem
inat
edbr
oadl
y.
508 TOFIGHI AND KELLEY

Limitations
In our simulations, we made a few common assumptions forestimating a mediation model. The data for the simulation studieswere generated assuming that residuals associated with the medi-ators and outcome variable had a multivariate normal distributionand that the correct model was fit (e.g., the variables were notnonlinearly related and there were no omitted confounders).Though assessing the effectiveness of the LRTMBCO under themultivariate normality of the simulated data is a limitation, usingthe multivariate normal data is necessary to compare performanceof the LRTMBCO to other commonly used methods of testingmediation in known conditions. Therefore, the results of the sim-ulation studies apply to situations in which these assumptions arereasonably met. Assessing the performance of the LRTMBCO fornon-normally distributed residuals remains a topic for future re-search. We also assumed the simulation study included correctfunctional forms of the relationships between the posited variables.
For the empirical study, we evaluated if there were outliers (andwe did not find any in the sample data), and we assumed that no
common method biasing effect of measuring the endogenous vari-ables existed (Podsakoff, MacKenzie, Lee, & Podsakoff, 2003).Moreover, we assumed that the observed mediator and outcomevariables were measured without error (Dwyer, 1983; Fritz,Kenny, & MacKinnon, 2016); otherwise, the results could bemisleading (Cole & Preacher, 2014). In addition, one of the morestringent of these assumptions, which is untestable, is the no-omitted-confounder assumption (Imai et al., 2010; Judd & Kenny,1981; Valeri & VanderWeele, 2013; VanderWeele, 2010). That is,no variable should be omitted from the model that would affectboth the mediator and the outcome variables, given the indepen-dent variable (X) and covariates (if they exist and are included inthe model). Even when participants are randomly assigned to atreatment or control group, making causal claims about an indirecteffect requires the no-omitted-confounder assumption. If research-ers believe that not all confounders are included in the model, thenthe claims about the magnitude and existence of an indirect effectneed to be relaxed. We recommend that researchers conduct asensitivity analysis to investigate the biasing impact of a potential
Figure 3. Point and 95% CI estimate of the Type I error rate for six methods of testing a two-path indirecteffect, �1�2, where both parameters were fixed at zero. Horizontal solid lines show the limits of the Bradley’s(1978) liberal interval of .025 and .075 for � � .05. A test is robust according to a Bradley’s (1978) criterionif its Type I error rate falls within the criterion’s interval. MBCO � model-based constrained optimization(LRTMBCO); Percentile � percentile bootstrap; BC � bias-corrected bootstrap; JS � joint significance test;Profile � profile-likelihood CI. See the online article for the color version of this figure.
Thi
sdo
cum
ent
isco
pyri
ghte
dby
the
Am
eric
anPs
ycho
logi
cal
Ass
ocia
tion
oron
eof
itsal
lied
publ
ishe
rs.
Thi
sar
ticle
isin
tend
edso
lely
for
the
pers
onal
use
ofth
ein
divi
dual
user
and
isno
tto
bedi
ssem
inat
edbr
oadl
y.
509IMPROVED INFERENCE IN MEDIATION ANALYSIS

confounder on the indirect effect point and interval estimate (Cox,Kisbu-Sakarya, Miocevic, & MacKinnon, 2013; Tofighi et al.,2019; Tofighi & Kelley, 2016). MacKinnon and Pirlott (2015)provide an excellent discussion of different approaches to sensi-tivity analyses in mediation analysis. Sensitivity analyses for cer-tain mediation models can also be conducted in an SEM frame-work in Mplus software, which may include observed and latentvariables (Muthén & Asparouhov, 2015; Muthén & Muthén,2018). Conducting sensitivity analyses using the LRTMBCO alsoremains a topic for future study.
One requirement of our proposed LRTMBCO and the profile-likelihood method is that the mediation model be estimated withinthe SEM (or other appropriate multivariate) framework. That is,the equations for the mediation model must be simultaneouslyestimated. These methods do not work when using OLS regressionto separately estimate the equations representing a mediation
model, which is the classical way of testing mediation (Baron &Kenny, 1986).
We discussed applying the LRTMBCO to the models when theindependent variable and mediator do not interact and whenthe mediator and outcome are continuous. For such models,both the SEM and causal inference methods provide the sameestimate of the indirect effect (Muthén & Asparouhov, 2015);thus, the LRTMBCO can be used to test an indirect effect.However, when the independent variable and a mediator inter-act or when either a mediator or the outcome variable is acategorical variable, researchers need to use the potential out-come framework to correctly estimate the indirect effect(VanderWeele, 2015). Extension of the MBCO procedure andLRTMBCO to the causal inference framework for these scenariosremains a topic for future study. Finally, we did not discussapplication of the MBCO procedure to multilevel mediation
Figure 4. Point and 95% CI estimate of the Type I error rate for six methods of testing a two-path indirecteffect, �1�2, where only �1 was fixed at zero. The nonzero parameters take on the values: 0.14, 0.39, and 0.59.The x-axis shows the parameter values. Horizontal solid lines show the limits of the Bradley’s (1978) liberalinterval of .025 and .075 for � � .05. A test is robust according to a Bradley’s (1978) criterion if its Type I errorrate falls within the criterion’s interval. MBCO � model-based constrained optimization (LRTMBCO); Percen-tile � percentile bootstrap; BC � bias-corrected bootstrap; JS � joint significance test; Profile � profile-likelihood CI. See the online article for the color version of this figure.
Thi
sdo
cum
ent
isco
pyri
ghte
dby
the
Am
eric
anPs
ycho
logi
cal
Ass
ocia
tion
oron
eof
itsal
lied
publ
ishe
rs.
Thi
sar
ticle
isin
tend
edso
lely
for
the
pers
onal
use
ofth
ein
divi
dual
user
and
isno
tto
bedi
ssem
inat
edbr
oadl
y.
510 TOFIGHI AND KELLEY

analysis (Krull & MacKinnon, 2001; Tofighi, West, & MacK-innon, 2013), where the data have a multilevel (i.e., clustered,repeated measures) structure (Snijders & Bosker, 2012). Ex-tending the MBCO procedure to multilevel data also remains atopic for future study.
Discussion
This article proposed an MBCO procedure that uses a model-comparison approach to make inferences about any function rep-resenting an indirect effect in mediation analysis. An innovation ofour proposed MBCO procedure is using a nonlinear constraint totest a variety of simple and complex hypotheses about indirecteffects in a model-comparison framework. The MBCO procedureoffers the following advantages compared with the existing meth-ods. First, the MBCO procedure produces a likelihood ratio test,
termed LRTMBCO, to formally evaluate simple and complex hy-potheses about indirect effects and produces a p value, a continu-ous measure of compatibility between data and the null hypothe-ses. Second, through the model-comparison framework, theMBCO procedure computes a likelihood ratio, a continuous mea-sure of comparing goodness of fit of the null and full models. Italso computes information fit indices such as AIC and BIC, usedto compare the null and full models based on both goodness fit andparsimony.
To assess robustness of the LRTMBCO and the five most rec-ommended methods of testing indirect effects in a single-mediatoror in a sequential two-mediator model, we conducted a MonteCarlo simulation study. The results showed that the LRTMBCO ismore robust in terms of the empirical Type I error rate (i.e., it waswithin Bradley’s, 1978 liberal interval of .025 and .075 for � �
Figure 5. Point and 95% CI estimates of the Type I error rate for six methods of testing a three-path indirecteffect, �1�2�3, where all three parameters were zero. Horizontal solid lines show the limits of the Bradley’s(1978) liberal interval of .025 and .075 for � � .05. A test is robust according to a Bradley’s criterion if its TypeI error rate falls within the criterion’s interval. MBCO � model-based constrained optimization (LRTMBCO);Percentile � percentile bootstrap; BC � bias-corrected bootstrap; JS � joint significance test; Profile �profile-likelihood CI. See the online article for the color version of this figure.
Thi
sdo
cum
ent
isco
pyri
ghte
dby
the
Am
eric
anPs
ycho
logi
cal
Ass
ocia
tion
oron
eof
itsal
lied
publ
ishe
rs.
Thi
sar
ticle
isin
tend
edso
lely
for
the
pers
onal
use
ofth
ein
divi
dual
user
and
isno
tto
bedi
ssem
inat
edbr
oadl
y.
511IMPROVED INFERENCE IN MEDIATION ANALYSIS

.05) than the other methods when the residuals were generatedunder an ideal condition of the multivariate normality. In addition,the LRTMBCO is as powerful as the currently used tests (except forthe BC bootstrap) and offers more robust empirical Type I errorrates in situations typical of psychology and related fields.
In addition, the MBCO procedure provides a model-comparisonframework to compare one or more alternative mediation models.This important new feature relieves researchers of the restriction totest a null hypothesis with a single hypothesized model. Research-ers can test multiple competing models in addition to fitting a
Figure 6. Point and 95% CI estimate of the Type I error rate for six methods of testing a three-path indirecteffect, �1�2�3, where two out of the three parameters were fixed at zero. The nonzero parameter took on thevalues: 0.14, 0.39, and 0.59. The x-axis shows the values of the nonzero parameter. Horizontal solid lines showthe limits of the Bradley’s (1978) liberal interval of .025 and .075 for � � .05. A test is robust according to aBradley’s (1978) criterion if its Type I error rate falls within the criterion’s interval. MBCO � model-basedconstrained optimization (LRTMBCO); Percentile � percentile bootstrap; BC � bias-corrected bootstrap; JS �joint significance test; Profile � profile-likelihood CI. See the online article for the color version of this figure.
Thi
sdo
cum
ent
isco
pyri
ghte
dby
the
Am
eric
anPs
ycho
logi
cal
Ass
ocia
tion
oron
eof
itsal
lied
publ
ishe
rs.
Thi
sar
ticle
isin
tend
edso
lely
for
the
pers
onal
use
ofth
ein
divi
dual
user
and
isno
tto
bedi
ssem
inat
edbr
oadl
y.
512 TOFIGHI AND KELLEY

single hypothesized model and can focus on testing and comparingone or more indirect effects. More than a significance testingframework, a model-comparison framework allows researchers tocompare one null model to one or more alternative models. Thesecomparisons also can address the significance of indirect effects,the effect sizes associated with the mediators and outcome vari-ables, and the overall fit and complexity of the models as measuredby various fit indices such as the AIC (Akaike, 1974) and the BIC(Schwarz, 1978).
We applied the MBCO procedure to an empirical example. Theaccompanying computer code in OpenMx (Boker et al., 2011;Neale et al., 2016), the data set, and detailed analysis results are inthe online supplemental materials. As the empirical exampleshows, after conducting the MBCO procedure, researchers shouldreport the resulting LRTMBCO, exact p value as well as the CIs forthe indirect effects calculated using the Monte Carlo, profile-likelihood, or percentile bootstrap method. A p value should beinterpreted as a measure of compatibility of a null model with thesample data and should not be used to make dichotomous deci-sions about the significance of a null hypothesis. Further, research-ers should report R2 effect sizes associated with mediators and theoutcome variable and compute differences in the respective R2sbetween the competing models. Computing differences in R2sallows researchers to gauge potential changes in the effect sizesbetween the competing models, changes that could be a result ofnonzero indirect effects. In addition, researchers should report theinformation fit indices AIC or BIC. Although using CI-basedmethods to test the existence of an indirect effect or to makedichotomous decisions about significance of the indirect effect isnot recommended, researchers should report a CI to convey arange of plausible values for an indirect effect estimate. Theserecommendations are consistent with and enhance the APA rec-ommendations (APA Publication Manual, 2010; Appelbaum et al.,2018; Wilkinson & Task Force on Statistical Inference, AmericanPsychological Association, Science Directorate, 1999) for report-ing statistical analysis results.
In conclusion, we believe that our proposed MBCO procedureprovides multiple ways to evaluate hypotheses about mediationeffects beyond the methods widely recommended in the literature(e.g., CI-based approaches). We believe that work using theMBCO procedure will advance the rich literature on testing andinterpreting mediation models.
References
Akaike, H. (1974). A new look at the statistical model identification. IEEETransactions on Automatic Control, 19, 716–723. http://dx.doi.org/10.1109/TAC.1974.1100705
Amrhein, V., Trafimow, D., & Greenland, S. (2019). Inferential statisticsas descriptive statistics: There is no replication crisis if we don’t expectreplication. The American Statistician, 73, 262–270. http://dx.doi.org/10.1080/00031305.2018.1543137
APA Publication Manual. (2010). Publication manual of the AmericanPsychological Association (6th ed.). Washington, DC: American Psy-chological Association.
Appelbaum, M., Cooper, H., Kline, R. B., Mayo-Wilson, E., Nezu, A. M.,& Rao, S. M. (2018). Journal article reporting standards for quantitativeresearch in psychology: The APA Publications and CommunicationsBoard task force report. American Psychologist, 73, 3–25. http://dx.doi.org/10.1037/amp0000191
Ato García, M., Vallejo Seco, G., & Ato Lozano, E. (2014). Classical andcausal inference approaches to statistical mediation analysis. Psico-thema, 26, 252–259.
Baron, R. M., & Kenny, D. A. (1986). The moderator-mediator variabledistinction in social psychological research: Conceptual, strategic, andstatistical considerations. Journal of Personality and Social Psychology,51, 1173–1182. http://dx.doi.org/10.1037/0022-3514.51.6.1173
Biesanz, J. C., Falk, C. F., & Savalei, V. (2010). Assessing mediationalmodels: Testing and interval estimation for indirect effects. MultivariateBehavioral Research, 45, 661–701. http://dx.doi.org/10.1080/00273171.2010.498292
Blume, J. D. (2002). Likelihood methods for measuring statistical evi-dence. Statistics in Medicine, 21, 2563–2599. http://dx.doi.org/10.1002/sim.1216
Boies, K., Fiset, J., & Gill, H. (2015). Communication and trust are key:Unlocking the relationship between leadership and team performanceand creativity. The Leadership Quarterly, 26, 1080–1094. http://dx.doi.org/10.1016/j.leaqua.2015.07.007
Boker, S., Neale, M., Maes, H., Wilde, M., Spiegel, M., Brick, T., . . . Fox,J. (2011). OpenMx: An open source extended structural equation mod-eling framework. Psychometrika, 76, 306 –317. http://dx.doi.org/10.1007/s11336-010-9200-6
Bollen, K. A. (1989). Structural equations with latent variables. NewYork, NY: Wiley. http://dx.doi.org/10.1002/9781118619179
Bollen, K. A., & Stine, R. (1990). Direct and indirect effects: Classical andbootstrap estimates of variability. Sociological Methodology, 20, 115–140. http://dx.doi.org/10.2307/271084
Bradley, J. V. (1978). Robustness? British Journal of Mathematical &Statistical Psychology, 31, 144–152. http://dx.doi.org/10.1111/j.2044-8317.1978.tb00581.x
Bulls, H. W., Lynch, M. K., Petrov, M. E., Gossett, E. W., Owens, M. A.,Terry, S. C., . . . Goodin, B. R. (2017). Depressive symptoms and sleepefficiency sequentially mediate racial differences in temporal summationof mechanical pain. Annals of Behavioral Medicine, 51, 673–682. http://dx.doi.org/10.1007/s12160-017-9889-x
Carmeli, A., McKay, A. S., & Kaufman, J. C. (2014). Emotional intelli-gence and creativity: The mediating role of generosity and vigor. TheJournal of Creative Behavior, 48, 290–309. http://dx.doi.org/10.1002/jocb.53
Cheung, M. W. L. (2007). Comparison of approaches to constructingconfidence intervals for mediating effects using structural equationmodels. Structural Equation Modeling, 14, 227–246. http://dx.doi.org/10.1080/10705510709336745
Cohen, J. (1988). Statistical power analysis for the behavioral sciences(2nd ed.). Hillsdale, NJ: Erlbaum.
Cohen, J. (1994). The earth is round (p � .05). American Psychologist, 49,997–1003. http://dx.doi.org/10.1037/0003-066X.49.12.997
Cohen, J., Cohen, P., West, S. G., & Aiken, L. S. (2003). Applied multipleregression/correlation analysis for the behavioral sciences (3rd ed.).Mahwah, NJ: Erlbaum.
Cole, D. A., & Preacher, K. J. (2014). Manifest variable path analysis:Potentially serious and misleading consequences due to uncorrectedmeasurement error. Psychological Methods, 19, 300–315. http://dx.doi.org/10.1037/a0033805
Cox, D. R., & Hinkley, D. V. (2000). Theoretical statistics. Boca Raton,FL: Chapman & Hall/CRC.
Cox, M. G., Kisbu-Sakarya, Y., Miocevic, M., & MacKinnon, D. P.(2013). Sensitivity plots for confounder bias in the single mediatormodel. Evaluation Review, 37, 405– 431. http://dx.doi.org/10.1177/0193841X14524576
Dekovic, M., Asscher, J. J., Manders, W. A., Prins, P. J. M., & van derLaan, P. (2012). Within-intervention change: Mediators of interventioneffects during multisystemic therapy. Journal of Consulting and ClinicalPsychology, 80, 574–587. http://dx.doi.org/10.1037/a0028482
Thi
sdo
cum
ent
isco
pyri
ghte
dby
the
Am
eric
anPs
ycho
logi
cal
Ass
ocia
tion
oron
eof
itsal
lied
publ
ishe
rs.
Thi
sar
ticle
isin
tend
edso
lely
for
the
pers
onal
use
ofth
ein
divi
dual
user
and
isno
tto
bedi
ssem
inat
edbr
oadl
y.
513IMPROVED INFERENCE IN MEDIATION ANALYSIS

Dwyer, J. H. (1983). Statistical models for the social and behavioralsciences. New York, NY: Oxford University Press.
Efron, B. (1987). Better bootstrap confidence intervals. Journal of theAmerican Statistical Association, 82, 171–185. http://dx.doi.org/10.1080/01621459.1987.10478410
Efron, B., & Tibshirani, R. J. (1993). An introduction to the bootstrap. NewYork, NY: Chapman & Hall.
Ernsting, A., Knoll, N., Schneider, M., & Schwarzer, R. (2015). Theenabling effect of social support on vaccination uptake via self-efficacyand planning. Psychology Health and Medicine, 20, 239–246. http://dx.doi.org/10.1080/13548506.2014.920957
Falk, C. F., & Biesanz, J. C. (2015). Inference and interval estimationmethods for indirect effects with latent variable models. StructuralEquation Modeling: A Multidisciplinary Journal, 22, 24–38. http://dx.doi.org/10.1080/10705511.2014.935266
Folmer, H. (1981). Measurement of the effects of regional policy instru-ments by means of linear structural equation models and panel data.Environment & Planning A, 13, 1435–1448. http://dx.doi.org/10.1068/a131435
Fox, J. (2016). Applied regression analysis and generalized linear models(3rd ed.). Los Angeles, CA: SAGE.
Fritz, M. S., Kenny, D. A., & MacKinnon, D. P. (2016). The combinedeffects of measurement error and omitting confounders in the single-mediator model. Multivariate Behavioral Research, 51, 681–697. http://dx.doi.org/10.1080/00273171.2016.1224154
Gill, P. E., Murray, W., Saunders, M. A., & Wright, M. H. (1986). Fortranpackage for nonlinear programming. User’s guide for NPSOL (Version4. 0). Stanford, CA: Stanford University. Retrieved from https://apps.dtic.mil/dtic/tr/fulltext/u2/a169115.pdf
Graça, J., Calheiros, M. M., & Oliveira, A. (2016). Situating moral disen-gagement: Motivated reasoning in meat consumption and substitution.Personality and Individual Differences, 90, 353–364. http://dx.doi.org/10.1016/j.paid.2015.11.042
Greenland, S., Senn, S. J., Rothman, K. J., Carlin, J. B., Poole, C.,Goodman, S. N., & Altman, D. G. (2016). Statistical tests, P values,confidence intervals, and power: A guide to misinterpretations. Euro-pean Journal of Epidemiology, 31, 337–350. http://dx.doi.org/10.1007/s10654-016-0149-3
Harlow, L., Mulaik, S. A., & Steiger, J. H. (Eds.). (1997). What if therewere no significance tests? Mahwah, NJ: Erlbaum.
Haslam, C., Cruwys, T., Milne, M., Kan, C.-H., & Haslam, S. A. (2016).Group ties protect cognitive health by promoting social identificationand social support. Journal of Aging and Health, 28, 244–266. http://dx.doi.org/10.1177/0898264315589578
Imai, K., Keele, L., & Tingley, D. (2010). A general approach to causalmediation analysis. Psychological Methods, 15, 309–334. http://dx.doi.org/10.1037/a0020761
Jaccard, J., & Wan, C. K. (1995). Measurement error in the analysis ofinteraction effects between continuous predictors using multiple regres-sion: Multiple indicator and structural equation approaches. Psycholog-ical Bulletin, 117, 348–357. http://dx.doi.org/10.1037/0033-2909.117.2.348
Judd, C. M., & Kenny, D. A. (1981). Process analysis: Estimating medi-ation in treatment evaluations. Evaluation Review, 5, 602–619. http://dx.doi.org/10.1177/0193841X8100500502
Kenny, D. A., Kashy, D. A., & Bolger, N. (1998). Data analysis in socialpsychology. In D. T. Gilbert, S. T. Fiske, & G. Lindzey (Eds.), Thehandbook of social psychology (4th ed., Vol. 1, pp. 233–265). Boston,MA: McGraw-Hill.
Kline, R. B. (2016). Principles and practice of structural equation mod-eling (4th ed.). New York, NY: Guilford Press.
Koning, I. M., Maric, M., MacKinnon, D., & Vollebergh, W. A. M. (2015).Effects of a combined parent-student alcohol prevention program onintermediate factors and adolescents’ drinking behavior: A sequential
mediation model. Journal of Consulting and Clinical Psychology, 83,719–727. http://dx.doi.org/10.1037/a0039197
Koopman, J., Howe, M., Hollenbeck, J. R., & Sin, H.-P. (2015). Smallsample mediation testing: Misplaced confidence in bootstrapped confi-dence intervals. Journal of Applied Psychology, 100, 194–202. http://dx.doi.org/10.1037/a0036635
Krull, J. L., & MacKinnon, D. P. (2001). Multilevel modeling of individualand group level mediated effects. Multivariate Behavioral Research, 36,249–277. http://dx.doi.org/10.1207/S15327906MBR3602_06
MacCallum, R. C., & Austin, J. T. (2000). Applications of structuralequation modeling in psychological research. Annual Review of Psychol-ogy, 51, 201–226. http://dx.doi.org/10.1146/annurev.psych.51.1.201
MacKinnon, D. P. (2008). Introduction to statistical mediation analysis.New York, NY: Erlbaum.
MacKinnon, D. P., Lockwood, C. M., Hoffman, J. M., West, S. G., &Sheets, V. (2002). A comparison of methods to test mediation and otherintervening variable effects. Psychological Methods, 7, 83–104. http://dx.doi.org/10.1037/1082-989X.7.1.83
Mackinnon, D. P., Lockwood, C. M., & Williams, J. (2004). Confidencelimits for the indirect effect: Distribution of the product and resamplingmethods. Multivariate Behavioral Research, 39, 99–128. http://dx.doi.org/10.1207/s15327906mbr3901_4
MacKinnon, D. P., & Pirlott, A. G. (2015). Statistical approaches forenhancing causal interpretation of the M to Y relation in mediationanalysis. Personality and Social Psychology Review, 19, 30–43. http://dx.doi.org/10.1177/1088868314542878
MacKinnon, D. P., Valente, M. J., & Wurpts, I. C. (2018). Benchmarkvalidation of statistical models: Application to mediation analysis ofimagery and memory. Psychological Methods, 23, 654–671. http://dx.doi.org/10.1037/met0000174
Maxwell, S. E., Delaney, H. D., & Kelley, K. (2018). Designing experi-ments and analyzing data: A model comparison perspective (3rd ed.).New York, NY: Routledge.
McArdle, J. J., & McDonald, R. P. (1984). Some algebraic properties of theReticular Action Model for moment structures. British Journal of Math-ematical & Statistical Psychology, 37, 234–251. http://dx.doi.org/10.1111/j.2044-8317.1984.tb00802.x
Molina, B. S. G., Walther, C. A. P., Cheong, J., Pedersen, S. L., Gnagy,E. M., & Pelham, W. E. J. (2014). Heavy alcohol use in early adulthoodas a function of childhood ADHD: Developmentally specific mediationby social impairment and delinquency. Experimental and Clinical Psy-chopharmacology, 22, 110–121. http://dx.doi.org/10.1037/a0035656
Muthén, B. O., & Asparouhov, T. (2015). Causal effects in mediationmodeling: An introduction with applications to latent variables. Struc-tural Equation Modeling, 22, 12–23. http://dx.doi.org/10.1080/10705511.2014.935843
Muthén, L. K., & Muthén, B. O. (2018). Mplus user’s guide (7th ed.). LosAngeles, CA: Author.
Neale, M. C., Hunter, M. D., Pritikin, J. N., Zahery, M., Brick, T. R.,Kirkpatrick, R. M., . . . Boker, S. M. (2016). OpenMx 2.0: Extendedstructural equation and statistical modeling. Psychometrika, 81, 535–549. http://dx.doi.org/10.1007/s11336-014-9435-8
Neale, M. C., & Miller, M. B. (1997). The use of likelihood-based confi-dence intervals in genetic models. Behavior Genetics, 27, 113–120.http://dx.doi.org/10.1023/A:1025681223921
Oliver, M. C., Bays, R. B., & Zabrucky, K. M. (2016). False memories andthe DRM paradigm: Effects of imagery, list, and test type. The Journalof General Psychology, 143, 33–48. http://dx.doi.org/10.1080/00221309.2015.1110558
Pawitan, Y. (2001). In all likelihood: Statistical modelling and inferenceusing likelihood. New York, NY: Oxford University Press.
Pek, J., & Wu, H. (2015). Profile likelihood-based confidence intervals andregions for structural equation models. Psychometrika, 80, 1123–1145.http://dx.doi.org/10.1007/s11336-015-9461-1
Thi
sdo
cum
ent
isco
pyri
ghte
dby
the
Am
eric
anPs
ycho
logi
cal
Ass
ocia
tion
oron
eof
itsal
lied
publ
ishe
rs.
Thi
sar
ticle
isin
tend
edso
lely
for
the
pers
onal
use
ofth
ein
divi
dual
user
and
isno
tto
bedi
ssem
inat
edbr
oadl
y.
514 TOFIGHI AND KELLEY

Podsakoff, P. M., MacKenzie, S. B., Lee, J.-Y., & Podsakoff, N. P. (2003).Common method biases in behavioral research: A critical review of theliterature and recommended remedies. Journal of Applied Psychology,88, 879–903. http://dx.doi.org/10.1037/0021-9010.88.5.879
Preacher, K. J., & Hayes, A. F. (2008). Asymptotic and resamplingstrategies for assessing and comparing indirect effects in multiple me-diator models. Behavior Research Methods, 40, 879–891. http://dx.doi.org/10.3758/BRM.40.3.879
R Core Team. (2019). R: A Language and Environment for StatisticalComputing (Version 3.6.0) [Computer software]. Retrieved from http://www.R-project.org/
Raudenbush, S. W., & Bryk, A. S. (2002). Hierarchical linear models:Applications and data analysis methods (2nd ed.). Thousand Oaks, CA:SAGE.
Rosseel, Y. (2012). lavaan: An R package for structural equation modeling.Journal of Statistical Software, 48, 1–36. http://dx.doi.org/10.18637/jss.v048.i02
SAS Institute Inc. (2016). SAS/STAT 14.2 user’s guide. Cary, NC: Author.Retrieved from http://support.sas.com/documentation/cdl/en/stathpug/67524/PDF/default/stathpug.pdf
Schwarz, G. (1978). Estimating the dimension of a model. Annals ofStatistics, 6, 461–464. http://dx.doi.org/10.1214/aos/1176344136
Shrout, P. E., & Bolger, N. (2002). Mediation in experimental and non-experimental studies: New procedures and recommendations. Psycho-logical Methods, 7, 422–445. http://dx.doi.org/10.1037/1082-989X.7.4.422
Snijders, T. A. B., & Bosker, R. J. (2012). Multilevel analysis: An intro-duction to basic and advanced multilevel modeling (2nd ed.). ThousandOaks, CA: SAGE.
Snyman, J. A. (2005). Practical mathematical optimization: An introduc-tion to basic optimization theory and classical and new gradient-basedalgorithms. New York, NY: Springer.
Taylor, A. B., MacKinnon, D. P., & Tein, J.-Y. (2008). Tests of thethree-path mediated effect. Organizational Research Methods, 11, 241–269. http://dx.doi.org/10.1177/1094428107300344
Thoemmes, F., Mackinnon, D. P., & Reiser, M. R. (2010). Power analysisfor complex mediational designs using Monte Carlo methods. StructuralEquation Modeling, 17, 510–534. http://dx.doi.org/10.1080/10705511.2010.489379
Tofighi, D., Hsiao, Y.-Y., Kruger, E. S., MacKinnon, D. P., Van Horn,M. L., & Witkiewitz, K. A. (2019). Sensitivity analysis of the no-omittedconfounder assumption in latent growth curve mediation models. Struc-tural Equation Modeling, 26, 94 –109. http://dx.doi.org/10.1080/10705511.2018.1506925
Tofighi, D., & Kelley, K. (2016). Assessing omitted confounder bias inmultilevel mediation models. Multivariate Behavioral Research, 51,86–105. http://dx.doi.org/10.1080/00273171.2015.1105736
Tofighi, D., & Kelley, K. (2019). Indirect effects in sequential mediationmodels: Evaluating methods for hypothesis testing and confidence in-terval formation. Multivariate Behavioral Research. Advance onlinepublication. http://dx.doi.org/10.1080/00273171.2019.1618545
Tofighi, D., & MacKinnon, D. P. (2011). RMediation: An R package formediation analysis confidence intervals. Behavior Research Methods,43, 692–700. http://dx.doi.org/10.3758/s13428-011-0076-x
Tofighi, D., & MacKinnon, D. P. (2016). Monte Carlo confidence intervalsfor complex functions of indirect effects. Structural Equation Modeling,23, 194–205. http://dx.doi.org/10.1080/10705511.2015.1057284
Tofighi, D., West, S. G., & MacKinnon, D. P. (2013). Multilevel mediationanalysis: The effects of omitted variables in the 1–1-1 model. BritishJournal of Mathematical & Statistical Psychology, 66, 290–307. http://dx.doi.org/10.1111/j.2044-8317.2012.02051.x
Valeri, L., & Vanderweele, T. J. (2013). Mediation analysis allowing forexposure-mediator interactions and causal interpretation: Theoreticalassumptions and implementation with SAS and SPSS macros. Psycho-logical Methods, 18, 137–150. http://dx.doi.org/10.1037/a0031034
VanderWeele, T. J. (2010). Bias formulas for sensitivity analysis for directand indirect effects. Epidemiology, 21, 540–551. http://dx.doi.org/10.1097/EDE.0b013e3181df191c
VanderWeele, T. J. (2015). Explanation in causal inference: Methods formediation and interaction. New York, NY: Oxford University Press.
Wald, A. (1943). Tests of statistical hypotheses concerning several param-eters when the number of observations is large. Transactions of theAmerican Mathematical Society, 54, 426 – 482. http://dx.doi.org/10.1090/S0002-9947-1943-0012401-3
Wasserstein, R. L., Schirm, A. L., & Lazar, N. A. (2019). Moving to aworld beyond “p � 0.05”. The American Statistician, 73, 1–19. http://dx.doi.org/10.1080/00031305.2019.1583913
Weisstein, E. W. (2018). Smooth function. Retrieved from http://mathworld.wolfram.com/SmoothFunction.html
Wickham, H., François, R., Henry, L., & Müller, K. (2019). dplyr: Agrammar of data manipulation. Retrieved from https://CRAN.R-project.org/package�dplyr
Wilkinson, L., & Task Force on Statistical Inference, American Psycho-logical Association, Science Directorate. (1999). Statistical methods inpsychology journals: Guidelines and explanations. American Psycholo-gist, 54, 594–604. http://dx.doi.org/10.1037/0003-066X.54.8.594
Wilks, S. S. (1938). The large-sample distribution of the likelihood ratiofor testing composite hypotheses. Annals of Mathematical Statistics, 9,60–62. http://dx.doi.org/10.1214/aoms/1177732360
Williams, J., & MacKinnon, D. P. (2008). Resampling and distribution ofthe product methods for testing indirect effects in complex models.Structural Equation Modeling: A Multidisciplinary Journal, 15, 23–51.
Yzerbyt, V., Muller, D., Batailler, C., & Judd, C. M. (2018). New recom-mendations for testing indirect effects in mediational models: The needto report and test component paths. Journal of Personality and SocialPsychology, 115, 929–943. http://dx.doi.org/10.1037/pspa0000132
Zahery, M., Maes, H. H., & Neale, M. C. (2017). CSOLNP: Numericaloptimization engine for solving non-linearly constrained problems. TwinResearch and Human Genetics, 20, 290–297. http://dx.doi.org/10.1017/thg.2017.28
Received November 27, 2017Revision received December 3, 2019
Accepted January 4, 2020 �
Thi
sdo
cum
ent
isco
pyri
ghte
dby
the
Am
eric
anPs
ycho
logi
cal
Ass
ocia
tion
oron
eof
itsal
lied
publ
ishe
rs.
Thi
sar
ticle
isin
tend
edso
lely
for
the
pers
onal
use
ofth
ein
divi
dual
user
and
isno
tto
bedi
ssem
inat
edbr
oadl
y.
515IMPROVED INFERENCE IN MEDIATION ANALYSIS