Improved Hydrogen Storage and Thermal Conductivity in High ...
14
Improved Hydrogen Storage and Thermal Conductivity in High- Density MOF‑5 Composites Justin Purewal,* ,†,# Dongan Liu, †,§ Andrea Sudik, ‡,∥ Mike Veenstra, ‡ Jun Yang, ‡ Stefan Maurer, ¶ Ulrich Mü ller, ¶ and Donald J. Siegel* ,† † Mechanical Engineering Department, University of Michigan, 2350 Hayward Street, Ann Arbor, Michigan 48109, United States ‡ Ford Motor Company, Research and Advanced Engineering, MD 1170/RIC, Dearborn, Michigan 48121, United States ¶ BASF SE, Chemicals Research and Engineering, 67056 Ludwigshafen, Germany * S Supporting Information ABSTRACT: Porous adsorbents such as MOF-5 have low thermal conductivities which can limit the performance of adsorption-based hydrogen storage systems. To improve the thermal properties of these materials, we have prepared a series of high-density MOF-5 composites containing 0−10 wt % expanded natural graphite (ENG), which serves as a thermal conduction enhancer. The addition of 10 wt % ENG to MOF-5 and compaction to 0.5 g/ cm 3 was previously found to increase the thermal conductivity relative to neat MOF-5 of the same density by a factor of 5. In this study, detailed measurements of the hydrogen storage behavior of MOF-5/ENG composites between 77 and 295 K are reported. We find that MOF-5 pellets with 0 wt % ENG and a density of 0.5 g/cm 3 have a total volumetric hydrogen storage density at 77 K and 100 bar that is 23% larger than powder MOF-5 and 41% larger than cryo-compressed hydrogen. The addition of 10% ENG to 0.5 g/cm 3 MOF-5 pellets produces only a small decrease (6%) in the total volumetric hydrogen storage compared to neat MOF-5 pellets of equal density. The excess, absolute, total, and deliverable hydrogen storage amounts by the MOF-5 composites are compared for ENG additions of 0−10 wt % and pellet densities of 0.3−0.7 g/cm 3 . Three adsorption models (Unilan, Tó th, Dubinin− Astakhov) are compared for their effectiveness in describing hydrogen adsorption isotherms of MOF-5 and MOF-5/ENG composites. The Unilan model provides the most accurate description of the experimental data, requiring only five temperature- invariant parameters to accurately fit the data across a wide temperature range. ■ INTRODUCTION While materials discovery has been a focus of most hydrogen storage research, the integration of a given storage material into a viable storage system remains an equally important problem. 1 Engineering challenges include optimizing the following: (a) packing density, (b) heat and mass transfer, and (c) hydrogen uptake properties of adsorbent materials. In this study we have used metal−organic framework MOF-5 as a prototype material for exploring processing strategies that maximize heat transfer and packing density while preserving hydrogen storage capacity. MOF-5 consists of ZnO 4 clusters connected by 1,4- benzenedicarboxylate (BDC) linkers. 2 This compound is one of the most thoroughly studied adsorbent materials, and large numbers of H 2 adsorption measurements have been published. Depending on synthesis, postprocessing, and activation methods, the maximum excess hydrogen adsorption at 77 K for MOF-5 has been measured at 4.3, 3 4.9, 4 5.1, 5 5.8, 6,7 and 7.1 wt %. 8 The isosteric heat has been estimated at 3.8, 5 4.0, 9 4.1, 3 4.8, 7 and 4.7−5.2 kJ/mol. 10 Although characterization of the excess adsorption by MOF- 5 is important, it is the total storage capacity that is most relevant from a systems perspective. The total capacity includes both the excess hydrogen near the adsorbent surface plus the bulk hydrogen gas residing throughout the entire void volume (intracrystalline pores, intercrystalline voids, interstitial spaces). Since MOF-5 is commonly synthesized as a powder (crystallite size less than 1 μm) with low bulk density (0.13−0.2 g/cm 3 ), it is advantageous to process the powder into pellets or extrudates which minimize the presence of interstitial spaces, where the amount of higher-density adsorbed hydrogen will be small. 11−13 Compacted pellets, rather than loose powders, are more attractive for on-board gas storage applications due to the potentially larger volumetric storage density and the improved ease of handling. In a previous study we found that MOF-5 compaction produced modest decreases in the gravimetric hydrogen storage capacity, offset by much larger increases in the volumetric capacity. 14 Micropore volume decreased with compaction due to amorphization of the MOF-5 crystal structure; 15 however, it was possible to mitigate this effect by controlling the pellet density. Similar results for the compaction Received: June 5, 2012 Revised: August 4, 2012 Published: September 13, 2012 Article pubs.acs.org/JPCC © 2012 American Chemical Society 20199 dx.doi.org/10.1021/jp305524f | J. Phys. Chem. C 2012, 116, 20199−20212
Transcript of Improved Hydrogen Storage and Thermal Conductivity in High ...
Improved Hydrogen Storage and Thermal Conductivity in High-Density MOF‑5 CompositesJustin Purewal,*,†,# Dongan Liu,†,§ Andrea Sudik,‡,∥ Mike Veenstra,‡ Jun Yang,‡ Stefan Maurer,¶
Ulrich Muller,¶ and Donald J. Siegel*,†
†Mechanical Engineering Department, University of Michigan, 2350 Hayward Street, Ann Arbor, Michigan 48109, United States‡Ford Motor Company, Research and Advanced Engineering, MD 1170/RIC, Dearborn, Michigan 48121, United States¶BASF SE, Chemicals Research and Engineering, 67056 Ludwigshafen, Germany
*S Supporting Information
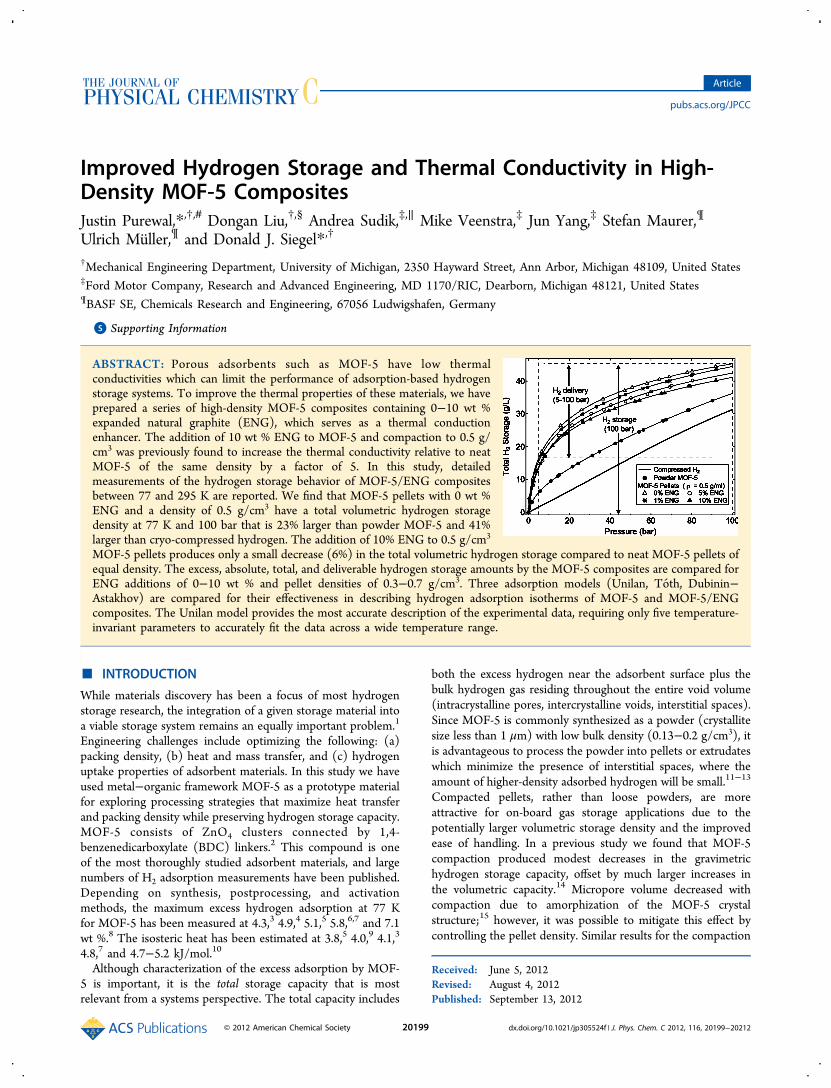
ABSTRACT: Porous adsorbents such as MOF-5 have low thermalconductivities which can limit the performance of adsorption-based hydrogenstorage systems. To improve the thermal properties of these materials, we haveprepared a series of high-density MOF-5 composites containing 0−10 wt %expanded natural graphite (ENG), which serves as a thermal conductionenhancer. The addition of 10 wt % ENG to MOF-5 and compaction to 0.5 g/cm3 was previously found to increase the thermal conductivity relative to neatMOF-5 of the same density by a factor of 5. In this study, detailedmeasurements of the hydrogen storage behavior of MOF-5/ENG compositesbetween 77 and 295 K are reported. We find that MOF-5 pellets with 0 wt %ENG and a density of 0.5 g/cm3 have a total volumetric hydrogen storagedensity at 77 K and 100 bar that is 23% larger than powder MOF-5 and 41%larger than cryo-compressed hydrogen. The addition of 10% ENG to 0.5 g/cm3
MOF-5 pellets produces only a small decrease (6%) in the total volumetric hydrogen storage compared to neat MOF-5 pellets ofequal density. The excess, absolute, total, and deliverable hydrogen storage amounts by the MOF-5 composites are compared forENG additions of 0−10 wt % and pellet densities of 0.3−0.7 g/cm3. Three adsorption models (Unilan, Toth, Dubinin−Astakhov) are compared for their effectiveness in describing hydrogen adsorption isotherms of MOF-5 and MOF-5/ENGcomposites. The Unilan model provides the most accurate description of the experimental data, requiring only five temperature-invariant parameters to accurately fit the data across a wide temperature range.
■ INTRODUCTION
While materials discovery has been a focus of most hydrogenstorage research, the integration of a given storage material intoa viable storage system remains an equally important problem.1
Engineering challenges include optimizing the following: (a)packing density, (b) heat and mass transfer, and (c) hydrogenuptake properties of adsorbent materials. In this study we haveused metal−organic framework MOF-5 as a prototype materialfor exploring processing strategies that maximize heat transferand packing density while preserving hydrogen storage capacity.MOF-5 consists of ZnO4 clusters connected by 1,4-benzenedicarboxylate (BDC) linkers.2 This compound is oneof the most thoroughly studied adsorbent materials, and largenumbers of H2 adsorption measurements have been published.Depending on synthesis, postprocessing, and activationmethods, the maximum excess hydrogen adsorption at 77 Kfor MOF-5 has been measured at 4.3,3 4.9,4 5.1,5 5.8,6,7 and 7.1wt %.8 The isosteric heat has been estimated at 3.8,5 4.0,9 4.1,3
4.8,7 and 4.7−5.2 kJ/mol.10
Although characterization of the excess adsorption by MOF-5 is important, it is the total storage capacity that is mostrelevant from a systems perspective. The total capacity includes
both the excess hydrogen near the adsorbent surface plus thebulk hydrogen gas residing throughout the entire void volume(intracrystalline pores, intercrystalline voids, interstitial spaces).Since MOF-5 is commonly synthesized as a powder (crystallitesize less than 1 μm) with low bulk density (0.13−0.2 g/cm3), itis advantageous to process the powder into pellets or extrudateswhich minimize the presence of interstitial spaces, where theamount of higher-density adsorbed hydrogen will be small.11−13
Compacted pellets, rather than loose powders, are moreattractive for on-board gas storage applications due to thepotentially larger volumetric storage density and the improvedease of handling. In a previous study we found that MOF-5compaction produced modest decreases in the gravimetrichydrogen storage capacity, offset by much larger increases inthe volumetric capacity.14 Micropore volume decreased withcompaction due to amorphization of the MOF-5 crystalstructure;15 however, it was possible to mitigate this effect bycontrolling the pellet density. Similar results for the compaction
Received: June 5, 2012Revised: August 4, 2012Published: September 13, 2012
Article
pubs.acs.org/JPCC
© 2012 American Chemical Society 20199 dx.doi.org/10.1021/jp305524f | J. Phys. Chem. C 2012, 116, 20199−20212

of MOF-17716,17 and activated carbons18 have also beenreported.Due to their large pore sizes (e.g., >20 Å diameter) and high
free volumes (e.g., >90%), the thermal conductivity of manymicroporous materials (e.g., zeolites, MOFs) is unusually low.This low conductivity can place limitations on the design ofcryo-adsorption-based storage systems. For example, it canhinder fast refueling due to the longer cool-down timesrequired to reach operating temperatures. Heat sources duringrefueling, including the released heat of adsorption, thecompression work, and the thermal mass from the inlethydrogen gas, must also be dissipated to prevent a temperatureincrease in the storage material.19 Although the heat dissipationproblem for cryo-sorption is not as demanding as for hydridebeds, the unusually low heat conduction properties of MOFspresent a significant materials engineering challenge. As anexample, a vehicle-scale tank filled with 5.4 kg of Cu-BTC at 77K that is charged with 200 bar of H2 gas (at room temperature)over 5 min can produce an average temperature increase of 15K near the tank center, even with the tank immersed in an LN2bath.20 Extensive experimental data is also available foractivated carbon sorbent beds.21−23
In a prior study, we reported that low-density (0.3 g/cm3)MOF-5 pellets had a thermal conductivity below 0.1 W/mK atroom temperature, slightly lower than the value of 0.3 W/mKmeasured for a single crystal of MOF-5.24 To improve thermalconduction, we synthesized MOF-5-based composites contain-ing 0−10% expanded natural graphite (ENG), with pelletdensities of 0.3, 0.5, or 0.7 g/cm3.25 ENG (i.e., natural graphitewhich has been soaked in sulfuric acid and purified by heatingto high temperatures) has been successfully used as a thermalconduction enhancer in a variety of metal and complex hydridematerials.26−28 We found that for pellets with density 0.5 g/cm3, the addition of 10% ENG produced a factor of 5improvement in thermal conductivity relative to neat MOF-5pellets of equal density. Although alternate strategies forenhancing thermal conduction exist, such as packing MOF-5powder within open-cell metal foams, composite formationmay impose a smaller penalty on both volumetric andgravimetric hydrogen storage density and may be thereforebetter suited for the moderate heat dissipation requirements ofcryo-adsorption.As our previous study focused on the thermal properties of
MOF-5/ENG composites, in the present study we explore thehydrogen storage properties of these composites at temper-atures between 77 and 295 K. We compare the effectiveness ofa pore-filling model (Dubinin−Astakhov) and two monolayer-based models (Unilan, Toth) for describing MOF-5 hydrogenadsorption isotherms, comparing to both published data (30−300 K, 0−60 bar) and our own experimental measurements(77−295 K, 0−100 bar). The Unilan model is found toproduce the most accurate fits to the MOF-5 isotherms acrossthe complete range of temperature, even while requiring onlyfive temperature-invariant parameters. Second, the effect ofvarying ENG content and pellet density on the excess and totalhydrogen storage properties of the MOF-5 composites issystematically investigated. Compacting powder MOF-5 to adensity of 0.5 g/cm3 is found to increase the maximum excesshydrogen adsorption at 77 K, on a volumetric basis, by a factorof about three. Adding 10 wt % ENG to the 0.5 g/cm3 neatMOF-5 pellets for improved thermal conduction reduces theexcess adsorption (volumetric and gravimetric) by approx-imately 12% compared to the neat pellets. Additions of 5 wt %
ENG result in less pronounced reductions in the hydrogenstorage amounts, but at the expense of smaller improvements inthe thermal conductivity. These results indicate that theaddition of small of amounts of ENG to compacted MOF-5provides a simple way to enhance thermal properties with onlymodest decreases in the hydrogen storage amounts.
■ EXPERIMENTAL DETAILSExperimental Methods. Details on the synthesis and
characterization of the as-received MOF-5 powder areavailable,11,12 and our methods for preparing MOF-5/ENGcomposite pellets have been described previously.14,25 TheENG composition is given as a percentage of the total pelletmass. Hydrogen adsorption was measured on a volumetricSievert’s-type instrument (PCT-Pro 2000, Setaram), with anoil-free scroll vacuum pump (Anest Iwata model ISP90).Samples masses varied between 320 and 484 mg. Prior tomeasurement, the samples were outgassed at 403 K undercontinuous vacuum for at least 6 h (3 h at room temperature,followed by 3 h at 403 K). The void volume of the sampleholder was determined by helium expansion for each sample.To correct for the difference between sample temperature andthe instrument temperature, the void volume was divided into asubvolume at sample temperature and a subvolume at roomtemperature using a fixed dividing line, with the hydrogendensity evaluated separately for each subvolume.29 To improveaccuracy, we performed a calibration test for each MOF-5/ENG sample using an equivalent displacement volume ofnonporous Al2O3 powder and identical measurement settings.Maximum adsorption during calibration tests (i.e., instrumenterror) was about 0.3 mmol of hydrogen, in comparison to the10 mmol of H2 that was typically adsorbed for each sample.Calibration curves were subtracted from the correspondingsample data, although this had only a minor effect on theresults. Adsorption kinetics were rapid for the MOF-5composites at all temperatures, even for the high-densitypellets, and equilibrium was reached within 3 min. The totalmeasurement time for adsorption and desorption cycles wasfixed at 5 min for each point.Isotherms were measured for temperatures between 77 and
295 K. The 77 K isotherms were measured using a liquidnitrogen bath; 200 K isotherms were measured with the sampleholder covered in solid CO2 powder; 295 K isotherms weremeasured at ambient temperature. Intermediate temperatureisotherms were measured using a continuous-flow, sample-in-vapor liquid nitrogen cryostat (CryoPro-2009, Setaram). Thetemperature stability was within 1 K over the course of a singlemeasurement, and the sample temperature was accuratelymeasured using an internal platinum resistance thermometer indirect contact with the sample. The hydrogen gas density wascalculated from an equation of state29 for normal hydrogenimplemented in the NIST Standard Reference Database 23.31
Definitions of Adsorbent Density. For porous materialsthere exist several definitions of density.32 The skeletal density(ρsk), which excludes the volume of open pores, is typicallymeasured for each sample using helium. For powder MOF-5, avalue of ρsk = 2.03 g/cm3 was determined by a heliumpycnometer (AccuPyc 1339, Micromeritics). For other samples,the skeletal densities were estimated using the volumetric PCTinstrument. The single-crystal density (ρsc), which includes thevolume of all intracrystalline pores, is assumed to equal thetheoretical MOF-5 crystallographic density (0.605 g/cm3). Theenvelope density (ρenv) is defined in terms of the volume within
The Journal of Physical Chemistry C Article
dx.doi.org/10.1021/jp305524f | J. Phys. Chem. C 2012, 116, 20199−2021220200

a close-fitting envelope enclosing a pellet and is calculated fromthe physical dimensions of a single pellet. The envelope densityis used only for pellets, not for powder MOF-5 (for which thebulk density is used instead). The bulk density (ρbulk) includesthe total volume, including all internal pore and interparticlevoid space, after the powder has settled following tapping orvibration. We measured the powdered MOF-5 bulk density asρbulk = 0.13 g/cm3 using a calibrated volume and approximately10 s of tapping. We use this value for all calculations in thearticle, as it accurately reflects the bulk density of powder thatwas loaded in the Sievert’s sample holder for volumetricmeasurements. In practice, however, the bulk density of powderMOF-5 can depend on factors such as particle size, electrostaticinteractions between particles, and the method of densitymeasurement − we found that it could vary between 0.13 and0.2 g/cm3.To provide a realistic estimate of the density of an actual
sorbent bed, the bulk density is used for powder MOF-5 whilethe envelope density is used to describe compacted MOF-5/ENG monoliths. These assumptions are consistent with the useof a compacted MOF-5 monolith within the tank. Accordingly,the specific void volume for pellets is defined as
ρ ρ= −v (pellet) 1/ 1/v env sk (1)
while for the MOF-5 powder it is defined as
ρ ρ= −v (powder) 1/ 1/v bulk sk (2)
The bulk density of MOF-5/ENG pellets is based on thevolume of a rigid storage tank occupied by a random packing ofcylindrically shaped pellets, which would be lower than theenvelope density as defined above. As an estimate, the packingratio of single-size solid spheres after settling is typically closeto 60%,33 although the packing ratio for cylindrical pellets couldbe improved by stacking them in close-packed arrays.Definitions of Hydrogen Storage Density. Three
definitions of adsorptive hydrogen storage density are used inthis study. Excess adsorption (nex), as directly measured by thevolumetric method, is presented here either in units of moles ofH2 per kilogram of adsorbent (mol/kg) or as a percentage ofthe combined H2 and sorbent mass (wt %). Absolute adsorption(na) is related to excess adsorption by na = nex + vaρg, where va isthe adsorbate volume and ρg is the bulk hydrogen gas density.The adsorbate volume is not well-defined but should enclosethe regions around the adsorbent surface where local adsorptivedensity exceeds the bulk gas density. It may also be interpretedas the volume near the surface that is subjected to the potentialfield of the solid. We assume that va is constant with respect toadsorption amount and temperature and that ρa = na/va equalsan average adsorbate density. The magnitude of va should beclose to the MOF-5 intracrystalline open pore volume, vpore =1/ρsc − 1/ρsk = 1.2 g/cm3).Total storage is a third measure of adsorptive hydrogen
storage density. It counts the total hydrogen amount (bothadsorbed and gaseous) present within the void volumes ofMOF-5 pellets and powder and is important for determiningthe actual hydrogen delivery from a storage tank. Therefore, itprovides a measure of the effectiveness of an adsorbent inincreasing the storage capacity of a fixed volume when filledwith the adsorbent. The total hydrogen storage amount forsorbent mass msorbent is equal to Nt = msorbent(nex + vvρg), wherethe void volume has been defined for powders (eq 2) and
pellets (eq 1). When presented as a fraction of total adsorbentvolume (assuming a monolith), it has the form
ρρρ
ρ= + −⎛⎝⎜⎜
⎞⎠⎟⎟n n 1t,vol env ex
env
skg
(3)
where ρenv should be replaced with ρbulk for powder MOF-5.This total volumetric storage quantity can be considered as amaterial property (as opposed to a system property), althoughit does depend on material postprocessing such as mechanicalcompaction and composite formation. The total gravimetrichydrogen storage is not discussed in this article.34
■ MODELSModified D−A Model. To develop realistic heat and mass
balance equations for an adsorbent-based storage system, it isuseful to have a model that describes the adsorption across awide range of practical temperatures and pressures. It is alsodesirable to accurately determine parameters for such a modelby fitting to a small number of isotherms at easily measuredtemperatures such as 77, 87 (liquid Ar), 200 (solid CO2), and295 K. The Dubinin−Astakhov (D−A) model35 has beenfrequently used in a modified form to describe supercriticalhydrogen adsorption in activated carbons,36,37 zeolites,38 and inthe framework material Cu-BTC21 at pressures up to 200 bar.Conceptually, the D−A model considers the adsorbed specieswithin the micropores as similar to a liquid, although withproperties that differ from the bulk liquid due to the presenceof the adsorbent force field.39 When the D−A model ismodified to address excess adsorption within a constantadsorbate volume,37 the resulting equation is given by
ρ= −+
−⎜ ⎟⎡⎣⎢⎢
⎛⎝
⎞⎠
⎛⎝⎜
⎞⎠⎟⎤⎦⎥⎥n n
RTa bT
p
pvexp ln
mm
ex maxs
g a(4)
where E = a + bT is the characteristic energy of adsorption (i.e.,assumed here to vary linearly with temperature), ps is apseudosaturation pressure, and m can be interpreted as amicropore heterogeneity parameter. A value of m = 2 appearsadequate to describe hydrogen adsorption on the activatedcarbons AX-21 and CNS-201 and the framework material Cu-BTC.22 For subcritical adsorption, the adsorption potential A =−RT ln(p/ps) is considered as the difference in free energybetween the adsorbate phase and the saturated liquid at thesame temperature, while at supercritical temperatures apseudosaturation pressure is substituted for ps. The character-istic free energy E is generally temperature-invariant in theabsence of electrostatic adsorbent−adsorbate interactions.35
For a nonpolar adsorbate such as H2, however, smalltemperature variations in E can be explained as the entropiccontribution to the free energy. The linear variation E = a + bTassumed in eq 4 has been found to work well empirically forhydrogen adsorption in activated carbons.37 An inherentweakness of the D−A model is that it does not reduce toHenry’s law in the low-concentration limit. Further, theabsolute differential enthalpy of adsorption derived from eq 4using the Clausius−Clapeyron equation has a logarithmicsingularity at na = 0.Although the modified D−A model has been found to work
well for activated carbons such as AX-21 over a widetemperature range, our data suggest (see below) that it is lessuseful for describing hydrogen adsorption in crystalline porousmaterials such as MOF-5 which lack strong adsorption sites.
The Journal of Physical Chemistry C Article
dx.doi.org/10.1021/jp305524f | J. Phys. Chem. C 2012, 116, 20199−2021220201

While MOF-5 and AX-21 both possess similar total microporevolumes, the pore structures in AX-21 are highly heterogeneousin comparison to MOF-5, with some fraction of those porescorresponding to strong adsorption sites. This leads to asteeper H2 isotherm shape at low pressures. Activated Cu-BTCcontains coordinatively unsaturated metal center (CUMC) siteswhich bind H2 by strong Coulomb interactions, also leading toa greater adsorption at low pressure. While the modified D−Amodel is effective in describing the H2 adsorption isothermsexhibited by materials such as AX-21 and Cu-BTC, it may notnecessarily be effective for MOF-5.We evaluated the effectiveness of the modified D−A model
(eq 4) on a set of benchmark MOF-5 hydrogen adsorptionisotherms available over a wide temperature range of 30−300K.7 Because these measurements contain many data points atlow pressure (<0.1 bar), yet fewer at high pressures, we havereweighted the data so that it is more evenly distributed acrossthe complete range of pressure for each isotherm. We triedfitting eq 4 to the reference MOF-5 isotherms using manydifferent criteria, such as fitting only high and low temperaturesand fitting only between 77 and 300 K. One representative fit isdisplayed in Figure 1, while the remainder are available inFigure S1. It does not appear possible to accurately fit the entiretemperature range while keeping the heterogeneity parameterfixed at m = 2. In particular, the model yields negative uptakevalues at 200 and 300 K. To fit the MOF-5 isotherm across the
entire temperature range, it was necessary to set m = 12.4, asshown in Figure 1a. However, this results in an unrealisticallylarge characteristic free energy, E = 3.67 + 0.195 × T (e.g., withvalues of 18.6 kJ/mol at 77 K and 61.2 kJ/mol at 295 K). Asdisplayed in Figure 1b, modeled isotherms for these parametersstill have negative values at 300 K up to a pressure of 27 bar.The assumptions of a temperature-independent ps and a lineartemperature variation for E = a + bT cause the modified D−Amodel to consistently underestimate the adsorbate density at200 and 300 K, resulting in negative excess adsorption values atlow pressures. Apparently the reason this problem does notarise for AX-21 or Cu-BTC is that the adsorption isotherms forthese materials are steeper than those of MOF-5 at lowpressures due to their larger adsorption enthalpies.To obtain satisfactory fits for eq 4 across the complete
temperature range, while retaining reasonable values for themodel parameters, it is necessary to fit ps and E independentlyfor each temperature. Details of these fits are provided in FigureS1 in the Supporting Information. The temperature variation ofps is described by a power law expression, varying by 5 orders ofmagnitude between 30 and 300 K. It appears that E does notvary linearly with temperature as originally assumed but isdescribed instead by a second-order polynomial, increasingfrom 2.4 kJ/mol at 30 K to 18.2 kJ/mol at 300 K. Regardless ofhow the physical significance of ps and E is interpreted, it isclear that the modified D−A model is not a convenient tool for
Figure 1. Fits of the modified D−A equation (eq 4) to experimental MOF-5 isotherms from ref 7. (a) Model fitted to all temperatures withoutconstraints on m. (b) Same fits, zoomed in to the excess adsorption range of 0−5 mol/kg.
Figure 2. Fits of the D−A equation (eq 5) to benchmark MOF-5 experimental hydrogen adsorption data from ref 7. (a) Model fitted over thecomplete temperature range. (b) Model fitted to data between the 50 and 100 K temperature range.
The Journal of Physical Chemistry C Article
dx.doi.org/10.1021/jp305524f | J. Phys. Chem. C 2012, 116, 20199−2021220202
modeling H2 adsorption in MOF-5 across a wide temperaturerange. Since the empirical temperature variation of ps and E isnot known a priori, it requires 21 adjustable parameters to fitthe 9 experimental temperatures (i.e., a unique ps and E foreach temperature).The D−A model has been previously applied to MOF-5
hydrogen uptake over a narrow 50−87 K temperature range.6
Instead of assuming a constant adsorbate volume, as in eq 4, thefractional volume-filling interpretation was used in whichmicropores are gradually filled with a liquidlike hydrogenadsorbate phases, similar in density to liquid hydrogen but witha thermal expansion factor. The adsorbate volume increaseswith adsorption up to a maximum value (Va). Excess adsorptionis equal to
ρ ρ= − −⎡⎣⎢⎢
⎛⎝⎜
⎞⎠⎟
⎤⎦⎥⎥n V
RTE
p
p( ) exp ln
m
ex a g as
(5)
where the adsorbate density and pseudosaturation pressure areboth assumed to vary with temperature according to
ρ ρ= − −a T Texp[ ( )]a 0 0 (6a)
= γp p T T( / )s c c (6b)
We tested the fits of the eqs 5−6 using the same set ofbenchmark MOF-5 isotherms. Two representative fits areshown in Figure 2. As is apparent from both panels in Figure 2,this model is only useful for describing narrow, cryogenictemperature ranges such as 50−100 K. At higher temperaturesthe assumption of a liquidlike hydrogen adsorbate phase isquestionable. Therefore, the model greatly underpredicts theadsorbate volume at 200 and 300 K, resulting in negligibleexcess adsorption. In panel (a), where the model was fitted toall temperatures, the agreement between model and exper-imental data was poor for all temperatures. Further, fits to theentire set of isotherms yields unrealistic values for someparameters, such as a characteristic adsorbate density ρ0 = 1674g/L which is more than 20 times larger than the density ofliquid hydrogen. In panel (b) of the same figure, the model wasfitted only to the 50−100 K data, resulting in very poor fitsoutside that temperature range. To obtain satisfactory fits of eqs5−6 across a wide temperature range, it is necessary to fit thecharacteristic free energy E independently for each temperature.These results are available in the Supporting Information inFigure S2. Since there is no general formula for the temperaturevariation of E, it requires 14 adjustable parameters to fit the 9experimental isotherms (a unique E for each temperature).These results demonstrate that eqs 5−6 are not a significantimprovement upon the modified D−A equation in eq 4 withregard to the quality of fits to hydrogen adsorption in MOF-5across a wide temperature range.Unilan Model. In light of the limitations of the above pore-
filling models in reproducing experimental isotherms, we haveinvestigated whether MOF-5 hydrogen adsorption isothermsmay be better described by monolayer models. The motivationfor this is that the MOF-5 crystalline pore structure containscomparatively large channels (7.8 Å) and pore cavities (12.1and 15.2 Å), and lacks unscreened CUMC sites, resulting inless adsorption at low pressures. The simplest surfaceadsorption model is the Langmuir equation, where absoluteadsorption is given by
=+
nn
K p1 /amax
(7)
The equilibrium constant is given by
= ° − Δ + Δ⎡⎣⎢
⎤⎦⎥K p
SR
HRT
exp(8)
where ΔH is equal to the (constant) molar differential enthalpyof adsorption and ΔS can be interpreted as the molar integralentropy at na = nmax.
40 The standard-state pressure is p° = 1 bar.The Langmuir model neglects surface heterogeneity and doesnot provide a realistic description of supercritical hydrogenadsorption by most microporous materials. In one study,however, a superposition of two Langmuir isotherms wassuccessfully fitted to the reference MOF-5 isotherms over thecomplete temperature range.41 For our purpose, we would liketo use a model which has fewer parameters (e.g., than asuperposition of two or more Langmuir isotherms) and forwhich there is a clearer physical interpretation of the parametervalues.Because MOF-5 lacks unscreened CUMC adsorption sites,
this implies that the surface heterogeneity should be less thanthat found in AX-21 and Cu-BTC. This has been established bythe following experimental results and first-principle calcu-lations. Comparative hydrogen isotherm measurements showedthat there is substantially less hydrogen uptake at low pressuresin MOF-5 compared to materials with greater surfaceheterogeneity and larger adsorption enthalpies such as activatedcarbons, Cu-BTC, and zeolite NaX.9,42 Inelastic neutron-scattering studies of MOF-5 have identified up to four H2
binding sites, but note that the distribution of rotational barriers(a probe of the local chemical environment surrounding anadsorption site) is considerably less complex in MOF-5compared to other MOFs in the study.43 First-principlescalculations at the MP2 and CCDS(T) level have recentlyfound that the binding energy of the inorganic cluster (4.4−5.2kJ/mol) and organic linker (5.4 kJ/mol) are actually quite closein value.44
The Unilan model (i.e., uniform energy distribution andLangmuir local isotherm) is an attractive empirical model fordescribing hydrogen adsorption in MOF-5. It uses the(monolayer) Langmuir equation to describe the localisotherms. This model treats energetic heterogeneity byassuming a uniform distribution of adsorption enthalpiesbetween Emax and Emin and zero elsewhere.
45−49 The probabilitydensity function that an adsorption site has enthalpy q is givenby
=− < <⎧⎨⎩N q
E E E q E( )
1/( ) if
0 elsewheremax min min max
(9)
where the positive-valued q has been substituted for −ΔH.Adsorption at a local patch with enthalpy q is assumed to followthe Langmuir equation. Rather than taking a discretesuperposition of Langmuir equations, this model insteadaverages the Langmuir equation over a continuous intervalfrom Emin to Emax. The expression for the Unilan model isobtained by evaluating the average
The Journal of Physical Chemistry C Article
dx.doi.org/10.1021/jp305524f | J. Phys. Chem. C 2012, 116, 20199−2021220203
∫=+ −
=−
++
∞
⎛⎝⎜⎜
⎞⎠⎟⎟
( )n n
N qq
n RTE E
a pa p
( )
1 expd
lne
e
ap
qRT
E RT
E RT
a max0
max
max min
/
/
max
min(10)
where a = exp(−ΔS/R). The function increases monotonicallyversus p and meets the required properties na(0) = 0 and na(∞)= nmax. It reduces to Henry’s law (na = khp) in the low pressurelimit. An implicit assumption is that the adsorption entropy isconstant for all sorption sites. To calculate the excessadsorption, the standard expression nex = na − ρgva is used.As fitted to excess adsorption data, therefore, the Unilan modelcontains five temperature-independent parameters: {ΔS, Emax,Emin, nmax, va}.A fit of the Unilan model to the reference powder MOF-5
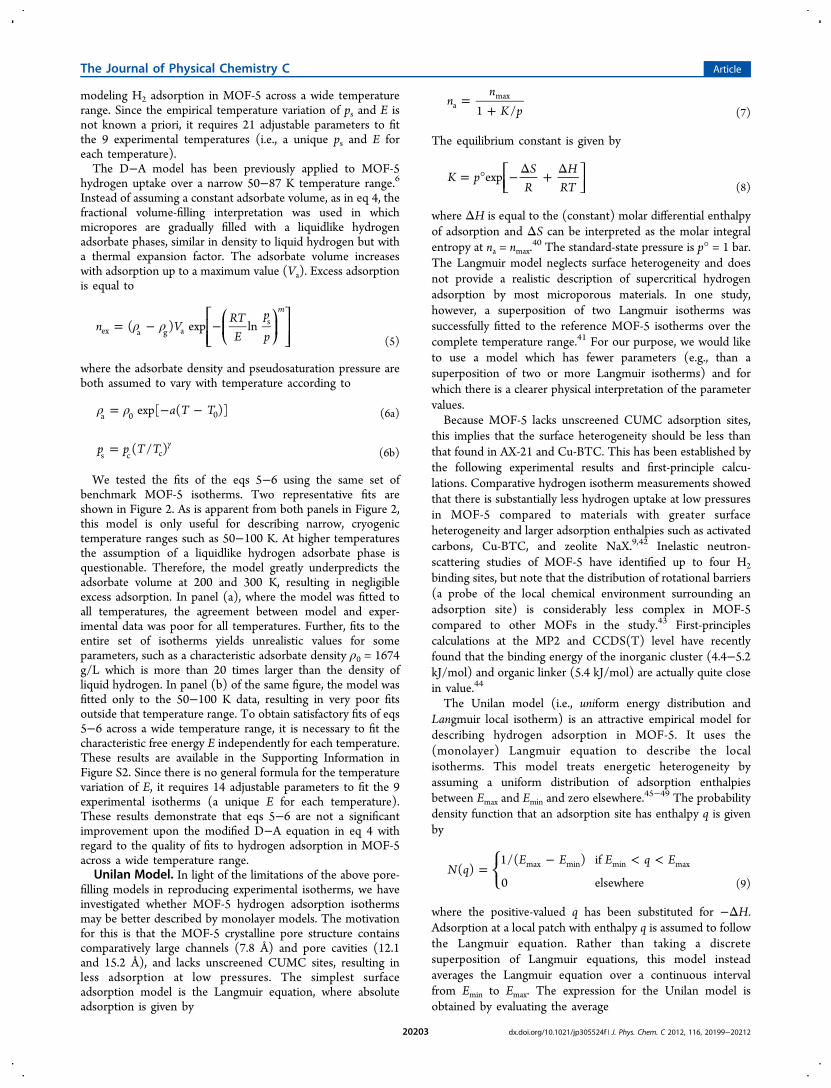
isotherms at all temperatures is displayed in Figure 3, withadditional results available in Figure S3. Whether fitted to asubset of temperatures, or to all temperatures, the quality of theUnilan model fits are superior to those of eqs 4 and 5.Furthermore, the parameters all have physically reasonablevalues. The entropy difference (−7.8R) is very close to the −8Rvalue that is typical for H2 adsorption in many adsorbents.49
The values of Emax (4.63 kJ/mol) and Emin (2.14 kJ/mol) areconsistent with the reported experimental values of the isostericheat (which decreases from 4.8 kJ/mol at 0 to 3.3 kJ/mol at 8wt % excess). The estimated adsorbate volume va variesbetween 1.2 and 1.4 g/cm3 depending on the fit criteria, a valuewhich is slightly larger than the measured MOF-5 open-porevolume of 1.2 g/cm3. Unlike the modified D−A models, theUnilan model accurately predicts hydrogen adsorption nearroom temperature (Figure 3b), with no negative values. Usingonly five temperature-independent parameters, each having aclear physical interpretation (e.g., no pseudosaturationpressure), the Unilan model provides an accurate andstraightforward description of supercritical hydrogen adsorptionacross a wide temperature range. (Presumably, the fits could beimproved even further by allowing either ΔS or ΔH to varywith temperature, but this appears unnecessary.) Furthermore,parameters determined from fits only to the 77, 200, and 300 Ktemperatures still provide accurate estimates for intermediatetemperatures between those limits (see Figure S3).
Toth Model. We also investigated fits of the referencepowder MOF-5 isotherms to a frequently used empiricalmodel, the Toth equation, which was originally proposed formonolayer adsorption.50 This equation has been previouslyfound to provide good fits to hydrogen adsorption in molecularsieve carbon, zeolite NaX, Cu-BTC, and Trip(Me)-PIM at atemperature range of 77−137 K and pressure range of 0−15bar,42 as well as in the Cu2(tptc) framework material over 50−100 K.51 Fits of the Toth equation to the reference MOF-5 datafrom ref 7 are available in Figure S4. The Toth equation doesnot fit the 30−300 K isotherms as effectively as the Unilanmodel. The advantage of the Unilan model over the Tothmodel may be due to its uniform energy distribution betweenEmin and Emax. Nonetheless, the Toth equation still provides asignificant improvement over the modified D−A equations (eqs4 and 5−6) in terms of the quality of fits across 30−300 K, andthe small number (five) of temperature-invariant parameters.In concluding this section we note that based on the
parameters in Figure 3, the maximum adsorbate density (nmax/va = 77 g/L) exceeds the density of liquid H2 at the boilingpoint (70.8 g/L). This is based on a strict physicalinterpretation of v_a as the true adsorbate volume, and occursfor all the models tested here. In comparison, at the triple point(13.8 K, 0.07 bar) the density of liquid hydrogen is 77 g/Lwhile the density of solid hydrogen is 86.5 g/L. Further, forsupercritical adsorption the maximum density corresponds to apoint where the adsorbate phase is incompressible, which maybe between the liquid and solid hydrogen densities.
■ RESULTSHydrogen Storage at 77 K. Having shown that the Unilan
model yields good agreement with the benchmark hydrogenadsorption data from ref 7, we now apply it to model uptake incomposite materials based on mixtures of ENG and MOF-5. Asdescribed above, these materials are of interest for improvingthe thermal conductivity of MOF-5-based hydrogen storagesystems. First, hydrogen adsorption isotherms at 77 K weremeasured for a complete set of ENG/MOF-5 composites (0−10% ENG) for several densities. The measured samples were
• powder MOF-5 (ρbulk: 0.13 g/cm3)• 0% ENG (ρenv: 0.31, 0.41, 0.52, 0.60, 0.79 g/cm3)• 1% ENG (ρenv: 0.49 g/cm3)• 5% ENG (ρenv: 0.32, 0.47, 0.65 g/cm3)• 10% ENG (ρenv: 0.32, 0.48, 0.72 g/cm3)
Figure 3. Fits of the Unilan equation (eq 10) to the experimental MOF-5 isotherm data points from ref 7. (a) Model fitted to all temperatures. (b)Same fits, zoomed in to the excess adsorption range of 0−5 mol/kg.
The Journal of Physical Chemistry C Article
dx.doi.org/10.1021/jp305524f | J. Phys. Chem. C 2012, 116, 20199−2021220204
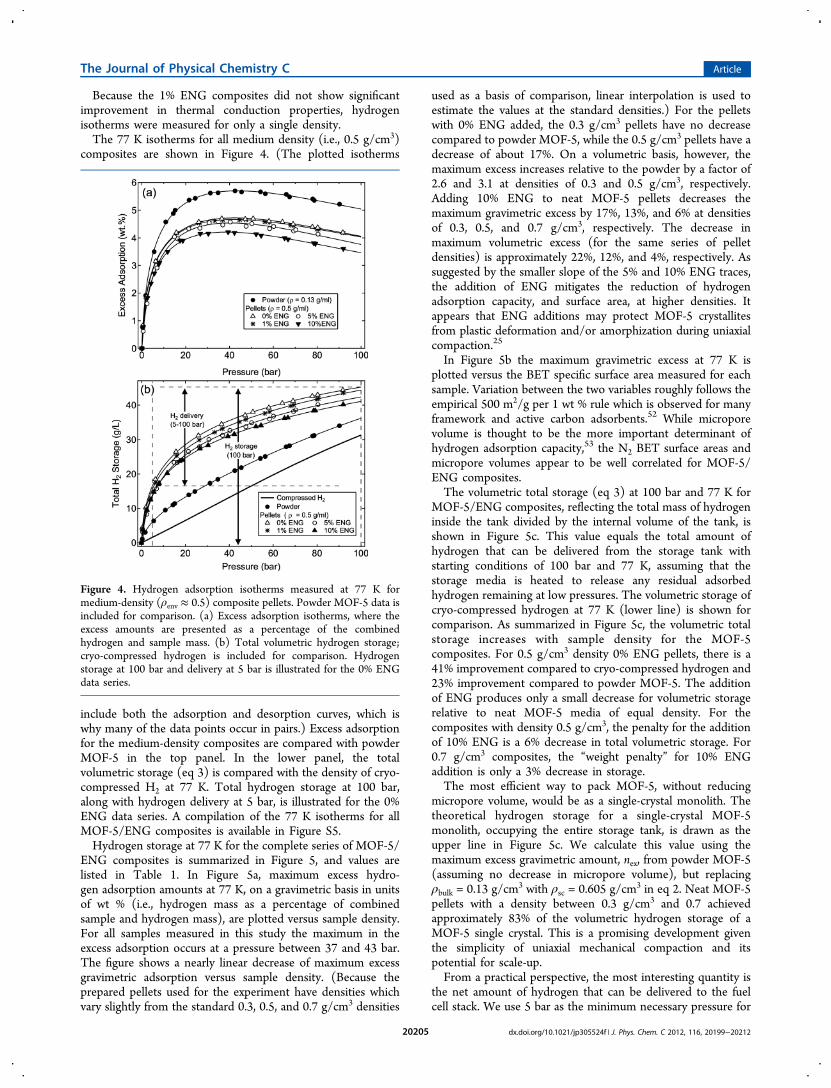
Because the 1% ENG composites did not show significantimprovement in thermal conduction properties, hydrogenisotherms were measured for only a single density.The 77 K isotherms for all medium density (i.e., 0.5 g/cm3)
composites are shown in Figure 4. (The plotted isotherms
include both the adsorption and desorption curves, which iswhy many of the data points occur in pairs.) Excess adsorptionfor the medium-density composites are compared with powderMOF-5 in the top panel. In the lower panel, the totalvolumetric storage (eq 3) is compared with the density of cryo-compressed H2 at 77 K. Total hydrogen storage at 100 bar,along with hydrogen delivery at 5 bar, is illustrated for the 0%ENG data series. A compilation of the 77 K isotherms for allMOF-5/ENG composites is available in Figure S5.Hydrogen storage at 77 K for the complete series of MOF-5/
ENG composites is summarized in Figure 5, and values arelisted in Table 1. In Figure 5a, maximum excess hydro-gen adsorption amounts at 77 K, on a gravimetric basis in unitsof wt % (i.e., hydrogen mass as a percentage of combinedsample and hydrogen mass), are plotted versus sample density.For all samples measured in this study the maximum in theexcess adsorption occurs at a pressure between 37 and 43 bar.The figure shows a nearly linear decrease of maximum excessgravimetric adsorption versus sample density. (Because theprepared pellets used for the experiment have densities whichvary slightly from the standard 0.3, 0.5, and 0.7 g/cm3 densities
used as a basis of comparison, linear interpolation is used toestimate the values at the standard densities.) For the pelletswith 0% ENG added, the 0.3 g/cm3 pellets have no decreasecompared to powder MOF-5, while the 0.5 g/cm3 pellets have adecrease of about 17%. On a volumetric basis, however, themaximum excess increases relative to the powder by a factor of2.6 and 3.1 at densities of 0.3 and 0.5 g/cm3, respectively.Adding 10% ENG to neat MOF-5 pellets decreases themaximum gravimetric excess by 17%, 13%, and 6% at densitiesof 0.3, 0.5, and 0.7 g/cm3, respectively. The decrease inmaximum volumetric excess (for the same series of pelletdensities) is approximately 22%, 12%, and 4%, respectively. Assuggested by the smaller slope of the 5% and 10% ENG traces,the addition of ENG mitigates the reduction of hydrogenadsorption capacity, and surface area, at higher densities. Itappears that ENG additions may protect MOF-5 crystallitesfrom plastic deformation and/or amorphization during uniaxialcompaction.25
In Figure 5b the maximum gravimetric excess at 77 K isplotted versus the BET specific surface area measured for eachsample. Variation between the two variables roughly follows theempirical 500 m2/g per 1 wt % rule which is observed for manyframework and active carbon adsorbents.52 While microporevolume is thought to be the more important determinant ofhydrogen adsorption capacity,53 the N2 BET surface areas andmicropore volumes appear to be well correlated for MOF-5/ENG composites.The volumetric total storage (eq 3) at 100 bar and 77 K for
MOF-5/ENG composites, reflecting the total mass of hydrogeninside the tank divided by the internal volume of the tank, isshown in Figure 5c. This value equals the total amount ofhydrogen that can be delivered from the storage tank withstarting conditions of 100 bar and 77 K, assuming that thestorage media is heated to release any residual adsorbedhydrogen remaining at low pressures. The volumetric storage ofcryo-compressed hydrogen at 77 K (lower line) is shown forcomparison. As summarized in Figure 5c, the volumetric totalstorage increases with sample density for the MOF-5composites. For 0.5 g/cm3 density 0% ENG pellets, there is a41% improvement compared to cryo-compressed hydrogen and23% improvement compared to powder MOF-5. The additionof ENG produces only a small decrease for volumetric storagerelative to neat MOF-5 media of equal density. For thecomposites with density 0.5 g/cm3, the penalty for the additionof 10% ENG is a 6% decrease in total volumetric storage. For0.7 g/cm3 composites, the “weight penalty” for 10% ENGaddition is only a 3% decrease in storage.The most efficient way to pack MOF-5, without reducing
micropore volume, would be as a single-crystal monolith. Thetheoretical hydrogen storage for a single-crystal MOF-5monolith, occupying the entire storage tank, is drawn as theupper line in Figure 5c. We calculate this value using themaximum excess gravimetric amount, nex, from powder MOF-5(assuming no decrease in micropore volume), but replacingρbulk = 0.13 g/cm3 with ρsc = 0.605 g/cm3 in eq 2. Neat MOF-5pellets with a density between 0.3 g/cm3 and 0.7 achievedapproximately 83% of the volumetric hydrogen storage of aMOF-5 single crystal. This is a promising development giventhe simplicity of uniaxial mechanical compaction and itspotential for scale-up.From a practical perspective, the most interesting quantity is
the net amount of hydrogen that can be delivered to the fuelcell stack. We use 5 bar as the minimum necessary pressure for
Figure 4. Hydrogen adsorption isotherms measured at 77 K formedium-density (ρenv ≈ 0.5) composite pellets. Powder MOF-5 data isincluded for comparison. (a) Excess adsorption isotherms, where theexcess amounts are presented as a percentage of the combinedhydrogen and sample mass. (b) Total volumetric hydrogen storage;cryo-compressed hydrogen is included for comparison. Hydrogenstorage at 100 bar and delivery at 5 bar is illustrated for the 0% ENGdata series.
The Journal of Physical Chemistry C Article
dx.doi.org/10.1021/jp305524f | J. Phys. Chem. C 2012, 116, 20199−2021220205

the fuel cell intake and 100 bar as the maximum. Theisothermal hydrogen delivery amount (at T = 77 K) can beestimated as the difference in the total hydrogen storage at 100and 5 bar. These values for the MOF-5/ENG composites aresummarized in Figure 5d. Due to the uptake of hydrogen at lowpressures (Figure 4b), a significant fraction of hydrogenremains adsorbed at the desorption conditions of 77 K and 5bar; consequently, MOF-5 compacts show no improvement indeliverable hydrogen compared to cryo-compressed hydrogen.For the neat MOF-5 pellets of density 0.5 g/cm3, theisothermal hydrogen delivery is actually decreased by about
3% compared to cryo-compressed hydrogen. As described later,at temperatures above 77 K the isothermal hydrogen deliveryfrom MOF-5/ENG composites exceeds that of cryo-com-pressed hydrogen. Moreover, the use of a simultaneoustemperature and pressure swing − e.g., adsorption at 77 Kand 100 bar, desorption at 160 K and 5 bar − results in a 44%increase (0.5 g/cm3 pellets) in usable hydrogen compared tocryo-compressed.
Variable Temperature Hydrogen Adsorption. Hydro-gen isotherms were measured at intermediate temperatures(between 77 and 295 K) for composites with the most
Figure 5. Summary of hydrogen storage properties at 77 K for the MOF-5/ENG composites. (a) Maximum gravimetric excess hydrogen adsorptionversus sample density. (b) Maximum gravimetric excess hydrogen adsorption versus N2 BET specific surface area. (c) Total volumetric hydrogenstorage at 100 bar, compared with the values for cryo-compressed hydrogen at 77 K and the estimated upper limit for single-crystal MOF-5. (d)Total hydrogen delivery between 5 and 100 bar, compared with values for cryo-compressed hydrogen at 77 K and single-crystal MOF-5.
Table 1. Hydrogen Adsorption Properties at 77 K of MOF-5/ENG Composites
sample surface area maximum excess adsorption deliverable H2
ENG % ρ (g/cm3) BET(N2) (m2/g) gravimetric (wt %) volumetric (g/L) 100−0 bar (g/L) 100−5 bar (g/L)
0 0.31 2716 5.76 19.1 43.7 31.30 0.41 2486 5.14 22.2 43.5 29.10 0.52 2263 4.72 25.7 45.3 28.70 0.60 2045 4.17 26.3 44.7 27.50 0.79 1473 3.32 27.1 43.6 26.41 0.49 2584 4.66 24.1 44.4 28.85 0.32 2781 4.94 16.7 40.3 29.05 0.47 2623 4.54 22.3 42.4 28.95 0.65 1888 4.00 26.9 44.6 27.510 0.32 2665 4.75 16.1 39.7 28.810 0.48 2413 4.21 21.0 41.1 27.210 0.72 1760 3.49 25.9 43.2 26.6
powder 2762 5.64 7.8 36.0 30.0single-crystal 2762 5.64 36.2 53.2 30.9
cryo-compressed N/A N/A N/A 31.3 29.7
The Journal of Physical Chemistry C Article
dx.doi.org/10.1021/jp305524f | J. Phys. Chem. C 2012, 116, 20199−2021220206
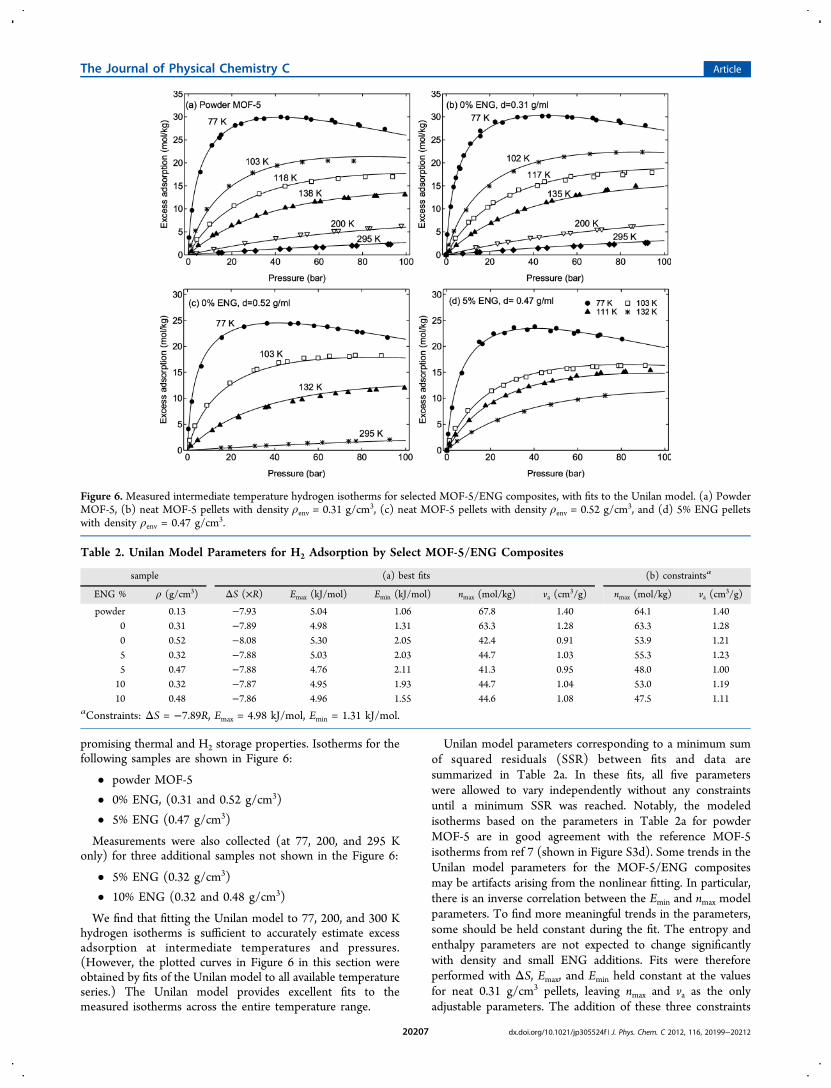
promising thermal and H2 storage properties. Isotherms for thefollowing samples are shown in Figure 6:
• powder MOF-5
• 0% ENG, (0.31 and 0.52 g/cm3)
• 5% ENG (0.47 g/cm3)
Measurements were also collected (at 77, 200, and 295 Konly) for three additional samples not shown in the Figure 6:
• 5% ENG (0.32 g/cm3)
• 10% ENG (0.32 and 0.48 g/cm3)
We find that fitting the Unilan model to 77, 200, and 300 Khydrogen isotherms is sufficient to accurately estimate excessadsorption at intermediate temperatures and pressures.(However, the plotted curves in Figure 6 in this section wereobtained by fits of the Unilan model to all available temperatureseries.) The Unilan model provides excellent fits to themeasured isotherms across the entire temperature range.
Unilan model parameters corresponding to a minimum sumof squared residuals (SSR) between fits and data aresummarized in Table 2a. In these fits, all five parameterswere allowed to vary independently without any constraintsuntil a minimum SSR was reached. Notably, the modeledisotherms based on the parameters in Table 2a for powderMOF-5 are in good agreement with the reference MOF-5isotherms from ref 7 (shown in Figure S3d). Some trends in theUnilan model parameters for the MOF-5/ENG compositesmay be artifacts arising from the nonlinear fitting. In particular,there is an inverse correlation between the Emin and nmax modelparameters. To find more meaningful trends in the parameters,some should be held constant during the fit. The entropy andenthalpy parameters are not expected to change significantlywith density and small ENG additions. Fits were thereforeperformed with ΔS, Emax, and Emin held constant at the valuesfor neat 0.31 g/cm3 pellets, leaving nmax and va as the onlyadjustable parameters. The addition of these three constraints
Figure 6. Measured intermediate temperature hydrogen isotherms for selected MOF-5/ENG composites, with fits to the Unilan model. (a) PowderMOF-5, (b) neat MOF-5 pellets with density ρenv = 0.31 g/cm3, (c) neat MOF-5 pellets with density ρenv = 0.52 g/cm3, and (d) 5% ENG pelletswith density ρenv = 0.47 g/cm3.
Table 2. Unilan Model Parameters for H2 Adsorption by Select MOF-5/ENG Composites
sample (a) best fits (b) constraintsa
ENG % ρ (g/cm3) ΔS (×R) Emax (kJ/mol) Emin (kJ/mol) nmax (mol/kg) va (cm3/g) nmax (mol/kg) va (cm
3/g)
powder 0.13 −7.93 5.04 1.06 67.8 1.40 64.1 1.400 0.31 −7.89 4.98 1.31 63.3 1.28 63.3 1.280 0.52 −8.08 5.30 2.05 42.4 0.91 53.9 1.215 0.32 −7.88 5.03 2.03 44.7 1.03 55.3 1.235 0.47 −7.88 4.76 2.11 41.3 0.95 48.0 1.0010 0.32 −7.87 4.95 1.93 44.7 1.04 53.0 1.1910 0.48 −7.86 4.96 1.55 44.6 1.08 47.5 1.11
aConstraints: ΔS = −7.89R, Emax = 4.98 kJ/mol, Emin = 1.31 kJ/mol.
The Journal of Physical Chemistry C Article
dx.doi.org/10.1021/jp305524f | J. Phys. Chem. C 2012, 116, 20199−2021220207

does not significantly decrease the quality of the fits (shown inFigure S6). As summarized in Table 2b, the two fittedparameters nmax and va decrease versus ENG% and density. Thisis consistent with our findings that micropore volume decreaseswith compaction and decreases to a lesser degree with ENGaddition.Hydrogen Delivery. Hydrogen storage at 100 bar for
selected MOF-5/ENG composites is plotted versus temper-ature (77−295 K) in Figure 7 using the Unilan modelparameters from Table 2b. Panel (a) breaks down the relativecontributions to total hydrogen storage at 100 bar made byexcess adsorption, absolute adsorption, and free H2 in thevolume vg = vv − va (which can be interpreted as the interstitialvolume occupied by bulk H2 gas outside of the MOF-5 pores).The sum of the absolute adsorption and free hydrogen equalsthe total storage. In Figure 7b the same comparison is made forthe 0% ENG pellets of density 0.52 g/cm3. This illustrates that
for a loosely packed powder, a majority of stored hydrogensimply consists of bulk hydrogen gas outside of the adsorbatevolume. In contrast, for the compacted MOF-5 absoluteadsorption makes up a much larger percentage of the totalhydrogen storage. Only a small fraction of the stored hydrogenconsists of bulk gas in the interstitial volume.Figure 7c illustrates the volumetric absolute adsorption (na)
at 100 bar for MOF-5/ENG composites plotted as a function oftemperature. Compacting powder MOF-5 to a density of 0.52g/cm3 increases the absolute adsorption by a factor ofapproximately 3. Total volumetric hydrogen storage at 100bar is plotted versus temperature in Figure 7d. Values forsingle-crystal MOF-5 are extrapolated from the powder MOF-5values by replacing ρbulk = 0.13 g/cm3 with ρsc = 0.605 g/cm3.The single-crystal MOF-5 values represent an upper limit forvolumetric hydrogen storage of compacted MOF-5. Among thesamples measured, volumetric storage is highest for the 0%
Figure 7. Total hydrogen storage at 100 bar versus temperature for selected MOF-5/ENG composites, using Unilan model parameters from Table2b. (a) Hydrogen storage in powder MOF-5 at 100 bar; compares the relative contributions to total hydrogen storage made by excess adsorption,absolute adsorption, and bulk H2. (b) Hydrogen storage at 100 bar in neat MOF-5 pellets with density 0.52 g/cm3. (c) Absolute hydrogenadsorption at 100 bar, on a volumetric basis, for MOF-5/ENG composites. (d) Total hydrogen storage at 100 bar (eq 3) plotted versus temperature.(e) Total hydrogen delivery between 100 and 5 bar. (f) Excess hydrogen delivery, defined here as the difference in excess adsorption, between 100and 5 bar.
The Journal of Physical Chemistry C Article
dx.doi.org/10.1021/jp305524f | J. Phys. Chem. C 2012, 116, 20199−2021220208

ENG pellets of density 0.52 g/cm3. Relative to powder MOF-5and compressed H2, the largest enhancement in volumetric H2storage by MOF-5/ENG pellets occurs at temperatures close to100 K. Neat MOF-5 pellets with density 0.52 g/cm3 have atotal volumetric storage of 36 g/L at 100 K, which is roughly33% and 58% larger than the respective values for powderMOF-5 and compressed H2. The addition of 5% and 10% ENGto the ∼0.5 MOF-5 g/cm3 pellets decreases the total volumetricstorage at 100 K by about 6% and 11%, respectively.Total hydrogen delivery (isothermal) between 100 and 5 bar
is plotted as a function of temperature in Figure 7e.54 Cryo-compressed has more deliverable hydrogen at 77 K than mostMOF-5/ENG composites (with the exception of 0% ENG 0.5g/cm3 pellets and single-crystal MOF-5). However, above 77 Kthe MOF-5/ENG composites exceed cryo-compressed hydro-gen in terms of deliverable hydrogen capacity. The largestimprovement in isotherm delivery (relative to powder MOF-5and compressed H2) occurs at a temperature of approximately122 K. The 0.52 g/cm3 pellets with 0% ENG have anisothermal delivery at 122 K of 24.7 g/L, about 23% and 41%greater than the respective values for powder MOF-5 andcompressed H2. Addition of 5% and 10% ENG to the ∼0.5 g/cm3 MOF-5 pellets reduces the total isothermal H2 delivery byabout 5% and 9%, respectively.In Figure 7e, the isothermal total delivery for compressed H2
decreases monotonically versus temperature. Similarly, the low-density MOF-5 composites (∼0.3 g/cm3) also exhibit amonotonic decrease in deliverable hydrogen. On the otherhand, the plotted curves for total isothermal delivery fromsingle-crystal MOF-5 and neat 0.52 g/cm3 pellets reach amaximum at approximately 105 K. This maximum can betraced to the behavior of the deliverable excess hydrogen(isothermal) shown in Figure 7f. Defined here as the differencein excess adsorption between 100 and 5 bar, the excesshydrogen delivery has a maximum at 105 K for all of the MOF-5/ENG composites shown in the plot. For single-crystal MOF-5 (and for MOF-5/ENG composites with densities of ∼0.5 g/cm3), the excess adsorption is relatively large compared to theamount of bulk hydrogen gas stored in the volume vv, and thismaximum in excess delivery curve carries over to the totalstorage.Thermodynamics. The differential adsorption enthalpy, or
isosteric heat, is an important quantity in adsorption studies.While the excess differential enthalpy is difficult to derive in an
analytical form for the Unilan model, the absolute adsorptionenthalpy is readily calculated. After eq 10 is solved in terms ofpressure, the adsorption enthalpy is calculated by the Clausius−Clapeyron equation
−Δ =∂∂
= − −
−−
−− −
⎛⎝⎜
⎞⎠⎟
⎡⎣ ⎤⎦ ⎡⎣ ⎤⎦
h RTp
T
Ex s xs
ln
(1 )
1 exp 1 exp
x
x sRT
xsRT
a2
max (1 )
(11)
where s = Emax − Emin and x = n/nmax. Values of −Δha forpowder MOF-5, using the parameters from Table 2a, areplotted in Figure 8a for temperatures of 77, 200, and 295 K.The value at x = 0.5 is equal to (Emax + Emin)/2 for alltemperatures. The differential enthalpy for the Unilan modelapproaches a finite value as x approaches zero coverage.Figure 8a compares the experimental −Δh ex values
determined by direct interpolation of powder MOF-5experimental excess data with the theoretical values derivedfrom the Unilan model. Estimating differential excess enthalpiesby the isosteric method is highly sensitive to both theinterpolation method42 and the temperature and pressureranges of the measurement.55 We measured separate low-pressure isotherms (<3 bar) at 77 K, not shown in Figure 6a,using a high-resolution pressure transducer to improveaccuracy. The interpolation method consisted of fitting rationalfunctions to p vs nex data independently for each temperature.Temperatures included in the isosteres were 77, 103, and 118K. Further details on the calculation of the experimentaldifferential enthalpy are provided in Figure S7 in theSupporting Information.The experimental −Δh ex shown in Figure 8a as the dashed
line is plotted as a function of fractional excess adsorption nex/nm,77, where nm,77 is the maximum excess adsorption at 77 K.Above nex/nm,77 = 0.35 the enthalpy actually starts to increase,an effect that arises from the maximum which is present in theexcess adsorption curve.56 The experimental −Δhex for powderMOF-5 is slightly larger than the modeled −Δha obtained fromthe best-fit Unilan parameters. Figure 8b displays the modeleddifferential enthalpy for selected MOF-5/ENG compositesusing the best-fit Unilan parameters from Table 2a. Asdiscussed earlier, these model Unilan parameters may exhibit
Figure 8. (a) Absolute differential enthalpy (eq 11) of powder MOF-5 at three temperatures, compared with the excess differential enthalpyestimated by direct interpolation of experimental 77, 103, and 118 K isotherms. (b) Absolute differential enthalpy (eq 11) for selected MOF-5/ENGcomposites, based on Unilan model parameters listed in Table 2a.
The Journal of Physical Chemistry C Article
dx.doi.org/10.1021/jp305524f | J. Phys. Chem. C 2012, 116, 20199−2021220209

artifacts from the fitting process. On the other hand, since eq 11depends only on Emin, Emax, and T, the constrained Unilanparameters from Table 2b simply yield identical enthalpies. TheClausius−Clapeyron expression in eq 11 assumes the following:(1) the adsorbate molar volume is negligibly small compared tothat of the gas phase; (2) the gas phase equation of state isdescribed by the ideal gas law. In Figure 8a, the differentialenthalpies at 200 and 300 K, at low fractional coverage, are thecases that best adhere to these assumptions. Therefore, theymay represent that best estimate of −Δha.
■ DISCUSSIONA primary aim of this study was to explore the effects of pelletdensity and ENG addition on the hydrogen storage propertiesof MOF-5 composites. The improved thermal properties of theMOF-5/ENG composites at room temperature have beenpreviously established, with a factor of 3 increase for 5% ENGand a factor of 5 increase for 10% ENG.25 Although ENG has asimilar skeletal density as MOF-5, it has a low surface area;therefore, ENG addition is expected to lower the hydrogenstorage capacity relative to neat MOF-5 pellets by the additionof extra mass to the pellet. For a 10% ENG composite, forexample, we would expect the excess hydrogen adsorptionamounts (gravimetric and volumetric) to be roughly 10% lowercompared to neat MOF-5 pellet of equal density. There wouldbe a smaller reduction in total hydrogen storage, as this amountalso includes the bulk gas hydrogen contained in the voidvolume vv. However, as previously described,25 the ENG mayprotect MOF-5 crystallites from plastic deformation duringuniaxial compression, thereby enhancing the hydrogen storagedensity in higher density pellets. Our results, as summarized inFigure 5, indicate that ENG additions do decrease themaximum excess adsorption at 77 K but that these additionsalso mitigate the loss of hydrogen storage capacity at high pelletdensities. The best compromise between improved thermalconduction, increased volumetric H2 storage density, and areduced penalty on gravimetric excess adsorption appears to beat an ENG addition of 5−10 wt % and a pellet density close to0.5 g/cm3. Optimal ENG and compaction values must also bedetermined on a system level to balance effects such as masstransport and heat exchanger efficiency.An unanticipated finding from this work was the effectiveness
of the Unilan model, in comparison to the modified D−Amodel, in describing hydrogen adsorption in MOF-5 andMOF-5/ENG composites across a wide temperature range.The Unilan model accomplishes this while using only fivetemperature-invariant parameters, each with a plausible physicalinterpretation. In contrast, the modified D−A model requires atleast two temperature-dependent parameters (out of five or sixin total) in order to achieve fits of similar quality. There areseveral reasons why MOF-5 would be well described by amonolayer-based adsorption model, and by the Unilan modelin particular. First, hydrogen adsorption at supercriticaltemperatures in large pores may tend toward monolayerformation due to the weak intermolecular interactions. The D−A model has particular difficulty in fitting MOF-5 hydrogenisotherms at higher temperatures such as 200 and 300 K, wherethe application of a model derived for pore filling by a liquidlikehydrogen phase is questionable. Second, hydrogen uptake inthe large pores of MOF-5 has a small, and relativelyhomogeneous, differential adsorption enthalpy, resulting inreduced uptake at low pressures. In contrast, the modified D−Amodels appear to be more effective for adsorbents with a larger
enthalpies and greater surface heterogeneity, such as activatedcarbons (i.e., complex pore structures and graphitic edgeterminations) and possibly a small number of frameworkstructures with unscreened CUMC sites (e.g., Cu-BTC, MOF-74), as these materials have a steeper isotherm shape at lowpressures. While our results suggest that the Unilan model maybe less suitable for heterogeneous adsorbents, further analysison these systems is warranted. On the other hand, the Unilanmodel is expected to work well for hydrogen adsorption inother framework materials with large pore sizes and nounscreened CUMC adsorption sites (e.g., MOF-177, MIL-101). Validating the Unilan model for MOF-5 over widerpressure ranges, and for supercritical adsorption by gases otherthan hydrogen, are topics for additional work.
■ CONCLUSION
We have studied the hydrogen storage behavior of high-densityMOF-5 composites containing expanded natural graphite(ENG). The addition of 5 and 10 wt % ENG to 0.5 g/cm3
pellets had previously been found to enhance thermalconduction at 295 K by a factor of 3 and 5, respectively,relative to neat MOF-5 compacts. We compared the quality offits of the Unilan model, Toth model, and Dubinin−Astakhovmodel for hydrogen adsorption in MOF-5 and MOF-5/ENGcomposites over a wide temperature and pressure range. Thekey findings of this study are as follows:
1. The (monolayer) Unilan model provided the mostaccurate description of hydrogen adsorption by MOF-5and MOF-5/ENG composites for both published data(30−300 K, 0−60 bar) and our own experimentalmeasurements (77−295 K, 0−100 bar). Typicallyassociated with monolayer adsorption, the Unilanmodel accurately fitted the complete 30−300 K temper-ature range using only 5 temperature-invariant parame-ters. To achieve fits of similar quality, the (pore-filling)D−A model requires at least two parameters (out of fiveor six total) to vary with temperature. This resultsuggests that monolayer adsorption is more applicablethan pore-filling for describing supercritical H2 adsorp-tion in the large pores of MOF-5.
2. The total volumetric hydrogen storage density (77 K,100 bar) for MOF-5 + 0% ENG pellets with density 0.5g/cm3 is approximately 23% larger than that of powderMOF-5 and 41% larger than that of cryo-compressedhydrogen. The addition of 10% ENG to the 0.5 g/cm3
MOF-5 pellets produces a small decrease (6%) in thetotal volumetric hydrogen storage at 77 K compared toneat MOF-5 pellets of equal density.
3. Isothermal hydrogen delivery (volumetric) between 100and 5 bar is larger for MOF-5/ENG composites than forpowder MOF-5 and compressed H2 at temperaturesabove 77 K. The largest enhancement in isothermaldelivery (relative to powder MOF-5 and compressedhydrogen) for the MOF-5/ENG composites occurs atapproximately 122 K. Neat MOF-5 pellets with density0.52 g/cm3 have an isothermal H2 delivery of 24.7 g/L at122 K, which is 23% and 41% greater than the respectivevalues for powder MOF-5 and compressed H2. Additionsof 5 and 10 wt % ENG to neat MOF-5 pellets withdensity ∼0.5 g/cm3 reduce the delivery by about 5% and9%, respectively.
The Journal of Physical Chemistry C Article
dx.doi.org/10.1021/jp305524f | J. Phys. Chem. C 2012, 116, 20199−2021220210
At 122 K, a MOF-5/ENG composite with density of 0.48 g/cm3 and 10 wt % ENG yields a total hydrogen isothermaldelivery between 100 and 5 bar of 22.5 g/L. This is an increaseof about 13% compared to powder MOF-5 powder and anincrease of 28% compared to cyro-compressed H2. Based onthe combined impact of ENG addition and pellet density onthermal conductivity and hydrogen storage capacity of MOF-5media, optimal properties are obtained for ENG additions of5−10 wt % and pellet densities near 0.5 g/cm3.
■ ASSOCIATED CONTENT*S Supporting InformationComplete results for the fits of the Unilan, Toth, and Dubinin−Astakhov models to experimental MOF-5 hydrogen isotherms;details on the calculation of the excess differential enthalpy;complete 77 K isotherms for all MOF-5/ENG composites. Thismaterial is available free of charge via the Internet at http://pubs.acs.org.
■ AUTHOR INFORMATIONCorresponding Author*E-mail: [email protected]. E-mail: [email protected] Addresses§Shanghai Nuclear Engineering Research & Design Institute, 29Hongcao Road, Shanghai 20023, China.∥AFCC Automotive Fuel Cell Cooperation Corp., 9000Glenlyon Parkway, Burbaby, BC, Canada.#HRL Laboratories, LLC, Malibu, CA 90265, United States.NotesThe authors declare no competing financial interest.
■ ACKNOWLEDGMENTSThe authors acknowledge G. Cavataio and J. Warner for thesurface area measurements and thank W. Zhou for kindlyproviding the MOF-5 hydrogen adsorption isotherms reportedin ref 7. Funding for this study was provided by the U.S.Department of Energy, Office of Energy Efficiency andRenewable Energy, grant no. DE-FC36-GO19002.
■ REFERENCES(1) Yang, J.; Sudik, A.; Wolverton, C.; Siegel, D. J. Chem. Soc. Rev.2010, 39, 656−675.(2) Li, H.; Eddaoudi, M.; O’Keeffe, M.; Yaghi, O. M. Nature 1999,402, 276−279.(3) Dailly, A.; Vajo, J. J.; Ahn, C. C. J. Phys. Chem. B 2006, 110,1099−1101.(4) Wong-Foy, A.; Matzger, A.; Yaghi, O. J. Am. Chem. Soc. 2006,128, 3494−3495.(5) Panella, B.; Hirscher, M.; Putter, H.; Muller, U. Adv. Funct. Mater.2006, 16, 520−524.(6) Poirier, E.; Dailly, A. J. Phys. Chem. C 2008, 112, 13047−13052.(7) Zhou, W.; Wu, H.; Hartman, M. R.; Yildirim, T. J. Phys. Chem. C2007, 111, 16131−16137.(8) Kaye, S.; Dailly, A.; Yaghi, O.; Long, J. J. Am. Chem. Soc. 2007,129, 14176−14177.(9) Schmitz, B.; Muller, U.; Trukhan, N.; Schubert, M.; Ferey, G.;Hirscher, M. ChemPhysChem 2008, 9, 2181−2184.(10) Kaye, S.; Long, J. J. Am. Chem. Soc. 2005, 127, 6506−6507.(11) Muller, U.; Schubert, M.; Teich, F.; Puetter, H.; Schierle-Arndt,K.; Pastre, J. J. Mater. Chem. 2006, 16, 626−636.(12) Czaja, A. U.; Trukhan, N.; Muller, U. Chem. Soc. Rev. 2009, 38,1284−1293.(13) Jorgensen, S. W. Curr. Opin. Solid State Mater. Sci. 2011, 15, 39−43.
(14) Purewal, J. J.; Liu, D.; Yang, J.; Sudik, A.; Siegel, D.; Maurer, S.;Mueller, U. Int. J. Hydrogen Energy 2012, 37, 2723−2727.(15) Hu, Y. H.; Zhang, L. Phys. Rev. B 2010, 81, 174103.(16) Zacharia, R.; Cossement, D.; Lafi, L.; Chahine, R. J. Mater.Chem. 2010, 20, 2145−2151.(17) Dailly, A.; Poirier, E. Energy Environ. Sci. 2011, 4, 3527−3534.(18) Jorda-Beneyto, M.; Lozano-Castello, D.; Suarez-García, F.;Cazorla-Amoros, D.; Linares-Solano, A.Microporous Mesoporous Mater.2008, 112, 235−242.(19) Zhang, J. S.; Fisher, T. S.; Ramachandran, P. V.; Gore, J. P.;Mudawar, I. J. Heat Transfer 2005, 127, 1391−1399.(20) Aleksic, P.; Næss, E. ASME Conf. Proc. 2009, IMECE2009−10593, 603−610.(21) Lamari, M.; Aoufi, A.; Malbrunot, P. AlChE J. 2000, 46, 632−646.(22) Richard, M.-A.; Cossement, D.; Chandonia, P.-A.; Chahine, R.;Mori, D.; Hirose, K. AIChE J. 2009, 55, 2985−2996.(23) Hirose, K.; Mori, D.; Chahine, R. J. Chem. Eng. Jpn. 2011, 44,636−642.(24) Huang, B. L.; Ni, Z.; Millward, A.; McGaughey, A. J. H.; Uher,C.; Kaviany, M.; Yaghi, O. Int. J. Heat Mass Transfer 2007, 50, 405−411.(25) Liu, D.; Purewal, J. J.; Yang, J.; Sudik, A.; Maurer, S.; Mueller,U.; Ni, J.; Siegel, D. J. Int. J. Hydrogen Energy 2012, 37, 6109−6117.(26) Kim, K. J.; Montoya, B.; Razani, A.; Lee, K. H. Int. J. HydrogenEnergy 2001, 26, 609−613.(27) Sanchez, A. R.; Klein, H. P.; Groll, M. Int. J. Hydrogen Energy2003, 28, 515−527.(28) Pohlmann, C.; Rontzsch, L.; Kalinichenka, S.; Hutsch, T.;Kieback, B. Int. J. Hydrogen Energy 2010, 35, 12829−12836.(29) Broom, D. P. Hydrogen Storage Materials; Green Energy andTechnology Springer: London, U.K., 2011.(30) Leachman, J. W.; Jacobsen, R. T.; Penoncello, S. G.; Lemmon,E. W. J. Phys. Chem. Ref. Data 2009, 38, 28.(31) Lemmon, E. W.; Huber, M. L.; McLinden, M. O. NISTStandard Reference Database 23: Reference Fluid Thermodynamicand Transport Properties-REFPROP, Version 9.0, 2010.(32) Lowell, S.; Shields, J. E.; Thomas, M. A.; Thommes, M.Characterization of Porous Solids and Powders: Surface Area, Pore Size,and Density; Klewer Academic: Dordrecht, The Netherlands, 2004.(33) McGeary, R. K. J. Am. Ceram. Soc. 1961, 44, 513−522.(34) When the storage tank mass is not included in the masspercentage, the gravimetric storage is (exceedingly) large for low-density adsorbents. That is, when ρenv is small, the amount of freehydrogen within the tank (vv × ρg) will be very large in comparison tothe sorbent mass (msorbent). To obtain a useful quantitative measure ofgravimetric storage, the mass of the storage tank should be included.This discussion is better left for a true “system” type technical analysis,which incorporates the masses of the storage tank, insulation, heatexchangers, and other auxiliary components.(35) Dubinin, M.; Astakhov, V. Adv. Chem. Ser. 1971, 102, 69−85.(36) Zhou, Y. P.; Zhou, L. Sci. China, Ser. B: Chem. 1996, 39, 598−607.(37) Richard, M. A.; Benard, P.; Chahine, R. Adsorption 2009, 15,43−51.(38) Stephanie-Victoire, F.; Goulay, A.; de Lara, E. Langmuir 1998,14, 7255−7259.(39) Ruthven, D. M. Principles of Adsorption and Adsorption Processes;John Wiley & Sons: New York, 1984.(40) Myers, A. L. AIChE J. 2002, 48, 145−160.(41) Mertens, F. Surf. Sci. 2009, 603, 1979−1984.(42) Tedds, S.; Walton, A.; Broom, D. P.; Book, D. Faraday Discuss.2011, 151, 75−94.(43) Rowsell, J. L. C.; Eckert, J.; Yaghi, O. M. J. Am. Chem. Soc. 2005,127, 14904−14910.(44) Lee, J. S. Bull. Korean Chem. Soc. 2011, 32, 4199−4204.(45) Halsey, G.; Taylor, H. S. J. Chem. Phys. 1947, 15, 624−630.(46) Temkin, M.; Pyzhev, V. Acta Physiochim. URSS 1940, 12, 327−356.
The Journal of Physical Chemistry C Article
dx.doi.org/10.1021/jp305524f | J. Phys. Chem. C 2012, 116, 20199−2021220211

(47) Sips, R. J. Chem. Phys. 1948, 16, 490−495.(48) Honig, J. M.; Reyerson, L. H. J. Phys. Chem. 1952, 56, 140−144.(49) Bhatia, S. K.; Myers, A. L. Langmuir 2006, 22, 1688−1700.(50) Toth, J. Acta Chim. Acad. Sci. Hung. 1971, 69, 311−328.(51) Bimbo, N.; Ting, V. P.; Hruzewicz-Kolodziejczyk, A.; Mays, T. J.Faraday Discuss. 2011, 151, 59−74.(52) Chahine, R.; Benard, P. Adv. Cryog. Eng. 1998, 43, 1257−1264.(53) Texier-Mandoki, N.; Dentzer, J.; Piquero, T.; Saadallah, S.;David, P.; Vix-Guterl, C. Carbon 2004, 42, 2744−2747.(54) While only isothermal conditions are considered here, theamounts of deliverable hydrogen could be further increased byemploying a temperature swing; i.e., upon reaching a dischargepressure of 5 bar, additional hydrogen could be extracted by heatingthis system.(55) Rouquerol, F.; Rouquerol, J.; Sing, K. Adsorption by Powders andPorous Solids; Academic Press: London, U.K., 1999.(56) Myers, A. L.; Monson, P. A. Langmuir 2002, 18, 10261−10273.
The Journal of Physical Chemistry C Article
dx.doi.org/10.1021/jp305524f | J. Phys. Chem. C 2012, 116, 20199−2021220212


![SIMULATING VENTED HYDROGEN DEFLAGRATIONS: IMPROVED ... · FLACS-Hydrogen is a subversion of the CFD tool FLACS [3] for hydrogen safety applications that was first developed in connection](https://static.fdocuments.in/doc/165x107/5ec22aa7e2f8335923103693/simulating-vented-hydrogen-deflagrations-improved-flacs-hydrogen-is-a-subversion.jpg)


![Improved Electrical Conductivity of a Carbon Nanotube Mat …carbonlett.org/Upload/files/CARBONLETT/[243-247]-08.pdf · Improved electrical conductivity of a thermoplastic CNT mat](https://static.fdocuments.in/doc/165x107/5c66db0f09d3f252168cf940/improved-electrical-conductivity-of-a-carbon-nanotube-mat-243-247-08pdf-improved.jpg)