Improved crop–livestock system for enhanced food security ...€“livestock... · Nigeria;...
60
www.iita.org Improved crop–livestock system for enhanced food security and income generation in West Africa H.A. Ajeigbe, T. Abdoulaye, and D. Chikoye
Transcript of Improved crop–livestock system for enhanced food security ...€“livestock... · Nigeria;...

www.iita.org
Improved crop–livestock system for enhanced food security and income
generation in West AfricaH.A. Ajeigbe, T. Abdoulaye, and D. Chikoye

i
Final project reportGatsby improved crop livestock project
(Project no. GAT2833)
Improved crop livestock system for enhanced food security
and income generation in West Africa
H.A. Ajeigbe, T. Abdoulaye, and D. Chikoye
International Institute of Tropical Agriculture (IITA)PMB 5320, IbadanOyo State, Nigeria
June 2010

ii iii
© International Institute of Tropical Agriculture (IITA), 2010Ibadan, Nigeria
To Headquarters from outside Nigeria:IITA, Carolyn House26 Dingwall Road, Croydon CR9 3EE, UK
Within Nigeria:PMB 5320, Oyo RoadIbadan, Oyo State
ISBN 978-978-50004-3-6
Printed in Nigeria by IITA
Correct citation: H.A. Ajeigbe, T. Abdoulaye, and D. Chikoye. Final project reportGatsby improved crop–livestock project (Project no. GAT2833) Improved crop–livestock system for enhanced food security and income generation in West AfricaInternational Institute of Tropical Agriculture, Ibadan, Nigeria. 50 pp.
Cover photo: Dry season cowpea field day, Radi, Niger.
ii iii
Contents Acronyms and abbreviations ............................................................................................................................ v Acknowledgments ........................................................................................................................................... vi Executive summary .........................................................................................................................................vii1. Introduction .......................................................................................................................................................1 Background ...................................................................................................................................................... 1 Objectives .........................................................................................................................................................2 Activities ...........................................................................................................................................................3 Expected output ............................................................................................................................................... 42. Study area and technology promoted .............................................................................................................. 5 Study area ........................................................................................................................................................5 Technology promoted ....................................................................................................................................... 53. Results .............................................................................................................................................................5 Typology of farmers .......................................................................................................................................... 5 Building a consortium of partners ..................................................................................................................... 6 Selection of local governments, communities, and farmers ............................................................................. 7 Input procurement and distribution ................................................................................................................... 7 On-farm demonstration .................................................................................................................................... 8 Maize–double cowpea strip cropping in the northern Guinea savanna ............................................................ 9 Cereals (sorghum, millet, and maize)–cowpea strip cropping in the Sudan savanna .................................... 11 Cereals (sorghum and millet)–cowpea strip cropping in the Sahel ................................................................ 12 On-farm evaluation of selected cowpea varieties ........................................................................................... 12 Evaluation of improved cowpea varieties in the northern Guinea savanna .................................................... 12 On-farm cowpea varietal evaluation in the Sudan savanna ........................................................................... 14 On-farm cowpea varietal evaluation in the Sahel savanna ............................................................................ 15 Dry season stall feeding of small ruminants ................................................................................................... 16 On-station evaluation and trials ...................................................................................................................... 17 Screening new insecticide formulations and their combinations for cowpea production ................................ 17 Evaluation of different rates of fertilizer and manure and their combination for the sorghum–cowpea strip cropping system ..................................................................................................18 Physicochemical properties of seeds of selected improved varieties of cowpea as they relate to the industrial utilization of the crop ......................................................................................19 Effect of feeding crop residues of different cereals and legumes on the weight gain of livestock .................. 21 Seed multiplication ......................................................................................................................................... 22 Training ...........................................................................................................................................................24 Farmers’ field days ......................................................................................................................................... 26 Registration of farmers’ groups and linkages to financial institutions ............................................................. 28 Linkages with processors and input dealers .................................................................................................. 29 Seed certification and construction of seed storage stores ............................................................................ 30 Survey of productivity enhancing practices used by farmers ......................................................................... 30 Assessment of the returns to investment ....................................................................................................... 31 Valuation of benefit and cost .......................................................................................................................... 32 Cost and benefit estimation ............................................................................................................................ 32 Estimating the net present value (NPV) ......................................................................................................... 33 Adoption level and discount rate-based scenarios ......................................................................................... 36 Project publications ........................................................................................................................................ 37 End of project stakeholder meeting ................................................................................................................ 404. Conclusion ......................................................................................................................................................415. References .....................................................................................................................................................42
TablesTable 1. Land and livestock holdings of farmers in Gatsby crop–livestock project sites in Nigeria and Niger Republic. .............................................................................................................................................. 5 Table 2. LGAs, communities, farmers and extension agents in direct contact with the Gatsby crop–livestock project in Nigeria........................................................................................................................... 6
viv
Table 3. Total number of departements, communities, farmers, and trained extension agents with direct access to the Gatsby crop–livestock project in Niger Republic........................................................... 6Table 4. Total quantity of inputs provided to Gatsby farmers in 2006 and 2007 in Nigeria and Niger Republic. .............................................................................................................................................. 7Table 5. Total quantity of fertilizer (t) provided by Government at subsidized prices. ................................................ 8Table 6. Crop productivity (kg ha–1) and income (N) from maize–double cowpea strip cropping in 2006 in Kaduna State, Nigeria.......................................................................................................................... 9Table 7. Crop productivity (kg ha–1) and income (N) from cereal–cowpea strip cropping in 2006 in Kano State, Nigeria.............................................................................................................................11Table 8. Mean (10 locations) grain and fodder productivity (kg/ha), seed coat color and days to maturity of selected cowpea varieties, planted in 2006 in Kaduna State, Nigeria. ............................................. 13Table 9. Mean (10 locations) grain and fodder yields (kg/ha), and farmers’ preference criteria in 2007 in Kaduna State, Nigeria. ...................................................................................................................... 13Table 10. Mean (17 locations) grain and fodder productivity (kg/ha), of selected cowpea varieties planted in 2006 in Kano State, Nigeria. ............................................................................................... 14Table 11. Mean (17 locations) grain and fodder yields (kg/ha), and farmers’ preference criteria in 2007, in Kano State, Nigeria. .............................................................................................................. 14Table 12. Mean grain yield of tested cowpea varieties in farmers’ fields at Maradi and Zinder, Niger Republic. ................................................................................................................................ 15Table 13. Mean number of farmers, livestock, and weight gained by livestock during dry season feeding trial. ..... 16Table 14. Effect of different insecticides and their combinations on cowpea grain yield in 2006 and 2007 at Minjibir and Samaru, Nigeria. ......................................................................................................... 18Table 15. Effects of different levels and combinations of inorganic and organic fertilizer on productivity (kg ha–1) of sorghum–cowpea strip cropping system in 2007 in Kano, Nigeria. ............................................... 19Table 16. Chemical properties of seeds of selected cowpea varieties. ................................................................... 20Table 17. Total seed production and sales in 2007 and in 2008 in Kano and Kaduna States, Nigeria................... 22Table 18. Major training workshops conducted from 2006 to 2008. ........................................................................ 24Table 19. Total number of farmers’ groups registered and provided with bank loans in 2007 and 2008 in Kano and Kaduna States, Nigeria. ................................................................................................. 28Table 20. Flour recovery of selected cowpea varieties. ........................................................................................... 29Table 21. Distribution of respondents according to productivity enhancing practices adopted by farmers. ............ 30Table 22. Distribution of respondents’ productivity constraining factors by ranking. ............................................... 31Table 23. Direct cost and benefit centers at the stakeholders’ level in Kano and Kaduna States. .......................... 32Table 24. Cost value (N) per year by option. ........................................................................................................... 33Table 25. Net present value, internal rate of return, and net present value per capita (improved option). .............. 34Table 26. Net present value, internal rate of return, and net present value per capita (traditional option) .............. 34Table 27: Benefit–cost ratio. ................................................................................................................................... 35Table 28. Estimated internal rate of return (IRR) at different discount rates and adoption level scenarios. ............ 36
AnnexesAnnex 1. Stakeholders and collaborators who participated in stakeholder workshops between 2006 and 2008 in Nigeria..................................................................................................................... 44Annex 2. Stakeholders and collaborators who participated in stakeholder workshops between 2006 and 2008 in Niger Republic. ....................................................................................................... 44Annex 3. Communities, extension agents, and farmers participating in Kano and Kaduna States, Nigeria in 2008................................................................................................................... 45Annex 4. Productivity (kg/ha) of selected cowpea varieties in 2006 in Niger. ......................................................... 45Annex 5. Grain and fodder yields (kg/ha) of selected cowpea varieties, 2008, Nigeria. ........................................ 46Annex 6. Productivities (kg/ha) of selected cowpea varieties in 2007 in Niger. .................................................. 46Annex 9. Estimated internal rate of return (IRR) at different discount rates and adoption level scenarios for each State. ............................................................................................................ 48Annex 10. Letter from Department of Agriculture Ningi LGA about progress in the LGA ........................................ 48Annex 11. Extension material produced by Kaduna State ADP. .............................................................................. 49Annex 12. Extension material produced by National Special Program for Food Security. ...................................... 49Annex 13. Demonstration of strip cropping by NAERLS in Zamfara State. ............................................................ 50
v
Acronyms and abbreviationsABU Ahmadu Bello UniversityADP Agricultural Development ProjectAQUADEV XII Water and Agricultural DevelopmentASAPI Appui a la Securité Alimentaire par la Petite Irrigation (Small irrigation program to support food security)CERRA Centre Régional de la Recherche AgronomiqueDDA Département de l’AgricultureDRDA Départements régionals de l’AgricultureFUBI Federation of Farmers’ Union (Zinder)FUMA Federation of Farmers’ Union (Maradi)GO governmental organizationHOD head of departmentIAR Institute of Agricultural ResearchIITA International Institute of Tropical AgricultureINRAN Institut National de Recherches Agronomiques du NigerK-ADP Kaduna Agricultural Development ProjectKNARDA Kano Agricultural Rural and Development AuthorityLGA local government areaMARKETS project Maximizing Agricultural Revenue in Key Enterprises in Target Sites NACRDB Nigeria Agricultural Cooperative and Rural Development BankNAERLS National Agricultural Extension and Research Liaison ServiceNAPRI National Animal Productivity Research InstituteNASC National Agricultural Seed CouncilNGO non-governmental organizationNSS National Seed ServicePC Peace CorpsPCV Peace Corps VolunteerSG2000 Sassakawa Global2000ToT Training of TrainersUSAID United States Agency for International DevelopmentWASA West African Seed AllianceWIA Women in AgricultureWOFAN Women Farmers Advancement NetworkWWF Wealth Window FoundationNPV net present valueBCR benefit-cost ratioIRR internal rate of returnAMRR Acceptance minimum rate of returnNGS northern Guinea savannaSS Sudan savannaNDEI Nigeria Dairy EnterpriseMRR marginal rate of returnSNV Netherlands Development OrganizationNARES national agricultural research and extension system
vi vii
AcknowledgmentsThis project was carried out with grants from the Gatsby Charitable Foundation, United Kingdom. We thank Gatsby for funding the phase 1 and 2 of the project. We would like to thank all project collaborators in Nigeria; African Agro Nigeria Ltd., Seed project Nigeria Ltd., Alheri Seed Nigeria Ltd., Premier Seeds Nigeria Ltd., Masalaha Seeds Nigeria Ltd, Bauchi State ADP, Departments of Agriculture of Participating LGAs, Dr Muhammed Umar Director, NAERLS/ABU; Prof A. Adamu Director, NAPRI/ABU Zaria; Prof. S.G. Ado, Director IAR/ABU Zaria; the former Director of NAERLS/ABU, Prof. S.S. Abubakar. Drs James Adeosun, Rabiu S. Adamu and R. J. Tanko of NAERLS, IAR, and NAPRI/ABU respectively. Jubaili Agro Tech Ltd, Dr A. Kassim, Program Manager, Kaduna State ADP; Alh Muhammed Kura Managing Director KNARDA; Alh Abba Datti, Director of Agric Services, Kano State Ministry of Agriculture; Dr Hassan, Director Agric Services, Kano State Ministry for Local Government, as well as the former Director, Alh Tijani Awal; Land`O lakes-Nigeria Dairy Enterprises, Principal and Staff of Leventis Foundation/Kano State Government Agricultural School, Panda, Musa Abubakar of ILRI/IITA Kano, Chief O.J Shobowale Director, National Agricultural Seed Council, Abuja and Seed Certification Officer in Kano, A.Y. Mohammed, New Nigeria Foundation, SG2000 Nigeria, USAID-MARKETS project, Wealth Window Foundation (WWF), Women Farmer Advancement Network (WOFAN), Musa Baba and Sons Nig Ltd, Alh. Saidu Zakari of Golden Fertilizer; project collaborators in Niger Republic; Saidou Mani of ABC Ecologie Mayayi, American Peace Corps Niger, AQUADEV XII , Director INRAN, Niamey and Drs Saidou A. Kyari and Mamman Nouri of CERRA-INRAN Maradi, DDA Madarunfa, DDA Magaria, DRDA Maradi, DRDA Zinder, FUBI, FUMA, and SNV Maradi. Quality technical support provided by A.S. Lamidi, Lawal Bala, Ahmed Garba, Ishaya Jockson, Esther Chinedu and Onu Anyebe, is well appreciated. We would like to thank IITA scientists based in Kano Station in particular, Dr Boukar Ousmane, Dr A.Y.Kamara and Dr Satoru Muranaka and Staff of the Station (Bayo Adegbenjo, Mohamed Umar, Ismaila Y. Mohammed, Ibrahim Maina, Tida Ibrahim, Musa Ladi) for their contributions to the project. Lastly, but certainly the most important are the participating men and women farmers who were very enthusiastic about the improved systems, adopted and adapted some of the systems, provided precious feedback and also sacrificed their time to attend to internal and external visitors that were taken to them on several occasions. Their enthusiasm was a source of inspiration as well as innovation to the project. The many extension agents who helped in the dissemination activities and Dr Bir Bahadur Singh, whose successful implementation of the first phase encouraged the funding of second phase by the Gatsby Charitable foundation are also well appreciated.
vi vii
Executive summaryThis final report provides a synthesis of the results of the second phase of the Gatsby Crop–Livestock project, number GAT2833, with the title, Improved crop–livestock systems for enhanced food security and income generation in West Africa’. The project started on 1 February 2006 and was completed on 31 January 2009, with a 6-month no-cost extension from 1 February to 31 July 2009. The main aim of the second phase of the project was to demonstrate and disseminate improved and sustainable cowpea-based crop–livestock system in Kaduna and Kano States in northern Nigeria and in Maradi and Zinder Divisions of Niger Republic. This was done in partnership with multiple stakeholders including crop and livestock farmers, farmers’ groups, the private commercial sector, NGOs, and other ongoing projects in the region. In the project, 23 collaborators from Nigeria and 11 from Niger Republic participated, ensuring a broad stakeholder consultation. Four major consultative workshops were held between 2006 and 2008.
In Nigeria, the project started with 3009 farmers in 2006; this rose to 11,112 farmers in 2007 and 18,836 farmers in 2008. In Niger Republic, the number of farmers who participated in the project was 159 in 2006, 250 in 2007, and 856 in 2008. In both countries, 10,192 L of insecticides, 42 t of improved cowpea seeds, and 626 t of fertilizer were procured and distributed to farmers between 2006 and 2008. In 2008, farmers procured inputs through linkages established by the project with seed companies and agrochemical companies. Bulk fertilizer purchases were facilitated by the project. In Nigeria, the Kano and Kaduna State Governments provided a total of 593.8 t of fertilizer to project farmers at subsidized prices.
Maize–double cowpea strip cropping in the northern Guinea savanna (NGS) and cereal–cowpea strip cropping in the Sudan savanna (SS) were more productive than the traditional systems. Farmers who double cropped their cowpea with maize had their income from grains increased by 174 to 345% compared with income from the traditional systems. Similarly farmers’ income from cereal–cowpea strip cropping was 100 to 200% higher than the income from the traditional systems.
In collaboration with the National Animal Production Research Institute (NAPRI) in Nigeria, the project made significant progress in improving animal health and growth through the demonstration of improved livestock housing and dry season feeding of small ruminants in stalls with crop residues. Mean live weight gain ranged from 1.74 to 5 kg/animal in 62 to 65 days with 414 to 550 kg of dry manure generated for each farmer in Kano and Kaduna States.
Multiplication of improved cowpea seeds by farmers started in 2007. The total quantity of improved cowpea seeds produced was 109.3 t in 2007 and 281 t in 2008. Farmers realized a total of US$50,806 in 2007 and US$262,800 in 2008 from seed sales. Similarly, in Niger, the increasing number of requests for seeds was met through dry season seed multiplication under irrigation. Seeds of three cowpea varieties (IT90K-372-1-2, IT97K-499-35, and IT97K-205-8) were multiplied under irrigation. The best farmer produced 1.75 t of seeds ha–1 and over 2 t of fodder ha–1. Seeds were sold at more than US$2 kg–1 at the beginning of the planting season as against the usual price of about US$1 kg–1 at harvest.
A total of 353 farmers’ groups were registered and linked to financial institutions in Nigeria from where they obtained loans totaling US$105,417 in 2008. Farmers were also linked to agro-processing companies. This is a significant achievement as the networked farmers are now supplying cowpea grains to the companies that process them for internal and external markets.
The project made significant progress in building the capacity of farmers, extension agents, and project technicians. Training workshops were organized on (a) improved agronomic and crop management practices, (b) improved crop–livestock systems, (c) fodder preservation and feeding strategies for livestock, (d) postharvest handling, processing, and commercialization of cowpea, and (e) safe use of agrochemicals. Special trainings were organized for women on soybean utilization and income generation. Graduate students’ research was supported within the project framework, leading to the award of MSc (7 students) and PhD (1 student) in Nigerian universities.
viii 1
The project facilitated the construction of nine large warehouses (seed stores) (4 during phase 1 and 5 in phase 2) and donation to participating farmers’ groups by the American Embassy in Nigeria. Farmer-to-farmer seed diffusion resulted in over 200,000 secondary and tertiary farmers having access to seeds and other improved technologies from project farmers. When the sales of seeds alone are considered, this project has made a significant contribution not only to the livelihoods of participating farmers who have sold seeds but also to thousands of other farmers who bought the improved varieties and who will benefit from increased productivity. The value of the seeds (US$262,800.00) sold by farmers is over the annual budget of the project; when this is added to the value of the increase in grain yield and animal productivity as well as the sustainability of the system, the project has contributed immensely to improving the livelihoods of the participating communities.
The potential economic impact of the Gatsby crop–livestock project implemented in Kano and Kaduna States of Nigeria from 2003 to 2008 was analyzed using conventional enterprise budgeting and gross margin techniques to calculate three corporate finance measures: net present value (NPV), benefit–cost ratio, and internal rate of return (IRR). Considering the overall agricultural benefits of different options, the Gatsby crop–livestock project has generally yielded a higher IRR (varying from 426 to 286%) in the different scenarios. These values are approximately three times higher than that obtained from the traditional systems. The main conclusion from these findings is that, assuming all other factors equal, US$100 invested within the project has generated a growth of US$426 (given a discount rate of 10%) and US$382 given a discount rate of 20%. In other words, US$1 invested within the project has generated on average $4.26 (discount rate of 10%) and $3.82, given a discount rate of 20%. A marginal rate of return (MRR) was also calculated and compared with the farmers’ acceptance minimum rate of return (AMRR) to evaluate whether or not shifting from the traditional system to the improved system is profitable within the framework of the Gatsby crop–livestock project. Assuming an AMRR of 140% due to the informal credit market, the results show that the project has been profitable in all cases (553 to 891%).
viii 1
1. IntroductionBackgroundThe rapid increase in population and consequent pressure for food are driving agriculture towards greater intensification in West Africa. The long fallow periods have not only diminished but agriculture has now also been pushed on to marginal lands, leaving little or no scope for further expansion in the cultivated area. This has led to a continuous decline in the per capita availability of food, leading to widespread malnutrition and hunger. This is more pronounced in the dry savannas of Nigeria and throughout Niger Republic, where rainfall is low and soils are predominantly sandy with low levels of organic matter, low phosphorus, and poor water-holding capacity. The bulk of the agriculture in this region is still based on traditional intercropping systems, and most of the subsistence farmers plant a 1 row cereal: 1 row cowpea arrangement, with low plant density and little or no application of fertilizers and chemicals (Mortimore et al. 1997, Henriet et al. 1997). Such practices lead to decreasing soil organic matter content, increasing populations of chronic parasitic weeds (e.g., Striga spp.), reduced soil biological diversity, and enhanced erosion risk. This in turn leads to a negative balance of nutrients in the soil and a continuous decline in crop yields. Recent estimates (Sanginga et al. 2003) indicated that, in this system, annual nutrient losses/ha exceed 26 kg N, 3 kg P, and 19 kg K, and farmers obtain less than 1 t/ha of food which perpetuates poverty through the vicious circle of “low input–low production–low income”. As a consequence, over 70% of the population in this region are currently living below the poverty line, spending less than one dollar a day. How to help to improve agriculture and reverse this trend are major challenges to agricultural research for development in this region.
The integration of livestock into the farming system helps to maintain soil fertility by the use of manure, increases farm efficiency by providing traction and transport, and adds to farm income and human nutrition through milk and meat. The major constraint to livestock integration in West Africa is the limited availability of crop residues with high nutrient quality. Due to shrinking land and other farm resources, farmers are unable to grow food and fodder on separate pieces of land. Therefore, grain and fodder yields, as well as quality of crop residues, must be improved to ensure food security and enhance livestock integration in the farming system. Most crop improvement research in the past has focused on breeding for improved grain yield with little or no emphasis on fodder. Also, due to little or no use of inputs, grain as well as fodder yields are low. It is a fact that, without inputs, crop yields cannot be increased but, at the same time, large quantities of fertilizers and chemicals are not available in the region. Thus, the challenge is to maximize the benefits of a small amount of purchased inputs and the use of manure from the livestock to enhance organic matter in the soil and increase and sustain crop productivity. This is possible through improved crop–livestock systems involving dual-purpose and high-yielding crop varieties of appropriate legumes and cereals.
Recent participatory research at IITA, in collaboration with other international agricultural research centers and various NARS partners and with financial support from the Gatsby Charitable Foundation, USAID, and Department for International Development (UK), has led to the development of an appropriate model which seems to hold great promise for increasing food production in West Africa, without negatively affecting the environment and degrading the soils. This holistic model involves a combination of improved and resilient crop varieties, an improved cropping system with minimum and selective application of fertilizers and pesticides, the feeding of crop residues to small ruminants in permanent enclosures on the home compound, and the returning of the manure to the field (Singh et al. 2003).
Based on this model, two best-bet options are already becoming popular with farmers in northern Nigeria. These are: (1) in the Sudan savanna (SS) where the annual rainfall is about 600 mm, an improved strip cropping system involving 2 rows of a densely planted improved sorghum variety: 4 rows of a densely planted improved medium-maturing cowpea variety (Ajeigbe et al. 2005); and (2) in the northern Guinea savanna (NGS) where the annual rainfall is about 1000 mm, an improved strip cropping system involving 2 rows of a densely planted improved maize variety: 4 rows of a densely planted double-cropped improved 60-day cowpea (Ajeigbe et al. 2006).
2 3
In both systems, a basal dose of 100 kg/ha NPK (15:15:15) and 1 t/ha manure is given, followed by selective application of 23 kg/ha N on the sorghum and maize, and two sprays of Cypermethrin (a safe insecticide) on the cowpea to control pod borers. The two cereal rows have no competing border rows and therefore they yield the equivalent of almost three rows. The cowpea does not suffer competition from the cereal rows because of its early maturity and the slow initial growth of the cereals. Cowpea fixes atmospheric nitrogen, causes suicidal germination of Striga hermonthica, and also contributes to improving soil fertility. These systems have shown up to 300% superiority in productivity and gross income compared to the traditional 1 row cereal : 1 row legume intercropping. Average on-farm yields in the first phase of the project were 1.5 t/ha sorghum grain, 2 t/ha sorghum fodder, 1.2 t/ha cowpea grain, and 1.5 t/ha cowpea fodder in the sorghum–cowpea system in the SS zone, while the maize–double cropped cowpea system in the higher rainfall region gave about 1.3 t/ha maize grain, 1.5 t/ha maize fodder, 2 t/ha cowpea grain, and 1.5 t/ha cowpea fodder. The residue from the first cowpea crop was incorporated into the soil which provided additional fertility to the standing maize crop and the second cowpea crop. Since the improved systems involve two-thirds of the area under cowpea and one-third of the area under cereals, not only was the soil fertility improved but there was also a substantial reduction in the incidence of Striga hermonthica, which parasites sorghum and other cereals. The 1.5 t/ha of nutritious cowpea haulms and 1.5–2 t/ha cereal fodder support the sedentary feeding of up to eight sheep or goats. These then produce over 1 t of manure/year, which contributes to making the system sustainable. Backup experiments showed that the supplementary feeding of young rams with only 200 g/day of cowpea haulms along with sorghum stover doubles their weight gain in 70 days, compared to feeding them with sorghum stover alone.
The total cost/ha of purchased inputs was about $80/ha, and the total output from the combined grain yields of cowpea and maize/sorghum was equivalent to over $800/ha, i.e., about 10 times the cash input. Since most of the farmers have large families, the farm labor comes mostly from the family, and therefore the increased production actually becomes a net gain for the family. The cereal yield was sufficient to meet the family’s food needs, and the increased production of cowpea not only meets the nutritional requirement of the family but also catalyzes the preparation of cowpea-based foods and snacks, leading to income generation by women through the sale of these products. Cowpea is an important source of protein in the daily diets of rural and urban populations, and therefore its increased production has a direct positive impact on health and nutrition, particularly of women and children.
In the first phase, the project demonstrated good potential for changing the traditional farming system into a dynamic and sustainable commercial agricultural endeavor, and ensuring complete household food security in West Africa. This system was also found to be appropriate and to increase food production in the rainfall-insecure regions of the Niger Republic. An additional 3 years participation of the project (second phase) was intended to cover several thousands of farmers, including those in the Niger Republic.
ObjectivesThe objectives of the project were:
To extend and disseminate improved crop–livestock farming systems in Kano and Kaduna States in •Nigeria, and Maradi and Zinder Regions in Niger as pilot sites.To monitor the gains from the improved systems in terms of household food security, income •generation, and natural resource conservation.To monitor the effects of enhanced food security on the nutrition, health, and quality of life of the •families of contact farmers.To demonstrate that food production can be sustainably increased in West Africa, and sensitize •governments to develop infrastructure for the large-scale adoption of the improved technologies.
2 3
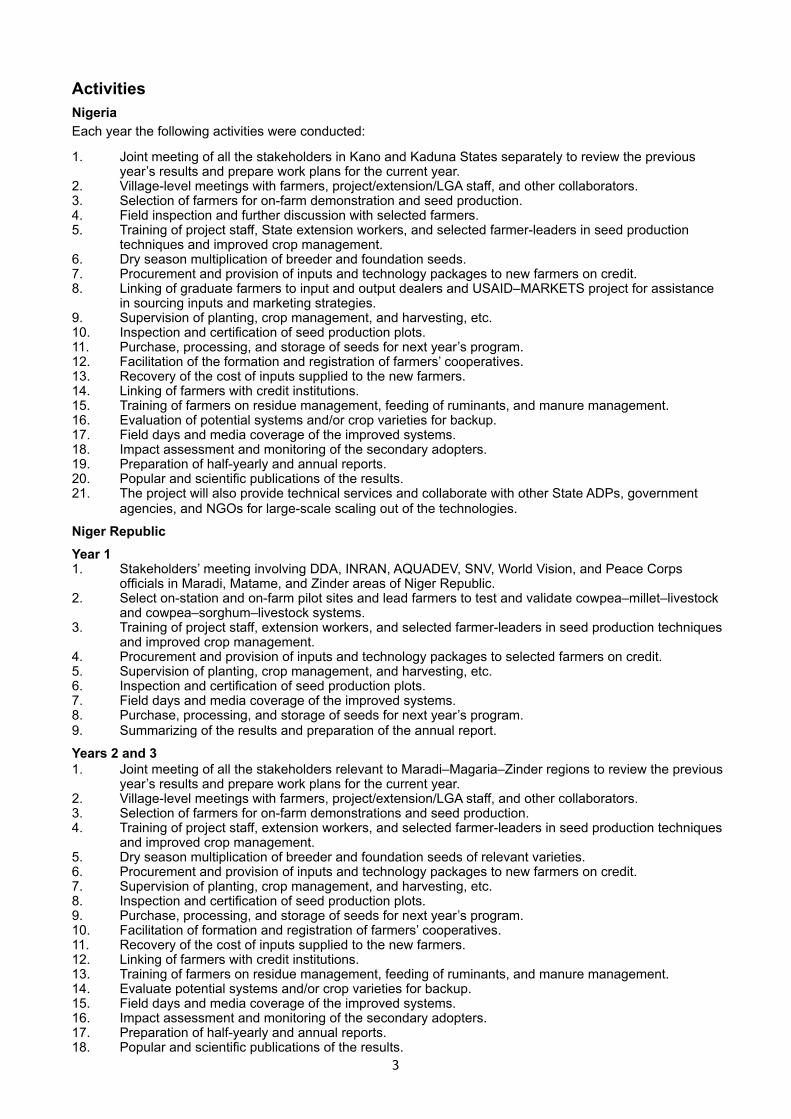
ActivitiesNigeria Each year the following activities were conducted:
1. Joint meeting of all the stakeholders in Kano and Kaduna States separately to review the previous year’s results and prepare work plans for the current year.2. Village-level meetings with farmers, project/extension/LGA staff, and other collaborators.3. Selection of farmers for on-farm demonstration and seed production.4. Field inspection and further discussion with selected farmers.5. Training of project staff, State extension workers, and selected farmer-leaders in seed production techniques and improved crop management.6. Dry season multiplication of breeder and foundation seeds.7. Procurement and provision of inputs and technology packages to new farmers on credit. 8. Linking of graduate farmers to input and output dealers and USAID–MARKETS project for assistance in sourcing inputs and marketing strategies.9. Supervision of planting, crop management, and harvesting, etc.10. Inspection and certification of seed production plots.11. Purchase, processing, and storage of seeds for next year’s program.12. Facilitation of the formation and registration of farmers’ cooperatives.13. Recovery of the cost of inputs supplied to the new farmers.14. Linking of farmers with credit institutions. 15. Training of farmers on residue management, feeding of ruminants, and manure management.16. Evaluation of potential systems and/or crop varieties for backup.17. Field days and media coverage of the improved systems. 18. Impact assessment and monitoring of the secondary adopters.19. Preparation of half-yearly and annual reports.20. Popular and scientific publications of the results.21. The project will also provide technical services and collaborate with other State ADPs, government agencies, and NGOs for large-scale scaling out of the technologies.
Niger RepublicYear 11. Stakeholders’ meeting involving DDA, INRAN, AQUADEV, SNV, World Vision, and Peace Corps officials in Maradi, Matame, and Zinder areas of Niger Republic.2. Select on-station and on-farm pilot sites and lead farmers to test and validate cowpea–millet–livestock and cowpea–sorghum–livestock systems.3. Training of project staff, extension workers, and selected farmer-leaders in seed production techniques and improved crop management. 4. Procurement and provision of inputs and technology packages to selected farmers on credit. 5. Supervision of planting, crop management, and harvesting, etc.6. Inspection and certification of seed production plots.7. Field days and media coverage of the improved systems.8. Purchase, processing, and storage of seeds for next year’s program.9. Summarizing of the results and preparation of the annual report.
Years 2 and 31. Joint meeting of all the stakeholders relevant to Maradi–Magaria–Zinder regions to review the previous year’s results and prepare work plans for the current year.2. Village-level meetings with farmers, project/extension/LGA staff, and other collaborators.3. Selection of farmers for on-farm demonstrations and seed production.4. Training of project staff, extension workers, and selected farmer-leaders in seed production techniques and improved crop management.5. Dry season multiplication of breeder and foundation seeds of relevant varieties.6. Procurement and provision of inputs and technology packages to new farmers on credit. 7. Supervision of planting, crop management, and harvesting, etc.8. Inspection and certification of seed production plots.9. Purchase, processing, and storage of seeds for next year’s program.10. Facilitation of formation and registration of farmers’ cooperatives.11. Recovery of the cost of inputs supplied to the new farmers. 12. Linking of farmers with credit institutions.13. Training of farmers on residue management, feeding of ruminants, and manure management.14. Evaluate potential systems and/or crop varieties for backup.15. Field days and media coverage of the improved systems. 16. Impact assessment and monitoring of the secondary adopters.17. Preparation of half-yearly and annual reports.18. Popular and scientific publications of the results.
4 5
Expected outputFirst year of the second phase of the project
A total of 300 farmers participated in seed production and on-farm demonstration of the improved •package and produced over 200 t of improved seeds.At least 10 men and 5 women farmers’ groups registered. •At least 50 extension agents and 100 farmer leaders trained in seed production techniques. •
Second and final year of the projectEach year, a total of at least 8000 new farmers participated in seed production and on-farm •demonstrations and produced over 5000 t of improved seeds.Each year, at least 50 new men and women farmers’ groups were formed and trained in seed •production, crop production and storage, and cooperative management.By the end of the project, a total of 20,000 farmers will have been directly involved and over 200,000 •farmers will have indirectly benefited from farmer-to farmer diffusion of improved seeds and crop–livestock systems.By the end of the project, farmers and agro-dealers in each participating State will have established •seed production and storage systems to fulfill the major seed needs of the State.By the end of the project, most of the participating farmers will have broken their poverty cycle and will •be playing a major role in catalyzing improved agricultural activities and raising farm incomes in the respective States.
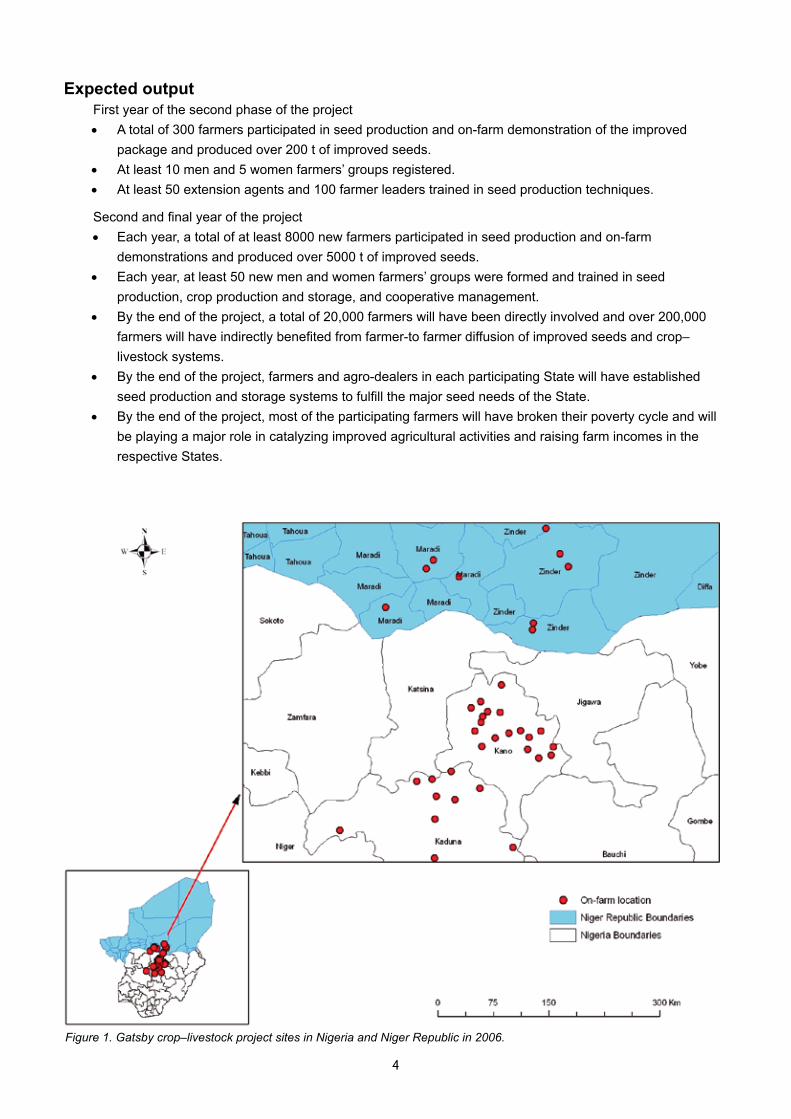
Figure 1. Gatsby crop–livestock project sites in Nigeria and Niger Republic in 2006.
4 5
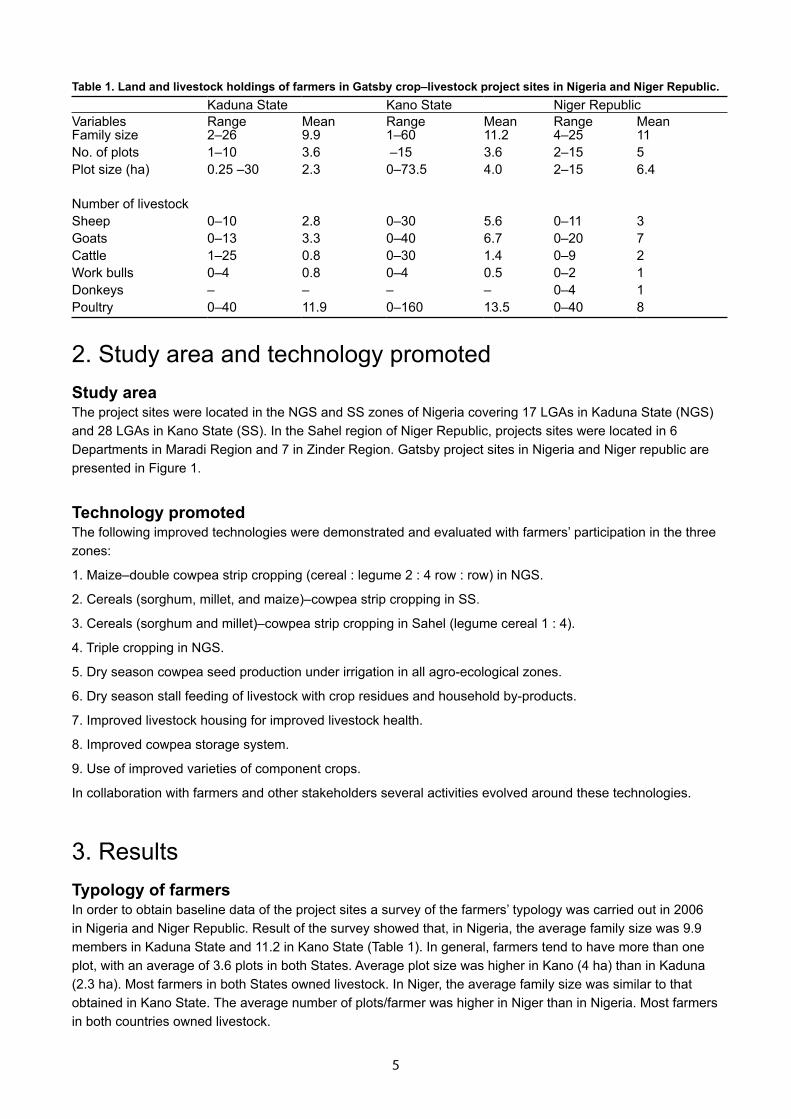
2. Study area and technology promotedStudy areaThe project sites were located in the NGS and SS zones of Nigeria covering 17 LGAs in Kaduna State (NGS) and 28 LGAs in Kano State (SS). In the Sahel region of Niger Republic, projects sites were located in 6 Departments in Maradi Region and 7 in Zinder Region. Gatsby project sites in Nigeria and Niger republic are presented in Figure 1.
Technology promotedThe following improved technologies were demonstrated and evaluated with farmers’ participation in the three zones:
1. Maize–double cowpea strip cropping (cereal : legume 2 : 4 row : row) in NGS.
2. Cereals (sorghum, millet, and maize)–cowpea strip cropping in SS.
3. Cereals (sorghum and millet)–cowpea strip cropping in Sahel (legume cereal 1 : 4).
4. Triple cropping in NGS.
5. Dry season cowpea seed production under irrigation in all agro-ecological zones.
6. Dry season stall feeding of livestock with crop residues and household by-products.
7. Improved livestock housing for improved livestock health.
8. Improved cowpea storage system.
9. Use of improved varieties of component crops.
In collaboration with farmers and other stakeholders several activities evolved around these technologies.
3. ResultsTypology of farmersIn order to obtain baseline data of the project sites a survey of the farmers’ typology was carried out in 2006 in Nigeria and Niger Republic. Result of the survey showed that, in Nigeria, the average family size was 9.9 members in Kaduna State and 11.2 in Kano State (Table 1). In general, farmers tend to have more than one plot, with an average of 3.6 plots in both States. Average plot size was higher in Kano (4 ha) than in Kaduna (2.3 ha). Most farmers in both States owned livestock. In Niger, the average family size was similar to that obtained in Kano State. The average number of plots/farmer was higher in Niger than in Nigeria. Most farmers in both countries owned livestock.
Table 1. Land and livestock holdings of farmers in Gatsby crop–livestock project sites in Nigeria and Niger Republic.Kaduna State Kano State Niger Republic
Variables Range Mean Range Mean Range MeanFamily size 2–26 9.9 1–60 11.2 4–25 11No. of plots 1–10 3.6 –15 3.6 2–15 5Plot size (ha) 0.25 –30 2.3 0–73.5 4.0 2–15 6.4
Number of livestockSheep 0–10 2.8 0–30 5.6 0–11 3Goats 0–13 3.3 0–40 6.7 0–20 7Cattle 1–25 0.8 0–30 1.4 0–9 2Work bulls 0–4 0.8 0–4 0.5 0–2 1Donkeys – – – – 0–4 1Poultry 0–40 11.9 0–160 13.5 0–40 8
6 7
Building a consortium of partners
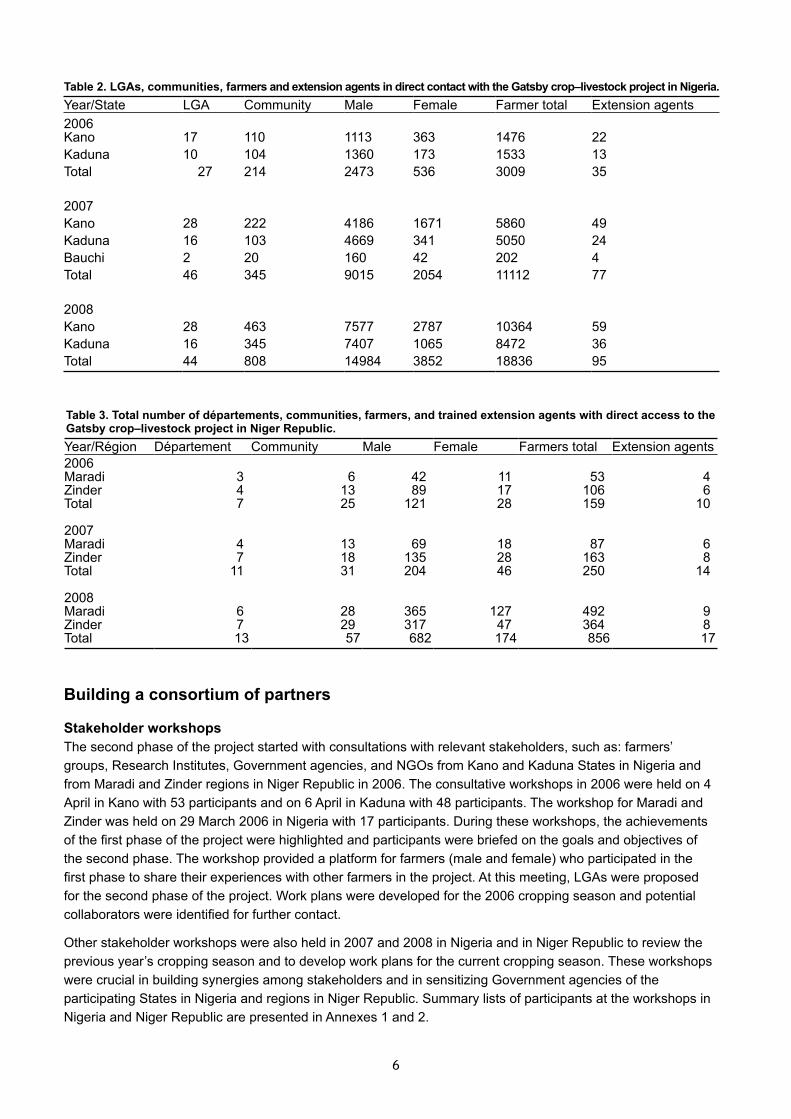
Stakeholder workshopsThe second phase of the project started with consultations with relevant stakeholders, such as: farmers’ groups, Research Institutes, Government agencies, and NGOs from Kano and Kaduna States in Nigeria and from Maradi and Zinder regions in Niger Republic in 2006. The consultative workshops in 2006 were held on 4 April in Kano with 53 participants and on 6 April in Kaduna with 48 participants. The workshop for Maradi and Zinder was held on 29 March 2006 in Nigeria with 17 participants. During these workshops, the achievements of the first phase of the project were highlighted and participants were briefed on the goals and objectives of the second phase. The workshop provided a platform for farmers (male and female) who participated in the first phase to share their experiences with other farmers in the project. At this meeting, LGAs were proposed for the second phase of the project. Work plans were developed for the 2006 cropping season and potential collaborators were identified for further contact.
Other stakeholder workshops were also held in 2007 and 2008 in Nigeria and in Niger Republic to review the previous year’s cropping season and to develop work plans for the current cropping season. These workshops were crucial in building synergies among stakeholders and in sensitizing Government agencies of the participating States in Nigeria and regions in Niger Republic. Summary lists of participants at the workshops in Nigeria and Niger Republic are presented in Annexes 1 and 2.
Table 3. Total number of départements, communities, farmers, and trained extension agents with direct access to the Gatsby crop–livestock project in Niger Republic.Year/Région Département Community Male Female Farmers total Extension agents2006Maradi 3 6 42 11 53 4Zinder 4 13 89 17 106 6Total 7 25 121 28 159 10
2007Maradi 4 13 69 18 87 6Zinder 7 18 135 28 163 8Total 11 31 204 46 250 14
2008Maradi 6 28 365 127 492 9Zinder 7 29 317 47 364 8Total 13 57 682 174 856 17
Table 2. LGAs, communities, farmers and extension agents in direct contact with the Gatsby crop–livestock project in Nigeria.Year/State LGA Community Male Female Farmer total Extension agents2006Kano 17 110 1113 363 1476 22Kaduna 10 104 1360 173 1533 13Total 27 214 2473 536 3009 35
2007Kano 28 222 4186 1671 5860 49Kaduna 16 103 4669 341 5050 24Bauchi 2 20 160 42 202 4Total 46 345 9015 2054 11112 77
2008Kano 28 463 7577 2787 10364 59Kaduna 16 345 7407 1065 8472 36Total 44 808 14984 3852 18836 95
6 7
Selection of local governments, communities, and farmersCommunities and farmers for the second phase of the project were selected after consultations with Heads of Agricultural Departments in all the proposed LGAs, relevant ADP staff, NAERLS, IAR, and farmers’ group leaders in Kano and Kaduna States in Nigeria and with Heads of the relevant Agricultural Services in Maradi and Zinder regions in Niger Republic, scientists from INRAN, AQUADEV, SNV, and various NGOs in Niger Republic. Based on consultations, field visits were made, pilot sites were identified, and desk officers were selected in 2006. Criteria used in selecting farmers included ownership or access to land and livestock and willingness to participate in the project.
Participating farmers are described as those who have direct contact with the project either through the scientists or extension agents. The farmers must also participate in a minimum of one project, facilitate training during the season, or receive seed though the project and must implement one of the project technologies on their farms. The total number of LGAs, communities, and farmers that participated in the project in Nigeria and in Niger Republic are presented in Tables 2 and 3. In Nigeria, 3009 farmers (Kaduna: 1533, Kano: 1476) participated in the project in 2006. The total number of participants increased to 11,112 farmers (Kaduna: 5050, Kano: 5860, and Bauchi: 202) in 2007 and to 18,836 farmers (Kaduna: 8472, Kano: 10,364) in 2008. The number of extension agents trained by the project increased from 35 in 2006 to 95 in 2008 in Nigeria (Table 3).
In Niger Republic, the total number of farmers who participated in the project increased from 159 farmers (Maradi: 53, Zinder: 106) in 2006 to 250 farmers (Maradi: 87, Zinder: 163) in 2007 and to 856 farmers (Maradi: 492, Zinder: 364) in 2008. The total number of communities, farmers, and extension agents in 2007 and 2008 in both countries represent cumulative values from previous years. In other words, new farmers were added to the existing number of participating farmers each year. A comprehensive list of LGAs, communities, and farmers that participated in the project in 2008 in Nigeria is presented in Annex 3. In addition to the selection of farmers the American Peace Corp (PC) was identified as a potential collaborator in 2006 with two PC volunteers (PCV) assigned to the project in 2006 by PC head office in Niamey. By 2008 over 16 PCV had participated in the project.
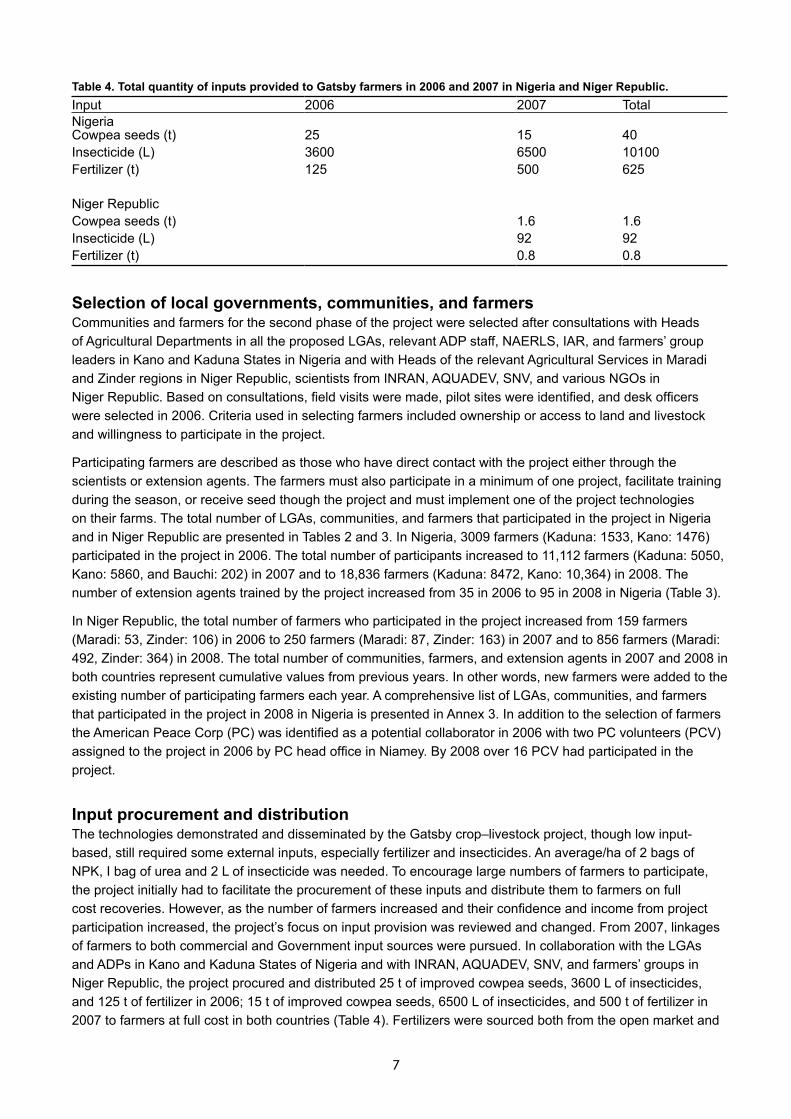
Input procurement and distributionThe technologies demonstrated and disseminated by the Gatsby crop–livestock project, though low input-based, still required some external inputs, especially fertilizer and insecticides. An average/ha of 2 bags of NPK, I bag of urea and 2 L of insecticide was needed. To encourage large numbers of farmers to participate, the project initially had to facilitate the procurement of these inputs and distribute them to farmers on full cost recoveries. However, as the number of farmers increased and their confidence and income from project participation increased, the project’s focus on input provision was reviewed and changed. From 2007, linkages of farmers to both commercial and Government input sources were pursued. In collaboration with the LGAs and ADPs in Kano and Kaduna States of Nigeria and with INRAN, AQUADEV, SNV, and farmers’ groups in Niger Republic, the project procured and distributed 25 t of improved cowpea seeds, 3600 L of insecticides, and 125 t of fertilizer in 2006; 15 t of improved cowpea seeds, 6500 L of insecticides, and 500 t of fertilizer in 2007 to farmers at full cost in both countries (Table 4). Fertilizers were sourced both from the open market and
Table 4. Total quantity of inputs provided to Gatsby farmers in 2006 and 2007 in Nigeria and Niger Republic.Input 2006 2007 TotalNigeriaCowpea seeds (t) 25 15 40Insecticide (L) 3600 6500 10100Fertilizer (t) 125 500 625
Niger RepublicCowpea seeds (t) 1.6 1.6Insecticide (L) 92 92Fertilizer (t) 0.8 0.8
8 9
from the Government. The subsidized fertilizers from the Government were from two levels (State and Local Government). Fertilizers were allocated by the relevant Ministries, ADPs, and Local Government to support the project. The project received more Government fertilizers from Kano State; therefore participating farmers in this State got more than farmers in Kaduna State. For example, in Kano State, one 50 kg bag of fertilizer was shared among four farmers. In Kaduna State, six farmers shared a 50 kg bag. Fertilizers were also sourced in the open market and farmers were encouraged to make bulk purchases.
In 2008, farmers procured inputs through linkages established by the project with seed companies (Project Seeds and Premier Seeds) and agro-chemical companies (African Agro-chemical Ltd and Jubaili Agro-chemical Ltd). Bulk fertilizer purchases were facilitated by the project. By purchasing in bulk and getting discounts on transport, Gatsby farmers were able to purchase fertilizers in the open market for N3500–3600/bag. For example, a major fertilizer dealer, Musa Baba and sons, provided free transport to farmers’ groups that were able to make a bulk purchase of at least 15 t at a time. Three farmers’ groups took advantage of this opportunity by cooperating with other farmers in the community and neighboring communities. This was also a major breakthrough as farmers’ groups can now contact the traders directly and make bulk purchases of inputs at discounted rates. In communities where the bulk purchases were done, non-participating farmers also benefited from the discount. More fertilizers were purchased in the open market than were sourced from Government.
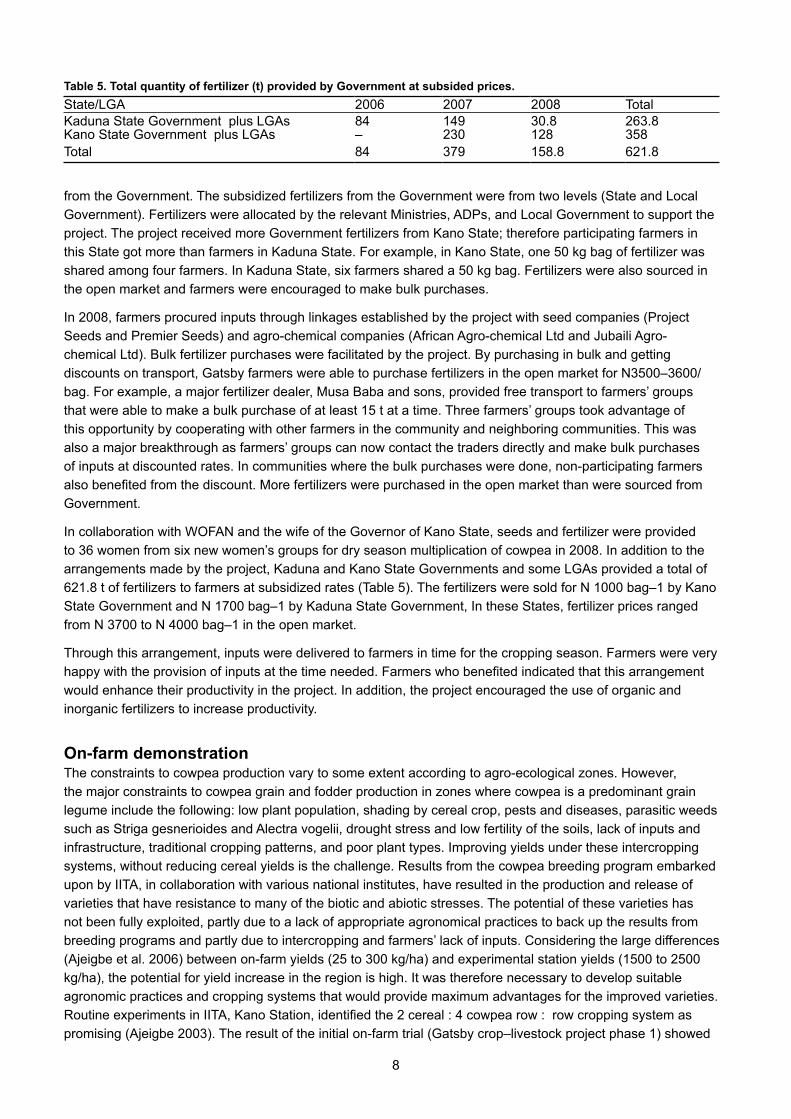
In collaboration with WOFAN and the wife of the Governor of Kano State, seeds and fertilizer were provided to 36 women from six new women’s groups for dry season multiplication of cowpea in 2008. In addition to the arrangements made by the project, Kaduna and Kano State Governments and some LGAs provided a total of 621.8 t of fertilizers to farmers at subsidized rates (Table 5). The fertilizers were sold for N 1000 bag–1 by Kano State Government and N 1700 bag–1 by Kaduna State Government, In these States, fertilizer prices ranged from N 3700 to N 4000 bag–1 in the open market.
Through this arrangement, inputs were delivered to farmers in time for the cropping season. Farmers were very happy with the provision of inputs at the time needed. Farmers who benefited indicated that this arrangement would enhance their productivity in the project. In addition, the project encouraged the use of organic and inorganic fertilizers to increase productivity.
On-farm demonstrationThe constraints to cowpea production vary to some extent according to agro-ecological zones. However, the major constraints to cowpea grain and fodder production in zones where cowpea is a predominant grain legume include the following: low plant population, shading by cereal crop, pests and diseases, parasitic weeds such as Striga gesnerioides and Alectra vogelii, drought stress and low fertility of the soils, lack of inputs and infrastructure, traditional cropping patterns, and poor plant types. Improving yields under these intercropping systems, without reducing cereal yields is the challenge. Results from the cowpea breeding program embarked upon by IITA, in collaboration with various national institutes, have resulted in the production and release of varieties that have resistance to many of the biotic and abiotic stresses. The potential of these varieties has not been fully exploited, partly due to a lack of appropriate agronomical practices to back up the results from breeding programs and partly due to intercropping and farmers’ lack of inputs. Considering the large differences (Ajeigbe et al. 2006) between on-farm yields (25 to 300 kg/ha) and experimental station yields (1500 to 2500 kg/ha), the potential for yield increase in the region is high. It was therefore necessary to develop suitable agronomic practices and cropping systems that would provide maximum advantages for the improved varieties. Routine experiments in IITA, Kano Station, identified the 2 cereal : 4 cowpea row : row cropping system as promising (Ajeigbe 2003). The result of the initial on-farm trial (Gatsby crop–livestock project phase 1) showed
Table 5. Total quantity of fertilizer (t) provided by Government at subsided prices.State/LGA 2006 2007 2008 TotalKaduna State Government plus LGAs 84 149 30.8 263.8Kano State Government plus LGAs – 230 128 358Total 84 379 158.8 621.8
8 9
200 to 400% superiority from the 2 cereal: 4 cowpea (row : row) system in gross income compared to traditional 1 row cereal : 1 row legume intercropping. The strip cropping system and a number of related technologies were demonstrated and disseminated to over 20,000 farmers through a farmer participatory approach in the different agro-ecological zones covered by the project.
Maize–double cowpea strip cropping in the northern Guinea savanna
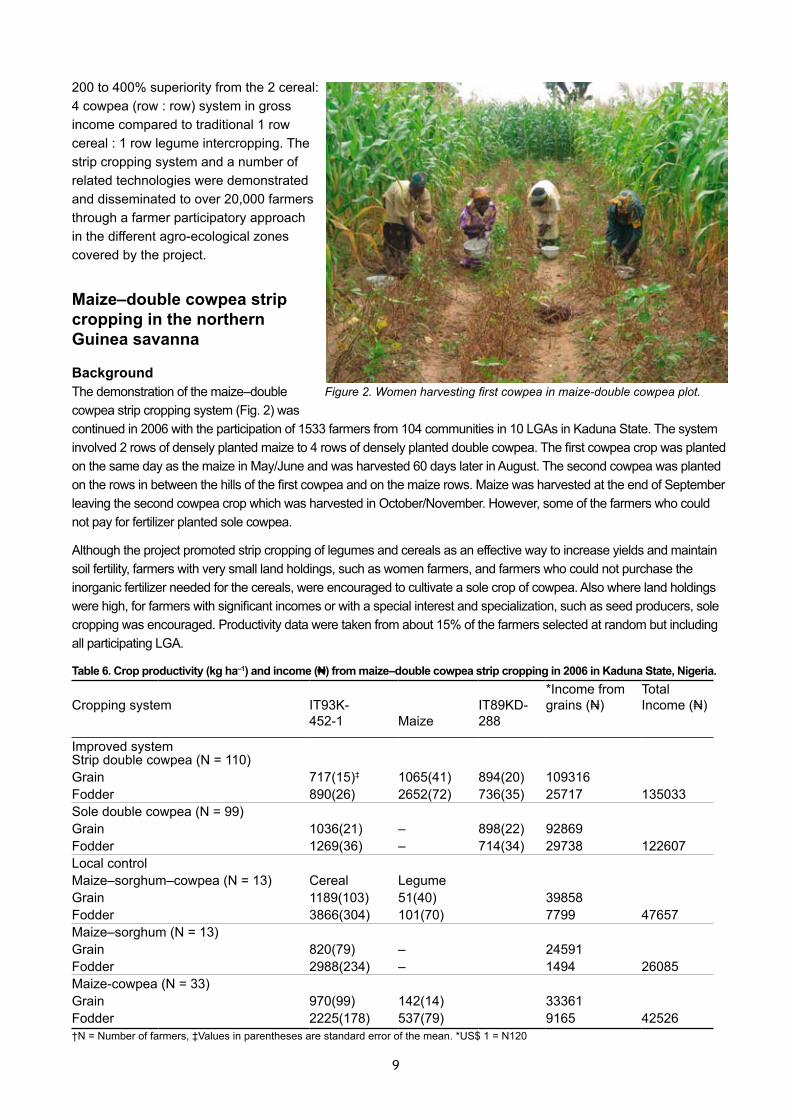
BackgroundThe demonstration of the maize–double cowpea strip cropping system (Fig. 2) was continued in 2006 with the participation of 1533 farmers from 104 communities in 10 LGAs in Kaduna State. The system involved 2 rows of densely planted maize to 4 rows of densely planted double cowpea. The first cowpea crop was planted on the same day as the maize in May/June and was harvested 60 days later in August. The second cowpea was planted on the rows in between the hills of the first cowpea and on the maize rows. Maize was harvested at the end of September leaving the second cowpea crop which was harvested in October/November. However, some of the farmers who could not pay for fertilizer planted sole cowpea.
Although the project promoted strip cropping of legumes and cereals as an effective way to increase yields and maintain soil fertility, farmers with very small land holdings, such as women farmers, and farmers who could not purchase the inorganic fertilizer needed for the cereals, were encouraged to cultivate a sole crop of cowpea. Also where land holdings were high, for farmers with significant incomes or with a special interest and specialization, such as seed producers, sole cropping was encouraged. Productivity data were taken from about 15% of the farmers selected at random but including all participating LGA.
Figure 2. Women harvesting first cowpea in maize-double cowpea plot.
Table 6. Crop productivity (kg ha–1) and income (N) from maize–double cowpea strip cropping in 2006 in Kaduna State, Nigeria.
Cropping system IT93K-452-1 Maize
IT89KD-288
*Income from grains (N)
TotalIncome (N)
Improved systemStrip double cowpea (N = 110)Grain 717(15)‡ 1065(41) 894(20) 109316Fodder 890(26) 2652(72) 736(35) 25717 135033Sole double cowpea (N = 99)Grain 1036(21) – 898(22) 92869Fodder 1269(36) – 714(34) 29738 122607Local controlMaize–sorghum–cowpea (N = 13) Cereal LegumeGrain 1189(103) 51(40) 39858Fodder 3866(304) 101(70) 7799 47657Maize–sorghum (N = 13)Grain 820(79) – 24591Fodder 2988(234) – 1494 26085Maize-cowpea (N = 33)Grain 970(99) 142(14) 33361Fodder 2225(178) 537(79) 9165 42526†N = Number of farmers, ‡Values in parentheses are standard error of the mean. *US$ 1 = N120
10 11
Results and achievementsMaize–double cowpea cropping system was more productive than the sole double cowpea and the traditional systems (Table 6). Farmers who double cropped their cowpea with maize had their income from grains increased by 18% compared with sole double cowpea and by 174 to 345% compared with traditional cropping systems. Similarly, income from sole double cowpea increased farmers’ income by 133 to 278% compared with the traditional mixed cropping system. The mean gross income/fsrmer/ha (grain + fodder) was N135,000 in the improved maize : double cowpea strip cropping system and N122,000 in the sole double cowpea system, compared with N26,000 to N47,000 in the traditional systems. In general, a total of 1595 t of grains (cowpea: 981 t, maize: 614 t) was produced by 1533 farmers in Kaduna State. Total land area used for this production was 577 ha. The crop residue left from the first cowpea crop was used as fodder for large ruminants or as mulch.
The total cash inputs for improved seeds, fertilizers, and chemicals in the improved systems ranged from N12,500 to N13,500/farmer. Thus, farmers are deriving a major benefit of more than 300% superiority from the improved system. A major achievement of the system is the provision of cowpea grain in August which is normally the off-season for cowpea and prices are high. They benefited from the new cowpea varieties in terms of food during the hunger period as well as cash.
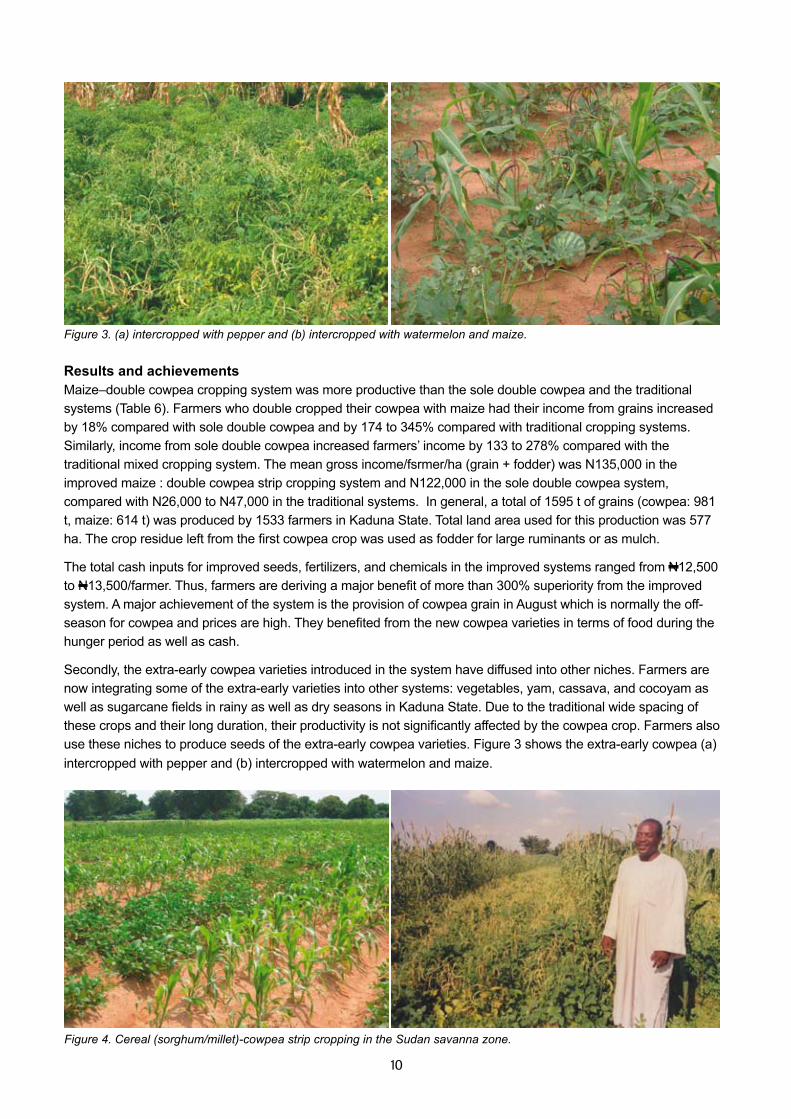
Secondly, the extra-early cowpea varieties introduced in the system have diffused into other niches. Farmers are now integrating some of the extra-early varieties into other systems: vegetables, yam, cassava, and cocoyam as well as sugarcane fields in rainy as well as dry seasons in Kaduna State. Due to the traditional wide spacing of these crops and their long duration, their productivity is not significantly affected by the cowpea crop. Farmers also use these niches to produce seeds of the extra-early cowpea varieties. Figure 3 shows the extra-early cowpea (a) intercropped with pepper and (b) intercropped with watermelon and maize.
Figure 3. (a) intercropped with pepper and (b) intercropped with watermelon and maize.
Figure 4. Cereal (sorghum/millet)-cowpea strip cropping in the Sudan savanna zone.
10 11
Cereals (sorghum, millet, and maize)–cowpea strip cropping in the Sudan savanna
BackgroundDemonstrations of sorghum–cowpea, millet–cowpea (Fig. 4) and maize–cowpea strip cropping were carried out on farmers’ fields from 2006 in the SS zone of Kano State. This system of cropping involved 2 rows of densely planted cereals (sorghum, maize, or millet) to 4 rows of densely planted cowpea. Some farmers also planted improved cowpea as a sole crop.
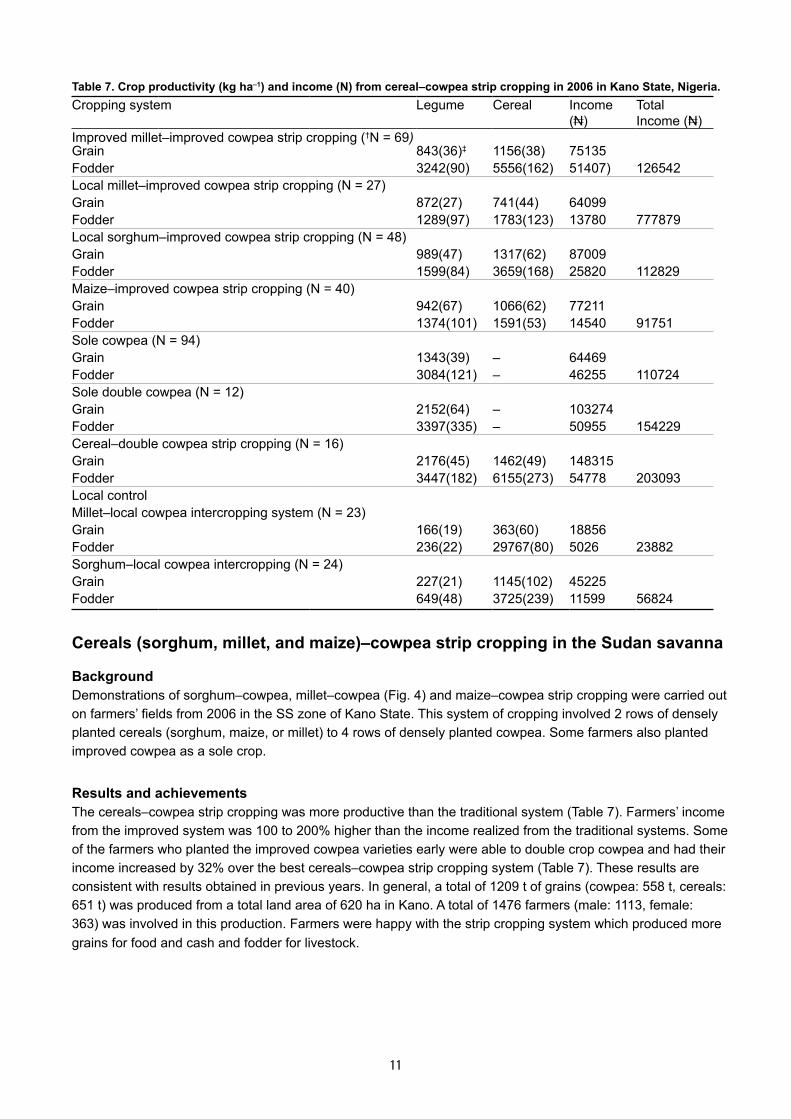
Results and achievementsThe cereals–cowpea strip cropping was more productive than the traditional system (Table 7). Farmers’ income from the improved system was 100 to 200% higher than the income realized from the traditional systems. Some of the farmers who planted the improved cowpea varieties early were able to double crop cowpea and had their income increased by 32% over the best cereals–cowpea strip cropping system (Table 7). These results are consistent with results obtained in previous years. In general, a total of 1209 t of grains (cowpea: 558 t, cereals: 651 t) was produced from a total land area of 620 ha in Kano. A total of 1476 farmers (male: 1113, female: 363) was involved in this production. Farmers were happy with the strip cropping system which produced more grains for food and cash and fodder for livestock.
Table 7. Crop productivity (kg ha–1) and income (N) from cereal–cowpea strip cropping in 2006 in Kano State, Nigeria.Cropping system Legume Cereal Income
(N)TotalIncome (N)
Improved millet–improved cowpea strip cropping (†N = 69)Grain 843(36)‡ 1156(38) 75135Fodder 3242(90) 5556(162) 51407) 126542Local millet–improved cowpea strip cropping (N = 27)Grain 872(27) 741(44) 64099Fodder 1289(97) 1783(123) 13780 777879Local sorghum–improved cowpea strip cropping (N = 48)Grain 989(47) 1317(62) 87009Fodder 1599(84) 3659(168) 25820 112829Maize–improved cowpea strip cropping (N = 40)Grain 942(67) 1066(62) 77211Fodder 1374(101) 1591(53) 14540 91751Sole cowpea (N = 94)Grain 1343(39) – 64469Fodder 3084(121) – 46255 110724Sole double cowpea (N = 12)Grain 2152(64) – 103274Fodder 3397(335) – 50955 154229Cereal–double cowpea strip cropping (N = 16)Grain 2176(45) 1462(49) 148315Fodder 3447(182) 6155(273) 54778 203093Local controlMillet–local cowpea intercropping system (N = 23)Grain 166(19) 363(60) 18856Fodder 236(22) 29767(80) 5026 23882Sorghum–local cowpea intercropping (N = 24)Grain 227(21) 1145(102) 45225Fodder 649(48) 3725(239) 11599 56824
12 13
Cereals (sorghum and millet)–cowpea strip cropping in the Sahel
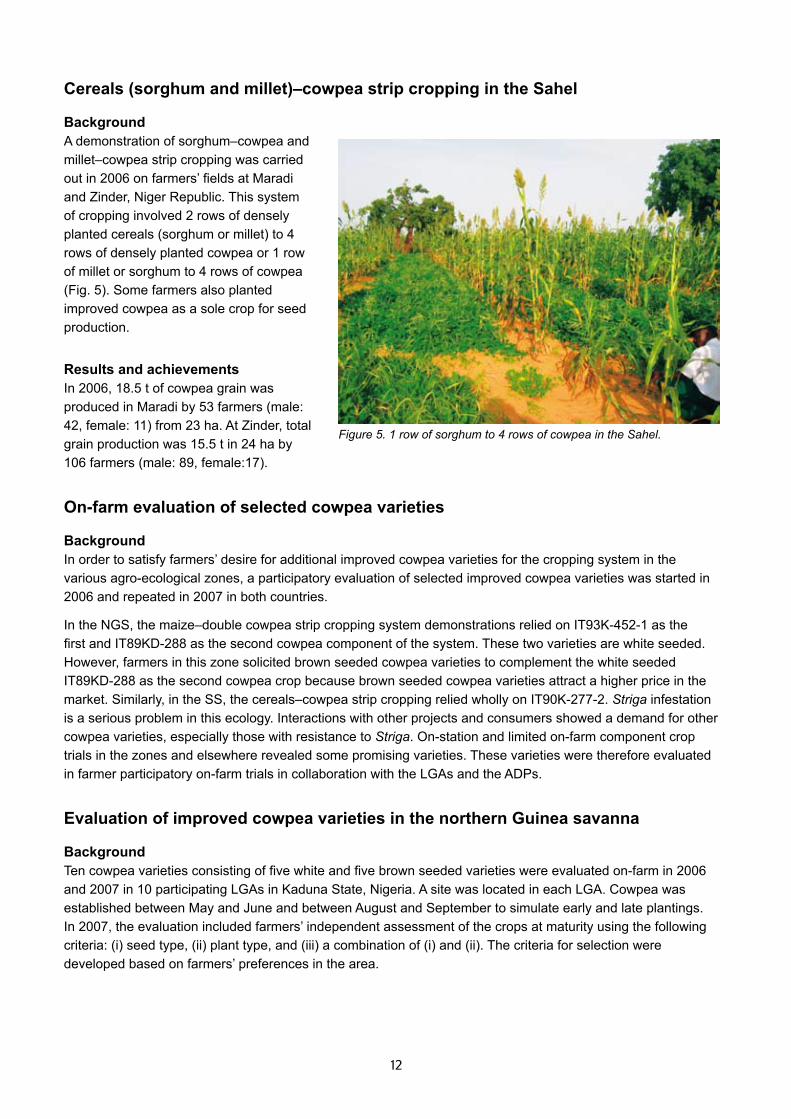
BackgroundA demonstration of sorghum–cowpea and millet–cowpea strip cropping was carried out in 2006 on farmers’ fields at Maradi and Zinder, Niger Republic. This system of cropping involved 2 rows of densely planted cereals (sorghum or millet) to 4 rows of densely planted cowpea or 1 row of millet or sorghum to 4 rows of cowpea (Fig. 5). Some farmers also planted improved cowpea as a sole crop for seed production.
Results and achievementsIn 2006, 18.5 t of cowpea grain was produced in Maradi by 53 farmers (male: 42, female: 11) from 23 ha. At Zinder, total grain production was 15.5 t in 24 ha by 106 farmers (male: 89, female:17).
On-farm evaluation of selected cowpea varieties
BackgroundIn order to satisfy farmers’ desire for additional improved cowpea varieties for the cropping system in the various agro-ecological zones, a participatory evaluation of selected improved cowpea varieties was started in 2006 and repeated in 2007 in both countries.
In the NGS, the maize–double cowpea strip cropping system demonstrations relied on IT93K-452-1 as the first and IT89KD-288 as the second cowpea component of the system. These two varieties are white seeded. However, farmers in this zone solicited brown seeded cowpea varieties to complement the white seeded IT89KD-288 as the second cowpea crop because brown seeded cowpea varieties attract a higher price in the market. Similarly, in the SS, the cereals–cowpea strip cropping relied wholly on IT90K-277-2. Striga infestation is a serious problem in this ecology. Interactions with other projects and consumers showed a demand for other cowpea varieties, especially those with resistance to Striga. On-station and limited on-farm component crop trials in the zones and elsewhere revealed some promising varieties. These varieties were therefore evaluated in farmer participatory on-farm trials in collaboration with the LGAs and the ADPs.
Evaluation of improved cowpea varieties in the northern Guinea savanna
BackgroundTen cowpea varieties consisting of five white and five brown seeded varieties were evaluated on-farm in 2006 and 2007 in 10 participating LGAs in Kaduna State, Nigeria. A site was located in each LGA. Cowpea was established between May and June and between August and September to simulate early and late plantings. In 2007, the evaluation included farmers’ independent assessment of the crops at maturity using the following criteria: (i) seed type, (ii) plant type, and (iii) a combination of (i) and (ii). The criteria for selection were developed based on farmers’ preferences in the area.
Figure 5. 1 row of sorghum to 4 rows of cowpea in the Sahel.
12 13
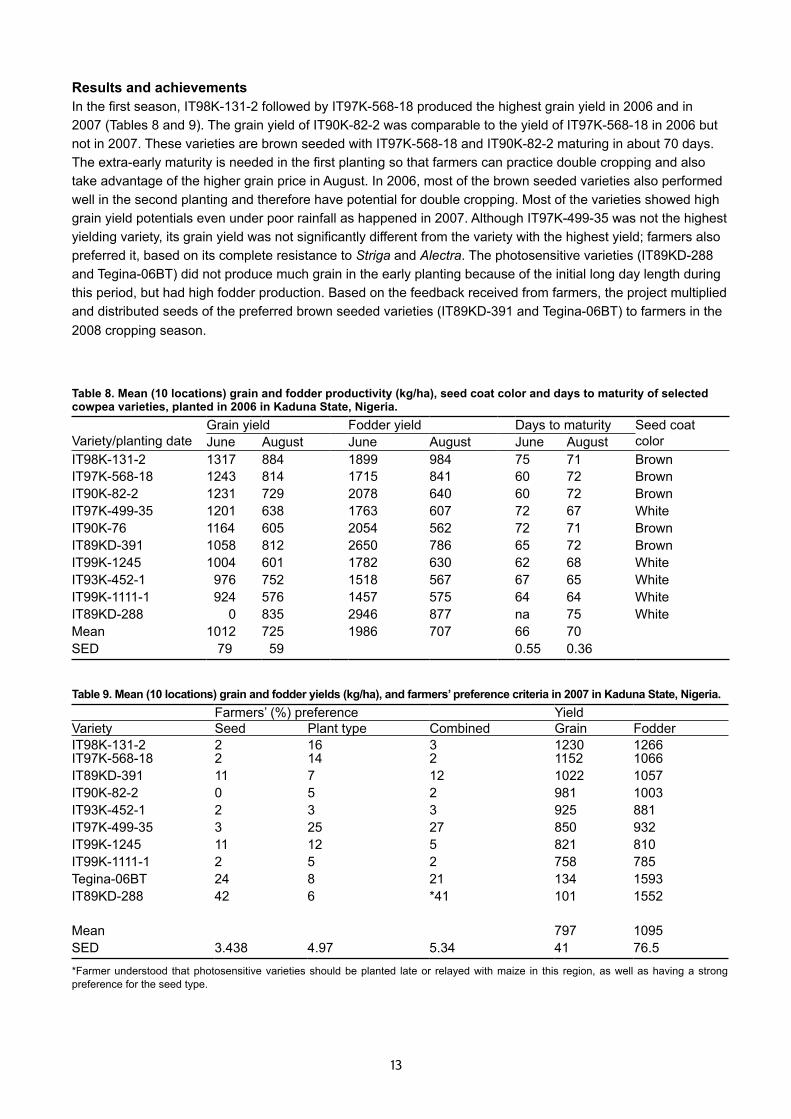
Results and achievementsIn the first season, IT98K-131-2 followed by IT97K-568-18 produced the highest grain yield in 2006 and in 2007 (Tables 8 and 9). The grain yield of IT90K-82-2 was comparable to the yield of IT97K-568-18 in 2006 but not in 2007. These varieties are brown seeded with IT97K-568-18 and IT90K-82-2 maturing in about 70 days. The extra-early maturity is needed in the first planting so that farmers can practice double cropping and also take advantage of the higher grain price in August. In 2006, most of the brown seeded varieties also performed well in the second planting and therefore have potential for double cropping. Most of the varieties showed high grain yield potentials even under poor rainfall as happened in 2007. Although IT97K-499-35 was not the highest yielding variety, its grain yield was not significantly different from the variety with the highest yield; farmers also preferred it, based on its complete resistance to Striga and Alectra. The photosensitive varieties (IT89KD-288 and Tegina-06BT) did not produce much grain in the early planting because of the initial long day length during this period, but had high fodder production. Based on the feedback received from farmers, the project multiplied and distributed seeds of the preferred brown seeded varieties (IT89KD-391 and Tegina-06BT) to farmers in the 2008 cropping season.
Table 8. Mean (10 locations) grain and fodder productivity (kg/ha), seed coat color and days to maturity of selected cowpea varieties, planted in 2006 in Kaduna State, Nigeria. Variety/planting date
Grain yield Fodder yield Days to maturity Seed coat colorJune August June August June August
IT98K-131-2 1317 884 1899 984 75 71 BrownIT97K-568-18 1243 814 1715 841 60 72 BrownIT90K-82-2 1231 729 2078 640 60 72 BrownIT97K-499-35 1201 638 1763 607 72 67 WhiteIT90K-76 1164 605 2054 562 72 71 BrownIT89KD-391 1058 812 2650 786 65 72 BrownIT99K-1245 1004 601 1782 630 62 68 WhiteIT93K-452-1 976 752 1518 567 67 65 WhiteIT99K-1111-1 924 576 1457 575 64 64 WhiteIT89KD-288 0 835 2946 877 na 75 WhiteMean 1012 725 1986 707 66 70 SED 79 59 0.55 0.36
Table 9. Mean (10 locations) grain and fodder yields (kg/ha), and farmers’ preference criteria in 2007 in Kaduna State, Nigeria. Farmers’ (%) preference Yield
Variety Seed Plant type Combined Grain FodderIT98K-131-2 2 16 3 1230 1266IT97K-568-18 2 14 2 1152 1066IT89KD-391 11 7 12 1022 1057IT90K-82-2 0 5 2 981 1003IT93K-452-1 2 3 3 925 881IT97K-499-35 3 25 27 850 932IT99K-1245 11 12 5 821 810IT99K-1111-1 2 5 2 758 785Tegina-06BT 24 8 21 134 1593IT89KD-288 42 6 *41 101 1552
Mean 797 1095SED 3.438 4.97 5.34 41 76.5
*Farmer understood that photosensitive varieties should be planted late or relayed with maize in this region, as well as having a strong preference for the seed type.
14 15
On-farm cowpea varietal evaluation in the Sudan savanna
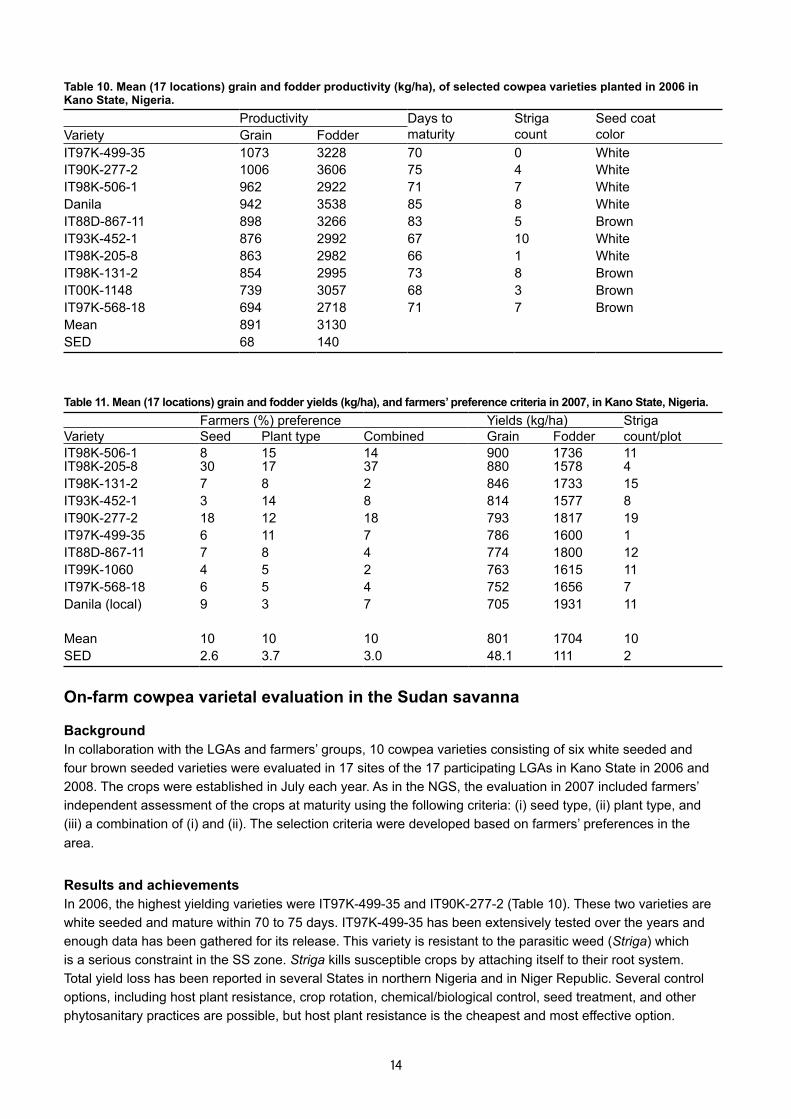
BackgroundIn collaboration with the LGAs and farmers’ groups, 10 cowpea varieties consisting of six white seeded and four brown seeded varieties were evaluated in 17 sites of the 17 participating LGAs in Kano State in 2006 and 2008. The crops were established in July each year. As in the NGS, the evaluation in 2007 included farmers’ independent assessment of the crops at maturity using the following criteria: (i) seed type, (ii) plant type, and (iii) a combination of (i) and (ii). The selection criteria were developed based on farmers’ preferences in the area.
Results and achievementsIn 2006, the highest yielding varieties were IT97K-499-35 and IT90K-277-2 (Table 10). These two varieties are white seeded and mature within 70 to 75 days. IT97K-499-35 has been extensively tested over the years and enough data has been gathered for its release. This variety is resistant to the parasitic weed (Striga) which is a serious constraint in the SS zone. Striga kills susceptible crops by attaching itself to their root system. Total yield loss has been reported in several States in northern Nigeria and in Niger Republic. Several control options, including host plant resistance, crop rotation, chemical/biological control, seed treatment, and other phytosanitary practices are possible, but host plant resistance is the cheapest and most effective option.
Table 10. Mean (17 locations) grain and fodder productivity (kg/ha), of selected cowpea varieties planted in 2006 in Kano State, Nigeria. Productivity Days to
maturityStrigacount
Seed coatcolorVariety Grain Fodder
IT97K-499-35 1073 3228 70 0 WhiteIT90K-277-2 1006 3606 75 4 WhiteIT98K-506-1 962 2922 71 7 WhiteDanila 942 3538 85 8 WhiteIT88D-867-11 898 3266 83 5 BrownIT93K-452-1 876 2992 67 10 WhiteIT98K-205-8 863 2982 66 1 WhiteIT98K-131-2 854 2995 73 8 BrownIT00K-1148 739 3057 68 3 BrownIT97K-568-18 694 2718 71 7 BrownMean 891 3130 SED 68 140
Table 11. Mean (17 locations) grain and fodder yields (kg/ha), and farmers’ preference criteria in 2007, in Kano State, Nigeria.Farmers (%) preference Yields (kg/ha) Striga
count/plotVariety Seed Plant type Combined Grain Fodder IT98K-506-1 8 15 14 900 1736 11IT98K-205-8 30 17 37 880 1578 4IT98K-131-2 7 8 2 846 1733 15IT93K-452-1 3 14 8 814 1577 8IT90K-277-2 18 12 18 793 1817 19IT97K-499-35 6 11 7 786 1600 1IT88D-867-11 7 8 4 774 1800 12IT99K-1060 4 5 2 763 1615 11IT97K-568-18 6 5 4 752 1656 7Danila (local) 9 3 7 705 1931 11
Mean 10 10 10 801 1704 10SED 2.6 3.7 3.0 48.1 111 2

14 15
Cowpea varieties with complete resistance to Striga stimulate germination and permit the attachment of Striga radicles to their roots but the haustorium’s development is inhibited. The genetics and mechanism have been extensively studied in IITA. IT97K-499-35 does well in fields with high Striga infestation.
In 2007, rainfall was poor in terms both of distribution and amount. This generally affected the productivity of major crops. Mean grain yield/location ranged from 705 to 900 kg ha–1 (Table 11). However, grain yields of some varieties were substantial across locations despite the poor rainfall. About 30% of the farmers preferred the seed type of IT98K-205-2 due to its bright white. color and medium size characteristics. The variety IT90K-277-2 was preferred by 18% of the farmers, based on seed type, and only 9% of the farmers chose the local variety (Danila) based on seed type. Based on plant type, 18% of the farmers chose IT98K-205-2; 15% chose IT98K-506-1 and IT93K-452-1; and 12% chose IT90K-277-2. When the seed and plant type attributes were combined, 37% of the farmers’ preferred IT98K-205-2; 18% chose IT90K-277-2; and 14% chose IT98K-506-1. Based on this result, IT98K-205-2 and IT98K-506-1 were given to selected farmers in 2008 for larger scale evaluation and demonstration under farmers’ management.
On-farm cowpea varietal evaluation in the Sahel savanna
BackgroundNine cowpea varieties that were identified as promising in previous trials on-station and on-farm in other agro-ecological zones were tested on farmers’ fields in eight locations in 2006, in Maradi and Zinder regions. Each participating farmer was given 0.5 kg of each of six varieties. Each variety was planted as a sole crop on a 0.1 ha land area. At maturity, the whole plot was harvested and grains were weighed.
Results and achievementsThe mean grain yield for each variety is presented in Table 12. Grain yields of these varieties differed among locations and in 2006 ranged from 222 to 1865 kg plot–1. In 2006, IT97K-499-38 followed by IT97K-819-118 and IT90K-372-1-2 produced the highest grain yields at Mayahi in Maradi. Similarly, IT89KD-374-57 followed by TN5-78 produced grain yields higher than those of other varieties at Zermou in Zinder. Averaged across locations, IT90K-372-1-2, followed by IT97K-499-38 and IT89KD-374-57 produced higher grain yields than
Table 12. Mean grain yield of tested cowpea varieties in farmers’ fields at Maradi and Zinder, Niger Republic.Maradi Zinder
Variety ‡Mad Tes May Ban Mag Ach Zer Dak Mean2006IT90K-372-1-2 907 866 1028 934IT97K-499-38 544 1865 432 1296 337 895IT89KD-374-57 632 222 905 1404 868 806IT97K-499-35 701 719 759 520 1022 1211 361 756TN5-78 755 185 778 1354 437 702TN256-87 721 584 274 895 619IT00K-1148 609 609IT88D-867-11 769 707 284 642 550 751 500 600IT97K-819-118 824 897 1083 211 681 348 449 222 589IT98K-205-8 687 364 587 938 187 533 553
2007 Mad Tes May Gui Ban Mag Mir Mat MeanIT89KD-374-57 960 400 650 850 400 550 450 600 608IT97K-499-38 420 500 800 450 800 600 430 428 554IT97K-499-35 403 450 705 425 750 650 415 512 539IT90K-372-1-2 1245 600 1020 700 650 524 600 230 696
‡MAD=Madarounfa, TES=Tessaoua, MAY=Mayahi, Ban=Bande, Mag=Magaria, Ach=Achi Lafia, Zer=Zermou, Dak=Dakora, Gui=Guidan roumdji, Mat=Matameye, Mir= Mirriah
16 17
the others. Through visits to farmers’ fields and interactions, three varieties (IT90K-372-1-2, IT97K-499-38, and IT89KD-374-57) were identified for wider dissemination, based on their grain and fodder yields. These three varieties in addition to IT97K-499-35 were revaluated in farmer-managed trials in 2007. Grain yields of these varieties in 2007 were comparable with the yields obtained in 2006. Subsequently, these varieties were multiplied and given to farmers. One of the varieties, IT97K-499-38 that is Striga resistant, was given to farmers in Striga endemic areas; IT90K-372-1-2 and IT89KD-374-57 were given to farmers in areas known to have relatively less Striga. All participating farmers kept seeds of their most promising variety. Each farmers’ group also kept substantial amounts of seeds for group usage. AQUADEV, one of the project’s partners, is actively extending project technologies outside project areas in the Zinder region of Niger Republic.
Dry season stall feeding of small ruminants
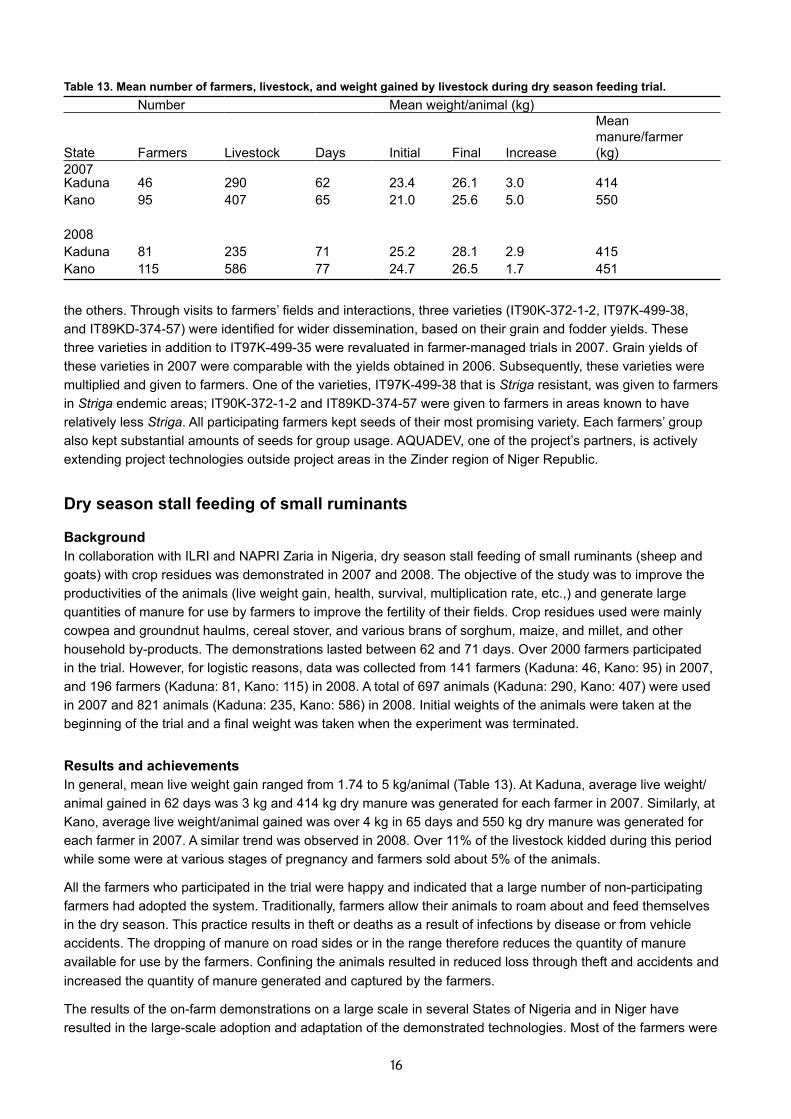
BackgroundIn collaboration with ILRI and NAPRI Zaria in Nigeria, dry season stall feeding of small ruminants (sheep and goats) with crop residues was demonstrated in 2007 and 2008. The objective of the study was to improve the productivities of the animals (live weight gain, health, survival, multiplication rate, etc.,) and generate large quantities of manure for use by farmers to improve the fertility of their fields. Crop residues used were mainly cowpea and groundnut haulms, cereal stover, and various brans of sorghum, maize, and millet, and other household by-products. The demonstrations lasted between 62 and 71 days. Over 2000 farmers participated in the trial. However, for logistic reasons, data was collected from 141 farmers (Kaduna: 46, Kano: 95) in 2007, and 196 farmers (Kaduna: 81, Kano: 115) in 2008. A total of 697 animals (Kaduna: 290, Kano: 407) were used in 2007 and 821 animals (Kaduna: 235, Kano: 586) in 2008. Initial weights of the animals were taken at the beginning of the trial and a final weight was taken when the experiment was terminated.
Results and achievementsIn general, mean live weight gain ranged from 1.74 to 5 kg/animal (Table 13). At Kaduna, average live weight/animal gained in 62 days was 3 kg and 414 kg dry manure was generated for each farmer in 2007. Similarly, at Kano, average live weight/animal gained was over 4 kg in 65 days and 550 kg dry manure was generated for each farmer in 2007. A similar trend was observed in 2008. Over 11% of the livestock kidded during this period while some were at various stages of pregnancy and farmers sold about 5% of the animals.
All the farmers who participated in the trial were happy and indicated that a large number of non-participating farmers had adopted the system. Traditionally, farmers allow their animals to roam about and feed themselves in the dry season. This practice results in theft or deaths as a result of infections by disease or from vehicle accidents. The dropping of manure on road sides or in the range therefore reduces the quantity of manure available for use by the farmers. Confining the animals resulted in reduced loss through theft and accidents and increased the quantity of manure generated and captured by the farmers.
The results of the on-farm demonstrations on a large scale in several States of Nigeria and in Niger have resulted in the large-scale adoption and adaptation of the demonstrated technologies. Most of the farmers were
Table 13. Mean number of farmers, livestock, and weight gained by livestock during dry season feeding trial.Number Mean weight/animal (kg)
State
Farmers Livestock Days Initial Final Increase
Mean manure/farmer (kg)
2007Kaduna 46 290 62 23.4 26.1 3.0 414Kano 95 407 65 21.0 25.6 5.0 550
2008Kaduna 81 235 71 25.2 28.1 2.9 415Kano 115 586 77 24.7 26.5 1.7 451
16 17
especially happy with strip cropping system which gives them more food as well as quality fodder along with needed cash. The increased grain production from this system ensures household food security as well as cash income, and the crop residues are fed to livestock kept on the compound. This permits the collection and use of manure for enhancing soil fertility. The two-thirds cowpea and one-third cereal combination minimizes fertilizer use and maximizes profit because of the higher prices of cowpea grain and fodder. At the same time it leaves a positive residual soil nitrogen balance and reduces the Striga hermonthica seed bank, both of which benefit the cereal crops. Data were generated for the release of three improved cowpea varieties (IT97K-499-35, IT89KD-288, and IT89KD-391) in Nigeria and several farmers are already producing the seeds for distribution to other farmers and seed companies. Improved livestock housing and stall feeding of small ruminants are now widely adopted in project areas and is expected to increase to non-project areas due to farmer-to-farmer diffusion.
On-station evaluation and trials
On-station evaluation of selected cowpea varietiesThe project in collaboration with partners initiated several on-station trials designed to validate and demonstrate new technologies that can be recommended for adoption among farmers in project zones and beyond. Farmers were taken to the trial sites at strategic times and made aware of the components of technologies for future evaluation in farmers’ fields.
BackgroundIn order to increase the number of cowpea varieties available to farmers, several promising cowpea varieties acquired from IITA breeders were evaluated on-station at Minjibir and Samaru in Nigeria and at Maradi, Magaria, and Mirriah in Niger Republic. The evaluations started in 2006 with 12 varieties in Niger Republic (Annex 4) and were repeated in 2007 and 2008 with 30 varieties in Nigeria (Annex 5) and Niger Republic (Annex 6). The evaluation in Niger Republic was conducted in collaboration with INRAN. Field visits were organized with farmers’ groups for participatory evaluation of the varieties. The cowpea evaluation plots also served as training and demonstration plots for extension agents and farmers.
Results and achievements In both countries, the extra-early maturing varieties had lower grain and fodder yields than the medium maturing varieties. In general, four varieties (IT98K-205-8, IT97K-819-118, IT97K-499-35, and IT97K-499-38) were resistant to Striga infestation, providing a basket of options for on-farm testing (Annex 4). Selected varieties from these trials were multiplied for on-farm evaluation. Five varieties (IT04K-321-2, IT04K-227-2, IT98K-131-2, IT97K-499-35, IT89KD-391, and IT98K-506-1) produced mean grain yields greater than 1.5 t/ha across the two agro- ecological zones and high fodder yields that ranged from 1.2 to 2.7 t/ha in 2008 (Annex 5). The low yields recorded by several varieties in Samaru were due to high disease infestation (Septoria leaf spot and Scab) as well as to the parasitic weed Alectra.
Screening new insecticide formulations and their combinations for cowpea production
Background Insect pests cause maximum damage to cowpea from seedling to storage. Insecticide sprays offer the most effective measure to control insect pests where resistant varieties are not available as is the case with the legume pod borer and pod sucking bug complex. Many of the farmers in the project area spray insecticide on the cowpea crop for a higher grain yield. However, farmers are not guided in their choice of the insecticide and the appropriate rates to use. Also the use of insecticides must be minimized due to their high cost and harmful effects on humans and the environment. A study was initiated in 2006 to assess the efficacy of some common insecticides in the markets in order to make appropriate recommendations to farmers for cowpea production. The study was conducted in Minjibir in the NGS and Samaru in the SS. The treatments included
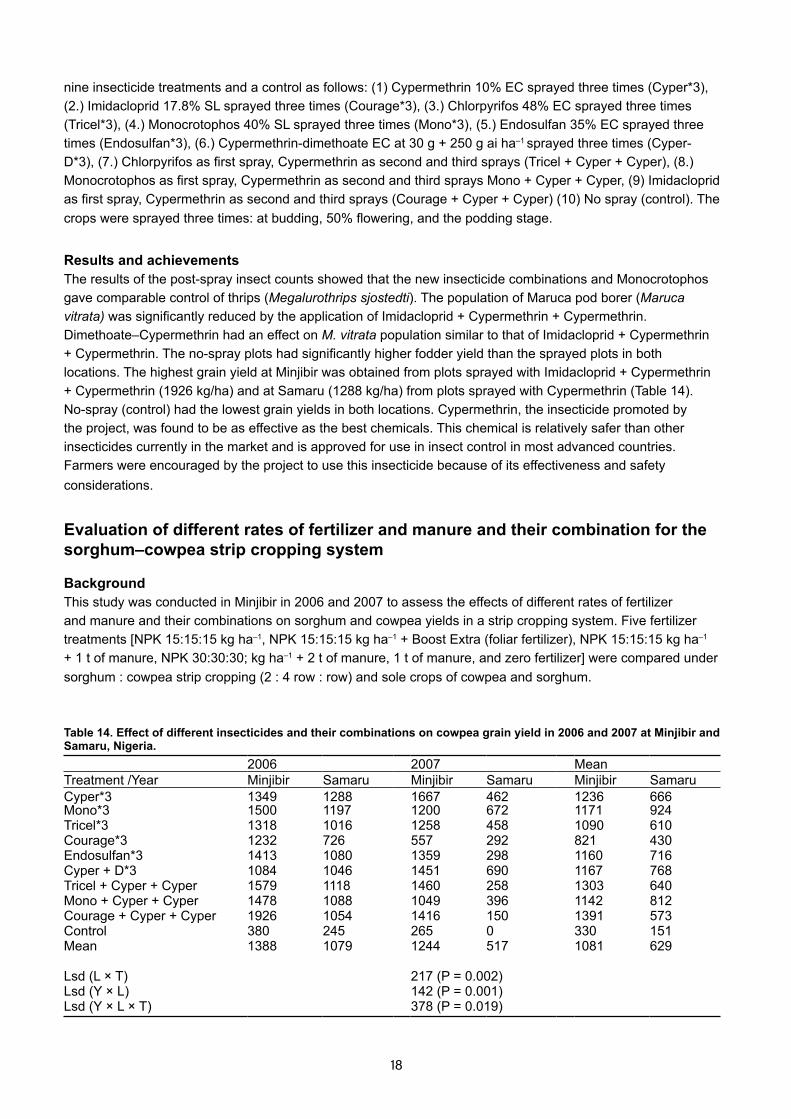
18 19
nine insecticide treatments and a control as follows: (1) Cypermethrin 10% EC sprayed three times (Cyper*3), (2.) Imidacloprid 17.8% SL sprayed three times (Courage*3), (3.) Chlorpyrifos 48% EC sprayed three times (Tricel*3), (4.) Monocrotophos 40% SL sprayed three times (Mono*3), (5.) Endosulfan 35% EC sprayed three times (Endosulfan*3), (6.) Cypermethrin-dimethoate EC at 30 g + 250 g ai ha–1 sprayed three times (Cyper-D*3), (7.) Chlorpyrifos as first spray, Cypermethrin as second and third sprays (Tricel + Cyper + Cyper), (8.) Monocrotophos as first spray, Cypermethrin as second and third sprays Mono + Cyper + Cyper, (9) Imidacloprid as first spray, Cypermethrin as second and third sprays (Courage + Cyper + Cyper) (10) No spray (control). The crops were sprayed three times: at budding, 50% flowering, and the podding stage.
Results and achievements The results of the post-spray insect counts showed that the new insecticide combinations and Monocrotophos gave comparable control of thrips (Megalurothrips sjostedti). The population of Maruca pod borer (Maruca vitrata) was significantly reduced by the application of Imidacloprid + Cypermethrin + Cypermethrin. Dimethoate–Cypermethrin had an effect on M. vitrata population similar to that of Imidacloprid + Cypermethrin + Cypermethrin. The no-spray plots had significantly higher fodder yield than the sprayed plots in both locations. The highest grain yield at Minjibir was obtained from plots sprayed with Imidacloprid + Cypermethrin + Cypermethrin (1926 kg/ha) and at Samaru (1288 kg/ha) from plots sprayed with Cypermethrin (Table 14). No-spray (control) had the lowest grain yields in both locations. Cypermethrin, the insecticide promoted by the project, was found to be as effective as the best chemicals. This chemical is relatively safer than other insecticides currently in the market and is approved for use in insect control in most advanced countries. Farmers were encouraged by the project to use this insecticide because of its effectiveness and safety considerations.
Evaluation of different rates of fertilizer and manure and their combination for the sorghum–cowpea strip cropping system
BackgroundThis study was conducted in Minjibir in 2006 and 2007 to assess the effects of different rates of fertilizer and manure and their combinations on sorghum and cowpea yields in a strip cropping system. Five fertilizer treatments [NPK 15:15:15 kg ha–1, NPK 15:15:15 kg ha–1 + Boost Extra (foliar fertilizer), NPK 15:15:15 kg ha–1 + 1 t of manure, NPK 30:30:30; kg ha–1 + 2 t of manure, 1 t of manure, and zero fertilizer] were compared under sorghum : cowpea strip cropping (2 : 4 row : row) and sole crops of cowpea and sorghum.
Table 14. Effect of different insecticides and their combinations on cowpea grain yield in 2006 and 2007 at Minjibir and Samaru, Nigeria.
2006 2007 MeanTreatment /Year Minjibir Samaru Minjibir Samaru Minjibir SamaruCyper*3 1349 1288 1667 462 1236 666Mono*3 1500 1197 1200 672 1171 924Tricel*3 1318 1016 1258 458 1090 610Courage*3 1232 726 557 292 821 430Endosulfan*3 1413 1080 1359 298 1160 716Cyper + D*3 1084 1046 1451 690 1167 768Tricel + Cyper + Cyper 1579 1118 1460 258 1303 640Mono + Cyper + Cyper 1478 1088 1049 396 1142 812Courage + Cyper + Cyper 1926 1054 1416 150 1391 573Control 380 245 265 0 330 151Mean 1388 1079 1244 517 1081 629
Lsd (L × T) 217 (P = 0.002)Lsd (Y × L) 142 (P = 0.001)Lsd (Y × L × T) 378 (P = 0.019)
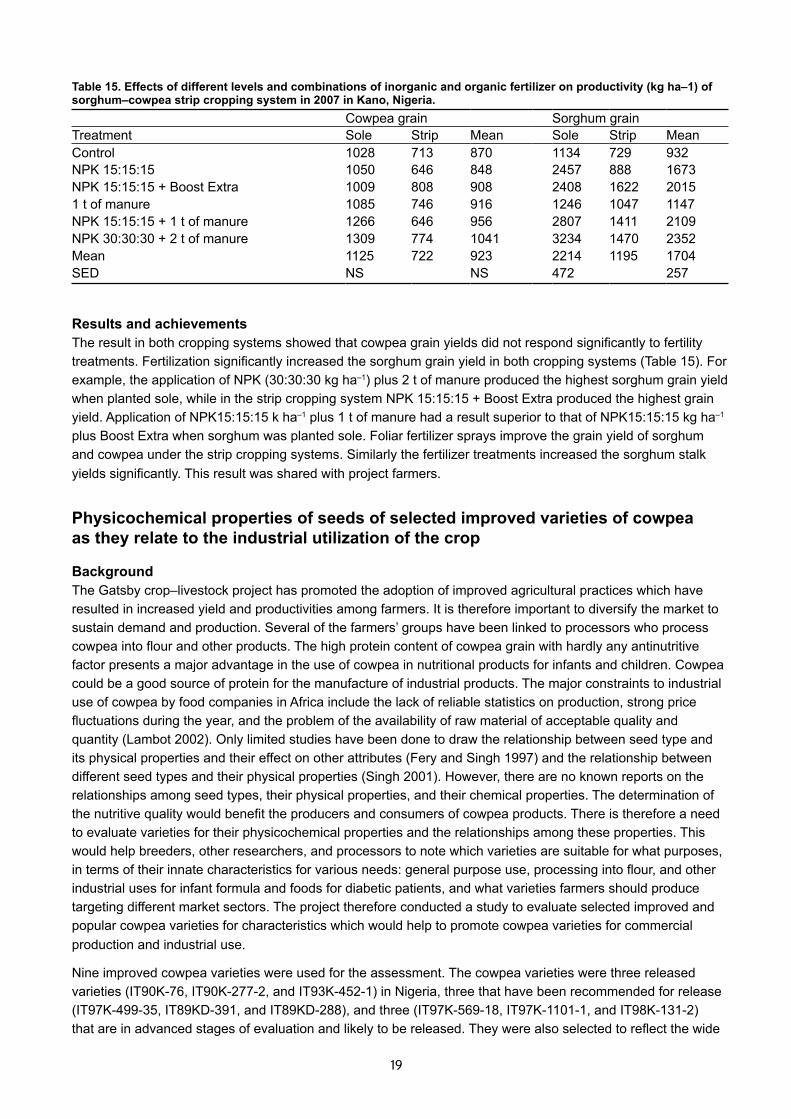
18 19
Results and achievements The result in both cropping systems showed that cowpea grain yields did not respond significantly to fertility treatments. Fertilization significantly increased the sorghum grain yield in both cropping systems (Table 15). For example, the application of NPK (30:30:30 kg ha–1) plus 2 t of manure produced the highest sorghum grain yield when planted sole, while in the strip cropping system NPK 15:15:15 + Boost Extra produced the highest grain yield. Application of NPK15:15:15 k ha–1 plus 1 t of manure had a result superior to that of NPK15:15:15 kg ha–1 plus Boost Extra when sorghum was planted sole. Foliar fertilizer sprays improve the grain yield of sorghum and cowpea under the strip cropping systems. Similarly the fertilizer treatments increased the sorghum stalk yields significantly. This result was shared with project farmers.
Physicochemical properties of seeds of selected improved varieties of cowpea as they relate to the industrial utilization of the crop
BackgroundThe Gatsby crop–livestock project has promoted the adoption of improved agricultural practices which have resulted in increased yield and productivities among farmers. It is therefore important to diversify the market to sustain demand and production. Several of the farmers’ groups have been linked to processors who process cowpea into flour and other products. The high protein content of cowpea grain with hardly any antinutritive factor presents a major advantage in the use of cowpea in nutritional products for infants and children. Cowpea could be a good source of protein for the manufacture of industrial products. The major constraints to industrial use of cowpea by food companies in Africa include the lack of reliable statistics on production, strong price fluctuations during the year, and the problem of the availability of raw material of acceptable quality and quantity (Lambot 2002). Only limited studies have been done to draw the relationship between seed type and its physical properties and their effect on other attributes (Fery and Singh 1997) and the relationship between different seed types and their physical properties (Singh 2001). However, there are no known reports on the relationships among seed types, their physical properties, and their chemical properties. The determination of the nutritive quality would benefit the producers and consumers of cowpea products. There is therefore a need to evaluate varieties for their physicochemical properties and the relationships among these properties. This would help breeders, other researchers, and processors to note which varieties are suitable for what purposes, in terms of their innate characteristics for various needs: general purpose use, processing into flour, and other industrial uses for infant formula and foods for diabetic patients, and what varieties farmers should produce targeting different market sectors. The project therefore conducted a study to evaluate selected improved and popular cowpea varieties for characteristics which would help to promote cowpea varieties for commercial production and industrial use.
Nine improved cowpea varieties were used for the assessment. The cowpea varieties were three released varieties (IT90K-76, IT90K-277-2, and IT93K-452-1) in Nigeria, three that have been recommended for release (IT97K-499-35, IT89KD-391, and IT89KD-288), and three (IT97K-569-18, IT97K-1101-1, and IT98K-131-2) that are in advanced stages of evaluation and likely to be released. They were also selected to reflect the wide
Table 15. Effects of different levels and combinations of inorganic and organic fertilizer on productivity (kg ha–1) of sorghum–cowpea strip cropping system in 2007 in Kano, Nigeria.
Cowpea grain Sorghum grainTreatment Sole Strip Mean Sole Strip MeanControl 1028 713 870 1134 729 932NPK 15:15:15 1050 646 848 2457 888 1673NPK 15:15:15 + Boost Extra 1009 808 908 2408 1622 20151 t of manure 1085 746 916 1246 1047 1147NPK 15:15:15 + 1 t of manure 1266 646 956 2807 1411 2109NPK 30:30:30 + 2 t of manure 1309 774 1041 3234 1470 2352Mean 1125 722 923 2214 1195 1704SED NS NS 472 257

20 21
range of seed types accepted in the country. The following physical and chemical properties were estimated for each of the nine varieties: seed size, dry seed density, wet seed volume, swelling ratio, water absorbed, seed hardness, moisture content, crude protein, ash, carbohydrate and crude fiber, hydration capacities, viscosity, and pasting properties of the flour.
Results and achievementsThe results of the chemical analysis of the various cowpea varieties are given in Table 16. Variations in content were found among varieties for protein (21.3–26.9%), carbohydrate (63.37 –69.56%), fat (1.2–1.80%), crude fiber (0.–1.03 %), and tannin (0.87 mg g–1–1.51 mg/g), also in water binding capacity (91.77–10835%), and gelatinization temperature (79.13–84.83 oC). High positive correlations (0.86) were observed between the content of fat and crude fiber, ash and protein (0.78), carbohydrate and viscosity of cowpea flour (0.76), and between ash and tannin content (0.61) of cowpea seeds. Negative correlations were observed between the contents of crude protein and carbohydrate (–0.98), ash and fat (–0.78), crude protein and viscosity (–0.76) of cowpea flour, fat and water binding capacity of cowpea flour (–0.72), and carbohydrate and tannin (–0.54) in cowpea seeds. Seed coat color plays no significant role in the chemical contents of the seeds. The physicochemical properties evaluated generally had high broad sense heritability (56 to 99%). Cowpea varieties (IT97K-1101-5 and IT89KD-288) with high protein content could be selected for formulating infant feeds; varieties with lower contents of carbohydrate and fat and high crude fiber (IT90K-277-2) would be desirable in making meals for diabetic patients.
Conclusions The study showed that significant variations exist among cowpea lines for most of the physico-chemical constituents of cowpea grain with high heritability. Suitable parents could therefore be selected for further improvement of any of the characters. Varieties also exist that can be used for specialized industrial products such as infants’ formula, etc. Cowpea varieties (IT97K-1101-5 and IT89KD-288) with high protein content could be selected for formulating infants’ feeds, varieties with lower carbohydrate, low fat (IT97K-1101–5) and high crude fiber (IT90K-277-2) would be desirable in making meals for diabetic patients.
Table 16. Chemical properties of seeds of selected cowpea varieties.Variety %Protein %Ash %CHO %Fat % WBC Viscosity Gel temp % CF Tannin
IT97K-1101–5 26.85 4.59 63.37 1.2 108.35 154.09 79.88 0.61 1.45IT89KD-288 26.06 3.79 64.86 1.72 91.82 188.78 83.18 0.89 1.51IT97K-569–18 23.64 4 67.51 1.32 103.67 231.43 83.88 0.49 1.48IT98K-131-2 23.05 3.47 68.67 1.4 103.67 194.84 84.83 0.43 0.96IT89KD-391 22.57 3.93 68.31 1.57 95.61 208.66 82.33 0.64 1.28IT97K-499–35 22.49 3.43 68.83 1.73 96.11 214.82 82.48 0.89 1.11IT90K-277–2 21.84 3.37 69.42 1.8 99.47 201.29 82.33 1.03 1.12IT93K-452–1 21.36 3.45 68.98 1.73 91.77 215.16 79.13 0.84 0.87IT90K-76 21.29 3.53 69.56 1.66 105.46 250.18 82.43 0.91 1.49
Mean 23.24 3.727 67.72 1.57 99.55 206.582 82.2694 0.748 1.2512LSD (5%) 1.761 0.6838 1.962 0.2759 4.073 0.6262 0.08153 0.1037 0.07372Heritability 0.86 0.56 0.86 0.73 0.92 0.99 0.99 0.96 0.98
Ash = % ash; Moisture = % moisture; CP= % crude protein; Fat= % fat; CHO= % carbohydrate; CF = % crude fiber; Tannin = Tannin mg g–1; WBC = water binding capacity; Viscosity = final viscosity RVA; Gel. Temp = pasting time temperature oC
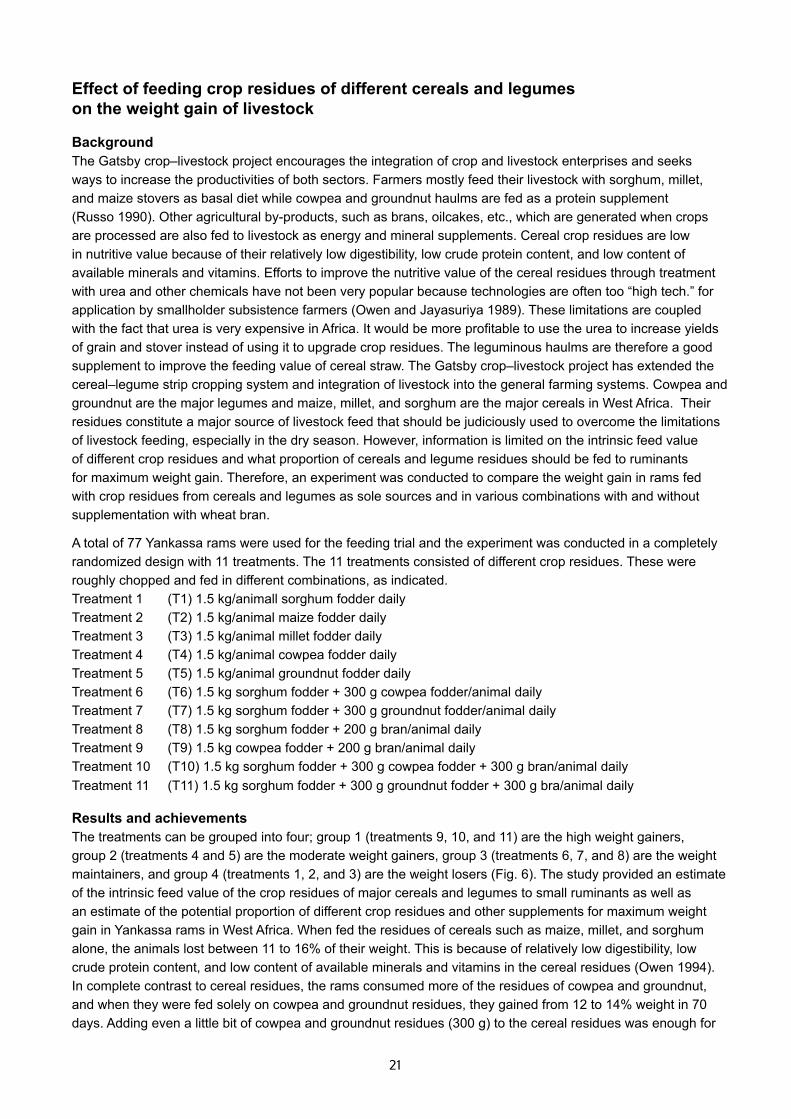
20 21
Effect of feeding crop residues of different cereals and legumes on the weight gain of livestock
BackgroundThe Gatsby crop–livestock project encourages the integration of crop and livestock enterprises and seeks ways to increase the productivities of both sectors. Farmers mostly feed their livestock with sorghum, millet, and maize stovers as basal diet while cowpea and groundnut haulms are fed as a protein supplement (Russo 1990). Other agricultural by-products, such as brans, oilcakes, etc., which are generated when crops are processed are also fed to livestock as energy and mineral supplements. Cereal crop residues are low in nutritive value because of their relatively low digestibility, low crude protein content, and low content of available minerals and vitamins. Efforts to improve the nutritive value of the cereal residues through treatment with urea and other chemicals have not been very popular because technologies are often too “high tech.” for application by smallholder subsistence farmers (Owen and Jayasuriya 1989). These limitations are coupled with the fact that urea is very expensive in Africa. It would be more profitable to use the urea to increase yields of grain and stover instead of using it to upgrade crop residues. The leguminous haulms are therefore a good supplement to improve the feeding value of cereal straw. The Gatsby crop–livestock project has extended the cereal–legume strip cropping system and integration of livestock into the general farming systems. Cowpea and groundnut are the major legumes and maize, millet, and sorghum are the major cereals in West Africa. Their residues constitute a major source of livestock feed that should be judiciously used to overcome the limitations of livestock feeding, especially in the dry season. However, information is limited on the intrinsic feed value of different crop residues and what proportion of cereals and legume residues should be fed to ruminants for maximum weight gain. Therefore, an experiment was conducted to compare the weight gain in rams fed with crop residues from cereals and legumes as sole sources and in various combinations with and without supplementation with wheat bran.
A total of 77 Yankassa rams were used for the feeding trial and the experiment was conducted in a completely randomized design with 11 treatments. The 11 treatments consisted of different crop residues. These were roughly chopped and fed in different combinations, as indicated. Treatment 1 (T1) 1.5 kg/animall sorghum fodder daily Treatment 2 (T2) 1.5 kg/animal maize fodder daily Treatment 3 (T3) 1.5 kg/animal millet fodder daily Treatment 4 (T4) 1.5 kg/animal cowpea fodder daily Treatment 5 (T5) 1.5 kg/animal groundnut fodder daily Treatment 6 (T6) 1.5 kg sorghum fodder + 300 g cowpea fodder/animal daily Treatment 7 (T7) 1.5 kg sorghum fodder + 300 g groundnut fodder/animal daily Treatment 8 (T8) 1.5 kg sorghum fodder + 200 g bran/animal daily Treatment 9 (T9) 1.5 kg cowpea fodder + 200 g bran/animal daily Treatment 10 (T10) 1.5 kg sorghum fodder + 300 g cowpea fodder + 300 g bran/animal daily Treatment 11 (T11) 1.5 kg sorghum fodder + 300 g groundnut fodder + 300 g bra/animal daily
Results and achievementsThe treatments can be grouped into four; group 1 (treatments 9, 10, and 11) are the high weight gainers, group 2 (treatments 4 and 5) are the moderate weight gainers, group 3 (treatments 6, 7, and 8) are the weight maintainers, and group 4 (treatments 1, 2, and 3) are the weight losers (Fig. 6). The study provided an estimate of the intrinsic feed value of the crop residues of major cereals and legumes to small ruminants as well as an estimate of the potential proportion of different crop residues and other supplements for maximum weight gain in Yankassa rams in West Africa. When fed the residues of cereals such as maize, millet, and sorghum alone, the animals lost between 11 to 16% of their weight. This is because of relatively low digestibility, low crude protein content, and low content of available minerals and vitamins in the cereal residues (Owen 1994). In complete contrast to cereal residues, the rams consumed more of the residues of cowpea and groundnut, and when they were fed solely on cowpea and groundnut residues, they gained from 12 to 14% weight in 70 days. Adding even a little bit of cowpea and groundnut residues (300 g) to the cereal residues was enough for
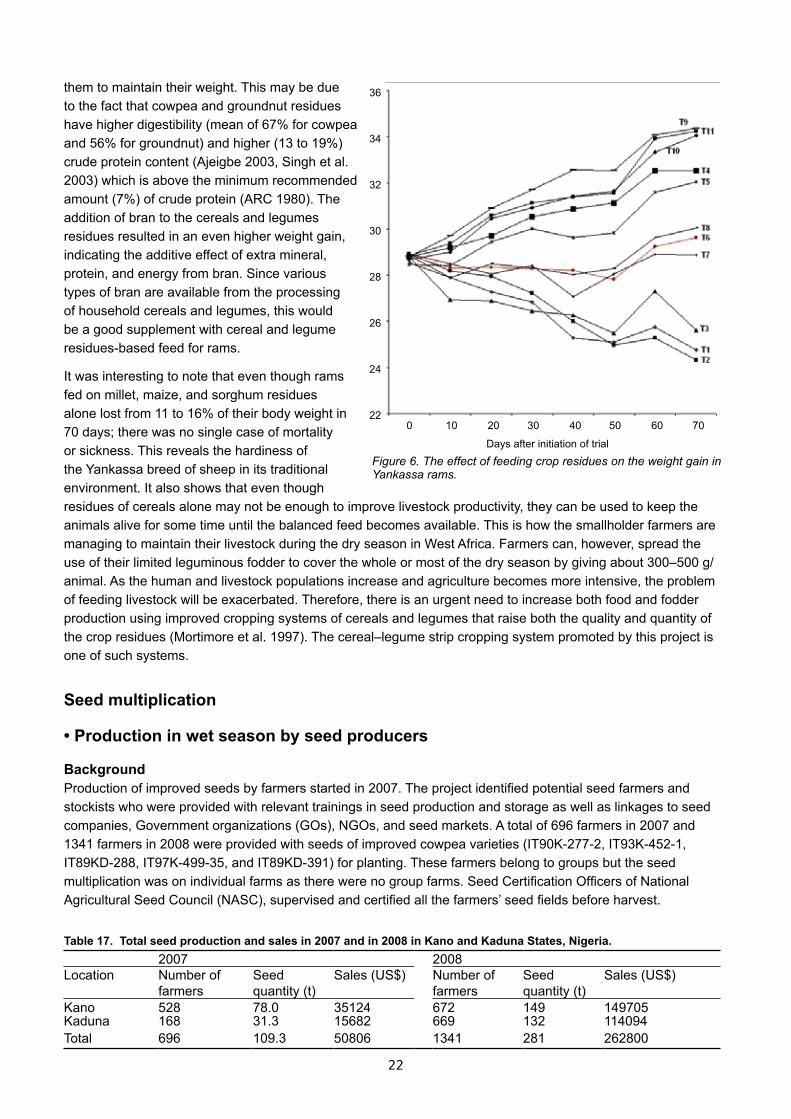
22 23
them to maintain their weight. This may be due to the fact that cowpea and groundnut residues have higher digestibility (mean of 67% for cowpea and 56% for groundnut) and higher (13 to 19%) crude protein content (Ajeigbe 2003, Singh et al. 2003) which is above the minimum recommended amount (7%) of crude protein (ARC 1980). The addition of bran to the cereals and legumes residues resulted in an even higher weight gain, indicating the additive effect of extra mineral, protein, and energy from bran. Since various types of bran are available from the processing of household cereals and legumes, this would be a good supplement with cereal and legume residues-based feed for rams.
It was interesting to note that even though rams fed on millet, maize, and sorghum residues alone lost from 11 to 16% of their body weight in 70 days; there was no single case of mortality or sickness. This reveals the hardiness of the Yankassa breed of sheep in its traditional environment. It also shows that even though residues of cereals alone may not be enough to improve livestock productivity, they can be used to keep the animals alive for some time until the balanced feed becomes available. This is how the smallholder farmers are managing to maintain their livestock during the dry season in West Africa. Farmers can, however, spread the use of their limited leguminous fodder to cover the whole or most of the dry season by giving about 300–500 g/animal. As the human and livestock populations increase and agriculture becomes more intensive, the problem of feeding livestock will be exacerbated. Therefore, there is an urgent need to increase both food and fodder production using improved cropping systems of cereals and legumes that raise both the quality and quantity of the crop residues (Mortimore et al. 1997). The cereal–legume strip cropping system promoted by this project is one of such systems.
Seed multiplication
• Production in wet season by seed producers
BackgroundProduction of improved seeds by farmers started in 2007. The project identified potential seed farmers and stockists who were provided with relevant trainings in seed production and storage as well as linkages to seed companies, Government organizations (GOs), NGOs, and seed markets. A total of 696 farmers in 2007 and 1341 farmers in 2008 were provided with seeds of improved cowpea varieties (IT90K-277-2, IT93K-452-1, IT89KD-288, IT97K-499-35, and IT89KD-391) for planting. These farmers belong to groups but the seed multiplication was on individual farms as there were no group farms. Seed Certification Officers of National Agricultural Seed Council (NASC), supervised and certified all the farmers’ seed fields before harvest.
Table 17. Total seed production and sales in 2007 and in 2008 in Kano and Kaduna States, Nigeria.2007 2008
Location Number of farmers
Seedquantity (t)
Sales (US$) Number of farmers
Seedquantity (t)
Sales (US$)
Kano 528 78.0 35124 672 149 149705Kaduna 168 31.3 15682 669 132 114094Total 696 109.3 50806 1341 281 262800
0 10 20 30 40 50 60 70
36
34
32
30
28
26
24
22
Days after initiation of trial
Figure 6. The effect of feeding crop residues on the weight gain in Yankassa rams.
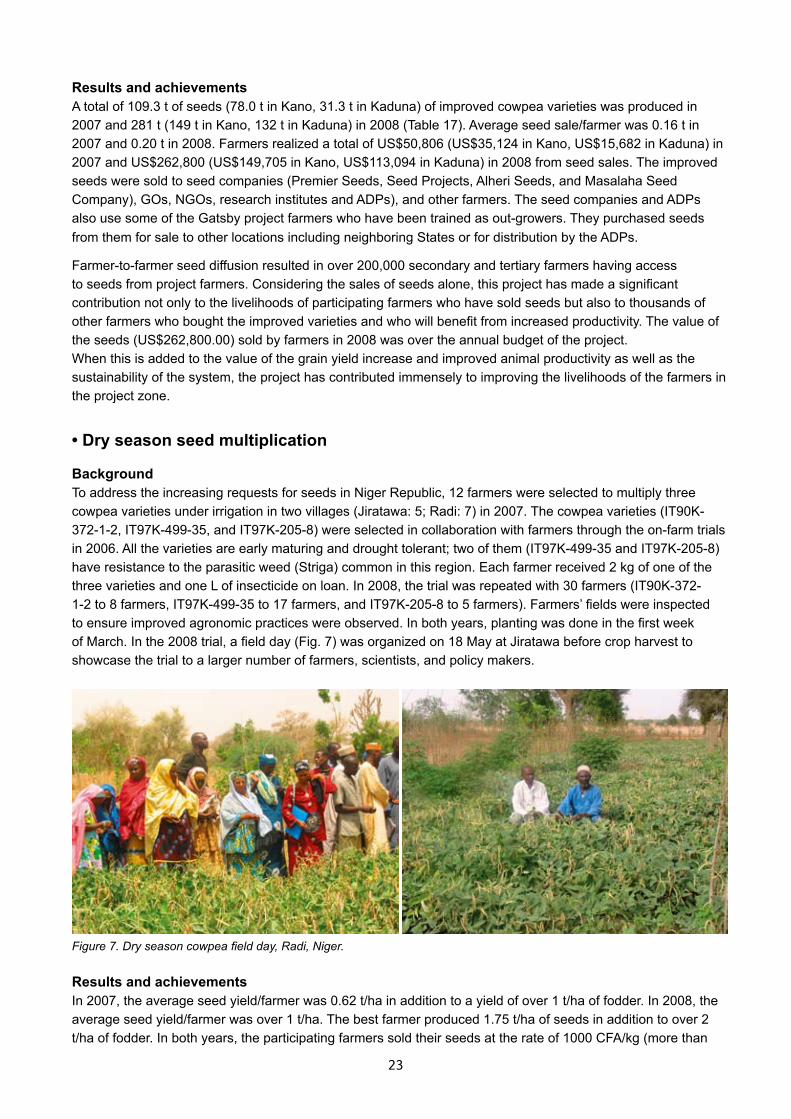
22 23
Results and achievementsA total of 109.3 t of seeds (78.0 t in Kano, 31.3 t in Kaduna) of improved cowpea varieties was produced in 2007 and 281 t (149 t in Kano, 132 t in Kaduna) in 2008 (Table 17). Average seed sale/farmer was 0.16 t in 2007 and 0.20 t in 2008. Farmers realized a total of US$50,806 (US$35,124 in Kano, US$15,682 in Kaduna) in 2007 and US$262,800 (US$149,705 in Kano, US$113,094 in Kaduna) in 2008 from seed sales. The improved seeds were sold to seed companies (Premier Seeds, Seed Projects, Alheri Seeds, and Masalaha Seed Company), GOs, NGOs, research institutes and ADPs), and other farmers. The seed companies and ADPs also use some of the Gatsby project farmers who have been trained as out-growers. They purchased seeds from them for sale to other locations including neighboring States or for distribution by the ADPs.
Farmer-to-farmer seed diffusion resulted in over 200,000 secondary and tertiary farmers having access to seeds from project farmers. Considering the sales of seeds alone, this project has made a significant contribution not only to the livelihoods of participating farmers who have sold seeds but also to thousands of other farmers who bought the improved varieties and who will benefit from increased productivity. The value of the seeds (US$262,800.00) sold by farmers in 2008 was over the annual budget of the project. When this is added to the value of the grain yield increase and improved animal productivity as well as the sustainability of the system, the project has contributed immensely to improving the livelihoods of the farmers in the project zone.
• Dry season seed multiplication
BackgroundTo address the increasing requests for seeds in Niger Republic, 12 farmers were selected to multiply three cowpea varieties under irrigation in two villages (Jiratawa: 5; Radi: 7) in 2007. The cowpea varieties (IT90K-372-1-2, IT97K-499-35, and IT97K-205-8) were selected in collaboration with farmers through the on-farm trials in 2006. All the varieties are early maturing and drought tolerant; two of them (IT97K-499-35 and IT97K-205-8) have resistance to the parasitic weed (Striga) common in this region. Each farmer received 2 kg of one of the three varieties and one L of insecticide on loan. In 2008, the trial was repeated with 30 farmers (IT90K-372-1-2 to 8 farmers, IT97K-499-35 to 17 farmers, and IT97K-205-8 to 5 farmers). Farmers’ fields were inspected to ensure improved agronomic practices were observed. In both years, planting was done in the first week of March. In the 2008 trial, a field day (Fig. 7) was organized on 18 May at Jiratawa before crop harvest to showcase the trial to a larger number of farmers, scientists, and policy makers.
Results and achievementsIn 2007, the average seed yield/farmer was 0.62 t/ha in addition to a yield of over 1 t/ha of fodder. In 2008, the average seed yield/farmer was over 1 t/ha. The best farmer produced 1.75 t/ha of seeds in addition to over 2 t/ha of fodder. In both years, the participating farmers sold their seeds at the rate of 1000 CFA/kg (more than
Figure 7. Dry season cowpea field day, Radi, Niger.
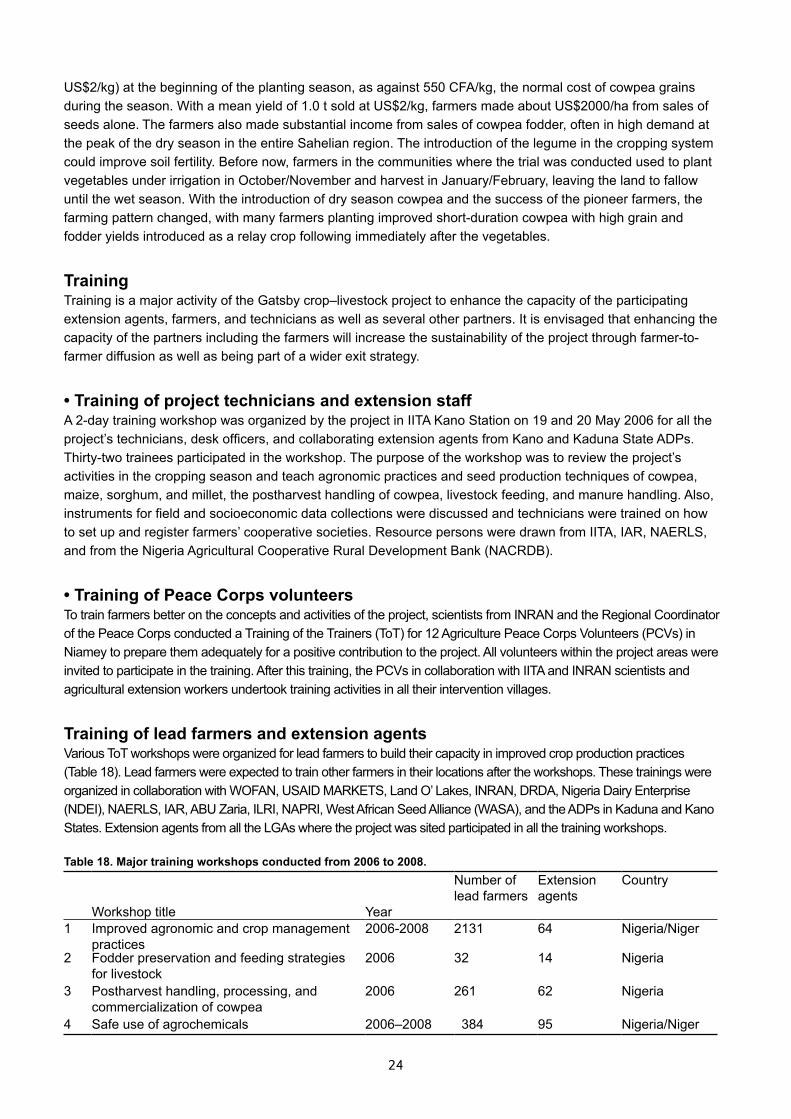
24 25
US$2/kg) at the beginning of the planting season, as against 550 CFA/kg, the normal cost of cowpea grains during the season. With a mean yield of 1.0 t sold at US$2/kg, farmers made about US$2000/ha from sales of seeds alone. The farmers also made substantial income from sales of cowpea fodder, often in high demand at the peak of the dry season in the entire Sahelian region. The introduction of the legume in the cropping system could improve soil fertility. Before now, farmers in the communities where the trial was conducted used to plant vegetables under irrigation in October/November and harvest in January/February, leaving the land to fallow until the wet season. With the introduction of dry season cowpea and the success of the pioneer farmers, the farming pattern changed, with many farmers planting improved short-duration cowpea with high grain and fodder yields introduced as a relay crop following immediately after the vegetables.
TrainingTraining is a major activity of the Gatsby crop–livestock project to enhance the capacity of the participating extension agents, farmers, and technicians as well as several other partners. It is envisaged that enhancing the capacity of the partners including the farmers will increase the sustainability of the project through farmer-to-farmer diffusion as well as being part of a wider exit strategy.
• Training of project technicians and extension staffA 2-day training workshop was organized by the project in IITA Kano Station on 19 and 20 May 2006 for all the project’s technicians, desk officers, and collaborating extension agents from Kano and Kaduna State ADPs. Thirty-two trainees participated in the workshop. The purpose of the workshop was to review the project’s activities in the cropping season and teach agronomic practices and seed production techniques of cowpea, maize, sorghum, and millet, the postharvest handling of cowpea, livestock feeding, and manure handling. Also, instruments for field and socioeconomic data collections were discussed and technicians were trained on how to set up and register farmers’ cooperative societies. Resource persons were drawn from IITA, IAR, NAERLS, and from the Nigeria Agricultural Cooperative Rural Development Bank (NACRDB).
• Training of Peace Corps volunteersTo train farmers better on the concepts and activities of the project, scientists from INRAN and the Regional Coordinator of the Peace Corps conducted a Training of the Trainers (ToT) for 12 Agriculture Peace Corps Volunteers (PCVs) in Niamey to prepare them adequately for a positive contribution to the project. All volunteers within the project areas were invited to participate in the training. After this training, the PCVs in collaboration with IITA and INRAN scientists and agricultural extension workers undertook training activities in all their intervention villages.
Training of lead farmers and extension agentsVarious ToT workshops were organized for lead farmers to build their capacity in improved crop production practices (Table 18). Lead farmers were expected to train other farmers in their locations after the workshops. These trainings were organized in collaboration with WOFAN, USAID MARKETS, Land O’ Lakes, INRAN, DRDA, Nigeria Dairy Enterprise (NDEI), NAERLS, IAR, ABU Zaria, ILRI, NAPRI, West African Seed Alliance (WASA), and the ADPs in Kaduna and Kano States. Extension agents from all the LGAs where the project was sited participated in all the training workshops.
Table 18. Major training workshops conducted from 2006 to 2008.
Workshop title Year
Number of lead farmers
Extension agents
Country
1 Improved agronomic and crop management practices
2006-2008 2131 64 Nigeria/Niger
2 Fodder preservation and feeding strategies for livestock
2006 32 14 Nigeria
3 Postharvest handling, processing, and commercialization of cowpea
2006 261 62 Nigeria
4 Safe use of agrochemicals 2006–2008 384 95 Nigeria/Niger
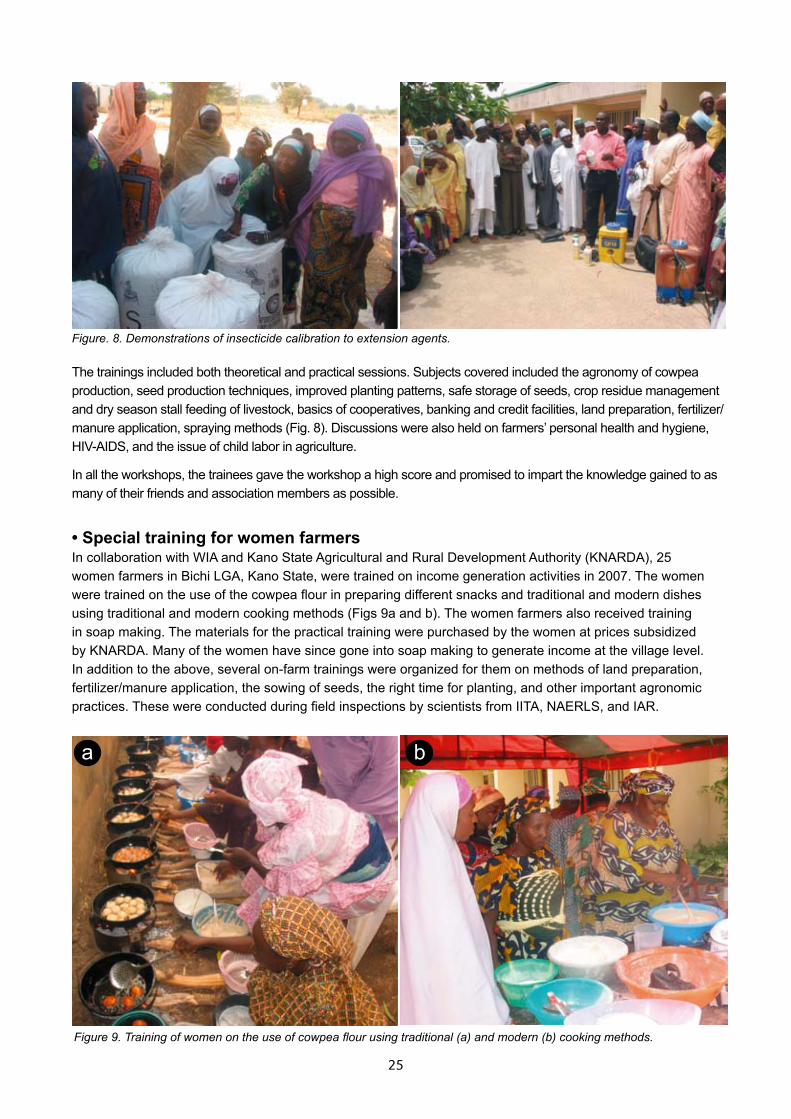
24 25
The trainings included both theoretical and practical sessions. Subjects covered included the agronomy of cowpea production, seed production techniques, improved planting patterns, safe storage of seeds, crop residue management and dry season stall feeding of livestock, basics of cooperatives, banking and credit facilities, land preparation, fertilizer/manure application, spraying methods (Fig. 8). Discussions were also held on farmers’ personal health and hygiene, HIV-AIDS, and the issue of child labor in agriculture.
In all the workshops, the trainees gave the workshop a high score and promised to impart the knowledge gained to as many of their friends and association members as possible.
• Special training for women farmersIn collaboration with WIA and Kano State Agricultural and Rural Development Authority (KNARDA), 25 women farmers in Bichi LGA, Kano State, were trained on income generation activities in 2007. The women were trained on the use of the cowpea flour in preparing different snacks and traditional and modern dishes using traditional and modern cooking methods (Figs 9a and b). The women farmers also received training in soap making. The materials for the practical training were purchased by the women at prices subsidized by KNARDA. Many of the women have since gone into soap making to generate income at the village level. In addition to the above, several on-farm trainings were organized for them on methods of land preparation, fertilizer/manure application, the sowing of seeds, the right time for planting, and other important agronomic practices. These were conducted during field inspections by scientists from IITA, NAERLS, and IAR.
Figure. 8. Demonstrations of insecticide calibration to extension agents.
Figure 9. Training of women on the use of cowpea flour using traditional (a) and modern (b) cooking methods.
a b
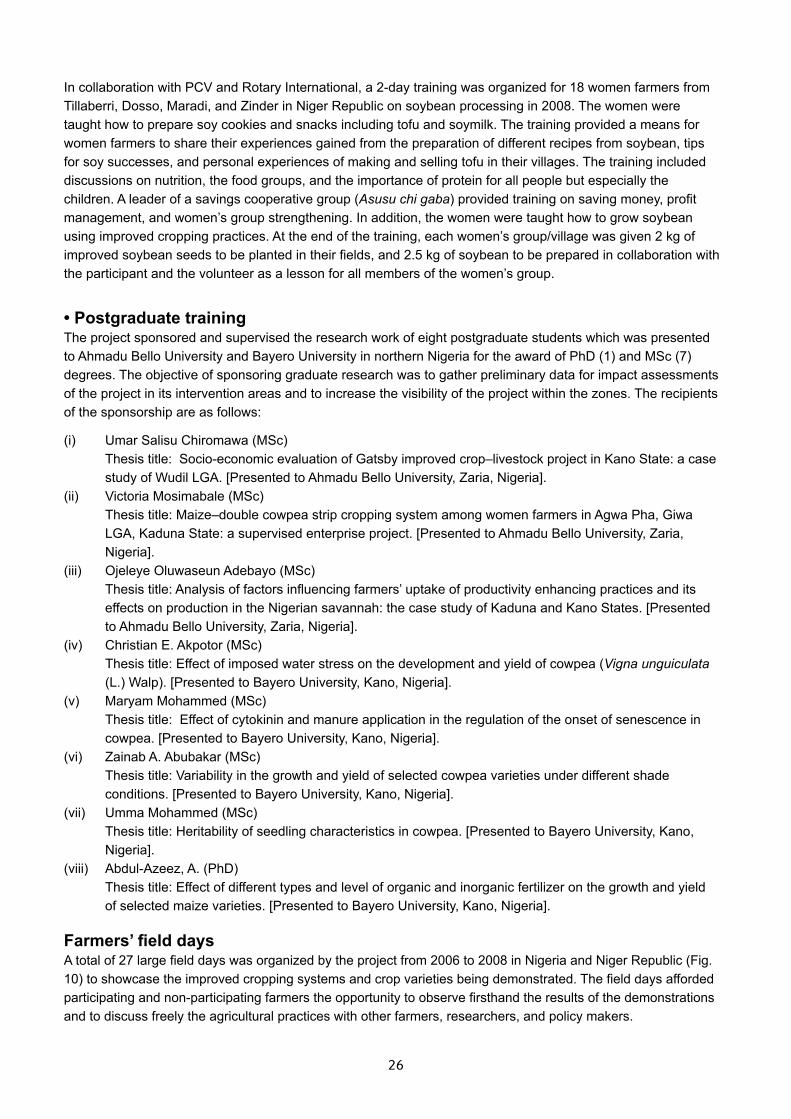
26 27
In collaboration with PCV and Rotary International, a 2-day training was organized for 18 women farmers from Tillaberri, Dosso, Maradi, and Zinder in Niger Republic on soybean processing in 2008. The women were taught how to prepare soy cookies and snacks including tofu and soymilk. The training provided a means for women farmers to share their experiences gained from the preparation of different recipes from soybean, tips for soy successes, and personal experiences of making and selling tofu in their villages. The training included discussions on nutrition, the food groups, and the importance of protein for all people but especially the children. A leader of a savings cooperative group (Asusu chi gaba) provided training on saving money, profit management, and women’s group strengthening. In addition, the women were taught how to grow soybean using improved cropping practices. At the end of the training, each women’s group/village was given 2 kg of improved soybean seeds to be planted in their fields, and 2.5 kg of soybean to be prepared in collaboration with the participant and the volunteer as a lesson for all members of the women’s group.
• Postgraduate trainingThe project sponsored and supervised the research work of eight postgraduate students which was presented to Ahmadu Bello University and Bayero University in northern Nigeria for the award of PhD (1) and MSc (7) degrees. The objective of sponsoring graduate research was to gather preliminary data for impact assessments of the project in its intervention areas and to increase the visibility of the project within the zones. The recipients of the sponsorship are as follows:
(i) Umar Salisu Chiromawa (MSc) Thesis title: Socio-economic evaluation of Gatsby improved crop–livestock project in Kano State: a case study of Wudil LGA. [Presented to Ahmadu Bello University, Zaria, Nigeria].(ii) Victoria Mosimabale (MSc) Thesis title: Maize–double cowpea strip cropping system among women farmers in Agwa Pha, Giwa LGA, Kaduna State: a supervised enterprise project. [Presented to Ahmadu Bello University, Zaria, Nigeria].(iii) Ojeleye Oluwaseun Adebayo (MSc) Thesis title: Analysis of factors influencing farmers’ uptake of productivity enhancing practices and its effects on production in the Nigerian savannah: the case study of Kaduna and Kano States. [Presented to Ahmadu Bello University, Zaria, Nigeria].(iv) Christian E. Akpotor (MSc) Thesis title: Effect of imposed water stress on the development and yield of cowpea (Vigna unguiculata (L.) Walp). [Presented to Bayero University, Kano, Nigeria].(v) Maryam Mohammed (MSc) Thesis title: Effect of cytokinin and manure application in the regulation of the onset of senescence in cowpea. [Presented to Bayero University, Kano, Nigeria].(vi) Zainab A. Abubakar (MSc) Thesis title: Variability in the growth and yield of selected cowpea varieties under different shade conditions. [Presented to Bayero University, Kano, Nigeria].(vii) Umma Mohammed (MSc) Thesis title: Heritability of seedling characteristics in cowpea. [Presented to Bayero University, Kano, Nigeria].(viii) Abdul-Azeez, A. (PhD) Thesis title: Effect of different types and level of organic and inorganic fertilizer on the growth and yield of selected maize varieties. [Presented to Bayero University, Kano, Nigeria].
Farmers’ field daysA total of 27 large field days was organized by the project from 2006 to 2008 in Nigeria and Niger Republic (Fig. 10) to showcase the improved cropping systems and crop varieties being demonstrated. The field days afforded participating and non-participating farmers the opportunity to observe firsthand the results of the demonstrations and to discuss freely the agricultural practices with other farmers, researchers, and policy makers.
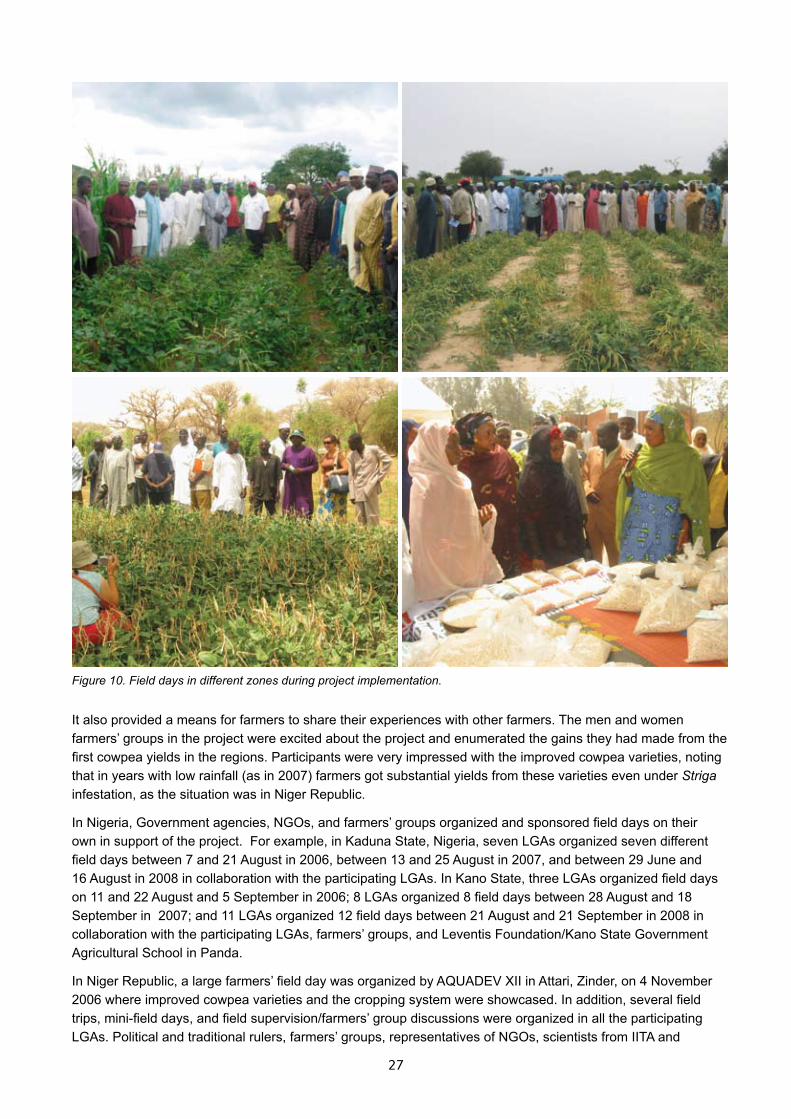
26 27
It also provided a means for farmers to share their experiences with other farmers. The men and women farmers’ groups in the project were excited about the project and enumerated the gains they had made from the first cowpea yields in the regions. Participants were very impressed with the improved cowpea varieties, noting that in years with low rainfall (as in 2007) farmers got substantial yields from these varieties even under Striga infestation, as the situation was in Niger Republic.
In Nigeria, Government agencies, NGOs, and farmers’ groups organized and sponsored field days on their own in support of the project. For example, in Kaduna State, Nigeria, seven LGAs organized seven different field days between 7 and 21 August in 2006, between 13 and 25 August in 2007, and between 29 June and 16 August in 2008 in collaboration with the participating LGAs. In Kano State, three LGAs organized field days on 11 and 22 August and 5 September in 2006; 8 LGAs organized 8 field days between 28 August and 18 September in 2007; and 11 LGAs organized 12 field days between 21 August and 21 September in 2008 in collaboration with the participating LGAs, farmers’ groups, and Leventis Foundation/Kano State Government Agricultural School in Panda.
In Niger Republic, a large farmers’ field day was organized by AQUADEV XII in Attari, Zinder, on 4 November 2006 where improved cowpea varieties and the cropping system were showcased. In addition, several field trips, mini-field days, and field supervision/farmers’ group discussions were organized in all the participating LGAs. Political and traditional rulers, farmers’ groups, representatives of NGOs, scientists from IITA and
Figure 10. Field days in different zones during project implementation.
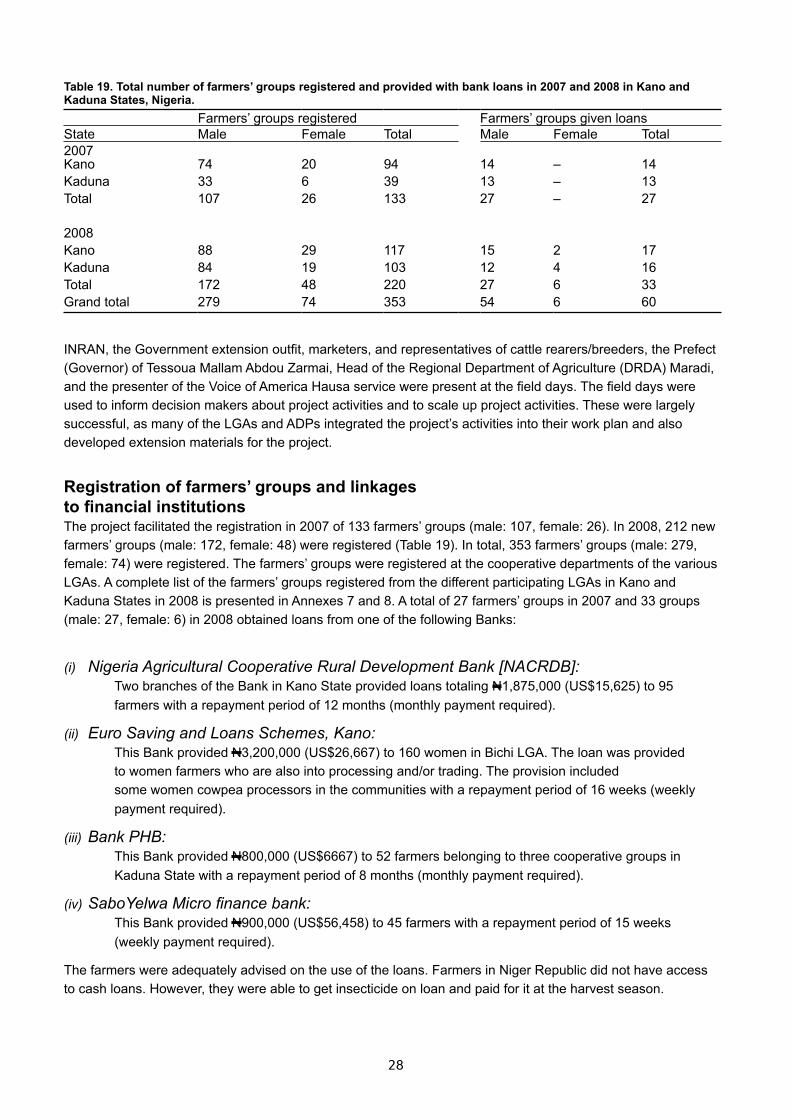
28 29
INRAN, the Government extension outfit, marketers, and representatives of cattle rearers/breeders, the Prefect (Governor) of Tessoua Mallam Abdou Zarmai, Head of the Regional Department of Agriculture (DRDA) Maradi, and the presenter of the Voice of America Hausa service were present at the field days. The field days were used to inform decision makers about project activities and to scale up project activities. These were largely successful, as many of the LGAs and ADPs integrated the project’s activities into their work plan and also developed extension materials for the project.
Registration of farmers’ groups and linkages to financial institutionsThe project facilitated the registration in 2007 of 133 farmers’ groups (male: 107, female: 26). In 2008, 212 new farmers’ groups (male: 172, female: 48) were registered (Table 19). In total, 353 farmers’ groups (male: 279, female: 74) were registered. The farmers’ groups were registered at the cooperative departments of the various LGAs. A complete list of the farmers’ groups registered from the different participating LGAs in Kano and Kaduna States in 2008 is presented in Annexes 7 and 8. A total of 27 farmers’ groups in 2007 and 33 groups (male: 27, female: 6) in 2008 obtained loans from one of the following Banks:
Nigeria Agricultural Cooperative Rural Development Bank [NACRDB]:(i) Two branches of the Bank in Kano State provided loans totaling N1,875,000 (US$15,625) to 95 farmers with a repayment period of 12 months (monthly payment required).
Euro Saving and Loans Schemes, Kano:(ii) This Bank provided N3,200,000 (US$26,667) to 160 women in Bichi LGA. The loan was provided to women farmers who are also into processing and/or trading. The provision included some women cowpea processors in the communities with a repayment period of 16 weeks (weekly payment required).
Bank PHB:(iii) This Bank provided N800,000 (US$6667) to 52 farmers belonging to three cooperative groups in Kaduna State with a repayment period of 8 months (monthly payment required).
SaboYelwa Micro finance bank:(iv) This Bank provided N900,000 (US$56,458) to 45 farmers with a repayment period of 15 weeks (weekly payment required).
The farmers were adequately advised on the use of the loans. Farmers in Niger Republic did not have access to cash loans. However, they were able to get insecticide on loan and paid for it at the harvest season.
Table 19. Total number of farmers’ groups registered and provided with bank loans in 2007 and 2008 in Kano and Kaduna States, Nigeria.
Farmers’ groups registered Farmers’ groups given loansState Male Female Total Male Female Total2007Kano 74 20 94 14 – 14Kaduna 33 6 39 13 – 13Total 107 26 133 27 – 27
2008Kano 88 29 117 15 2 17Kaduna 84 19 103 12 4 16Total 172 48 220 27 6 33Grand total 279 74 353 54 6 60

28 29
Linkages with processors and input dealers
• Farmers’ linkage with agro-processorsIn collaboration with the USAID-MARKETS project, market opportunities were identified for cowpea grain with agro-processing companies. In 2007, exchange visits were facilitated between cowpea processors and cowpea farmers’ groups. In Kano, 84 lead farmers visited processing factories. The objective was to facilitate the marketing of cowpea grain by farmers’groups which would in turn stimulate production and encourage investment in improved agricultural practices. This linkage was successful as some of these companies are already buying cowpea grain from farmers and processing this into flour for internal and external markets.
To further strengthen the linkage, a trial was conducted in collaboration with Modern Universal Foods and Beverages Limited (an agro-processing company in Kano) in 2007 to evaluate promising cowpea varieties for flour recovery and quality of processed food. Results showed that flour recovery was the highest from grain of IT93K-452-1 and IT90K-277-2 (Table 20). These two varieties were preferred by the processors and the women’s groups for the quality of food made from their flour. This trial was successful as the networked farmers are now supplying these varieties to the processors.
• Farmers’ linkage with input dealersSeveral of the registered farmers’ groups were linked to input dealers (Fig. 11). A total of 16 farmers’ groups was linked to seed companies (Seeds Project, Alheri Seeds, Maslaha Seeds, and Premier Seeds) and 24 farmers’ groups to agro-chemical companies (African Agro-chemical Ltd and Jubaili Agro-chemical Ltd) and fertilizer dealers in Kano and Kaduna States from where they source inputs independently. In addition, most of the registered farmers’ groups sourced inputs through Government agencies and many of them were successful in obtaining fertilizer and insecticide through this opportunity.
Figure 11. Farmers’ input market linkages.
Table 20. Flour recovery of selected cowpea varieties. Weight (kg) % recoveryVariety Full grain Dehaulmed Flour Dehaulmed FlourIT93K-452-1 101 75 70 74 69IT89KD-288 103 73 70 71 68IT89KD-391 89 54 49 61 55IT90K-277-2 100 74 69 74 69IT90K-82-2 89 58 54 66 61IT97K-568-18 96 64 64 67 67
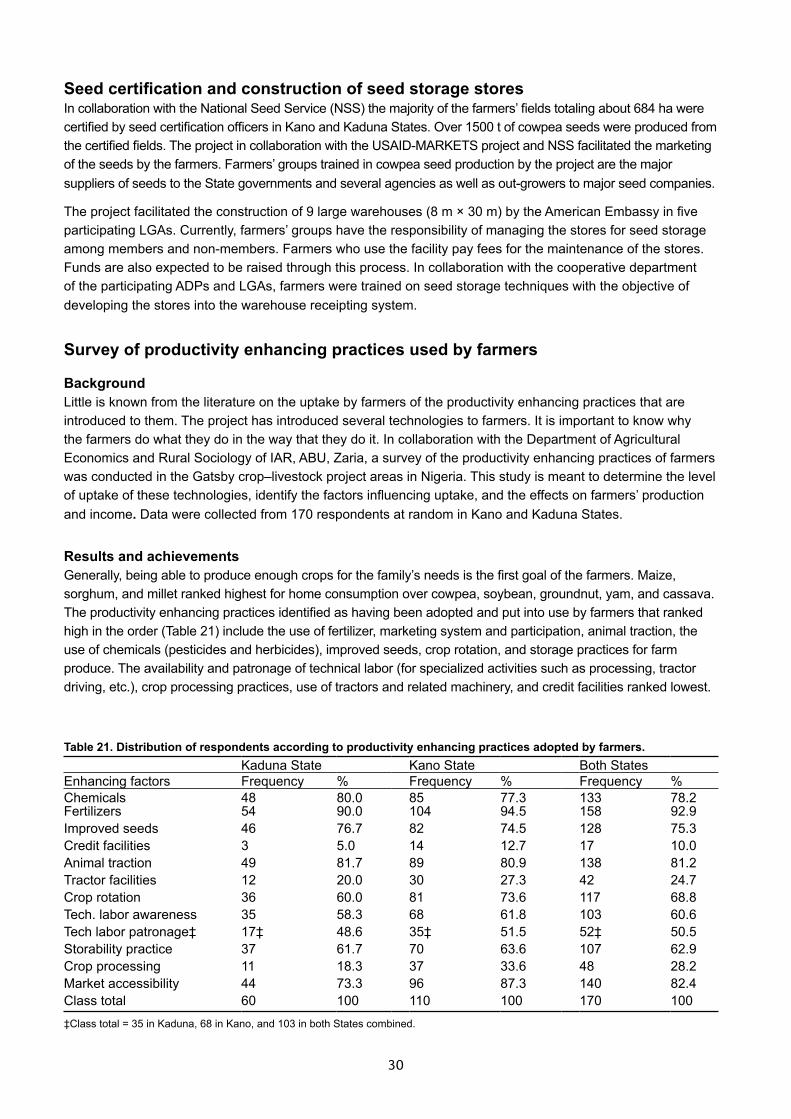
30 31
Seed certification and construction of seed storage storesIn collaboration with the National Seed Service (NSS) the majority of the farmers’ fields totaling about 684 ha were certified by seed certification officers in Kano and Kaduna States. Over 1500 t of cowpea seeds were produced from the certified fields. The project in collaboration with the USAID-MARKETS project and NSS facilitated the marketing of the seeds by the farmers. Farmers’ groups trained in cowpea seed production by the project are the major suppliers of seeds to the State governments and several agencies as well as out-growers to major seed companies.
The project facilitated the construction of 9 large warehouses (8 m × 30 m) by the American Embassy in five participating LGAs. Currently, farmers’ groups have the responsibility of managing the stores for seed storage among members and non-members. Farmers who use the facility pay fees for the maintenance of the stores. Funds are also expected to be raised through this process. In collaboration with the cooperative department of the participating ADPs and LGAs, farmers were trained on seed storage techniques with the objective of developing the stores into the warehouse receipting system.
Survey of productivity enhancing practices used by farmers
BackgroundLittle is known from the literature on the uptake by farmers of the productivity enhancing practices that are introduced to them. The project has introduced several technologies to farmers. It is important to know why the farmers do what they do in the way that they do it. In collaboration with the Department of Agricultural Economics and Rural Sociology of IAR, ABU, Zaria, a survey of the productivity enhancing practices of farmers was conducted in the Gatsby crop–livestock project areas in Nigeria. This study is meant to determine the level of uptake of these technologies, identify the factors influencing uptake, and the effects on farmers’ production and income. Data were collected from 170 respondents at random in Kano and Kaduna States.
Results and achievementsGenerally, being able to produce enough crops for the family’s needs is the first goal of the farmers. Maize, sorghum, and millet ranked highest for home consumption over cowpea, soybean, groundnut, yam, and cassava. The productivity enhancing practices identified as having been adopted and put into use by farmers that ranked high in the order (Table 21) include the use of fertilizer, marketing system and participation, animal traction, the use of chemicals (pesticides and herbicides), improved seeds, crop rotation, and storage practices for farm produce. The availability and patronage of technical labor (for specialized activities such as processing, tractor driving, etc.), crop processing practices, use of tractors and related machinery, and credit facilities ranked lowest.
Table 21. Distribution of respondents according to productivity enhancing practices adopted by farmers.Kaduna State Kano State Both States
Enhancing factors Frequency % Frequency % Frequency %Chemicals 48 80.0 85 77.3 133 78.2Fertilizers 54 90.0 104 94.5 158 92.9Improved seeds 46 76.7 82 74.5 128 75.3Credit facilities 3 5.0 14 12.7 17 10.0Animal traction 49 81.7 89 80.9 138 81.2Tractor facilities 12 20.0 30 27.3 42 24.7Crop rotation 36 60.0 81 73.6 117 68.8Tech. labor awareness 35 58.3 68 61.8 103 60.6Tech labor patronage‡ 17‡ 48.6 35‡ 51.5 52‡ 50.5Storability practice 37 61.7 70 63.6 107 62.9Crop processing 11 18.3 37 33.6 48 28.2Market accessibility 44 73.3 96 87.3 140 82.4Class total 60 100 110 100 170 100
‡Class total = 35 in Kaduna, 68 in Kano, and 103 in both States combined.
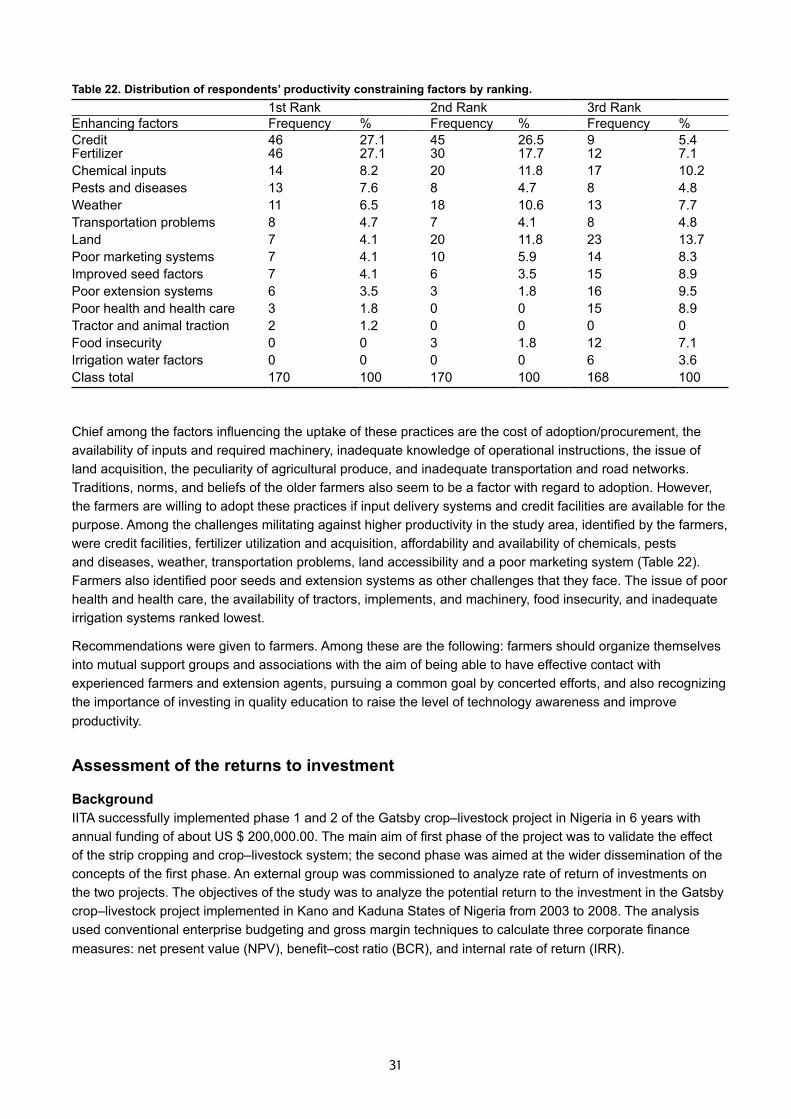
30 31
Chief among the factors influencing the uptake of these practices are the cost of adoption/procurement, the availability of inputs and required machinery, inadequate knowledge of operational instructions, the issue of land acquisition, the peculiarity of agricultural produce, and inadequate transportation and road networks. Traditions, norms, and beliefs of the older farmers also seem to be a factor with regard to adoption. However, the farmers are willing to adopt these practices if input delivery systems and credit facilities are available for the purpose. Among the challenges militating against higher productivity in the study area, identified by the farmers, were credit facilities, fertilizer utilization and acquisition, affordability and availability of chemicals, pests and diseases, weather, transportation problems, land accessibility and a poor marketing system (Table 22). Farmers also identified poor seeds and extension systems as other challenges that they face. The issue of poor health and health care, the availability of tractors, implements, and machinery, food insecurity, and inadequate irrigation systems ranked lowest.
Recommendations were given to farmers. Among these are the following: farmers should organize themselves into mutual support groups and associations with the aim of being able to have effective contact with experienced farmers and extension agents, pursuing a common goal by concerted efforts, and also recognizing the importance of investing in quality education to raise the level of technology awareness and improve productivity.
Assessment of the returns to investment
BackgroundIITA successfully implemented phase 1 and 2 of the Gatsby crop–livestock project in Nigeria in 6 years with annual funding of about US $ 200,000.00. The main aim of first phase of the project was to validate the effect of the strip cropping and crop–livestock system; the second phase was aimed at the wider dissemination of the concepts of the first phase. An external group was commissioned to analyze rate of return of investments on the two projects. The objectives of the study was to analyze the potential return to the investment in the Gatsby crop–livestock project implemented in Kano and Kaduna States of Nigeria from 2003 to 2008. The analysis used conventional enterprise budgeting and gross margin techniques to calculate three corporate finance measures: net present value (NPV), benefit–cost ratio (BCR), and internal rate of return (IRR).
Table 22. Distribution of respondents’ productivity constraining factors by ranking.1st Rank 2nd Rank 3rd Rank
Enhancing factors Frequency % Frequency % Frequency %Credit 46 27.1 45 26.5 9 5.4Fertilizer 46 27.1 30 17.7 12 7.1Chemical inputs 14 8.2 20 11.8 17 10.2Pests and diseases 13 7.6 8 4.7 8 4.8Weather 11 6.5 18 10.6 13 7.7Transportation problems 8 4.7 7 4.1 8 4.8Land 7 4.1 20 11.8 23 13.7Poor marketing systems 7 4.1 10 5.9 14 8.3Improved seed factors 7 4.1 6 3.5 15 8.9Poor extension systems 6 3.5 3 1.8 16 9.5Poor health and health care 3 1.8 0 0 15 8.9Tractor and animal traction 2 1.2 0 0 0 0Food insecurity 0 0 3 1.8 12 7.1Irrigation water factors 0 0 0 0 6 3.6Class total 170 100 170 100 168 100
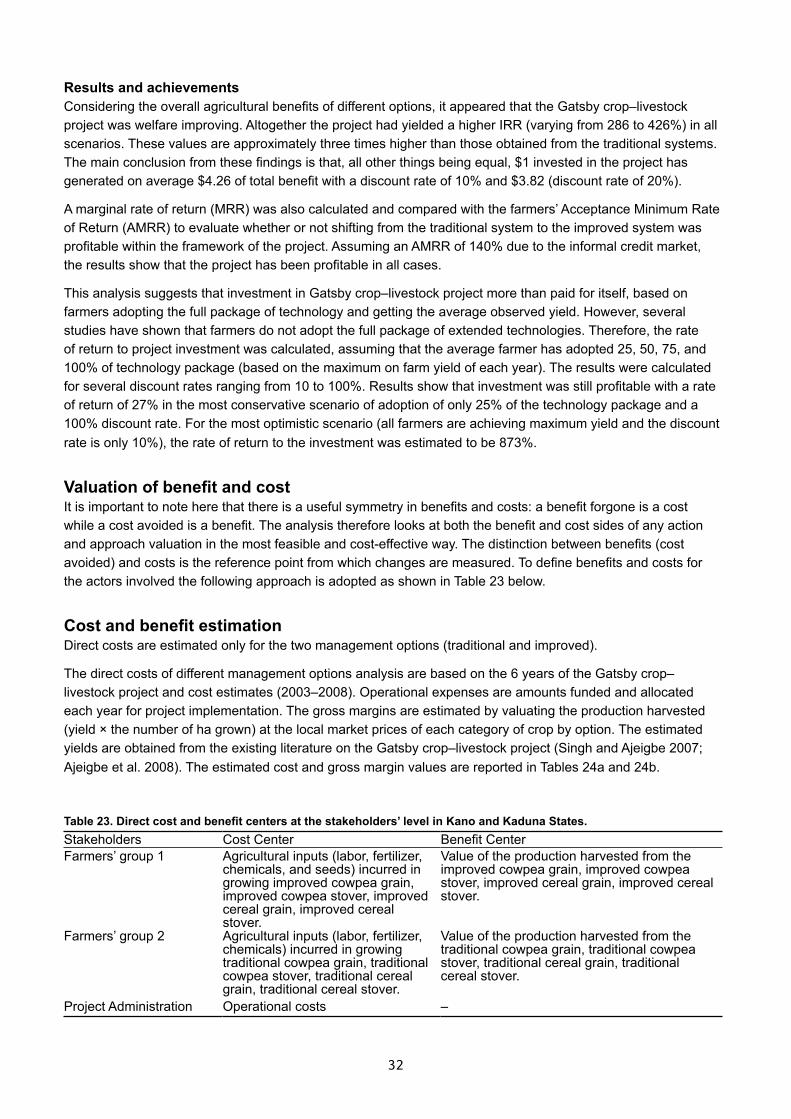
32 33
Results and achievementsConsidering the overall agricultural benefits of different options, it appeared that the Gatsby crop–livestock project was welfare improving. Altogether the project had yielded a higher IRR (varying from 286 to 426%) in all scenarios. These values are approximately three times higher than those obtained from the traditional systems. The main conclusion from these findings is that, all other things being equal, $1 invested in the project has generated on average $4.26 of total benefit with a discount rate of 10% and $3.82 (discount rate of 20%).
A marginal rate of return (MRR) was also calculated and compared with the farmers’ Acceptance Minimum Rate of Return (AMRR) to evaluate whether or not shifting from the traditional system to the improved system was profitable within the framework of the project. Assuming an AMRR of 140% due to the informal credit market, the results show that the project has been profitable in all cases.
This analysis suggests that investment in Gatsby crop–livestock project more than paid for itself, based on farmers adopting the full package of technology and getting the average observed yield. However, several studies have shown that farmers do not adopt the full package of extended technologies. Therefore, the rate of return to project investment was calculated, assuming that the average farmer has adopted 25, 50, 75, and 100% of technology package (based on the maximum on farm yield of each year). The results were calculated for several discount rates ranging from 10 to 100%. Results show that investment was still profitable with a rate of return of 27% in the most conservative scenario of adoption of only 25% of the technology package and a 100% discount rate. For the most optimistic scenario (all farmers are achieving maximum yield and the discount rate is only 10%), the rate of return to the investment was estimated to be 873%.
Valuation of benefit and costIt is important to note here that there is a useful symmetry in benefits and costs: a benefit forgone is a cost while a cost avoided is a benefit. The analysis therefore looks at both the benefit and cost sides of any action and approach valuation in the most feasible and cost-effective way. The distinction between benefits (cost avoided) and costs is the reference point from which changes are measured. To define benefits and costs for the actors involved the following approach is adopted as shown in Table 23 below.
Cost and benefit estimationDirect costs are estimated only for the two management options (traditional and improved).
The direct costs of different management options analysis are based on the 6 years of the Gatsby crop–livestock project and cost estimates (2003–2008). Operational expenses are amounts funded and allocated each year for project implementation. The gross margins are estimated by valuating the production harvested (yield × the number of ha grown) at the local market prices of each category of crop by option. The estimated yields are obtained from the existing literature on the Gatsby crop–livestock project (Singh and Ajeigbe 2007; Ajeigbe et al. 2008). The estimated cost and gross margin values are reported in Tables 24a and 24b.
Table 23. Direct cost and benefit centers at the stakeholders’ level in Kano and Kaduna States.Stakeholders Cost Center Benefit CenterFarmers’ group 1 Agricultural inputs (labor, fertilizer,
chemicals, and seeds) incurred in growing improved cowpea grain, improved cowpea stover, improved cereal grain, improved cereal stover.
Value of the production harvested from the improved cowpea grain, improved cowpea stover, improved cereal grain, improved cereal stover.
Farmers’ group 2 Agricultural inputs (labor, fertilizer, chemicals) incurred in growing traditional cowpea grain, traditional cowpea stover, traditional cereal grain, traditional cereal stover.
Value of the production harvested from the traditional cowpea grain, traditional cowpea stover, traditional cereal grain, traditional cereal stover.
Project Administration Operational costs –
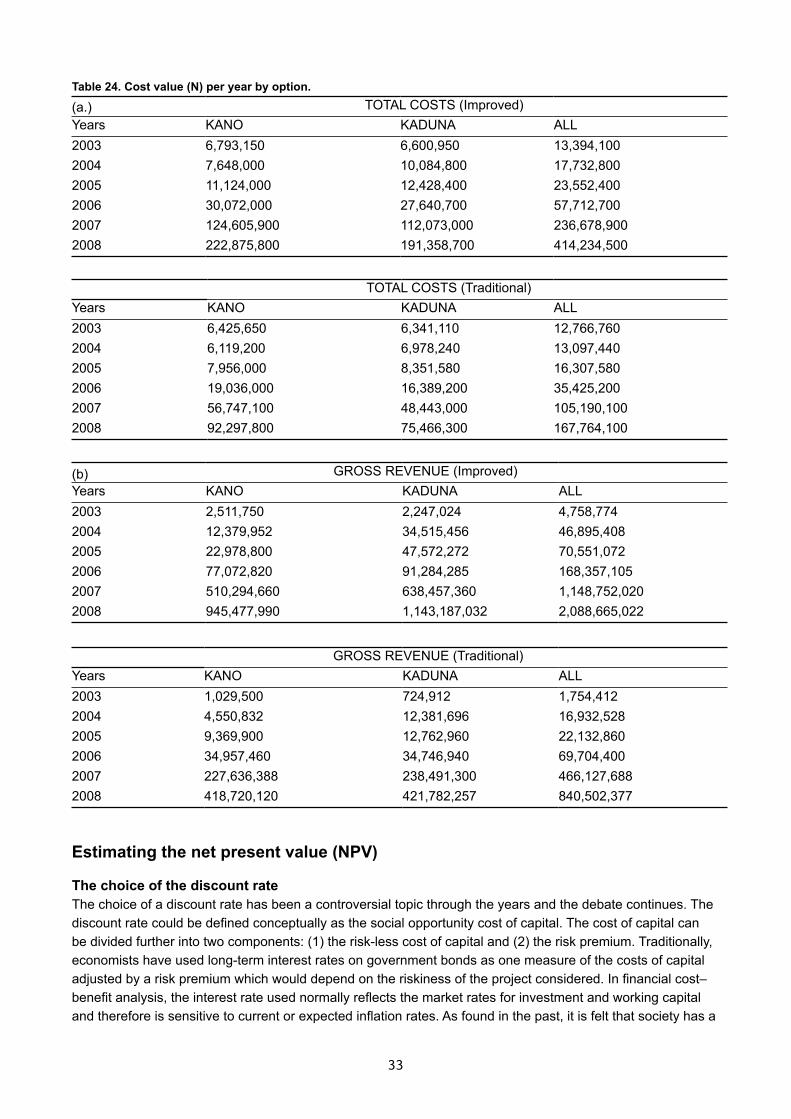
32 33
Estimating the net present value (NPV)
The choice of the discount rateThe choice of a discount rate has been a controversial topic through the years and the debate continues. The discount rate could be defined conceptually as the social opportunity cost of capital. The cost of capital can be divided further into two components: (1) the risk-less cost of capital and (2) the risk premium. Traditionally, economists have used long-term interest rates on government bonds as one measure of the costs of capital adjusted by a risk premium which would depend on the riskiness of the project considered. In financial cost–benefit analysis, the interest rate used normally reflects the market rates for investment and working capital and therefore is sensitive to current or expected inflation rates. As found in the past, it is felt that society has a
Table 24. Cost value (N) per year by option.TOTAL COSTS (Improved)
Years KANO KADUNA ALL2003 6,793,150 6,600,950 13,394,100 2004 7,648,000 10,084,800 17,732,800 2005 11,124,000 12,428,400 23,552,400 2006 30,072,000 27,640,700 57,712,700 2007 124,605,900 112,073,000 236,678,900 2008 222,875,800 191,358,700 414,234,500
TOTAL COSTS (Traditional)Years KANO KADUNA ALL2003 6,425,650 6,341,110 12,766,760 2004 6,119,200 6,978,240 13,097,440 2005 7,956,000 8,351,580 16,307,580 2006 19,036,000 16,389,200 35,425,200 2007 56,747,100 48,443,000 105,190,100 2008 92,297,800 75,466,300 167,764,100
GROSS REVENUE (Improved)Years KANO KADUNA ALL2003 2,511,750 2,247,024 4,758,774 2004 12,379,952 34,515,456 46,895,408 2005 22,978,800 47,572,272 70,551,072 2006 77,072,820 91,284,285 168,357,105 2007 510,294,660 638,457,360 1,148,752,020 2008 945,477,990 1,143,187,032 2,088,665,022
GROSS REVENUE (Traditional)Years KANO KADUNA ALL2003 1,029,500 724,912 1,754,412 2004 4,550,832 12,381,696 16,932,528 2005 9,369,900 12,762,960 22,132,860 2006 34,957,460 34,746,940 69,704,400 2007 227,636,388 238,491,300 466,127,688 2008 418,720,120 421,782,257 840,502,377
(a.)
(b)

34 35
longer time horizon, so that its discount rate would be lower (usually between 8 and 12%, see Brent 2006);in this analysis, the starting point of the discount rate is 10%.
However, most farmers in rural areas have no access to formal loans which attract a lower interest rate but opportunities for informal loans exist on which the monthly interest rate varies from 3 to 10%. Also, the opportunity costs of capital in African rural areas are often much higher than what can be expected in the economies of more developed countries (Lowenberg-Deboer et al. 1994). By taking into consideration the farmers’ AMRR criterion, a sensitivity analysis is done by using different levels of discount rates varying from 15 to 100%. The NPV and related IRR under the starting point scenario are provided in Tables 25 and 26.
Considering the overall agricultural benefits of different options, it appeared that the Gatsby crop–livestock project was welfare improving. In both cases, the total benefits exceed total costs and, by the criteria of cost-benefit analysis, this implies that it has been economically efficient to proceed with these two options. However, the absolute economic benefits provided by the improved option are greater than that obtained from the traditional system under the five discount rate scenarios.
It is also appeared that the Gatsby crop–livestock project has yielded a higher IRR (varying from 407 to 179%) in the different scenarios. These values are approximately three times, higher than that obtained from the traditional systems.
The main conclusion stemming from these findings is that, assuming all other factors equal, N100 invested within the project has generated a growth of N407 given a discount rate of 10% and N365 (discount rate of 20%). In other words, $1 invested within the project has generated on average $4.07 given a discount rate of 10% and $3.00 (discount rate of 20%) (Fig. 12). As it appears in Table 26, even if this value decreases as the discount rate increases, the IRR remains positive and greater than 100%, indicating that the Gatsby crop–livestock project has been welfare improving for the beneficiaries. The average exchange rate during the implementation period was 1US$ = N121.
Table 25. Net present value, internal rate of return, and net present value per capita (improved option).KANO (Number of farmers involved = 18,270)
KADUNA (Number of farmers involved = 15,805)
ALL (Total number of farmers involved = 34,075)
NPV IRR NPV/capita
NPV IRR NPV/capita
NPV IRR NPV/capita
10% 688,399,875 280% 37,679 950,231,599 569% 60,122 1,638,631,474 407% 48,089 15% 538,679,020 264% 29,484 747,390,868 540% 47,288 1,286,069,888 385% 37,742
20% 426,242,625 248% 23,330 594,675,117 513% 37,626 1,020,917,742 365% 29,961
25% 340,732,844 234% 18,650 478,216,267 489% 30,257 818,949,111 346% 24,034
50% 126,274,085 179% 6,912 183,820,561 390% 11,631 310,094,646 272% 9,100 100% 26,805,122 109% 1,467 43,623,238 268% 2,760 70,428,360 179% 2,067
Table 26. Net present value, internal rate of return, and net present value per capita (traditional option)KANO (Number of farmers involved 18,270)
KADUNA (Number of involved farmers 15,805)
ALL (Total number of farmers involved 34,075)
NPV IRR NPV/capita NPV IRR NPV/capita NPV IRR NPV/capita10% 296,100,785 151% 16,207 328,704,321 189% 20,797 624,805,106 169% 39,532 15% 230,238,148 140% 12,602 256,808,328 177% 16,249 487,046,476 157% 30,816 20% 180,905,213 130% 9,902 202,834,856 165% 12,834 383,740,069 146% 24,280 25% 143,491,326 120% 7,854 161,802,887 155% 10,237 305,294,213 136% 19,316 50% 50,430,470 84% 2,760 59,021,232 112% 3,734 109,451,702 97% 6,925 100% 8,522,301 38% 466 11,591,742 59% 733 20,114,043 48% 1,273
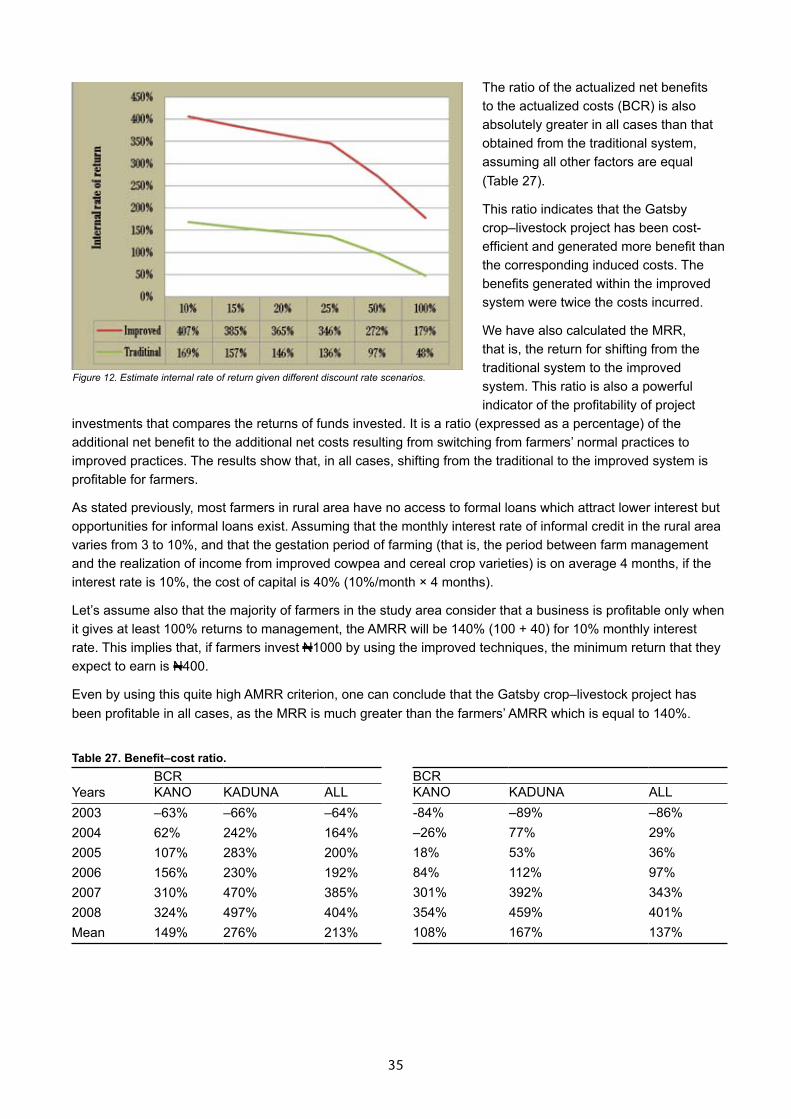
34 35
The ratio of the actualized net benefits to the actualized costs (BCR) is also absolutely greater in all cases than that obtained from the traditional system, assuming all other factors are equal (Table 27).
This ratio indicates that the Gatsby crop–livestock project has been cost-efficient and generated more benefit than the corresponding induced costs. The benefits generated within the improved system were twice the costs incurred.
We have also calculated the MRR, that is, the return for shifting from the traditional system to the improved system. This ratio is also a powerful indicator of the profitability of project
investments that compares the returns of funds invested. It is a ratio (expressed as a percentage) of the additional net benefit to the additional net costs resulting from switching from farmers’ normal practices to improved practices. The results show that, in all cases, shifting from the traditional to the improved system is profitable for farmers.
As stated previously, most farmers in rural area have no access to formal loans which attract lower interest but opportunities for informal loans exist. Assuming that the monthly interest rate of informal credit in the rural area varies from 3 to 10%, and that the gestation period of farming (that is, the period between farm management and the realization of income from improved cowpea and cereal crop varieties) is on average 4 months, if the interest rate is 10%, the cost of capital is 40% (10%/month × 4 months).
Let’s assume also that the majority of farmers in the study area consider that a business is profitable only when it gives at least 100% returns to management, the AMRR will be 140% (100 + 40) for 10% monthly interest rate. This implies that, if farmers invest N1000 by using the improved techniques, the minimum return that they expect to earn is N400.
Even by using this quite high AMRR criterion, one can conclude that the Gatsby crop–livestock project has been profitable in all cases, as the MRR is much greater than the farmers’ AMRR which is equal to 140%.
Table 27. Benefit–cost ratio.
YearsBCRKANO KADUNA ALL
2003 –63% –66% –64%2004 62% 242% 164%2005 107% 283% 200%2006 156% 230% 192%2007 310% 470% 385%2008 324% 497% 404%Mean 149% 276% 213%
BCRKANO KADUNA ALL-84% –89% –86%–26% 77% 29%18% 53% 36%84% 112% 97%301% 392% 343%354% 459% 401%108% 167% 137%
Figure 12. Estimate internal rate of return given different discount rate scenarios.

36 37
Adoption level and discount rate-based scenariosEstimation of rate of returns is very sensitive to discount rates and the level of adoption of technology used in the calculation. Farmers seldom adopt the full package of technology extended to them. They instead select those parts of the package that best fit their conditions for adoption. Others do adopt pieces of the technology progressively until they gradually reach the full package (Abdoulaye and Lowenberg-DeBoer 2000). The Gatsby case was not an exception. Alene and Manyong (2006) reported that not all farmers in the Kano and Kaduna had adopted the full package of the IITA-developed package of improved seeds, insect control, fertilizer, and recommended cereal–cowpea cropping pattern. However, those who adopted the full package were 21% more efficient than those partial adopters who adopted only improved cowpea varieties, leaving out the cropping system.
This analysis suggests that investment in Gatsby crop–livestock project more than paid for itself, based on farmers adopting the full package of technology and getting the average observed yield. However, several studies have shown that farmers do not adopt the full package of extended technologies. Therefore we have recalculated the rate of return to investment in the Gatsby project, assuming that the average farmer has adopted 25, 50, 75, and 100% of the technology package (based on the maximum yield on-farm of each year). In the 25% adoption level scenario, it is assumed that farmers are getting only 25% of the maximum yield observed for that year in each State. In the 100% adoption level scenario, it is assumed that all farmers are getting the maximum yield observed in that year for each State.
The opportunity cost of capital in Africa rural areas is often much higher than what can be expected in the economies of more developed countries (Lowenberg-Deboer et al. 1994). Therefore we assumed several discount rates ranging from 10 to 100% to account for the wide range of possible discount rates. This allowed us to have most optimistic and most pessimistic scenarios.
Results show that investment is still profitable with a rate of return ranging from 27% in the most conservative scenario of adoption of only 25% of the technology package and a 100% discount rate (Table 28). This result is in fact based on too conservative a scenario, if we consider past results that stated that even farmers who had adopted improved varieties but not the cropping system were only 21% less efficient than the adopters of the full package (Alene and Manyong 2006). In other terms, most adopters would achieve much more than 25% even if they did not adopt the full package.
In the most optimistic scenario with 10% discount rate where it is assumed that all farmers are getting the maximum yield, the rate of return is more than 800%. This optimistic scenario would be achieved only if extension services, farmers’ education, financing, markets, and other types of infrastructure are working in the area. In general, not all farmers get to the production possibility frontier due to factors inherent in each farmer. Some farmers will always lag behind, thus the full optimistic scenario might not be achieved even when most complementary services were made available.
Table 28. Estimated internal rate of return (IRR) at different discount rates and adoption level scenarios.Discount rate (IRR
25% adoption of the package
50% adoption of the package
75% adoptionof the ackage
Adoption of the full packageat maximum yield
10% 131% 301% 528% 873%15% 121% 284% 501% 831%20% 112% 268% 476% 792%25% 103% 253% 453% 756%50% 69% 194% 361% 614%100% 27% 121% 246% 435%
36 37
Project publicationsAs part of the efforts to increase the visibility of the project and make contributions to science and international public goods, several findings of the projects were published as follows: seven papers in peer reviewed journals, one book chapter, five in proceedings of conferences, two poster presentations, and five in other professional meetings and trainings. In addition, five other manuscripts have been submitted to different journals for publication. The scientists also attended both local and international conferences where results from the project were presented. The publications are as follows:
• Peer reviewed journals 1. Ajeigbe, H.A., B. B. Singh, J. O. Adeosun and I. E. Ezeaku, 2010. Participatory on-farm evaluation of
improved legume-cereals cropping systems for crop-livestock farmers: Maize-double cowpea in Northern Guinea Savanna Zone of Nigeria. African Journal of Agricultural Research Vol. 5(16), pp. 2080-2088. Available online at http://www.academicjournals.org/AJAR.
2. Ajeigbe, H.A., B. B. Singh, I. E. Ezeaku and J. O. Adeosun, 2010. On-farm evaluation of improved cowpea-cereals cropping systems for crop-livestock farmers: Cereals-cowpea systems in Sudan Savanna zone of Nigeria. African Journal of Agricultural Research Vol. 5(17), pp. 2297-2304, Available online at http://www.academicjournals.org/AJAR.
3. Mukhtar, F. B. M. Mohammed and H.A. Ajeigbe, 2009. Effect of benzyl amino purine (BAP), coconut milk (CM) and manure applications on leaf senescence and yield in photoperiod sensitive cowpea variety (Kanannado). African Journal of Plant Science. Vol. 3 (6), pp. 142-146, July, 2009. Available online at http://www.academicjournals.org/AJPS, ISSN 1996-0824 © 2009 Academic Journals.
4. Ajeigbe, H.A. B.B. Singh and A.M. Emechebe, 2008. Field Evaluation of Improved Cowpea Lines for Resistance to Bacterial Blight, Virus and Striga under Natural Infestation in the West African Savannas. African Journal of Biotechnology. Vol. 7 (20), pp. 3563-3568, 20 October, 2008.
5. Ajeigbe, H. A., Ihedioha, D., and D. Chikoye, 2008. Variations in Physicochemical Properties of Seed of Selected Improved Cowpea Varieties. African Journal of Biotechnology Vol. 7 (20), pp. 3639-3644, 20 October, 2008.
6. Singh, B.B. and H. A. Ajeigbe, 2007. Improved Cowpea-cereals-Based Cropping Systems for Household Food Security and Poverty Reduction in West Africa. Journal of Crop Improvement. Vol. 19, No.1/2 pages 157-172, 2007.
7. Ajeigbe, H. A., S. G. Mohammed and B. B. Singh, 2006. Comparative Assessment of Yield Potentials of Improved Cowpea Breeding lines Using Performance Index and Ranking Methods. Journal of Food, Agriculture and Environment. Vol. 4 (3&4):95-98, 2006.
8. Ajeigbe H. A. and B.B. Singh, 2006. Integrated Pest Management in Cowpea: Effect of Time and Frequency of Insecticide Application on Productivity. Crop Protection. Vol. 25, issue 9, pages 920-925, September, 2006.
9. Ajeigbe, H. A., T.O. Oseni, and B.B. Singh, 2006. Effect of Planting Pattern, Crop Variety and Insecticide on the Productivity of Cowpea-cereal System in the Northern Guinea Savanna of Nigeria. Journal of Food, Agriculture and Environment Vol. 4(1):101-107, 2006.
• Books and book chapters10. Singh, B.B. and H.A. Ajeigbe 2007. Improved Cowpea–cereals-based Cropping Systems for Household
Food Security and Poverty Reduction in West Africa. Pages 157–172 in: Agricultural and Environmental Sustainability: considerations for the future, edited by M.S. Kang. Haworth Press Inc., Philadelphia, PA, USA
38 39
• Conferences and workshop proceedings11. Ajeigbe, H.A., A.Y. Kamara, and D. Chikoye. 2008. Comparative performance of common grain legumes in
the Sudan Savanna Zone of Nigeria. Pages 210–213 in: Agricultural Development in Nigeria: Issues and Challenges, edited by K.M.N. Ezike, I.I. Osakwe, L.G. Ekwu, E. Utobo, and C.N. Mbah. Proceedings of the 42nd Annual Conference of the Agricultural Society of Nigeria (ASN), held at Ebonyi State University, Abakaliki, Nigeria, 19–23 October, 2008. Published by ASN.
12. Ajeigbe, H.A., T.O. Oseni, B.B.Singh, and S.A. Tarawali. 2007. Effect of different cowpea–cereal row–row planting systems and insecticide sprays of cowpea on the quality of the crop residues. Pages 1057–1062 in Proceedings of the eighth African Crop Science Conference, edited by K Z. Ahmed, M.A. Mahamoud, S.I. Shalabi, E.A. El-Morsi, and H.A.M. Ismael. El-Minia, Egypt, 27–31 October 2007. Published by African Crop Science Society, Vol. 8 part 2.
13. Salisu, U.C., M.O. Akinola, and H.A. Ajeigbe. 2007. Effect of improved crop–livestock system adoption on the productivities of farmers in Kano State. Pages 561–568 in: Reviving Agriculture for Sustainable Nation Growth and Stable Democracy, edited by O.O. Olufajo, D.F. Omokore, G.N.Akpa, and S.A.Sanni, Proceedings of the 41st Annual Conference of the Agricultural Society of Nigeria (ASN), held at IAR. Samaru, ABU, Zaria, Nigeria, 22–26 October 2007. Published by ASN.
14. Abdul-Azeez, A., F.B. Mukhtar, and H.A. Ajeigbe. 2007. Effect of different types and levels of organic and inorganic fertilizer on growth and yield of selected maize varieties: Environmental protection and food security through life sciences. Nigerian Society for Experimental Biology (NISEB), Pages 25–26 in: Proceedings of the fifth International Conference/AGM 28 February–3 March 2007, Kogi State University, Anyigba, Kogi State, Nigeria. Published by NISEB.
15. Ajeigbe, H.A, A.M.Emechebe, and B.B.Singh. 2006. Control of Striga gesnerioides and Alectra vogelii in Cowpea. Proceedings of the FAO technical meeting on Striga control.(Programme pour la réunion technique sur la lutte contre Striga TCP/RAF/3008 Cotonou, 25–27 Avril 2006, Cotonou, Benin Republic /RAF/3008).
• Poster presentations16. Ajeigbe, H.A., A.Y. Kamara, and D. Chikoye. 2008. Improved Legume–Cereals-based Cropping Systems
for Improved productivity and Natural Resource Management by Resource Poor Crop–Livestock Farmers in West Africa. Presented at the Tropentag conference (Tropentag 2008), held at the University of Hohenheim, Germany, October 7–9.
17. Ajeigbe, H.A., A.M. Emechebe, and B.B. Singh.2007. Participatory on-farm evaluation and dissemination of improved cropping systems: Improving the productivity of cowpea–cereal, crop–livestock farmers in the Sudan savannas of Nigeria. Presented at the International conference; Agricultural innovation in dryland Africa (AIDA): what are the key drivers for success? FARA Secretariat, Accra, Ghana, 22–24 January 2007.
• Papers presented at professional meetings/workshops18. Ajeigbe, H.A. 2008. Supportive Roles of Non-Governmental Organizations (NGOs) in Promoting
Cooperatives Activities for Improved Agricultural Production at the Grassroots Level. Paper presented at a workshop on Farmers’ Cooperative Formation and Management at Grass root level for Local Government. Organized by Pyramid Resources Group. Federal Secretariat, Kano, 20–21 March 2008.
19. Ajeigbe, H.A. 2008. Recent Advances in the Production Technologies of Food and Cash Crops such as Millet, Maize, Rice, Groundnut, Soybean, and Cowpea. Paper presented at a workshop entitled Enhancing Rural Development through Implementation of Effective Agricultural Programs and Policies by Local Government. Organized by Pyramid Resources Group sponsored by Kaduna State Local Government Service Board for Kaduna State Local Government Functionaries. Kaduna LG Service Board Complex, 16–17 January 2008.
38 39
20. Ajeigbe, H.A. 2008. Plant Disease, Identification and Control including the Concept of Integrated Pest Management (IPM) under Smallholder farming systems. Paper presented at a workshop entitled Enhancing Rural Development through Implementation of Effective Agricultural Programs and Policies by Local Government. Organized by Pyramid Resources Group sponsored by Kaduna State Local Government Service Board for Kaduna State Local Government Functionaries. Kaduna LG Service Board Complex, 16–17 January 2008.
21. Saidou, A.K., H.A. Ajeigbe, and D. Chikoye. 2007. Participatory Evaluation of Improved Cowpea Lines and Cropping Systems for Enhanced Food Security and Income Generation in Niger Republic. Presented at the International Symposium: Innovations as Key to the Green Revolution in Africa: Exploring the Scientific Facts; organized by the African Network for Soil Biology and Fertility (AfNet) of Tropical Soil Biology and Fertility (TSBF) Institute of CIAT in collaboration with the Soil Fertility Consortium for Southern Africa (SOFECSA). Arusha, Tanzania, 17–21 September 2007.
• Manuscripts in progress1. Ajeigbe, H.A., R.S. Adamu, D. Chikoye, and B.B. Singh. Performance of Cowpea as Influenced by
Insecticide Types and their Combination in the Savannas of Nigeria.
2. Singh, B.B., A. Musa, H.A. Ajeigbe, and S.A. Tarawali. Effect of Feeding Crop Residues of Different Cereals and Legumes on Weight Gain of Yankassa Rams.
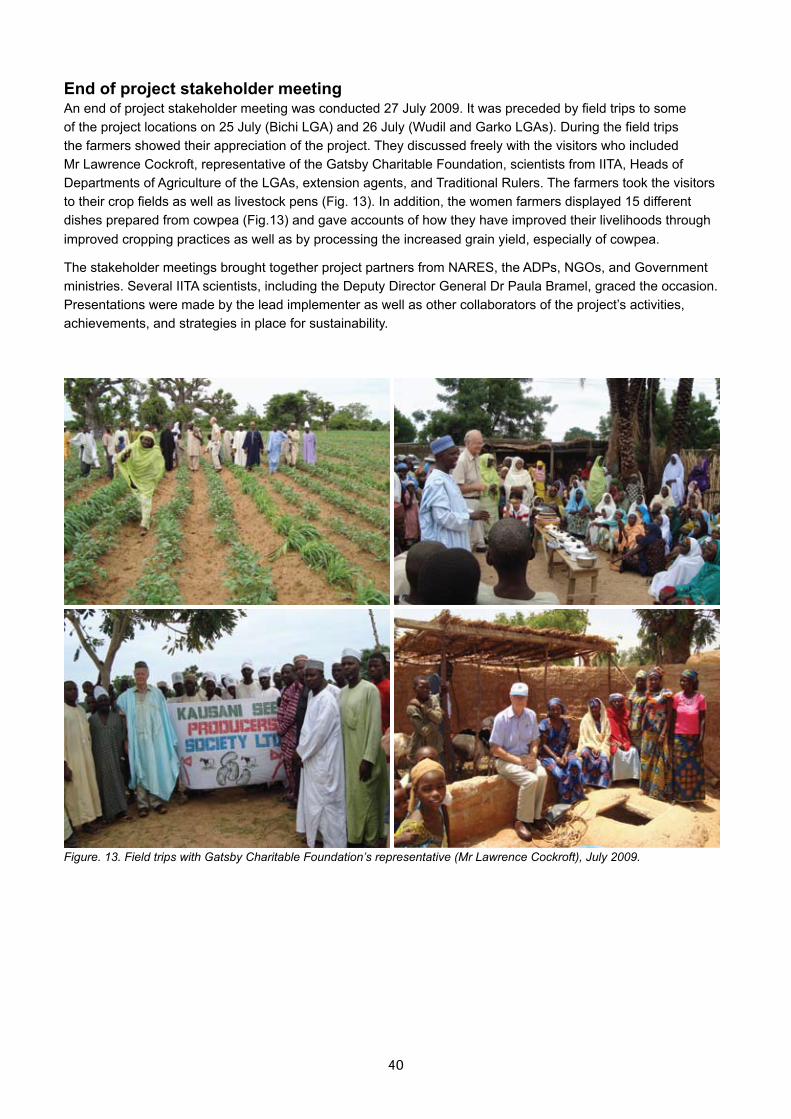
40 41
End of project stakeholder meetingAn end of project stakeholder meeting was conducted 27 July 2009. It was preceded by field trips to some of the project locations on 25 July (Bichi LGA) and 26 July (Wudil and Garko LGAs). During the field trips the farmers showed their appreciation of the project. They discussed freely with the visitors who included Mr Lawrence Cockroft, representative of the Gatsby Charitable Foundation, scientists from IITA, Heads of Departments of Agriculture of the LGAs, extension agents, and Traditional Rulers. The farmers took the visitors to their crop fields as well as livestock pens (Fig. 13). In addition, the women farmers displayed 15 different dishes prepared from cowpea (Fig.13) and gave accounts of how they have improved their livelihoods through improved cropping practices as well as by processing the increased grain yield, especially of cowpea.
The stakeholder meetings brought together project partners from NARES, the ADPs, NGOs, and Government ministries. Several IITA scientists, including the Deputy Director General Dr Paula Bramel, graced the occasion. Presentations were made by the lead implementer as well as other collaborators of the project’s activities, achievements, and strategies in place for sustainability.
Figure. 13. Field trips with Gatsby Charitable Foundation’s representative (Mr Lawrence Cockroft), July 2009.
40 41
4. ConclusionA number of distinguished scientists and administrators from national and international institutions visited the project’s activities. They were all highly impressed with the success of the project and the superiority of the new varieties, the cropping system, and the project’s goals and mode of operations. The national partners are pleased with project and several of them are continuing the project’s activities and extending technologies on their own. The Kaduna State ADP, for example has printed an extension guide of the maize–double cowpea strip cropping system (Annex 11) the National Special Program on Food Security (NSPFS) has printed extension materials on seed production of cowpea (Annex 12). NAERLS have extended the strip cropping system to four States in Northwestern Nigeria (Annex 13). AQUADEV in Niger Republic are continuing the project’s modes of operations as well as extending technologies in several other locations. Reports have been received from some of the LGAs who were provided with technical backstopping. The agro-chemical companies networked are also happy and continuing the supply of inputs to farmers. All the participating farmers are extremely happy with the improvement in livelihoods, economic gains, and family food security emanating from the project. Farmer-to-farmer dissemination and diffusion of the technologies demonstrated are continuing and farmers are also adapting and modifying the strip cropping system to fit their peculiar situation. Most of the farmers’ groups formed were able to settle their debts, and the seed producers linked to the seed companies, ADPs, and other projects are producing seeds profitably.
42 43
5. ReferencesAbdoulaye, T. and J. Lowenberg-DeBoer. 2000. Intensification of Sahelian Farming systems: evidence from
Niger. Agricultural Systems, 64: 67–81.
Ajeigbe, H.A. 2003. Effect of planting pattern, crop variety and insecticide on the productivity of cowpea–cereal systems in the savanna zones of West Africa. PhD thesis, Abubakar Tafawa Balewa University, Bauchi, Nigeria.
Ajeigbe, H.A., B.B. Singh, and T.O. Oseni. 2005. Cowpea–cereal intercrop productivity in the Sudan savanna zone of Nigeria as affected by planting pattern, crop variety, and pest management. African Crop Science Journal, 13 (4): 269–279.
Ajeigbe, H.A., T.O. Oseni, and B.B. Singh. 2006. Effect of planting pattern, crop variety and insecticide on the productivity of cowpea–cereal system in the Northern Guinea savanna of Nigeria. Journal of Food, Agriculture and Environment 4(1):101–107.
Ajeigbe, H.A., A.Y. Kamara, and D. Chikoye. 2008. Improved legume–cereals-based cropping systems for improved productivity and natural resource management by resource poor crop–livestock farmers in West Africa. Presented at the Tropentag conference (Tropentag 2008), held at the University of Hohenheim, Germany, 7–9 October.
Alene, A.D. and V.M. Manyong. 2006. Farmer-to-farmer technology diffusion and yield variation among adopters: the case of improved cowpea in northern Nigeria. Agricultural Economics 35: 203–211.
ARC 1980. The nutrient requirement of ruminant livestock. Supplement No 1. Commonwealth Agricultural Bureaux, Slough, UK.
Brent, R.J. 2006. Applied cost–benefit analysis. Edward Edgar Publishing, Second Edition, Cheltenham, UK Northampton. MA, USA. 470 pp.
Fery, R.L. and B.B. Singh. Cowpea genetics: a review of recent literature. Pages 13–19 in in Advances in cowpea research, edited by B.B. Singh, D.R. Mohan Raj, K.L. Dashiell, and L.E.N. Jackai. Co-publication of IITA and JIRCAS. IITA, Ibadan., Nigeria.
Henriet, J., G.A. van Ek., S.F. Blade, and B.B. Singh. 1997. Quantitative assessment of traditional cropping systems in the Sudan savanna of northern Nigeria. I. Rapid survey of prevalent cropping system. Samaru Journal of Agricultural. Research. 14:27–45.
Lambot, C. 2002. Industrial potential of cowpea. Pages 367–375 in Challenges and opportunities for enhancing sustainable cowpea production. edited by C.A. Fatokun, S.A. Tarawali, B.B. Singh, P.M. Kormawa, and M. Tamo. Proceedings of the World Cowpea Conference III held at the International Institute of Tropical Agriculture (IITA), Ibadan, Nigeria, 4–8 September 2002. IITA, Ibadan, Nigeria.
Lowenberg-DeBoer, J., T. Abdoulaye, and D. Kaboré. 1994. The opportunity cost of capital for agriculture in the Sahel: Case study evidence from Niger and Burkina Faso. Purdue University, Department of Agricultural Economics, Staff Paper 94-2, West Lafayette, Ind., USA.
Mortimore, M.J., B.B. Singh, F. Harris, and S.F. Blade. 1997. Cowpea in traditional cropping systems. In: Advances in cowpea research, edited by B.B. Singh, D.R Mohan Raj, K.L. Dashiell, and L.E.N. Jackai. Co-publication of IITA and JIRCAS. IITA, Ibadan, Nigeria.
Owen, E. 1994. Cereal crop residues as feed for goats and sheep. Livestock Research for Rural Development 6(1).
Owen, E. and M.C.N. Jayasuriaya. 1989. Use of crop residues as animal feeds in developing countries: a review. Research and Development in Agriculture, 6(3):124–138.
42 43
Russo, S.L. 1990. The use of crop residues for livestock feed by small farmers in the Gambia. Pages 165–185 in: Utilization of research results on forage and agricultural by-product materials as animal feed resources in Africa, edited by B.H. Dzowela, Asrat Wendem-Agenehu, and J.A. Ketegile. Proceedings of the first joint workshop, held 5–9 December 1988, Lilongwe, Malawi. PANESA/ARNAB, International Livestock Centre for Africa, (ILRI) Addis Ababa, Ethiopia.
Sanginga, N., K.E. Dashiell, J. Diels, B. Vanlauwe, O. Lyasse, R.J. Carsky, S. Tarawali, B. Asafo-Adjei, A. Menkir, S. Schulz, B.B. Singh, D. Chikoye, D. Keatinge, and R. Ortiz. 2003. Sustainable resource management coupled to resilient germplasm to provide new intensive cereal–grain legume–livestock systems in the dry savanna. Agriculture Ecosystems and Environment, 100: 305–314.
Singh, B.B., H.A. Ajeigbe, S.A. Tarawali, S. Fernandez-Rivera, and M. Abubakar. 2003. Improving the production and utilization of cowpea as food and fodder. Field Crops Research, 84: 169–177.
Singh, B.B. 2001. Genetic variability for physical properties of cowpea seeds and their effect on cooking quality. African Crop Science Conference Proceedings, Vol. 5: 43–46.
Singh, B.B. and H.A. Ajeigbe. 2007. Improved cowpea–cereals-based cropping systems for household food security and poverty reduction in West Africa. Journal of Crop Improvement, 19(1/2): 157–172.
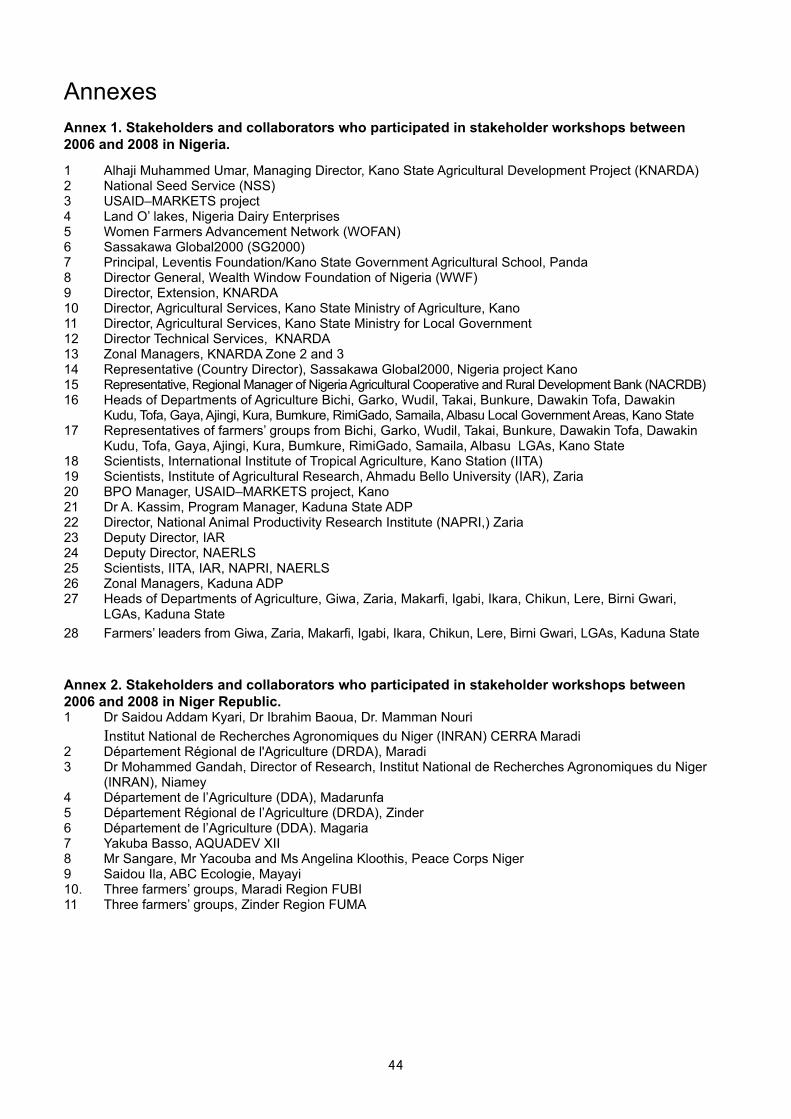
44 45
AnnexesAnnex 1. Stakeholders and collaborators who participated in stakeholder workshops between 2006 and 2008 in Nigeria.
1 Alhaji Muhammed Umar, Managing Director, Kano State Agricultural Development Project (KNARDA)2 National Seed Service (NSS)3 USAID–MARKETS project4 Land O’ lakes, Nigeria Dairy Enterprises5 Women Farmers Advancement Network (WOFAN)6 Sassakawa Global2000 (SG2000)7 Principal, Leventis Foundation/Kano State Government Agricultural School, Panda8 Director General, Wealth Window Foundation of Nigeria (WWF) 9 Director, Extension, KNARDA10 Director, Agricultural Services, Kano State Ministry of Agriculture, Kano11 Director, Agricultural Services, Kano State Ministry for Local Government12 Director Technical Services, KNARDA13 Zonal Managers, KNARDA Zone 2 and 314 Representative (Country Director), Sassakawa Global2000, Nigeria project Kano15 Representative, Regional Manager of Nigeria Agricultural Cooperative and Rural Development Bank (NACRDB)16 Heads of Departments of Agriculture Bichi, Garko, Wudil, Takai, Bunkure, Dawakin Tofa, Dawakin Kudu, Tofa, Gaya, Ajingi, Kura, Bumkure, RimiGado, Samaila, Albasu Local Government Areas, Kano State17 Representatives of farmers’ groups from Bichi, Garko, Wudil, Takai, Bunkure, Dawakin Tofa, Dawakin Kudu, Tofa, Gaya, Ajingi, Kura, Bumkure, RimiGado, Samaila, Albasu LGAs, Kano State18 Scientists, International Institute of Tropical Agriculture, Kano Station (IITA)19 Scientists, Institute of Agricultural Research, Ahmadu Bello University (IAR), Zaria20 BPO Manager, USAID–MARKETS project, Kano21 Dr A. Kassim, Program Manager, Kaduna State ADP22 Director, National Animal Productivity Research Institute (NAPRI,) Zaria 23 Deputy Director, IAR24 Deputy Director, NAERLS25 Scientists, IITA, IAR, NAPRI, NAERLS26 Zonal Managers, Kaduna ADP27 Heads of Departments of Agriculture, Giwa, Zaria, Makarfi, Igabi, Ikara, Chikun, Lere, Birni Gwari, LGAs, Kaduna State28 Farmers’ leaders from Giwa, Zaria, Makarfi, Igabi, Ikara, Chikun, Lere, Birni Gwari, LGAs, Kaduna State
Annex 2. Stakeholders and collaborators who participated in stakeholder workshops between 2006 and 2008 in Niger Republic.1 Dr Saidou Addam Kyari, Dr Ibrahim Baoua, Dr. Mamman Nouri Institut National de Recherches Agronomiques du Niger (INRAN) CERRA Maradi2 Département Régional de l'Agriculture (DRDA), Maradi3 Dr Mohammed Gandah, Director of Research, Institut National de Recherches Agronomiques du Niger (INRAN), Niamey4 Département de l’Agriculture (DDA), Madarunfa 5 Département Régional de l’Agriculture (DRDA), Zinder 6 Département de l’Agriculture (DDA). Magaria7 Yakuba Basso, AQUADEV XII 8 Mr Sangare, Mr Yacouba and Ms Angelina Kloothis, Peace Corps Niger9 Saidou Ila, ABC Ecologie, Mayayi10. Three farmers’ groups, Maradi Region FUBI11 Three farmers’ groups, Zinder Region FUMA
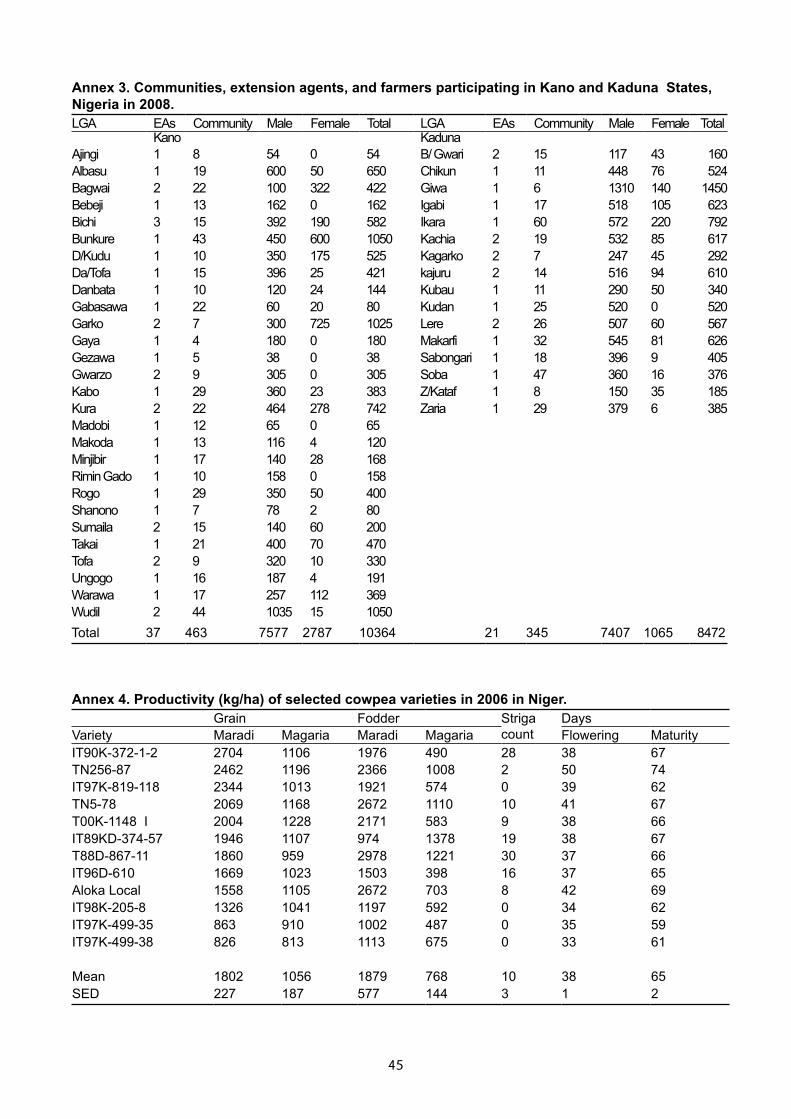
44 45
Annex 3. Communities, extension agents, and farmers participating in Kano and Kaduna States, Nigeria in 2008.LGA EAs Community Male Female Total LGA EAs Community Male Female Total
Kano KadunaAjingi 1 8 54 0 54 B/ Gwari 2 15 117 43 160Albasu 1 19 600 50 650 Chikun 1 11 448 76 524Bagwai 2 22 100 322 422 Giwa 1 6 1310 140 1450Bebeji 1 13 162 0 162 Igabi 1 17 518 105 623Bichi 3 15 392 190 582 Ikara 1 60 572 220 792Bunkure 1 43 450 600 1050 Kachia 2 19 532 85 617D/Kudu 1 10 350 175 525 Kagarko 2 7 247 45 292Da/Tofa 1 15 396 25 421 kajuru 2 14 516 94 610Danbata 1 10 120 24 144 Kubau 1 11 290 50 340Gabasawa 1 22 60 20 80 Kudan 1 25 520 0 520Garko 2 7 300 725 1025 Lere 2 26 507 60 567Gaya 1 4 180 0 180 Makarfi 1 32 545 81 626Gezawa 1 5 38 0 38 Sabongari 1 18 396 9 405Gwarzo 2 9 305 0 305 Soba 1 47 360 16 376Kabo 1 29 360 23 383 Z/Kataf 1 8 150 35 185Kura 2 22 464 278 742 Zaria 1 29 379 6 385Madobi 1 12 65 0 65Makoda 1 13 116 4 120Minjibir 1 17 140 28 168Rimin Gado 1 10 158 0 158Rogo 1 29 350 50 400Shanono 1 7 78 2 80Sumaila 2 15 140 60 200Takai 1 21 400 70 470Tofa 2 9 320 10 330Ungogo 1 16 187 4 191Warawa 1 17 257 112 369Wudil 2 44 1035 15 1050Total 37 463 7577 2787 10364 21 345 7407 1065 8472
Annex 4. Productivity (kg/ha) of selected cowpea varieties in 2006 in Niger. Grain Fodder Striga
countDays
Variety Maradi Magaria Maradi Magaria Flowering MaturityIT90K-372-1-2 2704 1106 1976 490 28 38 67TN256-87 2462 1196 2366 1008 2 50 74IT97K-819-118 2344 1013 1921 574 0 39 62TN5-78 2069 1168 2672 1110 10 41 67T00K-1148 I 2004 1228 2171 583 9 38 66IT89KD-374-57 1946 1107 974 1378 19 38 67T88D-867-11 1860 959 2978 1221 30 37 66IT96D-610 1669 1023 1503 398 16 37 65Aloka Local 1558 1105 2672 703 8 42 69IT98K-205-8 1326 1041 1197 592 0 34 62IT97K-499-35 863 910 1002 487 0 35 59IT97K-499-38 826 813 1113 675 0 33 61
Mean 1802 1056 1879 768 10 38 65SED 227 187 577 144 3 1 2
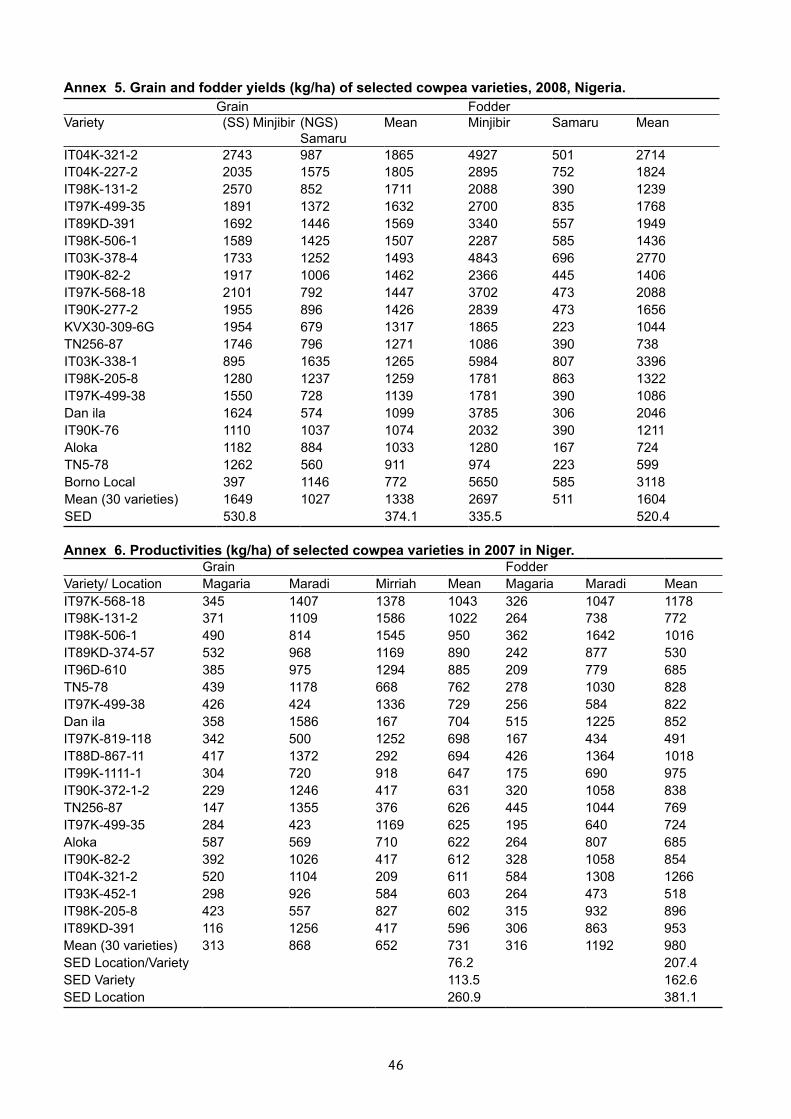
46 47
Annex 5. Grain and fodder yields (kg/ha) of selected cowpea varieties, 2008, Nigeria.Grain Fodder
Variety (SS) Minjibir (NGS) Samaru
Mean Minjibir Samaru Mean
IT04K-321-2 2743 987 1865 4927 501 2714IT04K-227-2 2035 1575 1805 2895 752 1824IT98K-131-2 2570 852 1711 2088 390 1239IT97K-499-35 1891 1372 1632 2700 835 1768IT89KD-391 1692 1446 1569 3340 557 1949IT98K-506-1 1589 1425 1507 2287 585 1436IT03K-378-4 1733 1252 1493 4843 696 2770IT90K-82-2 1917 1006 1462 2366 445 1406IT97K-568-18 2101 792 1447 3702 473 2088IT90K-277-2 1955 896 1426 2839 473 1656KVX30-309-6G 1954 679 1317 1865 223 1044TN256-87 1746 796 1271 1086 390 738IT03K-338-1 895 1635 1265 5984 807 3396IT98K-205-8 1280 1237 1259 1781 863 1322IT97K-499-38 1550 728 1139 1781 390 1086Dan ila 1624 574 1099 3785 306 2046IT90K-76 1110 1037 1074 2032 390 1211Aloka 1182 884 1033 1280 167 724TN5-78 1262 560 911 974 223 599Borno Local 397 1146 772 5650 585 3118Mean (30 varieties) 1649 1027 1338 2697 511 1604SED 530.8 374.1 335.5 520.4
Annex 6. Productivities (kg/ha) of selected cowpea varieties in 2007 in Niger. Grain Fodder
Variety/ Location Magaria Maradi Mirriah Mean Magaria Maradi MeanIT97K-568-18 345 1407 1378 1043 326 1047 1178IT98K-131-2 371 1109 1586 1022 264 738 772IT98K-506-1 490 814 1545 950 362 1642 1016IT89KD-374-57 532 968 1169 890 242 877 530IT96D-610 385 975 1294 885 209 779 685TN5-78 439 1178 668 762 278 1030 828IT97K-499-38 426 424 1336 729 256 584 822Dan ila 358 1586 167 704 515 1225 852IT97K-819-118 342 500 1252 698 167 434 491IT88D-867-11 417 1372 292 694 426 1364 1018IT99K-1111-1 304 720 918 647 175 690 975IT90K-372-1-2 229 1246 417 631 320 1058 838TN256-87 147 1355 376 626 445 1044 769IT97K-499-35 284 423 1169 625 195 640 724Aloka 587 569 710 622 264 807 685IT90K-82-2 392 1026 417 612 328 1058 854IT04K-321-2 520 1104 209 611 584 1308 1266IT93K-452-1 298 926 584 603 264 473 518IT98K-205-8 423 557 827 602 315 932 896IT89KD-391 116 1256 417 596 306 863 953Mean (30 varieties) 313 868 652 731 316 1192 980SED Location/Variety 76.2 207.4SED Variety 113.5 162.6SED Location 260.9 381.1
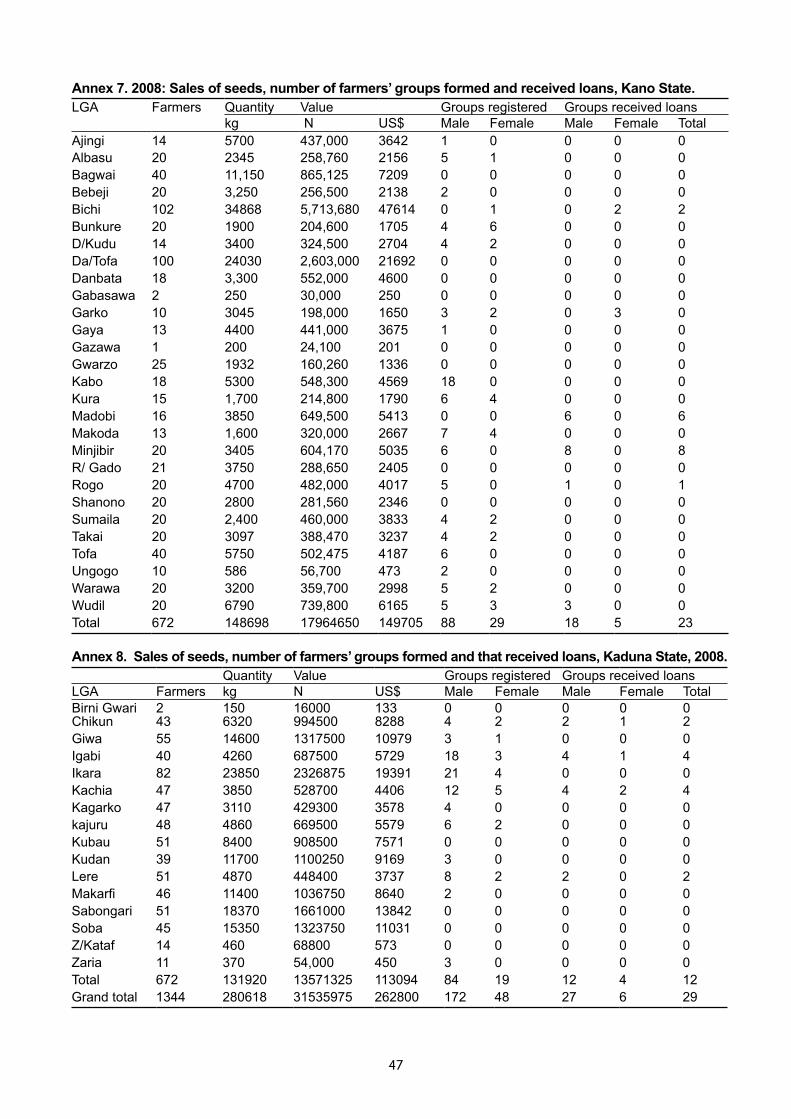
46 47
Annex 7. 2008: Sales of seeds, number of farmers’ groups formed and received loans, Kano State.LGA Farmers Quantity Value Groups registered Groups received loans
kg N US$ Male Female Male Female TotalAjingi 14 5700 437,000 3642 1 0 0 0 0Albasu 20 2345 258,760 2156 5 1 0 0 0Bagwai 40 11,150 865,125 7209 0 0 0 0 0Bebeji 20 3,250 256,500 2138 2 0 0 0 0Bichi 102 34868 5,713,680 47614 0 1 0 2 2Bunkure 20 1900 204,600 1705 4 6 0 0 0D/Kudu 14 3400 324,500 2704 4 2 0 0 0Da/Tofa 100 24030 2,603,000 21692 0 0 0 0 0Danbata 18 3,300 552,000 4600 0 0 0 0 0Gabasawa 2 250 30,000 250 0 0 0 0 0Garko 10 3045 198,000 1650 3 2 0 3 0Gaya 13 4400 441,000 3675 1 0 0 0 0Gazawa 1 200 24,100 201 0 0 0 0 0Gwarzo 25 1932 160,260 1336 0 0 0 0 0Kabo 18 5300 548,300 4569 18 0 0 0 0Kura 15 1,700 214,800 1790 6 4 0 0 0Madobi 16 3850 649,500 5413 0 0 6 0 6Makoda 13 1,600 320,000 2667 7 4 0 0 0Minjibir 20 3405 604,170 5035 6 0 8 0 8R/ Gado 21 3750 288,650 2405 0 0 0 0 0Rogo 20 4700 482,000 4017 5 0 1 0 1Shanono 20 2800 281,560 2346 0 0 0 0 0Sumaila 20 2,400 460,000 3833 4 2 0 0 0Takai 20 3097 388,470 3237 4 2 0 0 0Tofa 40 5750 502,475 4187 6 0 0 0 0Ungogo 10 586 56,700 473 2 0 0 0 0Warawa 20 3200 359,700 2998 5 2 0 0 0Wudil 20 6790 739,800 6165 5 3 3 0 0Total 672 148698 17964650 149705 88 29 18 5 23
Annex 8. Sales of seeds, number of farmers’ groups formed and that received loans, Kaduna State, 2008.Quantity Value Groups registered Groups received loans
LGA Farmers kg N US$ Male Female Male Female TotalBirni Gwari 2 150 16000 133 0 0 0 0 0Chikun 43 6320 994500 8288 4 2 2 1 2Giwa 55 14600 1317500 10979 3 1 0 0 0Igabi 40 4260 687500 5729 18 3 4 1 4Ikara 82 23850 2326875 19391 21 4 0 0 0Kachia 47 3850 528700 4406 12 5 4 2 4Kagarko 47 3110 429300 3578 4 0 0 0 0kajuru 48 4860 669500 5579 6 2 0 0 0Kubau 51 8400 908500 7571 0 0 0 0 0Kudan 39 11700 1100250 9169 3 0 0 0 0Lere 51 4870 448400 3737 8 2 2 0 2Makarfi 46 11400 1036750 8640 2 0 0 0 0Sabongari 51 18370 1661000 13842 0 0 0 0 0Soba 45 15350 1323750 11031 0 0 0 0 0Z/Kataf 14 460 68800 573 0 0 0 0 0Zaria 11 370 54,000 450 3 0 0 0 0Total 672 131920 13571325 113094 84 19 12 4 12Grand total 1344 280618 31535975 262800 172 48 27 6 29
48 49
Annex 9. Estimated internal rate of return (IRR) at different discount rates and adoption level scenarios for each State.Discount rate
Internal Rate of Return (IIR)
25% of adoption of the Package
50% of adoption of the Package
75% of adoption of the Package
Adoption of the full Package/maximum yield
KANO KADUNA ALL KANO KADUNA ALL KANO KADUNA ALL KANO KADUNA ALL10% 120% 143% 131% 268% 337% 301% 454% 599% 528% 722% 989% 873%15% 110% 132% 121% 252% 318% 284% 430% 568% 501% 686% 941% 831%20% 101% 123% 112% 237% 301% 268% 408% 540% 476% 653% 898% 792%25% 93% 114% 103% 223% 285% 253% 388% 515% 453% 623% 858% 756%50% 61% 78% 69% 170% 221% 194% 306% 412% 361% 503% 698% 614%100% 21% 34% 27% 102% 140% 121% 205% 284% 246% 352% 499% 435%
Annex 10. Letter from Department of Agriculture Ningi LGA about progress in the LGA.
Agric DepartmentNingi Local GovernmentBauchi State31/12/2009.
Dr. Hakeem AjeigbeIITA KanoKano State.
Dear Sir,PROGRESS REPORT 2009
I would like to summit my progress report for the year 2009. The report is as follows:-
1). Training: During the period we have received series of training from the Officer-in-Charge of cowpea production IITA Kano. The training includes site selection, planting techniques, weeding, chemical application (pest control), harvesting and storage. The training was conducted for stakeholders, extension agents and farmers. One hundred and fifty (150) farmers were trained in the 18 wards at the LGA headquarters.2). Marketing of Cowpea: About 50% of the cowpea produces in the LGA the source is from IITA Kano office. All the markets in the LGA IITA cowpea is available for sale at the cost of N150.00 per/mudu and N9,000.00 per bag. Most of the people are buying the cowpea for there food. It’s cooked and eaten with groundnut cake, rice and beans, moi-moi etc.3). Number of Farmers: One hundred and fifty farmers are in the Programme were each is given 8kg of cowpea and chemicals at subsidizing rate. Today over 2,000 (two thousand farmers) are secondary farmers who received training and purchase seeds from our primary farmers. The production is beyond our Local Government. It was expand to Ganjuma, Darazo, Bauchi and Toro LGA’s due to field day conducted at Ningi and air out by NTA and Radio Bauchi.4). New Knowledge Received: Storage of cowpea using zero chemicals, 2 in 4 method of planting cereals and cowpea, using organic manure over chemical fertilizer, marketing system of cowpea.5). Source of Seed for Future Planting: Ningi is one of the sources of seed for planting to many farmers in the country.
i. National Seed Agency Abuja.ii. Ministry of Agriculture Bauchi (BSADP).iii. National Livestock Office Bauchi.iv. Cowpea Farmers Association Ningi/Warji LGA.v. Large Scale Farmers.
We are very grateful for all the concern given to us during the reporting period. I hope your organization would give this report due consideration as usual and we are ready to fully collaborate with you in any future endeavor including testing of new varieties of cereals and legumes.
Yours faithfully,
Mohd Sadis AbdussalamFOR: HOD ANR Ningi LGA, Bauchi State
48 49
Annex 11. Extension material produced by Kaduna State ADP.
Annex 12. Extension material produced by National Special Program for Food Security.
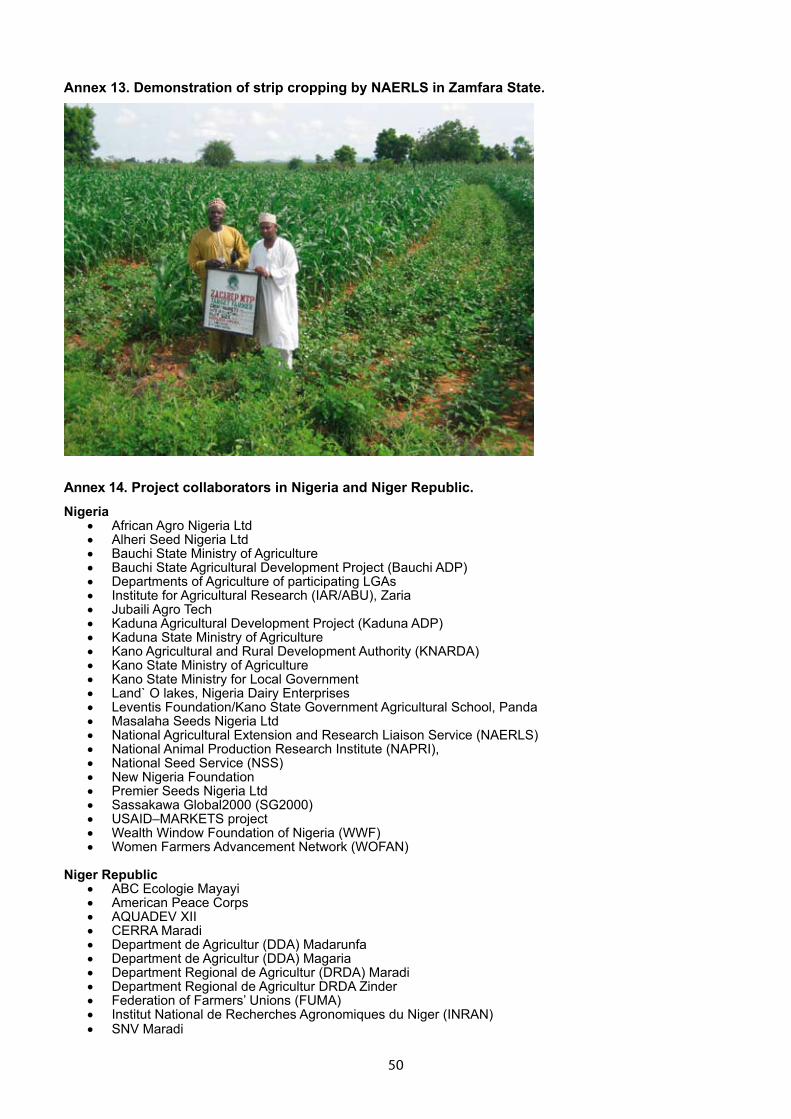
50
Annex 13. Demonstration of strip cropping by NAERLS in Zamfara State.
Annex 14. Project collaborators in Nigeria and Niger Republic.Nigeria
African Agro Nigeria Ltd•Alheri Seed Nigeria Ltd•Bauchi State Ministry of Agriculture•Bauchi State Agricultural Development Project (Bauchi ADP)•Departments of Agriculture of participating LGAs•Institute for Agricultural Research (IAR/ABU), Zaria•Jubaili Agro Tech•Kaduna Agricultural Development Project (Kaduna ADP)•Kaduna State Ministry of Agriculture •Kano Agricultural and Rural Development Authority (KNARDA) •Kano State Ministry of Agriculture•Kano State Ministry for Local Government•Land` O lakes, Nigeria Dairy Enterprises•Leventis Foundation/Kano State Government Agricultural School, Panda•Masalaha Seeds Nigeria Ltd•National Agricultural Extension and Research Liaison Service (NAERLS)•National Animal Production Research Institute (NAPRI), •National Seed Service (NSS)•New Nigeria Foundation•Premier Seeds Nigeria Ltd•Sassakawa Global2000 (SG2000)•USAID–MARKETS project•Wealth Window Foundation of Nigeria (WWF) •Women Farmers Advancement Network (WOFAN)•
Niger RepublicABC Ecologie Mayayi•American Peace Corps •AQUADEV XII •CERRA Maradi•Department de Agricultur (DDA) Madarunfa•Department de Agricultur (DDA) Magaria•Department Regional de Agricultur (DRDA) Maradi•Department Regional de Agricultur DRDA Zinder •Federation of Farmers’ Unions (FUMA)•Institut National de Recherches Agronomiques du Niger (INRAN)•SNV Maradi•