Improved control of the pressure in a cleanroom environment · Improved control of the pressure in...
12
Research Article Indoor/Outdoor Airflow and Air Quality E-mail: [email protected] Improved control of the pressure in a cleanroom environment A.H.T.M. van den Brink 1 , A.W.M. van Schijndel 2 () 1. Kropman Nijmegen / Eindhoven University of Technology, Netherlands 2. Department of the Built Environment (VRT 6.29), Eindhoven University of Technology, P.O. Box 513, 5600 MB Eindhoven, Netherlands Abstract In order to protect cleanrooms from contamination from adjacent less clean spaces, the cleanroom must be built air tight and maintain an (over) pressure of sufficient magnitude and deviation. For this magnitude there are guidelines. However, there is a lack of guidelines for the required deviation of the pressure. As a result, an unstable pressure could result in an undefined air direction and increase the risk of contamination. This unstable pressure occurs especially during entering the cleanroom with an air tight cleanroom. In this paper the pressure and the entrance of the cleanroom are modeled in the SimuLink modeling environment. The model is verified and validated. The main problem addressed here is that the air tightness and the deviation of the pressure are in conflict with each other. It is concluded that the new proposed adjustment decreases the deviation of the pressure in the cleanroom and enhances the precision of control. Keywords cleanroom, pressure, deviation, simulation, SimuLink Article History Received: 24 August 2011 Revised: 23 November 2011 Accepted: 30 January 2012 © Tsinghua University Press and Springer-Verlag Berlin Heidelberg 2012 1 Introduction The International Organization of Standardization defines a cleanroom as a “room in which the concentration of airborne particles is controlled, and which is constructed and used in a manner to minimize the introduction, generation, and retention of particles inside the room, and in which other relevant parameters, e.g. temperature, humidity, and pressure, are controlled as necessary” (ISO 1999). To minimize the introduction of uncontrolled air supply with an undefined number of particles, the cleanroom is maintained at a higher pressure in order to protect the cleanroom from contamination from adjacent less clean spaces (ISO 2001). For this reason and the realization of the required higher static pressure, it is common practice to construct the cleanroom in an air tight manner. The pressure difference between the cleanroom and the adjacent less clean spaces should be of sufficient magnitude and deviation to prevent reversal of airflow direction from that intended (ISO 2001). Here the deviation is defined as the change of the pressure in the cleanroom as a result of a change of mass flow or conductance of the environment. The (recommend) magnitudes of this pressure difference are 5–20 Pa (ISO 2001) for cleanrooms in general, 10–15 Pa according to the Ad Hoc GMP Inspections Services Group (GMP 2003) for the manufacturing of sterile medicinal products and a minimum of 5 Pa (Walenkamp 2005) for an operation room in the Netherlands. However, there is a lack of guidelines for the required deviation of the static pressure, i.e., under which circumstances or disturbances it should be maintained. The main disturbance of the pressure is during entering and leaving the cleanroom. By opening the doors, the pressure differential changes, a reversal of the direction of the airflow is possible and contamination could enter the cleanroom. It is therefore necessary to achieve and maintain a stable pressure under all circumstances. To maintain the pressure differentials during entry and exit, airlocks are normally required (ISO 2001). It is not allowed to open both doors of the airlock simultaneously. For this reason, the airlock is often equipped with an interlock system. This ensures that BUILD SIMUL (2012) 5: 61 – 72 DOI 10.1007/s12273-012-0065-8
Transcript of Improved control of the pressure in a cleanroom environment · Improved control of the pressure in...
Research Article
Indoor/Outdoor A
irflow
and Air Q
uality
E-mail: [email protected]
Improved control of the pressure in a cleanroom environment
A.H.T.M. van den Brink1, A.W.M. van Schijndel2 ()
1. Kropman Nijmegen / Eindhoven University of Technology, Netherlands 2. Department of the Built Environment (VRT 6.29), Eindhoven University of Technology, P.O. Box 513, 5600 MB Eindhoven, Netherlands Abstract In order to protect cleanrooms from contamination from adjacent less clean spaces, the cleanroom must be built air tight and maintain an (over) pressure of sufficient magnitude and deviation. For this magnitude there are guidelines. However, there is a lack of guidelines for the required deviation of the pressure. As a result, an unstable pressure could result in an undefined air direction and increase the risk of contamination. This unstable pressure occurs especially during entering the cleanroom with an air tight cleanroom. In this paper the pressure and the entrance of the cleanroom are modeled in the SimuLink modeling environment. The model is verified and validated. The main problem addressed here is that the air tightness and the deviation of the pressure are in conflict with each other. It is concluded that the new proposed adjustment decreases the deviation of the pressure in the cleanroom and enhances the precision of control.
Keywords cleanroom,
pressure,
deviation,
simulation,
SimuLink Article History Received: 24 August 2011
Revised: 23 November 2011
Accepted: 30 January 2012 © Tsinghua University Press and
Springer-Verlag Berlin Heidelberg
2012
1 Introduction
The International Organization of Standardization defines a cleanroom as a “room in which the concentration of airborne particles is controlled, and which is constructed and used in a manner to minimize the introduction, generation, and retention of particles inside the room, and in which other relevant parameters, e.g. temperature, humidity, and pressure, are controlled as necessary” (ISO 1999). To minimize the introduction of uncontrolled air supply with an undefined number of particles, the cleanroom is maintained at a higher pressure in order to protect the cleanroom from contamination from adjacent less clean spaces (ISO 2001). For this reason and the realization of the required higher static pressure, it is common practice to construct the cleanroom in an air tight manner. The pressure difference between the cleanroom and the adjacent less clean spaces should be of sufficient magnitude and deviation to prevent reversal of airflow direction from that intended (ISO 2001). Here the deviation is defined as the change of
the pressure in the cleanroom as a result of a change of mass flow or conductance of the environment. The (recommend) magnitudes of this pressure difference are 5–20 Pa (ISO 2001) for cleanrooms in general, 10–15 Pa according to the Ad Hoc GMP Inspections Services Group (GMP 2003) for the manufacturing of sterile medicinal products and a minimum of 5 Pa (Walenkamp 2005) for an operation room in the Netherlands. However, there is a lack of guidelines for the required deviation of the static pressure, i.e., under which circumstances or disturbances it should be maintained. The main disturbance of the pressure is during entering and leaving the cleanroom. By opening the doors, the pressure differential changes, a reversal of the direction of the airflow is possible and contamination could enter the cleanroom. It is therefore necessary to achieve and maintain a stable pressure under all circumstances. To maintain the pressure differentials during entry and exit, airlocks are normally required (ISO 2001). It is not allowed to open both doors of the airlock simultaneously. For this reason, the airlock is often equipped with an interlock system. This ensures that
BUILD SIMUL (2012) 5: 61–72 DOI 10.1007/s12273-012-0065-8

van den Brink and van Schijndel / Building Simulation / Vol. 5, No. 1 62
List of symbols
AR adjustment range (kg/s) E energy (J) Eerror error integral (Pa2·s) G conductivity (h–1) h enthalpy (J/(kg·K)) k conductance (kg½·m½)
m mass (kg) m mass flow (kg/s) n exponent p pressure (Pa) Δp pressure difference (Pa) R gas constant of air (Pa·m3/(kg·K)) t time (s) T temperature (K) TT transit time (s) V volume (m3) V volume flow (m3/s) τ time (s)
Subspripts
0 the surroundings 1 the cleanroom 2 the airlock 12 between/from the cleanroom and/to the airlock 10 between/from the cleanroom and/to the airlock 20 between/from the airlock and/to the surroundingⅠ, Ⅱ, Ⅲ, … count number dr door set setpoint sp leakage areas, openings in the area of the room in incoming control control out outgoing variable variable constant constant
the first door is closed before the second door can be opened during both entry and exit of the cleanroom. In case where the cleanroom is equipped with an active pressure control, the door from the airlock to the cleanroom is connected with the control unit. The controller is frozen during the time that the door is open, i.e., it takes no action.
The importance of a good and stable pressure difference is shown by means of the tests during the commissioning and the validation of the cleanroom (ISO 2000). It is considered one of the three standard tests next to the particle count and the airflow volume of the supply air (ISO 2000). According to the Institute of Environmental Sciences and Technology, (IEST 2001) the measurement of the pressure difference is a primary test. The pressure difference between the cleanroom and its surroundings environment should be measured and recorded with all doors closed (IEST 2001; ISO 2005). During operation, the maximum time interval for the air pressure difference test of a general cleanroom is advised to be 12 months (ISO 2000). The manufacturing of sterile medicinal products requires that the pressure differences should be recorded regularly or otherwise documented (GMP 2003). In case of an operation room in the Netherlands, the pressure difference must be measured continuously (Walenkamp 2005). However, the impact on the pressure in the cleanroom during entry is undefined. The tolerated difference in daily practice is about 3–4 Pa during a short time.
Recent literature regarding cleanrooms focuses on energy issues (Kircher et al. 2010; Xu 2008; Hu et al. 2008), detailed
distributed parameters studies of airflow, temperature, and contamination (Lin et al. 2011; Yang and Fu 2002; Saidi et al. 2011; Noh et al. 2005; Shih et al. 2009) and fan-filters (Xu et al. 2007; Chen et al. 2007).
In addition to this recent work, this paper addresses the above mentioned problem of pressure deviations during the entrance of cleanrooms with the focus on pressure control. The reader should notice that our methodology is based on uniform pressure distributions in the rooms. However, in reality, this is not the case. Moreover, the amount of contamination that passes through the open door also depends on temperature difference across the door before it is opened, movement of people, and on the time span the door stays open. These three-dimensional pollutant transport effects are beyond the scope of this paper.
The objective of this work is to research the possibilities to achieve the cleanroom with the required air tightness and a small deviation of the pressure and as a result, an improved control during the entry of the cleanroom.
The paper is organized as follows: In Section 2 the models for the dynamic pressure in a cleanroom and the accompanying controllers are presented. Section 3 shows the verification using mass balances and the comparison with measurements. Section 4 presents a new design concept by placing a by-pass duct that improves the pressure control. In Section 5 the models are used to optimize the cleanroom in order to improve the performance of the controllers. The conclusions are described in Section 6.
van den Brink and van Schijndel / Building Simulation / Vol. 5, No. 1
63
2 Cleanroom and pressure controller model
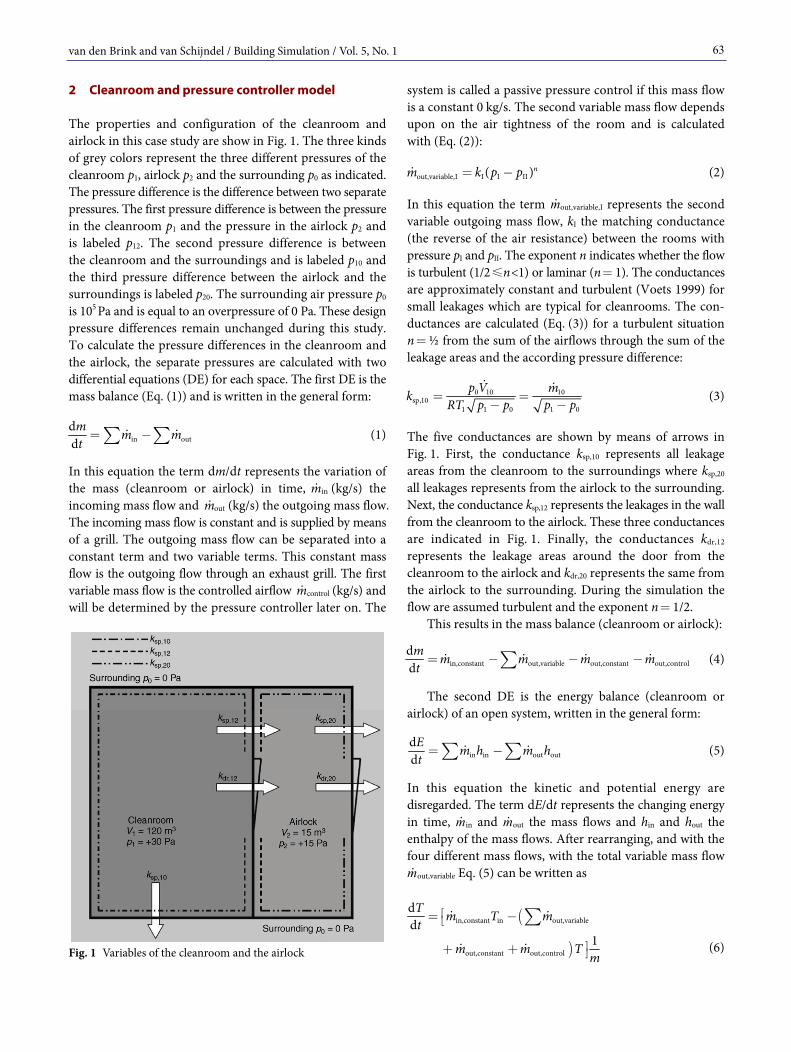
The properties and configuration of the cleanroom and airlock in this case study are show in Fig. 1. The three kinds of grey colors represent the three different pressures of the cleanroom p1, airlock p2 and the surrounding p0 as indicated. The pressure difference is the difference between two separate pressures. The first pressure difference is between the pressure in the cleanroom p1 and the pressure in the airlock p2 and is labeled p12. The second pressure difference is between the cleanroom and the surroundings and is labeled p10 and the third pressure difference between the airlock and the surroundings is labeled p20. The surrounding air pressure p0 is 105 Pa and is equal to an overpressure of 0 Pa. These design pressure differences remain unchanged during this study. To calculate the pressure differences in the cleanroom and the airlock, the separate pressures are calculated with two differential equations (DE) for each space. The first DE is the mass balance (Eq. (1)) and is written in the general form:
in outddm m mt= -å å (1)
In this equation the term dm/dt represents the variation of the mass (cleanroom or airlock) in time, m in (kg/s) the incoming mass flow and m out (kg/s) the outgoing mass flow. The incoming mass flow is constant and is supplied by means of a grill. The outgoing mass flow can be separated into a constant term and two variable terms. This constant mass flow is the outgoing flow through an exhaust grill. The first variable mass flow is the controlled airflow m control (kg/s) and will be determined by the pressure controller later on. The
Fig. 1 Variables of the cleanroom and the airlock
system is called a passive pressure control if this mass flow is a constant 0 kg/s. The second variable mass flow depends upon on the air tightness of the room and is calculated with (Eq. (2)):
out,variable,I I I II( )nm k p p= - (2)
In this equation the term m out,variable,I represents the second variable outgoing mass flow, kI the matching conductance (the reverse of the air resistance) between the rooms with pressure pI and pII. The exponent n indicates whether the flow is turbulent (1/2≤n <1) or laminar (n= 1). The conductances are approximately constant and turbulent (Voets 1999) for small leakages which are typical for cleanrooms. The con- ductances are calculated (Eq. (3)) for a turbulent situation n= ½ from the sum of the airflows through the sum of the leakage areas and the according pressure difference:
0 10 10sp,10
1 1 0 1 0
p V mk RT p p p p= =- -
(3)
The five conductances are shown by means of arrows in Fig. 1. First, the conductance ksp,10 represents all leakage areas from the cleanroom to the surroundings where ksp,20 all leakages represents from the airlock to the surrounding. Next, the conductance ksp,12 represents the leakages in the wall from the cleanroom to the airlock. These three conductances are indicated in Fig. 1. Finally, the conductances kdr,12 represents the leakage areas around the door from the cleanroom to the airlock and kdr,20 represents the same from the airlock to the surrounding. During the simulation the flow are assumed turbulent and the exponent n= 1/2.
This results in the mass balance (cleanroom or airlock):
in,constant out,variable out,constant out,controlddm m m m mt= - - -å (4)
The second DE is the energy balance (cleanroom or airlock) of an open system, written in the general form:
in in out outddE m h m ht= -å å (5)
In this equation the kinetic and potential energy are disregarded. The term dE/dt represents the changing energy in time, m in and m out the mass flows and hin and hout the enthalpy of the mass flows. After rearranging, and with the four different mass flows, with the total variable mass flow m out,variable Eq. (5) can be written as
(
)
in,constant in out,variable
out,constant out,control
dd
1
T m T mt
m m T m
é= -ë
ù+ + û
å
(6)
van den Brink and van Schijndel / Building Simulation / Vol. 5, No. 1 64
In this equation the term dT/dt represents the changing temperature in the cleanroom, T the temperature and m the mass. The effect of the changing mass on the thermal capacity is neglected. The pressure in a room is calculated with the ideal-gas relation of Boyle-Gay Lussac (Eq. (7)).
pV mRT= (7)
In this equation V represents the volume of the room and R the gas constant of air. With the combination of Eqs. (4), (6) and (7), the pressure is calculated as a function of time, mass and temperature (Eq. (8)):
( ) ( )( )
m t T t Rp tV
= (8)
The DE’s are coupled through the variable mass flows. These equations are programmed within SimuLink.
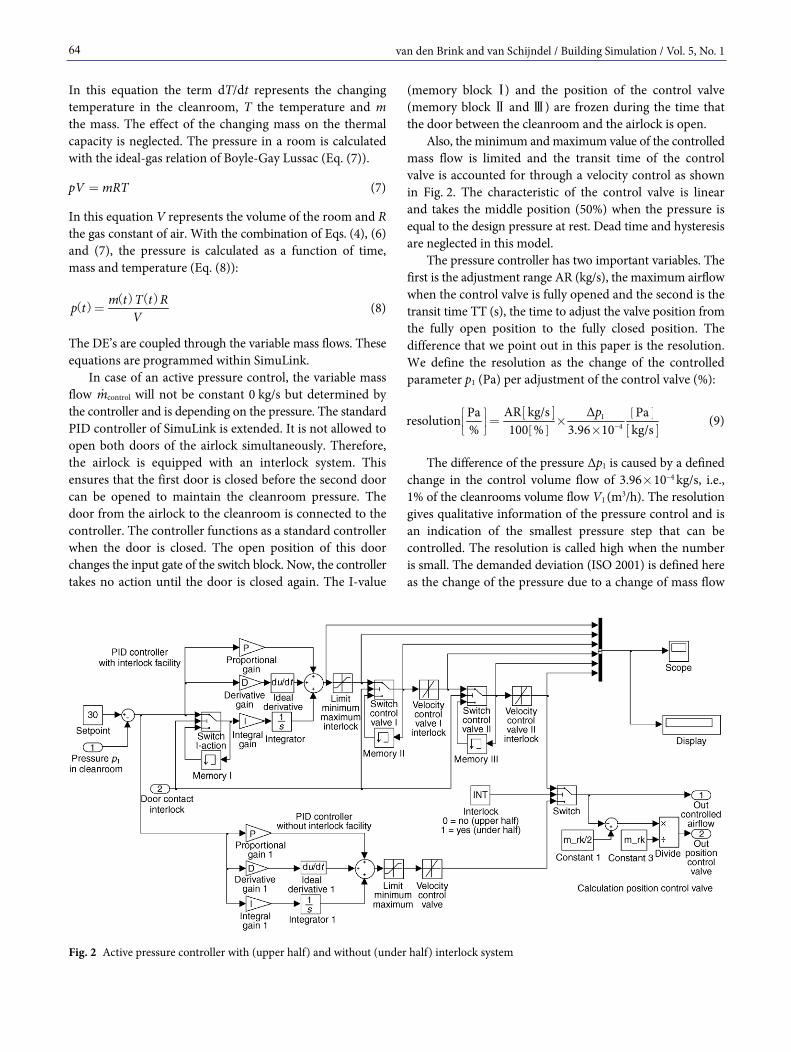
In case of an active pressure control, the variable mass flow m control will not be constant 0 kg/s but determined by the controller and is depending on the pressure. The standard PID controller of SimuLink is extended. It is not allowed to open both doors of the airlock simultaneously. Therefore, the airlock is equipped with an interlock system. This ensures that the first door is closed before the second door can be opened to maintain the cleanroom pressure. The door from the airlock to the cleanroom is connected to the controller. The controller functions as a standard controller when the door is closed. The open position of this door changes the input gate of the switch block. Now, the controller takes no action until the door is closed again. The I-value
(memory block Ⅰ) and the position of the control valve (memory block Ⅱ and Ⅲ) are frozen during the time that the door between the cleanroom and the airlock is open.
Also, the minimum and maximum value of the controlled mass flow is limited and the transit time of the control valve is accounted for through a velocity control as shown in Fig. 2. The characteristic of the control valve is linear and takes the middle position (50%) when the pressure is equal to the design pressure at rest. Dead time and hysteresis are neglected in this model.
The pressure controller has two important variables. The first is the adjustment range AR (kg/s), the maximum airflow when the control valve is fully opened and the second is the transit time TT (s), the time to adjust the valve position from the fully open position to the fully closed position. The difference that we point out in this paper is the resolution. We define the resolution as the change of the controlled parameter p1 (Pa) per adjustment of the control valve (%):
[ ][ ]
[ ]
[ ]1
4AR kg/s ΔPa Paresolution
% 100 % 3.96 10 kg/spé ù = ´ê ú ´ë û
(9)
The difference of the pressure Δp1 is caused by a defined change in the control volume flow of 3.96´10–4 kg/s, i.e., 1% of the cleanrooms volume flow V1 (m3/h). The resolution gives qualitative information of the pressure control and is an indication of the smallest pressure step that can be controlled. The resolution is called high when the number is small. The demanded deviation (ISO 2001) is defined here as the change of the pressure due to a change of mass flow
Fig. 2 Active pressure controller with (upper half) and without (under half) interlock system
van den Brink and van Schijndel / Building Simulation / Vol. 5, No. 1
65
or conductance to the environment. The deviation of the pressure is expressed in Eerror (Eq. (10)):
( )( )1
0
2error set 1 d
t
tE p p τ τ= -ò (10)
where pset is the design pressure and p1( )τ the actual pressure in the cleanroom. The square of the difference is integrated from time t0 to t1 and results in the Eerror.
3 Verification and validation
This section describes the verification and validation of the model. The model is verified in Section 3.1 by means of static situations. The model is validated in Section 3.2 by comparing the simulated data with the actual measured data.
3.1 Verification
The model of the cleanroom is verified in five parts and is separated in three stationary and two well defined pressures. The mass balance (Eq. (1)) is used in combination with the mass flow through the leakages (Eq. (2)) to calculate three pressures. The properties of the cleanroom and airlock used for the verification are shown in Table 1 and Fig. 1 shows a schematic drawing of the cleanroom and the airlock. The different grey colors represent the different pressures. The mass flow m 1,in and m 2,in are based on an air change rate, ACH, of 20 h–1 in the cleanroom and the airlock i.e., supply airflow (m3/h) is 20 times the volume V per hour. The mass flows through the conductances (see Table 1) are chosen using realistic values from the practice (ISO 2000). The verification is done in two sequences. The first is opening the door between the airlock and the cleanroom until an equilibrium pressure is maintained. The second is opening the door from the airlock to the surroundings after the door from the airlock to the cleanroom is closed and remains closed.
Scenario one
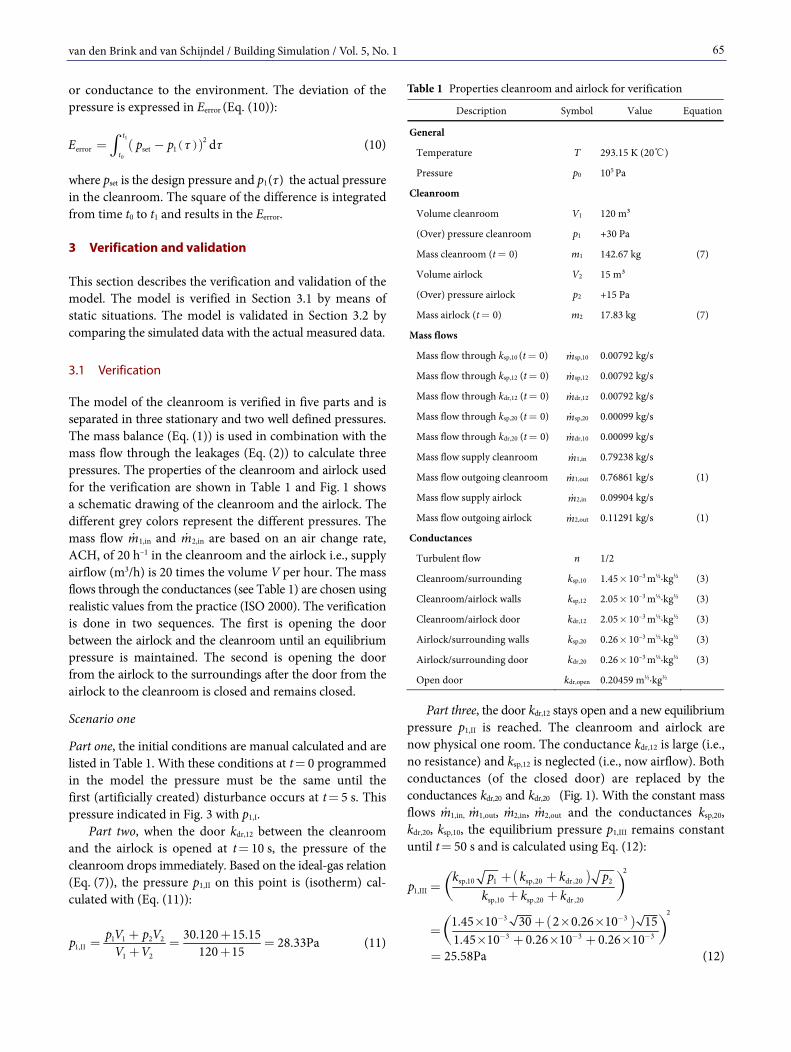
Part one, the initial conditions are manual calculated and are listed in Table 1. With these conditions at t= 0 programmed in the model the pressure must be the same until the first (artificially created) disturbance occurs at t= 5 s. This pressure indicated in Fig. 3 with p1,I.
Part two, when the door kdr,12 between the cleanroom and the airlock is opened at t= 10 s, the pressure of the cleanroom drops immediately. Based on the ideal-gas relation (Eq. (7)), the pressure p1,II on this point is (isotherm) cal- culated with (Eq. (11)):
1 1 2 21,II
1 2
30.120 15.15 28.33Pa120 15p V p Vp V V
+ += = =
+ + (11)
Table 1 Properties cleanroom and airlock for verification
Description Symbol Value Equation
General
Temperature T 293.15 K (20℃)
Pressure p0 105 Pa
Cleanroom
Volume cleanroom V1 120 m3
(Over) pressure cleanroom p1 +30 Pa
Mass cleanroom (t = 0) m1 142.67 kg (7)
Volume airlock V2 15 m3
(Over) pressure airlock p2 +15 Pa
Mass airlock (t = 0) m2 17.83 kg (7)
Mass flows
Mass flow through ksp,10 (t = 0) m sp,10 0.00792 kg/s
Mass flow through ksp,12 (t = 0) m sp,12 0.00792 kg/s
Mass flow through kdr,12 (t = 0) m dr,12 0.00792 kg/s
Mass flow through ksp,20 (t = 0) m sp,20 0.00099 kg/s
Mass flow through kdr,20 (t = 0) m dr,10 0.00099 kg/s
Mass flow supply cleanroom m 1,in 0.79238 kg/s
Mass flow outgoing cleanroom m 1,out 0.76861 kg/s (1)
Mass flow supply airlock m 2,in 0.09904 kg/s
Mass flow outgoing airlock m 2,out 0.11291 kg/s (1)
Conductances
Turbulent flow n 1/2
Cleanroom/surrounding ksp,10 1.45´10–3 m½·kg½ (3)
Cleanroom/airlock walls ksp,12 2.05´10–3 m½·kg½ (3)
Cleanroom/airlock door kdr,12 2.05´10–3 m½·kg½ (3)
Airlock/surrounding walls ksp,20 0.26´10–3 m½·kg½ (3)
Airlock/surrounding door kdr,20 0.26´10–3 m½·kg½ (3)
Open door kdr,open 0.20459 m½·kg½ Part three, the door kdr,12 stays open and a new equilibrium
pressure p1,II is reached. The cleanroom and airlock are now physical one room. The conductance kdr,12 is large (i.e., no resistance) and ksp,12 is neglected (i.e., now airflow). Both conductances (of the closed door) are replaced by the conductances kdr,20 and kdr,20 (Fig. 1). With the constant mass flows m 1,in, m 1,out, m 2,in, m 2,out and the conductances ksp,20, kdr,20, ksp,10, the equilibrium pressure p1,III remains constant until t= 50 s and is calculated using Eq. (12):
( )
( )
2sp,10 1 sp,20 dr,20 2
1,IIIsp,10 sp,20 dr,20
23 3
3 3 31.45 10 30 2 0.26 10 151.45 10 0.26 10 0.26 10
25.58Pa
k p k k pp
k k k- -
- - -
+ +=
+ +
´ + ´ ´=
´ + ´ + ´=
( )
)( (12)
van den Brink and van Schijndel / Building Simulation / Vol. 5, No. 1 66
Fig. 3 Verification of the pressure in the cleanroom
Scenario two
Part four, all doors are closed and the cleanroom and airlock have the initial pressures. The time is t= 0 s. The pressure in the airlock drops to 0 Pa when the door ksp,20 to the surroundings is opened at t= 5 s and thus raises the pressure difference over conductance kdr,12 and ksp,12. This raise causes an increased mass flow and thus a reduction of the pressure in the cleanroom. The new stationary pressure p1,IV is calculated with Eq. (13):
( )
( )
2sp,10 1 dr,12 sp,12 1,2
1,IVsp,10 sp,12 dr,12
23 3
3 3 31.45 10 30 2 2.05 10 151.45 10 2.05 10 2.05 10
18.42Pa
k p k k pp
k k k- -
- - -
+ +=
+ +
´ + ´ ´=
´ + ´ + ´=
)(
)( (13)
Part five, when additionally the door kdr,12 between the airlock and the surrounding is opened at t= 25 s, all doors from cleanroom to corridor are open and the pressure is calculated using door kdr,open between the airlock and the
surrounding. After rearranging Eq. (2), under the assumption that all airflow is flowing through the doors, the pressure p1 in the cleanroom is calculated as follows:
2 23
1,V 20 129.9 10 0.02377 0.015Pa0.20459 0.20459
p p p-´
= + = + =( ) ( )
(14)
The maximum deviation between the calculated values and the results from the simulation is <0.2% for p1,I to p1,IV and <4.7% for p1,V. The last deviation is caused by the assumption that all airflow is flowing only through the doors. The calculated values and Fig. 3 are in good agreement with each other.
3.2 Validation
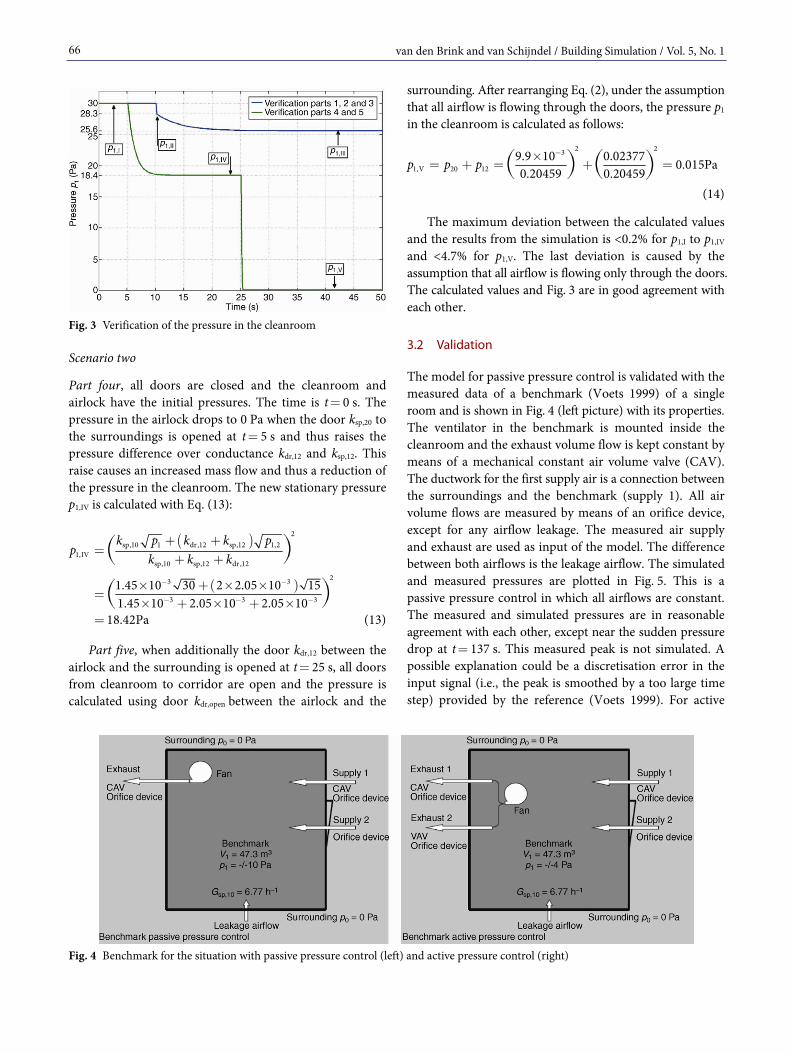
The model for passive pressure control is validated with the measured data of a benchmark (Voets 1999) of a single room and is shown in Fig. 4 (left picture) with its properties. The ventilator in the benchmark is mounted inside the cleanroom and the exhaust volume flow is kept constant by means of a mechanical constant air volume valve (CAV). The ductwork for the first supply air is a connection between the surroundings and the benchmark (supply 1). All air volume flows are measured by means of an orifice device, except for any airflow leakage. The measured air supply and exhaust are used as input of the model. The difference between both airflows is the leakage airflow. The simulated and measured pressures are plotted in Fig. 5. This is a passive pressure control in which all airflows are constant. The measured and simulated pressures are in reasonable agreement with each other, except near the sudden pressure drop at t= 137 s. This measured peak is not simulated. A possible explanation could be a discretisation error in the input signal (i.e., the peak is smoothed by a too large time step) provided by the reference (Voets 1999). For active
Fig. 4 Benchmark for the situation with passive pressure control (left) and active pressure control (right)

van den Brink and van Schijndel / Building Simulation / Vol. 5, No. 1
67
pressure control, the benchmark is equipped with a pressure controller (Fig. 4, right picture). One part of the exhaust remains constant by means of a CAV while the other part of the volume flow is changed by means of a Variable Airflow Valve (VAV). The transit time of the control valve is 120 s and the adjusting range is 0.047 kg/s. The constant exhaust through is CAV is not known but the value of 0.086 kg/s gives a good fit. Another adjustment is made to the linear valve. The linear valve characteristic is changed to a piece wise linear characteristic, by adding an S-shaped block after the output position of the control valve (this small modification is not shown in Fig. 2). The results are shown in Fig. 6 and give a good agreement.
Fig. 5 Pressure in the cleanroom of the benchmark for a simulated and measured situation with passive pressure control
Fig. 6 Pressure in the cleanroom of the benchmark for a simulated and measured situation with active pressure control
4 The by-pass duct
In this section we present the new design feature that improves the pressure control. A solution to realize an improvement of the pressure control is by means of a defined
ductwork which connects the air grille in the cleanroom to the air grille in the corridor as shown in Fig. 7. The adjustment is done by means of a manual control valve which can be secured. This adjustment is done during start-up. It must be possible to disassemble this ductwork to clean the inside of it. In fact, this conductance is a wall grille which connects two rooms with each other. It is advised to document and mark this ductwork in order to make sure the function is guaranteed.
The adjustable conductance makes is possible to achieve a defined adjusting range and resolution of the control valve. This means that during start-up a different procedure must be followed. The following steps must be taken in the correct order: (1) The air supply (constant value) is measured and adjusted. (2) The airflow of the fully opened control valve must be
measured to assure that the adjusting range and resolution are guaranteed. The room is brought to the design pressure by means of the adjustment of the valves in the exhaust ductwork with a constant flow. The actual position is depending on the actual air tightness.
(3) The airflow thought the adjustable conductance is measured and adjusted. The pressure is kept constant by adjusting the control valves in the exhaust ductwork with constant flow.
(4) The control valve is placed in the middle position (50%) when the system is stationary. This is done by adjusting the control valves in the exhaust ductwork.
(5) Optional: calculate the air tightness of the room with all measured volumes and determine if an additional blow- up of visual test is necessary. The adjustable wall grille has a number of disadvantages:
it is a potential dust (bacteria) source; it is difficult to clean; it must be cleaned in the cleanroom (dust explosion); it is hard to measure and to adjust in a proper way;
Fig. 7 Example how to create the parallel conductance ksp,10 between the cleanroom and the corridor
van den Brink and van Schijndel / Building Simulation / Vol. 5, No. 1 68
it must be measured and adjusted in the cleanroom; it can be easily adjusted by non authorized personal during
cleaning; both rooms must connect to each other.
This sophisticated wall grille solves most of these disadvantages; the additional ductwork is also a potential dust (bacteria)source but can be disassembled and cleaned. The ductwork has some additional advantages: all air volumes can been measured in a proper way; the difference between all air supply and all air exhaust is
the total air leakages of the cleanroom. Especially this last point is a major advantage. The
cleanroom is build in an air tight way but it takes a separate test (blow up test) to determine the actual air tightness. A first impression of the air tightness can be calculated with all air volumes flows available. This enhances the commissioning and the validation.
5 Results
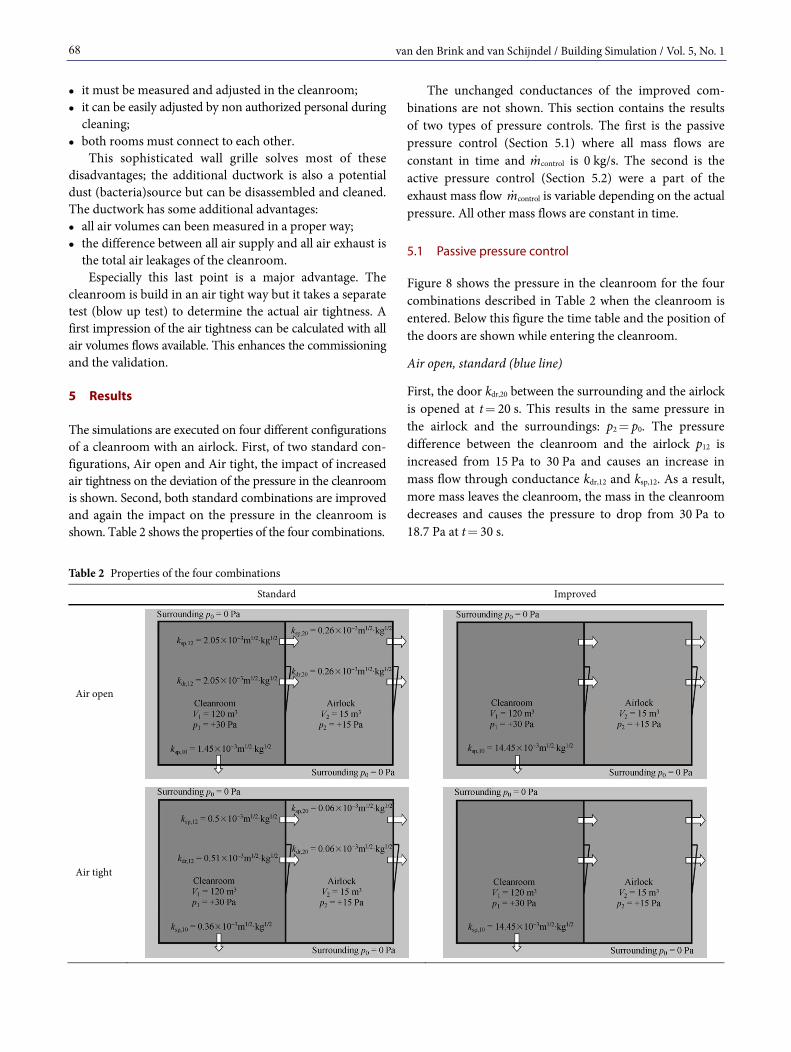
The simulations are executed on four different configurations of a cleanroom with an airlock. First, of two standard con- figurations, Air open and Air tight, the impact of increased air tightness on the deviation of the pressure in the cleanroom is shown. Second, both standard combinations are improved and again the impact on the pressure in the cleanroom is shown. Table 2 shows the properties of the four combinations.
The unchanged conductances of the improved com- binations are not shown. This section contains the results of two types of pressure controls. The first is the passive pressure control (Section 5.1) where all mass flows are constant in time and m control is 0 kg/s. The second is the active pressure control (Section 5.2) were a part of the exhaust mass flow m control is variable depending on the actual pressure. All other mass flows are constant in time.
5.1 Passive pressure control
Figure 8 shows the pressure in the cleanroom for the four combinations described in Table 2 when the cleanroom is entered. Below this figure the time table and the position of the doors are shown while entering the cleanroom.
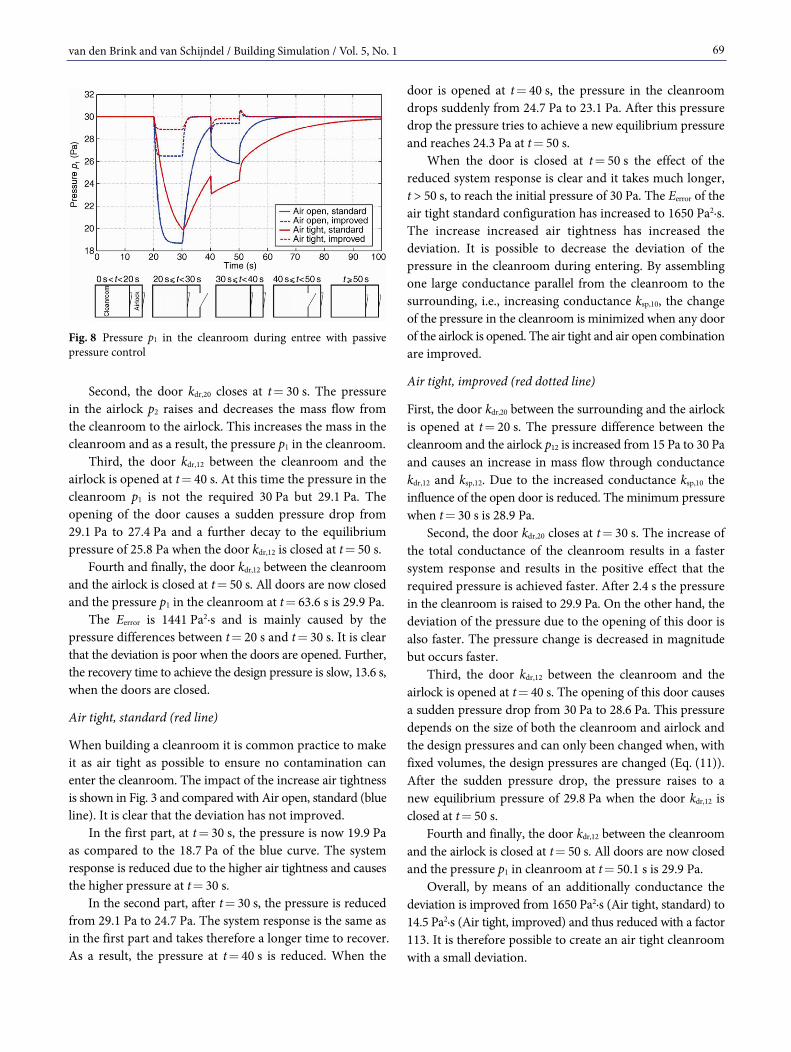
Air open, standard (blue line)
First, the door kdr,20 between the surrounding and the airlock is opened at t= 20 s. This results in the same pressure in the airlock and the surroundings: p2= p0. The pressure difference between the cleanroom and the airlock p12 is increased from 15 Pa to 30 Pa and causes an increase in mass flow through conductance kdr,12 and ksp,12. As a result, more mass leaves the cleanroom, the mass in the cleanroom decreases and causes the pressure to drop from 30 Pa to 18.7 Pa at t= 30 s.
Table 2 Properties of the four combinations
Standard Improved
Air open
Air tight
van den Brink and van Schijndel / Building Simulation / Vol. 5, No. 1
69
Fig. 8 Pressure p1 in the cleanroom during entree with passive pressure control
Second, the door kdr,20 closes at t= 30 s. The pressure in the airlock p2 raises and decreases the mass flow from the cleanroom to the airlock. This increases the mass in the cleanroom and as a result, the pressure p1 in the cleanroom.
Third, the door kdr,12 between the cleanroom and the airlock is opened at t= 40 s. At this time the pressure in the cleanroom p1 is not the required 30 Pa but 29.1 Pa. The opening of the door causes a sudden pressure drop from 29.1 Pa to 27.4 Pa and a further decay to the equilibrium pressure of 25.8 Pa when the door kdr,12 is closed at t= 50 s.
Fourth and finally, the door kdr,12 between the cleanroom and the airlock is closed at t= 50 s. All doors are now closed and the pressure p1 in the cleanroom at t= 63.6 s is 29.9 Pa.
The Eerror is 1441 Pa2·s and is mainly caused by the pressure differences between t= 20 s and t= 30 s. It is clear that the deviation is poor when the doors are opened. Further, the recovery time to achieve the design pressure is slow, 13.6 s, when the doors are closed.
Air tight, standard (red line)
When building a cleanroom it is common practice to make it as air tight as possible to ensure no contamination can enter the cleanroom. The impact of the increase air tightness is shown in Fig. 3 and compared with Air open, standard (blue line). It is clear that the deviation has not improved.
In the first part, at t= 30 s, the pressure is now 19.9 Pa as compared to the 18.7 Pa of the blue curve. The system response is reduced due to the higher air tightness and causes the higher pressure at t= 30 s.
In the second part, after t= 30 s, the pressure is reduced from 29.1 Pa to 24.7 Pa. The system response is the same as in the first part and takes therefore a longer time to recover. As a result, the pressure at t= 40 s is reduced. When the
door is opened at t= 40 s, the pressure in the cleanroom drops suddenly from 24.7 Pa to 23.1 Pa. After this pressure drop the pressure tries to achieve a new equilibrium pressure and reaches 24.3 Pa at t= 50 s.
When the door is closed at t= 50 s the effect of the reduced system response is clear and it takes much longer, t > 50 s, to reach the initial pressure of 30 Pa. The Eerror of the air tight standard configuration has increased to 1650 Pa2·s. The increase increased air tightness has increased the deviation. It is possible to decrease the deviation of the pressure in the cleanroom during entering. By assembling one large conductance parallel from the cleanroom to the surrounding, i.e., increasing conductance ksp,10, the change of the pressure in the cleanroom is minimized when any door of the airlock is opened. The air tight and air open combination are improved.
Air tight, improved (red dotted line)
First, the door kdr,20 between the surrounding and the airlock is opened at t= 20 s. The pressure difference between the cleanroom and the airlock p12 is increased from 15 Pa to 30 Pa and causes an increase in mass flow through conductance kdr,12 and ksp,12. Due to the increased conductance ksp,10 the influence of the open door is reduced. The minimum pressure when t= 30 s is 28.9 Pa.
Second, the door kdr,20 closes at t= 30 s. The increase of the total conductance of the cleanroom results in a faster system response and results in the positive effect that the required pressure is achieved faster. After 2.4 s the pressure in the cleanroom is raised to 29.9 Pa. On the other hand, the deviation of the pressure due to the opening of this door is also faster. The pressure change is decreased in magnitude but occurs faster.
Third, the door kdr,12 between the cleanroom and the airlock is opened at t= 40 s. The opening of this door causes a sudden pressure drop from 30 Pa to 28.6 Pa. This pressure depends on the size of both the cleanroom and airlock and the design pressures and can only been changed when, with fixed volumes, the design pressures are changed (Eq. (11)). After the sudden pressure drop, the pressure raises to a new equilibrium pressure of 29.8 Pa when the door kdr,12 is closed at t= 50 s.
Fourth and finally, the door kdr,12 between the cleanroom and the airlock is closed at t= 50 s. All doors are now closed and the pressure p1 in cleanroom at t= 50.1 s is 29.9 Pa.
Overall, by means of an additionally conductance the deviation is improved from 1650 Pa2·s (Air tight, standard) to 14.5 Pa2·s (Air tight, improved) and thus reduced with a factor 113. It is therefore possible to create an air tight cleanroom with a small deviation.

van den Brink and van Schijndel / Building Simulation / Vol. 5, No. 1 70
Air open, improved (blue dotted line)
The combination Air open, standard was less Air tight then Air tight, standard. It is seen that the pressure deviation of air open, improved is better compared with Air open, standard. Although, compared with Air tight, improved it is slightly worse.
First, the door between the surrounding and the airlock is opened at t= 20 s. The pressure is reduced and reaches its stationary value of 26.5 Pa at t= 30 s. This pressure is lower compared to Air tight, improved.
Second, this door and the pressure p1 in the cleanroom to raises to the design value of 30 Pa. In case of Air open, standard the design pressure was not achieved.
Third, the door between the cleanroom and the airlock is opened at t= 40 s. Because the design pressure is achieved before the door opens, the pressure drops to 28.5 Pa and raises to the new equilibrium pressure of 29.4 Pa.
Finally, the door between the cleanroom and the airlock is closed at t= 50 s. All doors are now closed and the pressure p1 in cleanroom at t= 50.1 s is 29.9 Pa. The Eerror is 125.4 Pa2·s and is mainly caused by the pressure differences between t= 20 s and t= 30 s. The results of the simulation are collected in Table 3. The second column gives the Eerror per combination. The factor Eerror has decreased by a factor of 11.5 for Air open and a factor 113 for Air tight. The third column gives the maximum pressure difference with the required pressure p1 of 30 Pa between t= 20 s and t= 30 s. In case of Air open this pressure drop is reduced from 11.3 Pa to 3.5 Pa and in case of Air tight reduced from 10.1 to 1.1 Pa. The values in the fourth column gives the deviation to the required pressure of 30 Pa at t= 40 s when the door to the cleanroom is opened. The values between brackets indicate the deviation to the required pressure of 30 Pa at t= 50 s when this door is closed. In case of Air open this pressure is reduced from 4.2 Pa to 0.6 Pa and in case of Air tight reduced from 5.7 to 0.2 Pa. The maximum pressure deviation at t= 30 s is now only determined by the volumes and design pressures of the cleanroom and the airlock (Eq. (11)) and occurs for a short time after opening the door between both rooms. The appliance of a parallel conductance
Table 3 Summary results of Fig. 8 with passive control
Simulation results
Combination
Eerror
(Pa2·s)
Δp1
(20 s≤ t<30 s) (Pa)
Δp1
(40 s≤ t<50 s)(Pa)
Air open, standard 1441 11.3 4.2
Air tight, standard 1650 10.1 6.9 (5.7)
Air tight, improved 14.54 1.1 1.4 (0.2)
Air open, improved 125.4 3.5 1.5 (0.6)
results in a major improvement of the deviation of the pressure in the cleanroom, especially when the cleanroom is very air tight. The air tight improved cleanroom has the lowest Eerror and the highest pressure in the cleanroom when the cleanroom is entered. This combination Air tight im- proved gives the lowest Eerror and pressure deviation caused by entering the clean with an passive pressure control.
5.2 Active pressure control
In the previous section we pointed out the impact of an parallel conductance in the case of a passive pressure control, i.e., all mass flows are constant. An active pressure control is used in order to eliminate disturbances. This is done by changing a part of the exhaust airflow m out,control as mentioned in Eq. (4). In this paragraph the effect of the parallel conductance is pointed out. With the cleanroom pressure controlled, the two important parameters are the adjusting range and the transit time. The adjustment range (AR) (kg/s) is the maximum airflow when the control valve is fully opened. The transit time (TT) (s) is the time to adjust the valve position from the fully open position to the fully closed position and vice versa. All combinations are pressure controlled and the transit time is 30 s for all combinations. The adjusting ranges are determined by iteration. The pressure fluctuation with matching linear valve positions are shown in Fig. 9. The properties and results are shown in Table 4.
Figure 9 shows that Air tight, improved (red dotted line) results in the most stable pressure. This is pointed out in the Eerror as shown in Table 4. Note that the pressures at t= 30 s are almost the same for all combinations as calculated with Eq. (11). This is at the moment when the door from the airlock to the cleanroom is just opened. Note also the pressures of both improved combinations on t= 40 s. These pressures are the same as indicated in Table 3 between brackets. This result is due to the interlock system which freezes the control valve and I-action of the PID-controller during the time the door between the airlock and cleanroom is opened.
First, the values of Eerror of the combination with passive pressure control are compared with the combinations with active pressure control. For all combinations the pressure control reduces these values. Improvement vary from 20.3 (Air tight standard) to 6.1 (Air tight improved). Note that the Air tight improved with passive pressure control has a better value for Eerror compared to the other combinations with active pressure control. This is a major contribution of the parallel conductance ksp,10 which results in a equilibrium pressure between t= 40 s and t= 50 s of almost the design pressure.

van den Brink and van Schijndel / Building Simulation / Vol. 5, No. 1
71
Fig. 9 Pressure p1 in the cleanroom and valve position during entree with active pressure control
Second, the values of Eerror of the combinations with active pressure control are increased a factor 7.6 for the air open combinations to 34.3 for the Air tight combinations. A major part of this results is caused by the fact that the pressure between t= 40 s and t= 50 s varies a lot. In this part the pressure control is not active due to the airlock system.
Third, the resolutions of the pressure controlled systems are compared. The resolution varies a factor 228 for the Air tight and a factor 14.5 for the Air open combinations. A small resolution (i.e., large number) results in major pressure fluctuations and can result in a non stable pressure of the cleanroom which is not acceptable. Also, a large resolution makes it possible the control the pressure in small (discrete) steps.
The adjustable conductance makes it possible to reduce the adjusting range and creates another advantage. One purpose of the interlock systems is to prevent a large pressure which can cause damage to the cleanroom. Without this system, the control valve takes the 0% position (i.e., fully closed) when the door to the airlock is opened to maintain the required pressure. When the door is closed with the control valve in this position, the difference in mass flows creates a increase of the pressure. This effect can be seen in Fig. 6 in case of a negative pressure. During the time the door is opened, the valve is 100% open. When the door is
closed, the pressure drops by an undetermined value and it takes a long time to achieve the required pressure in the room. The room could implode if it was very air tight. For example, we take the values Δp1 of the combinations Air tight standard and Air tight improved, caused by a difference in mass flow of 3.96´10–3 kg/s. With the (half) of the adjusting range mentioned in Table 4, the maximum theoretical pressure of combination II is 1700 Pa ((0.0792(kg/s)/3.96´ 10–4(kg/s))´8.56(Pa)) and is limited by the maximum fan pressure. This will cause mechanical damage to the cleanroom and has actual occurred in the past. For combination Air tight improved this maximum pressure is reduced to 37.5 Pa. This pressure increase of 7.5 Pa is also the maximum correction possible of the control valve. A smaller deviation cannot be corrected by the pressure control without increasing the adjusting range. With the interlock system removed, the pressure is controlled to the design pressure when the door between the cleanroom and the airlock is opened. The effect of the removal of the airlock system of combination Air tight improved is shown in Fig. 10. The opening times of the doors are the same as of Fig. 9. In the first part, when entering the airlock between t= 10 s and t= 30 s, there is no difference. Between t= 30 s and t= 40 s the system without the interlock system realizes the required pressure after a short drop in the cleanroom. After t= 40 s the peak is higher than the case was with interlock. This is caused by the fact that the position of the control valve is not the same
Fig. 10 Impact of the interlock system on the pressure p1 in the cleanroom during entree with active pressure control of combination Air tight improved
Table 4 Summary results of Fig. 9 with active pressure control
Combination Adjusting range
(kg/s) Transit time
(s)
Eerror
(active pressure control) (Pa2·s)
Eerror
(passive pressure control) (Pa2·s)
Volume change per percent adjustment
((kg/s)/%)
p1 on step 3.96 ×10⁻⁴ kg/s
(Pa) Resolution
(Pa/%)
Air open, standard 0.1574 30 138.6 1441 1.574 ×10⁻³ 2.10 8.40
Air open, improved 0.0787 30 18.3 125.4 0.787 ×10⁻³ 0.29 0.58
Air tight, standard 0.1574 30 81.23 1650 1.574 ×10⁻³ 8.56 34.24
Air tight, improved 0.0197 30 2.37 14.54 0.197 ×10⁻³ 0.30 0.15

van den Brink and van Schijndel / Building Simulation / Vol. 5, No. 1 72
as it should be in the static situation when the pressure is 30 Pa. Although the deviation is reduced by means of the pressure control without interlock system, the profit is small.
6 Conclusions
The modeling of a cleanroom with an pressure was success- fully implemented, verified and validated. With passive pressure control, the factor Eerror has decreased by a factor of 11.5 for the Air open combination and by a factor of 113 for Air tight combination during entry of the cleanroom. When the door from the surroundings to the airlock is opened, the pressure drop of the cleanroom is reduced from 11.3 Pa to 3.5 Pa in case of the Air open combination and reduced from 10.1 to 1.1 Pa in case of the air tight combination. When the door from the airlock to the cleanroom is opened, the decline is reduced from 4.2 Pa to 0.6 Pa in case of the Air open combination and in case of Air tight combination and from 5.7 Pa to 0.2 Pa. With active pressure control, the factor Eerror reduces a factor 34. With a smaller adjusting range of the control valve the resolution has improved up to a factor 228. This results in a improved pressure control with a high resolution. The smaller adjusting range results further in a additional build-in safety against high pressure. This reduces the risks of damage to the cleanroom and the interlock system for this reason can be removed. The parallel conductance, as proposed in this paper, makes it possible to measure all air volume flows and determine the air tightness of the cleanroom. This enhances the commissioning of the cleanroom and as a result, the validation of the cleanroom. The cleanroom can be built air tight with a small deviation including during entry of the cleanroom. The parallel conductance results in a decreased deviation of the pressure in the cleanroom under all circumstances and improves passive and active pressure control. Limitations of the approach: (1) The method is based in uniform pressure distributions in rooms. In order to include all paths of pollution it would be necessary to investigate full three-dimensional pollutant transport effects, by additional experiments or CFD studies. (2) Although the main parts of the models are validated, the by-pass duct introduces a new configuration that is strictly speaking not validated. Both limitations are left over for future research.
References
Chen J, Lan C, Jeng M, Xu T (2007). The development of fan filter unit with flow rate feedback control in a cleanroom. Building and Environment, 42: 3556 3561.
GMP (2003). Manufacture of Sterile Medicinal Products, EC Guide to Good Manufacturing Practice, Revision to Annex 1, Ad Hoc GMP Inspections Services Group, Belgium.
Hu S, Wu J, Chan D, Hsu R, Lee J (2008). Power consumption benchmark for a semiconductor cleanroom facility system. Energy and Buildings, 40: 1765 1770.
IEST-RP-CC006-2 (2001). Testing Cleanrooms, Institute of Environmental Sciences and Technology, USA.
ISO 14644-1 (1999). Cleanrooms and associated controlled environments — Part 1: Classification of air cleanliness. International Organization of Standardization, Switzerland.
ISO 14644-2 (2000). Cleanrooms and associated controlled environments — Part 2 Specifications for testing and monitoring to prove continued compliance with ISO 14644-1. International Organization of Standardization, Switzerland.
ISO 14644-3 (2005). Cleanrooms and associated controlled environments — Part 3: Test methods. International Organization of Standardization, Switzerland.
ISO 14644-4 (2001). Cleanrooms and associated controlled environments — Part 4: Design, construction and start-up. International Organization of Standardization, Switzerland.
Kircher K, Shi X, Patil S, Zhang KM (2010). Cleanroom energy efficiency strategies: Modeling and simulation. Energy and Buildings, 42: 282 289.
Lin T, Tung Y, Hu S, Chen Y (2011). Experimental study on airflow characteristics and temperature distribution in non-unidirectional cleanrooms for electronic industry. Building and Environment, 46: 1235 1242.
Noh K-C, Oh M-D, Lee S-C (2005). A numerical study on airflow and dynamic cross-contamination in the super cleanroom for photolithography process. Building and Environment, 40: 1431 1440.
Saidi MH, Sajadi B, Molaeimanesh GR (2011). The effect of source motion on contaminant distribution in the cleanrooms. Energy and Buildings, 43: 966 970.
Shih H, Huang S, Li S, Chen S, Tsai C (2009). Simulation and testing of pollutant dispersion during preventive maintenance in a cleanroom. Building and Environment, 44: 23192326.
Voets AE (1999). Drukhiërarchieën in SKAR. Master thesis, Technical University Eindhoven, The Netherlands. (in Dutch)
Walenkamp GHIM (2005). Beheersplan luchtbehandeling voor de Operatieafdeling. Retrieved from http://www.orthopeden.org/ uploads/450/1514/NOV17LB.pdf
Xu T, Lan C, Jeng M (2007). Performance of large fan-filter units for cleanroom applications. Building and Environment, 42: 2299 2304.
Xu T (2008). Characterization of minienvironments in a cleanroom: Assessing energy performance and its implications. Building and Environment, 43: 1545 1552.
Yang S, Fu W (2002). A numerical investigation of effects of a moving operator on airflow patterns in a cleanroom. Building and Environment, 37: 705 712.