DOWNSTREAM GAS INDUSTRY - Home - Ministry of Energy and Energy
Upload
nguyenxuyenCategory
view
215download
0
Post-print copy
Please reference as: Ballantyne, G.R., Hilden, M. and van der Meer, F., 2017. Improved characterisation of ball milling energy requirements for HPGR products. Minerals Engineering (accepted 8 Jun 2017).
Improved characterisation of ball milling energy requirements for HPGR products Grant R Ballantyne1*, Marko Hilden1 and Frank van der Meer2 12 1The University of Queensland, Sustainable Minerals Institute, Julius Kruttschnitt Mineral Research
Centre
2Weir Minerals
(*Corresponding author: [email protected])
Accepted for publication in: Minerals Engineering
Published version found online at: http://www.sciencedirect.com
Abstract This paper describes a method for assessing the downstream milling energy requirements for high
pressure grinding rolls (HPGR) products based on a Bond mill test procedure. Multiple trade-off studies
have reported the performance of HPGR versus SAG milling with energy savings of between 11 and
32 per cent. One factor that is often inconsistently defined in these studies is the change in the Bond
Ball Work Index (BBWi). The Bond test can overestimate the reduction in ball milling energy
requirements for HPGR products, not due to a change in the breakage characteristics of the particles,
but because the Bond test feed for a sample crushed in a HPGR has a greater fines content than a
conventionally-crushed sample. This paper rigorously assesses the actual change in BBWi achieved
through the use of HPGR technology.
The reduction in BBWi was found to not be dependent on the ore hardness and thus the expression
of the change as a per cent is incorrect. When the size distribution of the HPGR product was matched
to the crushed product, more than 95% of the samples tested resulted in a reduction in Work Index,
with an average reduction of 1.9 kWh/t. A proportional reduction was seen when the Size Specific
Energy (SSE) was calculated for the reconstituted samples. Six samples were tested where the original
size distributions were retained and these saw greater reduction in BBWi than SSE.
A gold mine was surveyed to investigate the ball milling requirements of an industrial HPGR circuit.
Two surveys of the ball mill operating at different conditions found that milling efficiency could be
improved by 20%. These results highlight the importance of the mills operating conditions on energy
efficiency as they can overwhelm the potential benefits of HPGR pre-conditioning.
1 Comparative Bond work index data were supplied by Frank van der Meer, Evert Lessing and Ric Stocco of Weir Minerals. 2 Design, laboratory and operating data from Tropicana Mine were supplied by Nick Clarke, Mike Di Trento of AngloGold Ashanti, and Fred Kock and Brian Putland of Orway Mineral Consultants (OMC)
Post-print copy
Please reference as: Ballantyne, G.R., Hilden, M. and van der Meer, F., 2017. Improved characterisation of ball milling energy requirements for HPGR products. Minerals Engineering (accepted 8 Jun 2017).
Keywords HPGR; Bond; Work Index; Comminution; Energy
Highlights 1. The ball milling requirements of HPGR and standard crusher products are measured
2. Methods for assessing the energy consumption of the Bond Ball Mill are discussed
3. The average reduction in Work Index of HPGR products was 1.9 kWh/t
4. A similar magnitude of reduction was observed in the Size Specific Energy
5. Ball milling efficiency can vary significantly independently of HPGR operation
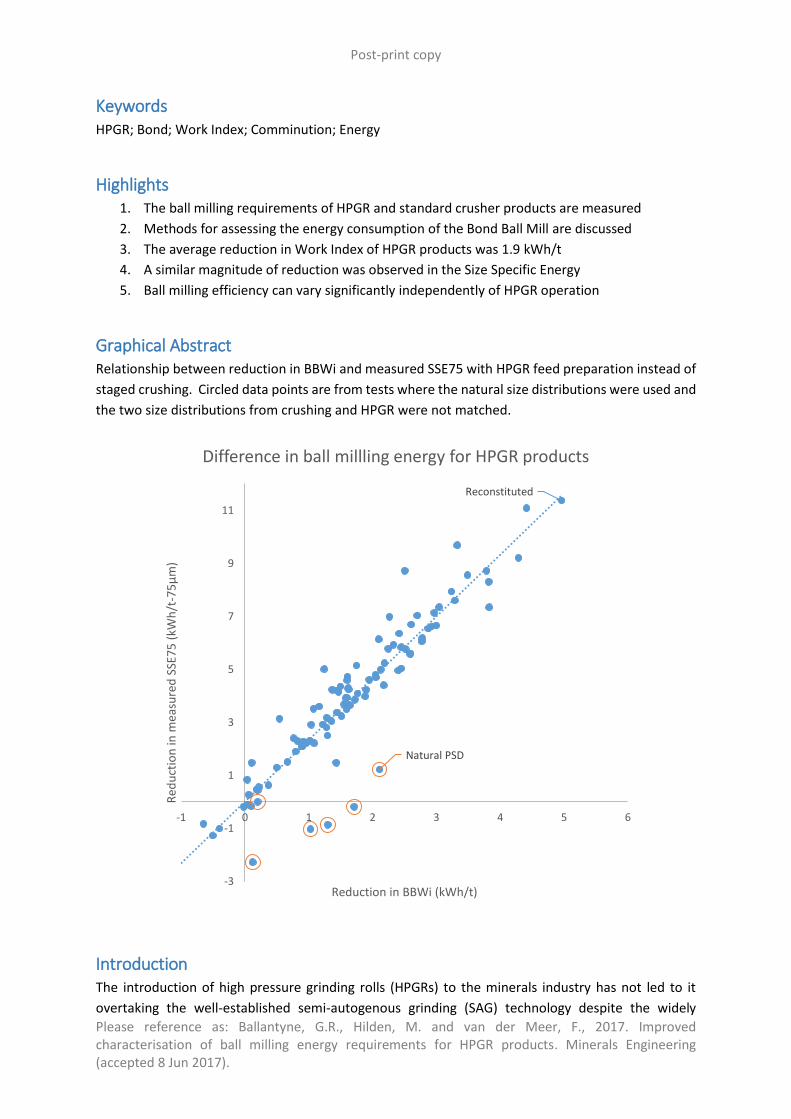
Graphical Abstract Relationship between reduction in BBWi and measured SSE75 with HPGR feed preparation instead of
staged crushing. Circled data points are from tests where the natural size distributions were used and
the two size distributions from crushing and HPGR were not matched.
Introduction The introduction of high pressure grinding rolls (HPGRs) to the minerals industry has not led to it
overtaking the well-established semi-autogenous grinding (SAG) technology despite the widely
Reconstituted
Natural PSD
-3
-1
1
3
5
7
9
11
-1 0 1 2 3 4 5 6
Red
uct
ion
in m
easu
red
SSE
75
(kW
h/t
-75
μm
)
Reduction in BBWi (kWh/t)
Difference in ball millling energy for HPGR products
Post-print copy
Please reference as: Ballantyne, G.R., Hilden, M. and van der Meer, F., 2017. Improved characterisation of ball milling energy requirements for HPGR products. Minerals Engineering (accepted 8 Jun 2017).
reported efficiency benefits. Multiple trade-off studies comparing different comminution circuit
options have estimated that HPGR circuits can offer energy savings of between 11 and 32 per cent
compared with SAG milling circuits (Davaanyam et al., 2015). The confined-bed breakage mechanism
employed by the HPGR requires less energy to achieve the same degree of size reduction as SAG
milling. The cost of the grinding media consumed in SAG mills provides an additional benefit that is
greater for more competent ores. However, the focus of this paper is the reduced energy
requirements of ball milling circuits following HPGRs. This is typically quantified based on Bond ball
work index (BBWi) tests of HPGR products, which generally report a significantly lower BBWi value
than for the HPGR feed (Wang, Nadolski et al 2013). The implications for the equipment sizing of the
downstream ball mills can be significant (Patzelt et al., 2006). Schönert (1988) estimated that replacing
existing circuits with HPGR-ball mill circuits could increase circuit capacity by 12-25%, and reduce
energy by 10-20%. However, for this to be achieved the HPGR must produce at least 10% of the final
circuit product and, furthermore, damage those particles remaining unbroken.
The reduction in BBWi has been shown (Baum et al., 1997; Daniel, 2007; Esna-Ashari and Kellerwessel,
1988; Otte, 1988), at least in part, to be due to the appearance of “microcracking” fracturing of
particles in the HPGR. Daniel (2007) observed microcracks in HPGR product using mineral liberation
analysis while Lin et al. (2012) measured the specific internal surface area contained within them using
tomography, but their contribution to reductions in BBWi has not been directly quantified.
Tavares (2005) found that HPGR product particles coarser than 1.5 mm required on average 35% less
energy to fracture in comparison to crushing and produced finer progeny when subjected to single
particle impact crushing. This weakening was found to increase with compaction pressure and was
independent of particle position within the confined bed, but was not observed for particles finer than
1.5 mm. Tavares (2005) used this methodology to decouple the effects of increased fines production
and particle weakening on the ball mill through simulation of multiple sequential breakage steps. Shi
et al. (2006) also found that the increased grindability of HPGR products was greater when coarser
closing screen sizes were used in the Bond Ball Mill test. van der Meer and Schnabel (1997) used pilot
plant tests, torque mills of different sizes, a Hardgrove mill as well as standard Bond Ball mill tests to
show that the grindability of HPGR products were reduced in comparison to crushed products, and
that this reduction increased with applied pressure. Watson and Brooks (1994) supported the finding
that the Work Index reduced linearly with increasing pressing force. Stephenson (1997) also found
that the reduction in competence was ore-dependent, and either related to the rock structure
(presence of vesicles reduced the degree of microcracks) or the fracture toughness (reduction in work
index was only observed for ores with high fracture toughness). Morrell (2009) suggested that a
reduction in work index of 5% could be assumed in the absence of full scale data.
There is some evidence that microcracks could lead to increased liberation if the mineral association
promotes cracks following the inter-species grain boundaries (Battersby et al., 1992). The evidence
for this is inconclusive and Daniel (2007) noted that accurate quantification of the effect of breakage
mechanism on liberation as measured using SEM-based liberation analysis is not straightforward.
Clarke and Wills (1989) compared tin ore crushed using a rod mill and HPGR and found that liberation
was enhanced by compression breakage. Studies by Patzelt and Knecht (1996) and Baum and Ausburn
(2011) for example have compared leachability of ores from HPGR and crushers finding that high-
pressure rolls have a higher leaching rate, in particular in the coarsest size fractions. Additionally, Shi
et al. (2006) found that HPGR treated material showed increased flotation responses. In contrast
Post-print copy
Please reference as: Ballantyne, G.R., Hilden, M. and van der Meer, F., 2017. Improved characterisation of ball milling energy requirements for HPGR products. Minerals Engineering (accepted 8 Jun 2017).
however, neither Palm et al (2010) nor Solomon et al (2011) found evidence that HPGR offered any
preferential breakage or increased flotation recovery for South African PGM ores. Kodali et al (2011)
found no increase in leaching kinetics for a sulphide copper ore but some improvement for an oxide
copper ore. Vizcarra et al. (2010) did not find any increase in liberation between compression and
impact breakage and Garcia et al. (2009) and Xu et al. (2013) observed increased liberation only at
impractical compression rates of 0.5 cm/day or slower. Therefore, although HPGR use compression
breakage and increased liberation can be achieved via this breakage mechanism, the rate required for
high throughput may be too fast for this to be realised in practice.
The Bond Ball Mill Work index (BBWi) is the industry standard procedure for assessing the grindability
of ores. The test involves conducting a locked-cycle grinding test using Bond’s standard mill design.
The locked-cycle test enables a batch process to emulate the grinding behaviour of a continuous mill
with a 250% recirculating load. The mill product from each cycle is screened and the oversize is
combined with fresh feed (of the same mass as the screen undersize which is removed) to maintain a
constant filling. This process is repeated for as many cycles as is required to obtain a constant
production rate of screen undersize. The standard feed for the test is prepared through staged
crushing a sample to 100% passing a 3.35 mm sieve. Bond (1961) defines his work index according to:
BBWi = 4.91/[P10.23 Gpr0.82 (P80
-0.5 – F80-0.5)] – Equation 1;
where P1 is the closing screen opening, in microns; P80 and F80 are the test product and feed 80%
passing sizes, respectively, in microns; Gpr is the net grams per revolution averaged from the last three
cycles. The numerator in Equation 1 of 4.45 published in the original equation corresponds to the
work index for a short ton, whereas 4.91 should be used when using the metric tonnes.
An implicit requirement of the Bond test is that its feed and product size distributions should be, at
least approximately, parallel (Musa and Morrison, 2009). The product from a HPGR (and SAG mills)
tend to contain a higher proportion of fine material than a crushed feed specified for the standard
Bond test (van der Meer and Gruendken, 2010). However, even with significant differences in the
feed size distributions, the product size distributions from the Bond tests have been found to be
identical and solely controlled by the closing screen aperture (Shi et al., 2006). Hence the Bond ball
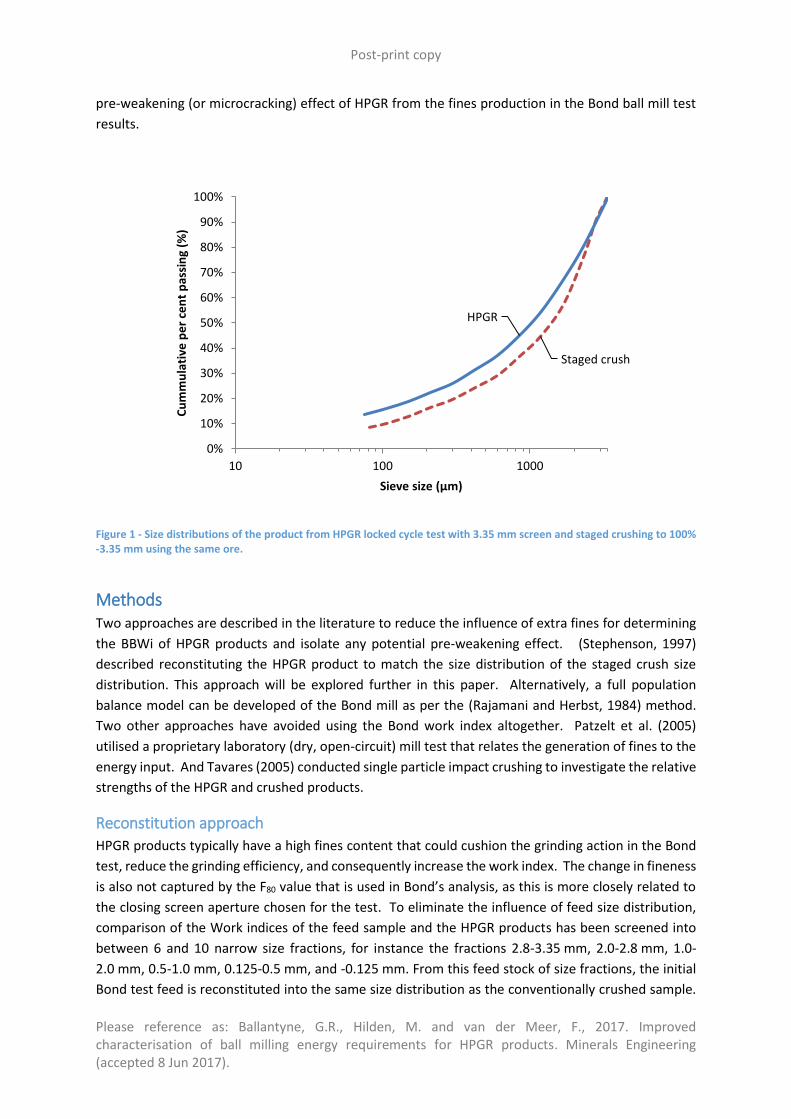
mill test should be modified when applied to the grindability of HPGR product. Figure 1 shows the
product of progressive crushing to 100% -3.35 mm (standard Bond procedure) and the product of a
HPGR locked-cycle test with a closing screen of 3.35 mm. Although the 80% passing sizes are similar,
in this example, there was 14% material finer than 75 µm in the HPGR product compared with 8% in
the crusher product, but the difference can be greater in some circumstances. The Bond test
procedure can account for differences in the quantity of fines in the feed by calculating the net grams
per revolution produced. And although Rowland and Kjos (1980) developed many correction factors,
none of these relate to the degree of fines in the feed. Amelunxen and Meadow (2011) discussed a
methodology for modifying the BBWi by introducing a net correction factor (CFnet) to allow for
different degree of fines with HPGR, SAG or crushed products, but the method remains proprietary.
There also exists a number of indirect methods that are used by practitioners such as the ‘phantom’
cyclone approach developed at the Julius Kruttschnitt Mineral Research Centre (JKMRC) and
functional performance analysis (Bartholomew, et. al., 2014). Because of its wide acceptability in the
industry, the Bond ball mill test is the most pragmatic choice for investigating the ball milling
requirements of HPGR products, but it may not be the most accurate. This study aims to separate the
Post-print copy
Please reference as: Ballantyne, G.R., Hilden, M. and van der Meer, F., 2017. Improved characterisation of ball milling energy requirements for HPGR products. Minerals Engineering (accepted 8 Jun 2017).
pre-weakening (or microcracking) effect of HPGR from the fines production in the Bond ball mill test
results.
Figure 1 - Size distributions of the product from HPGR locked cycle test with 3.35 mm screen and staged crushing to 100% -3.35 mm using the same ore.
Methods Two approaches are described in the literature to reduce the influence of extra fines for determining
the BBWi of HPGR products and isolate any potential pre-weakening effect. (Stephenson, 1997)
described reconstituting the HPGR product to match the size distribution of the staged crush size
distribution. This approach will be explored further in this paper. Alternatively, a full population
balance model can be developed of the Bond mill as per the (Rajamani and Herbst, 1984) method.
Two other approaches have avoided using the Bond work index altogether. Patzelt et al. (2005)
utilised a proprietary laboratory (dry, open-circuit) mill test that relates the generation of fines to the
energy input. And Tavares (2005) conducted single particle impact crushing to investigate the relative
strengths of the HPGR and crushed products.
Reconstitution approach
HPGR products typically have a high fines content that could cushion the grinding action in the Bond
test, reduce the grinding efficiency, and consequently increase the work index. The change in fineness
is also not captured by the F80 value that is used in Bond’s analysis, as this is more closely related to
the closing screen aperture chosen for the test. To eliminate the influence of feed size distribution,
comparison of the Work indices of the feed sample and the HPGR products has been screened into
between 6 and 10 narrow size fractions, for instance the fractions 2.8-3.35 mm, 2.0-2.8 mm, 1.0-
2.0 mm, 0.5-1.0 mm, 0.125-0.5 mm, and -0.125 mm. From this feed stock of size fractions, the initial
Bond test feed is reconstituted into the same size distribution as the conventionally crushed sample.
Staged crush
HPGR
0%
10%
20%
30%
40%
50%
60%
70%
80%
90%
100%
10 100 1000
Cu
mm
ula
tive
pe
r ce
nt
pas
sin
g (%
)
Sieve size (µm)

Post-print copy
Please reference as: Ballantyne, G.R., Hilden, M. and van der Meer, F., 2017. Improved characterisation of ball milling energy requirements for HPGR products. Minerals Engineering (accepted 8 Jun 2017).
The same is performed for the required new feed additions between each Bond test cycle. Thus, the
sample for the determination of the Bond Work index of the HPGR products will have the same size
distribution as the samples of the conventionally crushed, HPGR feed.
In breakage processes, the more competent components in the feed tend to report to the coarser
fractions in the product size distribution (Bueno et al., 2013). Thus when preparing a Bond test feed
(which requires the material to be sized to minus 3.35 mm), scalping the crushed product without
recycling the oversize, might skew the mineralogical composition of the Bond test feed. Therefore,
the sample for Bond WI determination on the HPGR product was taken from closed circuit HPGR
product or laboratory locked-cycle tests, where minerals and particle sizes have equal opportunity to
be subjected to the HPGR process. In addition, in a closed circuit arrangement, an enrichment of the
harder components from the ore may take place in the recycle stream and consequently in the HPGR
feed. To ensure a properly prepared feed, only the steady state product of the closed circuit HPGR
crushing was used. This fraction provided a fully representative sample for the Bond procedure and
the results thereof can be considered as indicative of the final HPGR product. In using this technique
consideration should be made to the fact that in reconstituting the crusher product size distribution,
the coarse particles are enriched. The result of this will depend on whether the coarse particles are
more competent due to surviving the HPGR or weaker due to an increased degree of microcracking.
Size Specific Energy (SSE) approach
The Size Specific Energy (SSE) is defined as the specific energy required to generate new material finer
than a particular marker screen aperture (Ballantyne et al., 2015). The most common marker size is
75 µm, producing the SSE75 with the units kWh/t-75µm. The SSE75 is a useful measure for comparing
the grindability of the products from crushing and HPGR because it accounts for the increase in fines
in the feed and most of the surface area is contained in the -75um fraction. The SSE75 can either be
calculated from single particle impacts (Ballantyne et al., 2015) or from Bond test results (Levin, 1992).
The SSE75 results in this paper are obtained from Bond test data.
The calculation of SSE75 from the Bond ball test is similar to the approach taken by Patzelt et al. (2005).
That technique compared the grindability of two HPGR fractions (centre and total) and conventional
crushed products in a progressive grinding test in a dry, open-circuit laboratory ball mill (ibid). The
amount of fines (-90 µm) was measured in the feed and then subsequent to each progressive grinding
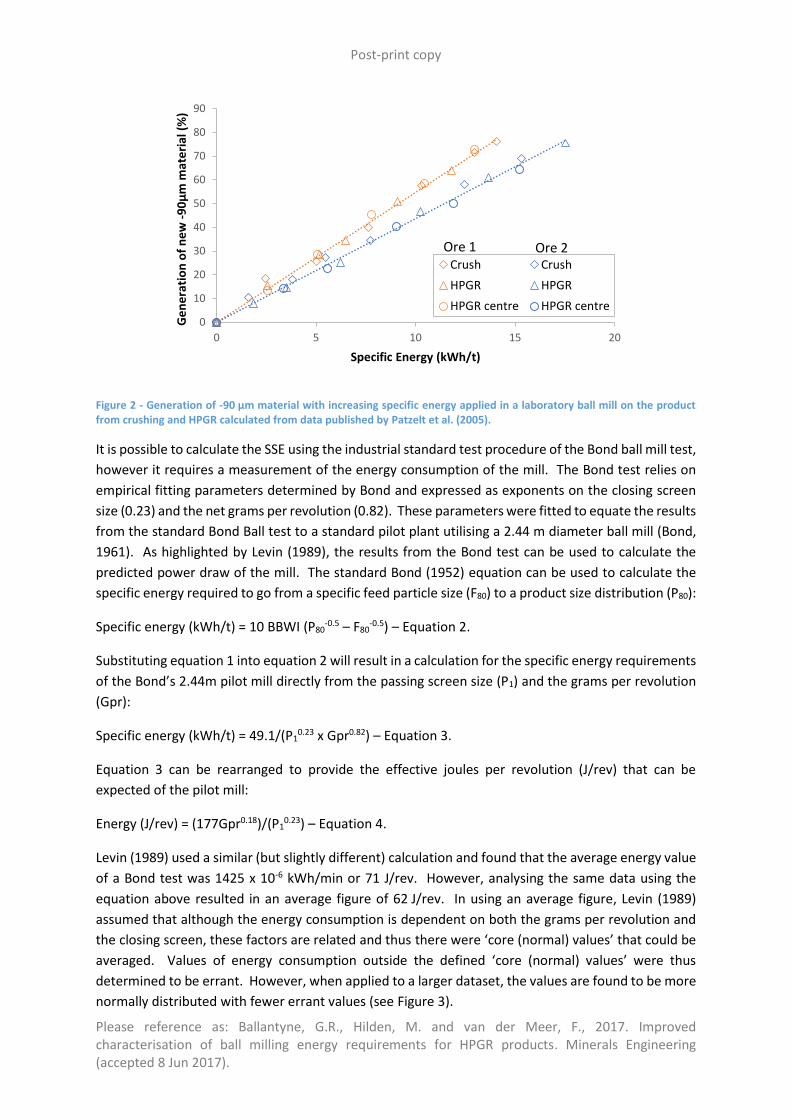
step along with the specific energy input to the mill. Figure 2 shows the results from two ore samples
that were presented by Patzelt et al. (2005) with the amount of fines in the feed subtracted from the
product to calculate the generation of new fines. The HPGR products had between 10 and 20% more
fines in the feed, and thus the conventional BBWi values were reduced by 10 to 20% (ibid). However,
when the generation of new fines was calculated, both the crushing and HPGR samples exhibited the
same competence in the ball mill. Ore 1 was less competent with a Size Specific Energy at 90 µm
(SSE90) of 18.3 kWh/t-90µm, whereas Ore 2 had a SSE90 of 22.9 kWh/t-90µm.
Post-print copy
Please reference as: Ballantyne, G.R., Hilden, M. and van der Meer, F., 2017. Improved characterisation of ball milling energy requirements for HPGR products. Minerals Engineering (accepted 8 Jun 2017).
Figure 2 - Generation of -90 µm material with increasing specific energy applied in a laboratory ball mill on the product from crushing and HPGR calculated from data published by Patzelt et al. (2005).
It is possible to calculate the SSE using the industrial standard test procedure of the Bond ball mill test,
however it requires a measurement of the energy consumption of the mill. The Bond test relies on
empirical fitting parameters determined by Bond and expressed as exponents on the closing screen
size (0.23) and the net grams per revolution (0.82). These parameters were fitted to equate the results
from the standard Bond Ball test to a standard pilot plant utilising a 2.44 m diameter ball mill (Bond,
1961). As highlighted by Levin (1989), the results from the Bond test can be used to calculate the
predicted power draw of the mill. The standard Bond (1952) equation can be used to calculate the
specific energy required to go from a specific feed particle size (F80) to a product size distribution (P80):
Specific energy (kWh/t) = 10 BBWI (P80-0.5 – F80
-0.5) – Equation 2.
Substituting equation 1 into equation 2 will result in a calculation for the specific energy requirements
of the Bond’s 2.44m pilot mill directly from the passing screen size (P1) and the grams per revolution
(Gpr):
Specific energy (kWh/t) = 49.1/(P10.23 x Gpr0.82) – Equation 3.
Equation 3 can be rearranged to provide the effective joules per revolution (J/rev) that can be
expected of the pilot mill:
Energy (J/rev) = (177Gpr0.18)/(P10.23) – Equation 4.
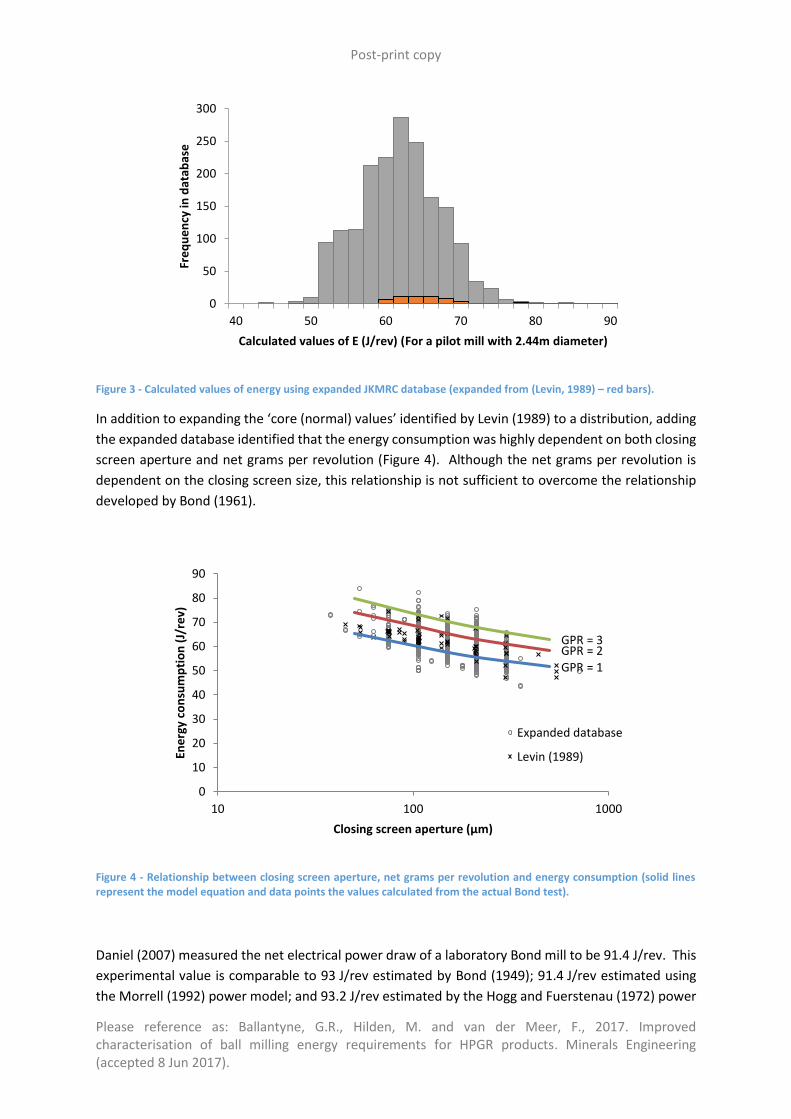
Levin (1989) used a similar (but slightly different) calculation and found that the average energy value
of a Bond test was 1425 x 10-6 kWh/min or 71 J/rev. However, analysing the same data using the
equation above resulted in an average figure of 62 J/rev. In using an average figure, Levin (1989)
assumed that although the energy consumption is dependent on both the grams per revolution and
the closing screen, these factors are related and thus there were ‘core (normal) values’ that could be
averaged. Values of energy consumption outside the defined ‘core (normal) values’ were thus
determined to be errant. However, when applied to a larger dataset, the values are found to be more
normally distributed with fewer errant values (see Figure 3).
0
10
20
30
40
50
60
70
80
90
0 5 10 15 20
Ge
ne
rati
on
of
ne
w -
90
µm
mat
eri
al (
%)
Specific Energy (kWh/t)
Crush Crush
HPGR HPGR
HPGR centre HPGR centre
Ore 1 Ore 2
Post-print copy
Please reference as: Ballantyne, G.R., Hilden, M. and van der Meer, F., 2017. Improved characterisation of ball milling energy requirements for HPGR products. Minerals Engineering (accepted 8 Jun 2017).
Figure 3 - Calculated values of energy using expanded JKMRC database (expanded from (Levin, 1989) – red bars).
In addition to expanding the ‘core (normal) values’ identified by Levin (1989) to a distribution, adding
the expanded database identified that the energy consumption was highly dependent on both closing
screen aperture and net grams per revolution (Figure 4). Although the net grams per revolution is
dependent on the closing screen size, this relationship is not sufficient to overcome the relationship
developed by Bond (1961).
Figure 4 - Relationship between closing screen aperture, net grams per revolution and energy consumption (solid lines represent the model equation and data points the values calculated from the actual Bond test).
Daniel (2007) measured the net electrical power draw of a laboratory Bond mill to be 91.4 J/rev. This
experimental value is comparable to 93 J/rev estimated by Bond (1949); 91.4 J/rev estimated using
the Morrell (1992) power model; and 93.2 J/rev estimated by the Hogg and Fuerstenau (1972) power
0
50
100
150
200
250
300
40 50 60 70 80 90
Fre
qu
en
cy in
dat
abas
e
Calculated values of E (J/rev) (For a pilot mill with 2.44m diameter)
GPR = 1
GPR = 2GPR = 3
0
10
20
30
40
50
60
70
80
90
10 100 1000
Ene
rgy
con
sum
pti
on
(J/
rev)
Closing screen aperture (µm)
Expanded database
Levin (1989)
Post-print copy
Please reference as: Ballantyne, G.R., Hilden, M. and van der Meer, F., 2017. Improved characterisation of ball milling energy requirements for HPGR products. Minerals Engineering (accepted 8 Jun 2017).
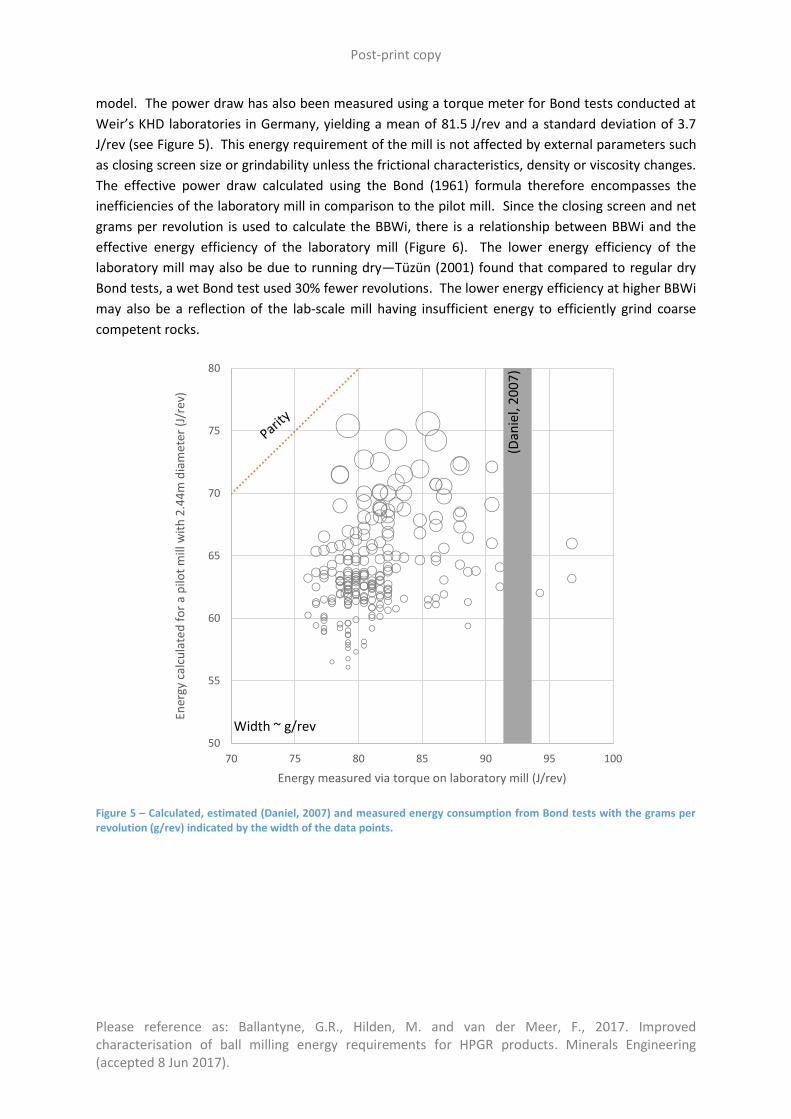
model. The power draw has also been measured using a torque meter for Bond tests conducted at
Weir’s KHD laboratories in Germany, yielding a mean of 81.5 J/rev and a standard deviation of 3.7
J/rev (see Figure 5). This energy requirement of the mill is not affected by external parameters such
as closing screen size or grindability unless the frictional characteristics, density or viscosity changes.
The effective power draw calculated using the Bond (1961) formula therefore encompasses the
inefficiencies of the laboratory mill in comparison to the pilot mill. Since the closing screen and net
grams per revolution is used to calculate the BBWi, there is a relationship between BBWi and the
effective energy efficiency of the laboratory mill (Figure 6). The lower energy efficiency of the
laboratory mill may also be due to running dry—Tüzün (2001) found that compared to regular dry
Bond tests, a wet Bond test used 30% fewer revolutions. The lower energy efficiency at higher BBWi
may also be a reflection of the lab-scale mill having insufficient energy to efficiently grind coarse
competent rocks.
Figure 5 – Calculated, estimated (Daniel, 2007) and measured energy consumption from Bond tests with the grams per revolution (g/rev) indicated by the width of the data points.
50
55
60
65
70
75
80
70 75 80 85 90 95 100
Ener
gy c
alcu
late
d f
or
a p
ilot
mill
wit
h 2
.44
m d
iam
eter
(J/
rev)
Energy measured via torque on laboratory mill (J/rev)
Width ~ g/rev
(Dan
iel,
20
07
)
Post-print copy
Please reference as: Ballantyne, G.R., Hilden, M. and van der Meer, F., 2017. Improved characterisation of ball milling energy requirements for HPGR products. Minerals Engineering (accepted 8 Jun 2017).
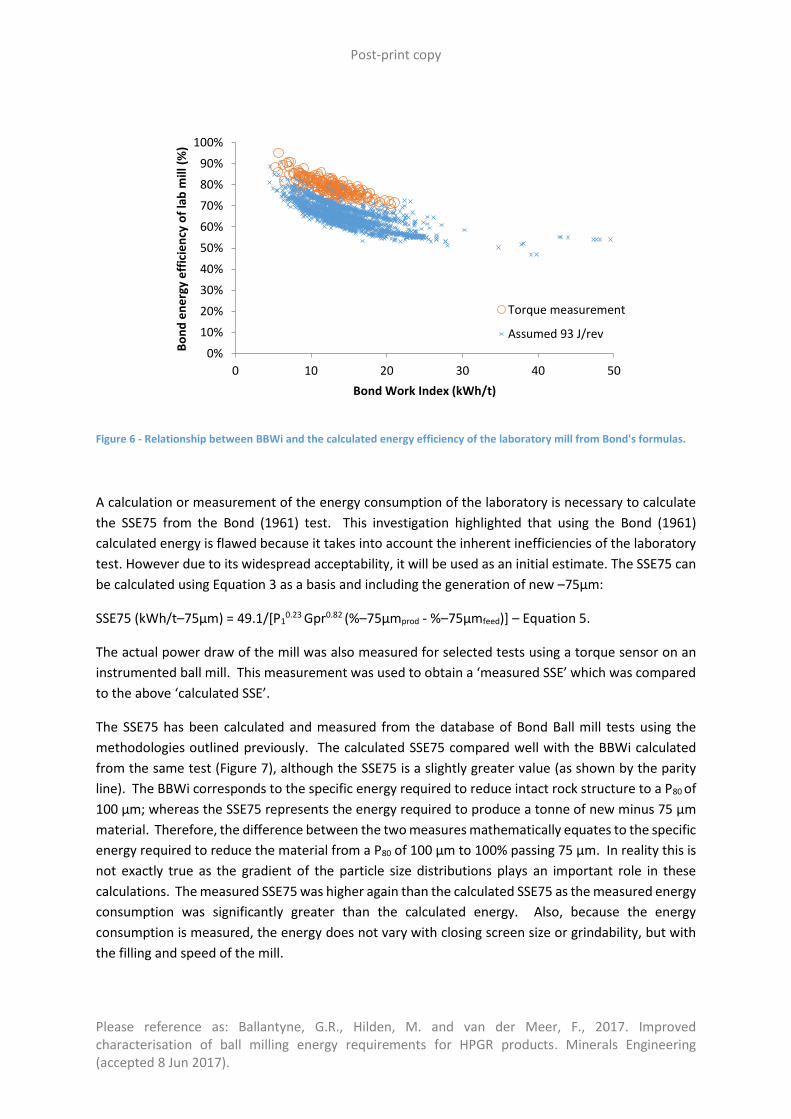
Figure 6 - Relationship between BBWi and the calculated energy efficiency of the laboratory mill from Bond's formulas.
A calculation or measurement of the energy consumption of the laboratory is necessary to calculate
the SSE75 from the Bond (1961) test. This investigation highlighted that using the Bond (1961)
calculated energy is flawed because it takes into account the inherent inefficiencies of the laboratory
test. However due to its widespread acceptability, it will be used as an initial estimate. The SSE75 can
be calculated using Equation 3 as a basis and including the generation of new –75μm:
SSE75 (kWh/t–75μm) = 49.1/[P10.23 Gpr0.82 (%–75μmprod - %–75μmfeed)] – Equation 5.
The actual power draw of the mill was also measured for selected tests using a torque sensor on an
instrumented ball mill. This measurement was used to obtain a ‘measured SSE’ which was compared
to the above ‘calculated SSE’.
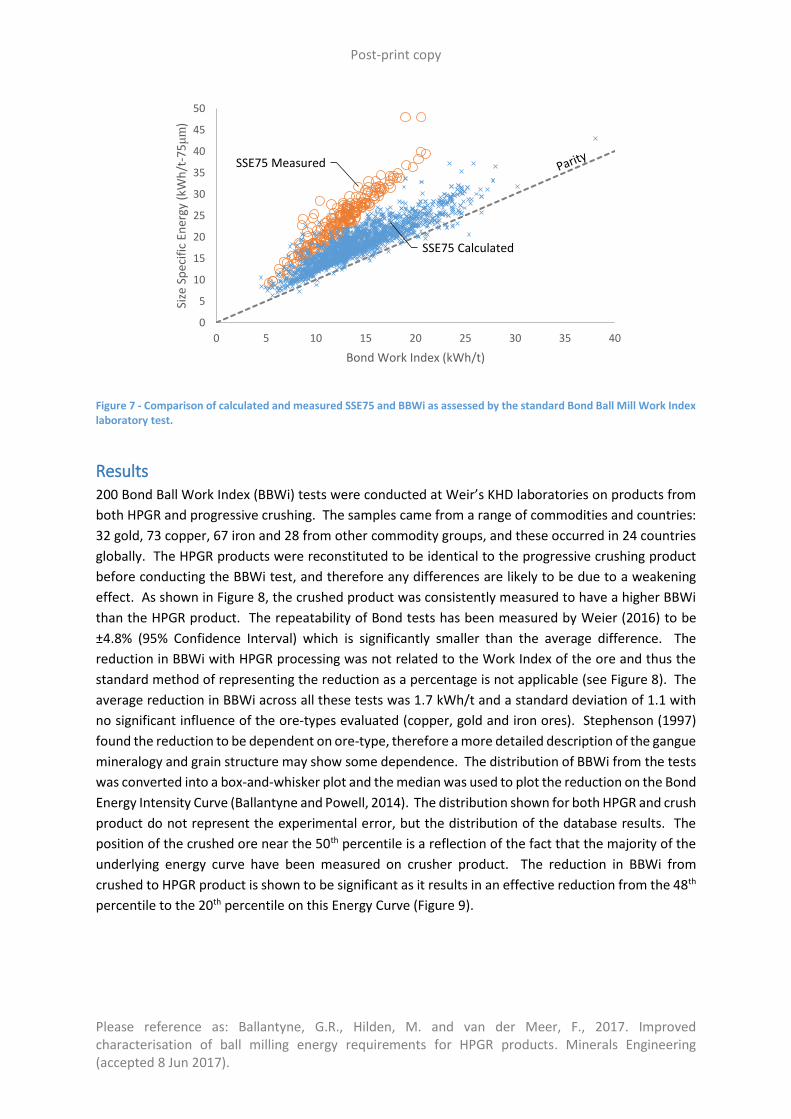
The SSE75 has been calculated and measured from the database of Bond Ball mill tests using the
methodologies outlined previously. The calculated SSE75 compared well with the BBWi calculated
from the same test (Figure 7), although the SSE75 is a slightly greater value (as shown by the parity
line). The BBWi corresponds to the specific energy required to reduce intact rock structure to a P80 of
100 µm; whereas the SSE75 represents the energy required to produce a tonne of new minus 75 µm
material. Therefore, the difference between the two measures mathematically equates to the specific
energy required to reduce the material from a P80 of 100 µm to 100% passing 75 µm. In reality this is
not exactly true as the gradient of the particle size distributions plays an important role in these
calculations. The measured SSE75 was higher again than the calculated SSE75 as the measured energy
consumption was significantly greater than the calculated energy. Also, because the energy
consumption is measured, the energy does not vary with closing screen size or grindability, but with
the filling and speed of the mill.
0%
10%
20%
30%
40%
50%
60%
70%
80%
90%
100%
0 10 20 30 40 50
Bo
nd
en
erg
y e
ffic
ien
cy o
f la
b m
ill (
%)
Bond Work Index (kWh/t)
Torque measurement
Assumed 93 J/rev
Post-print copy
Please reference as: Ballantyne, G.R., Hilden, M. and van der Meer, F., 2017. Improved characterisation of ball milling energy requirements for HPGR products. Minerals Engineering (accepted 8 Jun 2017).
Figure 7 - Comparison of calculated and measured SSE75 and BBWi as assessed by the standard Bond Ball Mill Work Index laboratory test.
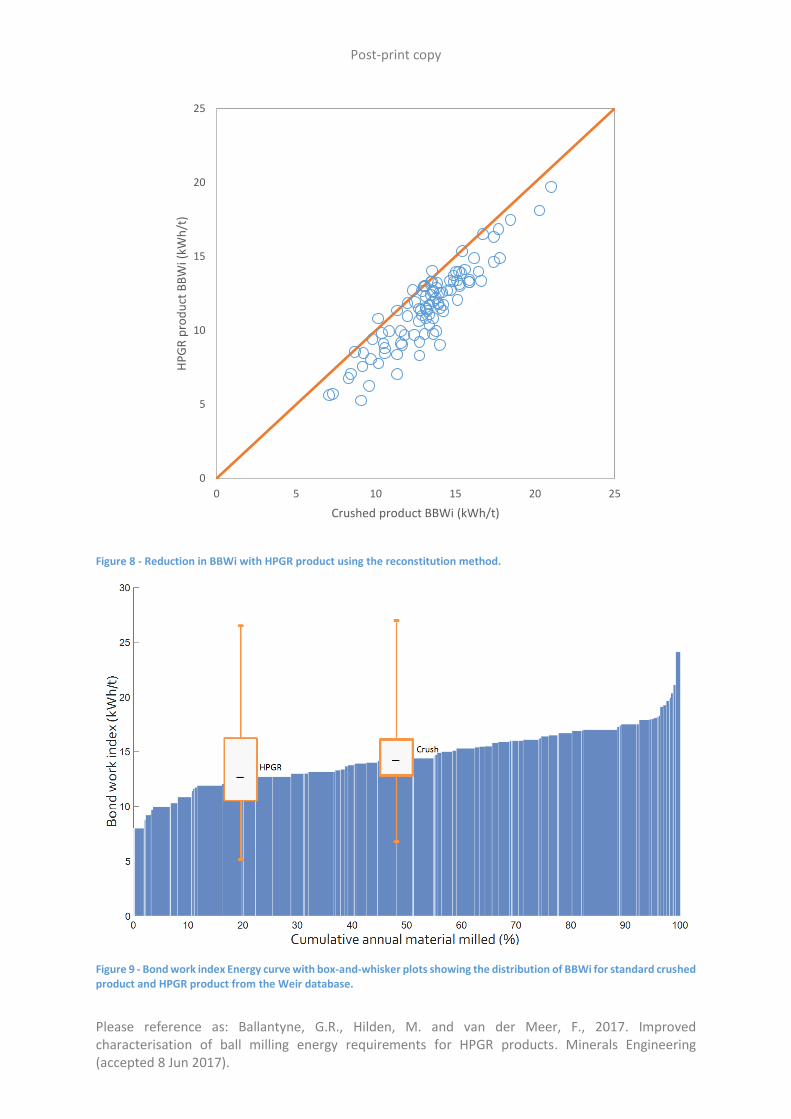
Results 200 Bond Ball Work Index (BBWi) tests were conducted at Weir’s KHD laboratories on products from
both HPGR and progressive crushing. The samples came from a range of commodities and countries:
32 gold, 73 copper, 67 iron and 28 from other commodity groups, and these occurred in 24 countries
globally. The HPGR products were reconstituted to be identical to the progressive crushing product
before conducting the BBWi test, and therefore any differences are likely to be due to a weakening
effect. As shown in Figure 8, the crushed product was consistently measured to have a higher BBWi
than the HPGR product. The repeatability of Bond tests has been measured by Weier (2016) to be
±4.8% (95% Confidence Interval) which is significantly smaller than the average difference. The
reduction in BBWi with HPGR processing was not related to the Work Index of the ore and thus the
standard method of representing the reduction as a percentage is not applicable (see Figure 8). The
average reduction in BBWi across all these tests was 1.7 kWh/t and a standard deviation of 1.1 with
no significant influence of the ore-types evaluated (copper, gold and iron ores). Stephenson (1997)
found the reduction to be dependent on ore-type, therefore a more detailed description of the gangue
mineralogy and grain structure may show some dependence. The distribution of BBWi from the tests
was converted into a box-and-whisker plot and the median was used to plot the reduction on the Bond
Energy Intensity Curve (Ballantyne and Powell, 2014). The distribution shown for both HPGR and crush
product do not represent the experimental error, but the distribution of the database results. The
position of the crushed ore near the 50th percentile is a reflection of the fact that the majority of the
underlying energy curve have been measured on crusher product. The reduction in BBWi from
crushed to HPGR product is shown to be significant as it results in an effective reduction from the 48th
percentile to the 20th percentile on this Energy Curve (Figure 9).
SSE75 Measured
SSE75 Calculated
0
5
10
15
20
25
30
35
40
45
50
0 5 10 15 20 25 30 35 40
Size
Sp
ecif
ic E
ner
gy (
kWh
/t-7
5μ
m)
Bond Work Index (kWh/t)
Post-print copy
Please reference as: Ballantyne, G.R., Hilden, M. and van der Meer, F., 2017. Improved characterisation of ball milling energy requirements for HPGR products. Minerals Engineering (accepted 8 Jun 2017).
Figure 8 - Reduction in BBWi with HPGR product using the reconstitution method.
Figure 9 - Bond work index Energy curve with box-and-whisker plots showing the distribution of BBWi for standard crushed product and HPGR product from the Weir database.
0
5
10
15
20
25
0 5 10 15 20 25
HP
GR
pro
du
ct B
BW
i (kW
h/t
)
Crushed product BBWi (kWh/t)
Post-print copy
Please reference as: Ballantyne, G.R., Hilden, M. and van der Meer, F., 2017. Improved characterisation of ball milling energy requirements for HPGR products. Minerals Engineering (accepted 8 Jun 2017).
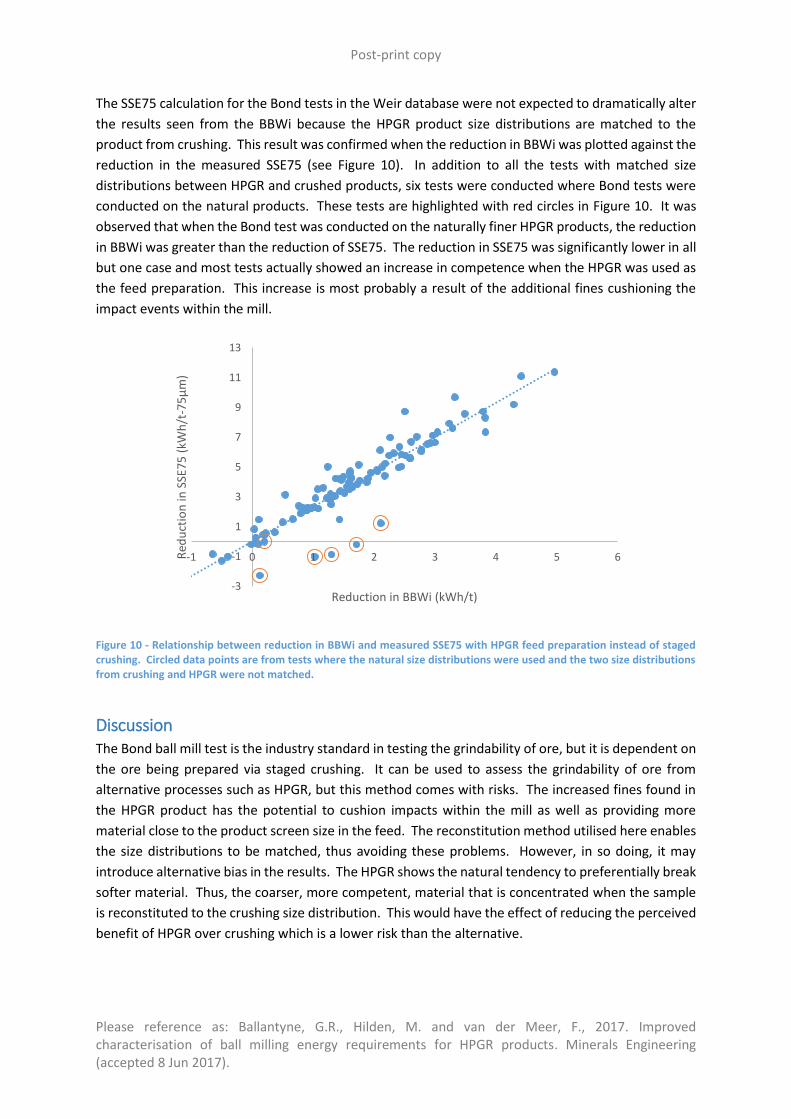
The SSE75 calculation for the Bond tests in the Weir database were not expected to dramatically alter
the results seen from the BBWi because the HPGR product size distributions are matched to the
product from crushing. This result was confirmed when the reduction in BBWi was plotted against the
reduction in the measured SSE75 (see Figure 10). In addition to all the tests with matched size
distributions between HPGR and crushed products, six tests were conducted where Bond tests were
conducted on the natural products. These tests are highlighted with red circles in Figure 10. It was
observed that when the Bond test was conducted on the naturally finer HPGR products, the reduction
in BBWi was greater than the reduction of SSE75. The reduction in SSE75 was significantly lower in all
but one case and most tests actually showed an increase in competence when the HPGR was used as
the feed preparation. This increase is most probably a result of the additional fines cushioning the
impact events within the mill.
Figure 10 - Relationship between reduction in BBWi and measured SSE75 with HPGR feed preparation instead of staged crushing. Circled data points are from tests where the natural size distributions were used and the two size distributions from crushing and HPGR were not matched.
Discussion The Bond ball mill test is the industry standard in testing the grindability of ore, but it is dependent on
the ore being prepared via staged crushing. It can be used to assess the grindability of ore from
alternative processes such as HPGR, but this method comes with risks. The increased fines found in
the HPGR product has the potential to cushion impacts within the mill as well as providing more
material close to the product screen size in the feed. The reconstitution method utilised here enables
the size distributions to be matched, thus avoiding these problems. However, in so doing, it may
introduce alternative bias in the results. The HPGR shows the natural tendency to preferentially break
softer material. Thus, the coarser, more competent, material that is concentrated when the sample
is reconstituted to the crushing size distribution. This would have the effect of reducing the perceived
benefit of HPGR over crushing which is a lower risk than the alternative.
-3
-1
1
3
5
7
9
11
13
-1 0 1 2 3 4 5 6Red
uct
ion
in S
SE7
5 (
kWh
/t-7
5μ
m)
Reduction in BBWi (kWh/t)
Post-print copy
Please reference as: Ballantyne, G.R., Hilden, M. and van der Meer, F., 2017. Improved characterisation of ball milling energy requirements for HPGR products. Minerals Engineering (accepted 8 Jun 2017).
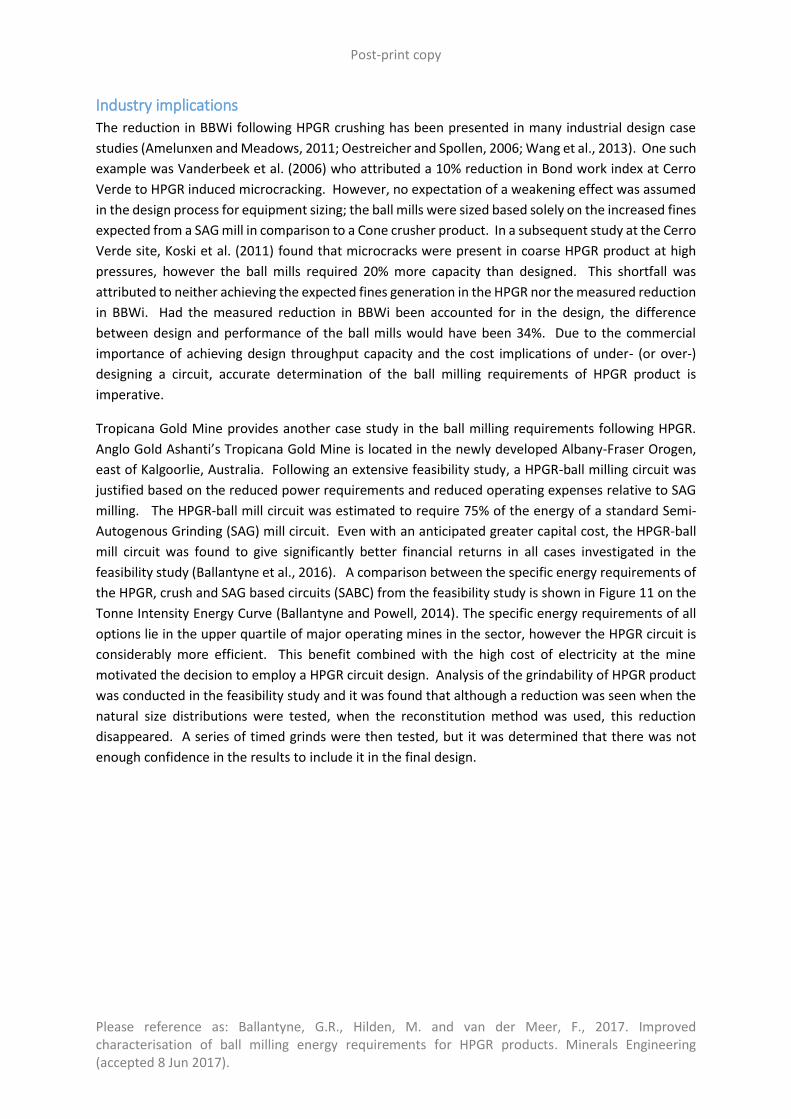
Industry implications
The reduction in BBWi following HPGR crushing has been presented in many industrial design case
studies (Amelunxen and Meadows, 2011; Oestreicher and Spollen, 2006; Wang et al., 2013). One such
example was Vanderbeek et al. (2006) who attributed a 10% reduction in Bond work index at Cerro
Verde to HPGR induced microcracking. However, no expectation of a weakening effect was assumed
in the design process for equipment sizing; the ball mills were sized based solely on the increased fines
expected from a SAG mill in comparison to a Cone crusher product. In a subsequent study at the Cerro
Verde site, Koski et al. (2011) found that microcracks were present in coarse HPGR product at high
pressures, however the ball mills required 20% more capacity than designed. This shortfall was
attributed to neither achieving the expected fines generation in the HPGR nor the measured reduction
in BBWi. Had the measured reduction in BBWi been accounted for in the design, the difference
between design and performance of the ball mills would have been 34%. Due to the commercial
importance of achieving design throughput capacity and the cost implications of under- (or over-)
designing a circuit, accurate determination of the ball milling requirements of HPGR product is
imperative.
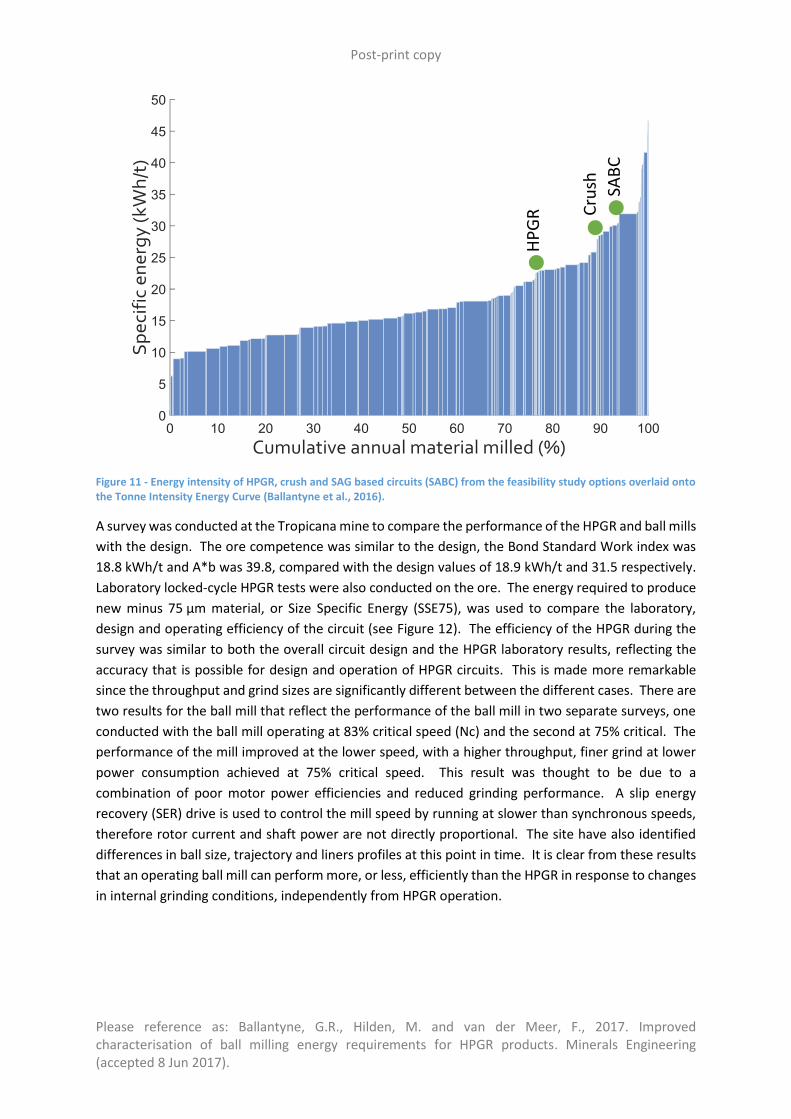
Tropicana Gold Mine provides another case study in the ball milling requirements following HPGR.
Anglo Gold Ashanti’s Tropicana Gold Mine is located in the newly developed Albany-Fraser Orogen,
east of Kalgoorlie, Australia. Following an extensive feasibility study, a HPGR-ball milling circuit was
justified based on the reduced power requirements and reduced operating expenses relative to SAG
milling. The HPGR-ball mill circuit was estimated to require 75% of the energy of a standard Semi-
Autogenous Grinding (SAG) mill circuit. Even with an anticipated greater capital cost, the HPGR-ball
mill circuit was found to give significantly better financial returns in all cases investigated in the
feasibility study (Ballantyne et al., 2016). A comparison between the specific energy requirements of
the HPGR, crush and SAG based circuits (SABC) from the feasibility study is shown in Figure 11 on the
Tonne Intensity Energy Curve (Ballantyne and Powell, 2014). The specific energy requirements of all
options lie in the upper quartile of major operating mines in the sector, however the HPGR circuit is
considerably more efficient. This benefit combined with the high cost of electricity at the mine
motivated the decision to employ a HPGR circuit design. Analysis of the grindability of HPGR product
was conducted in the feasibility study and it was found that although a reduction was seen when the
natural size distributions were tested, when the reconstitution method was used, this reduction
disappeared. A series of timed grinds were then tested, but it was determined that there was not
enough confidence in the results to include it in the final design.
Post-print copy
Please reference as: Ballantyne, G.R., Hilden, M. and van der Meer, F., 2017. Improved characterisation of ball milling energy requirements for HPGR products. Minerals Engineering (accepted 8 Jun 2017).
Figure 11 - Energy intensity of HPGR, crush and SAG based circuits (SABC) from the feasibility study options overlaid onto the Tonne Intensity Energy Curve (Ballantyne et al., 2016).
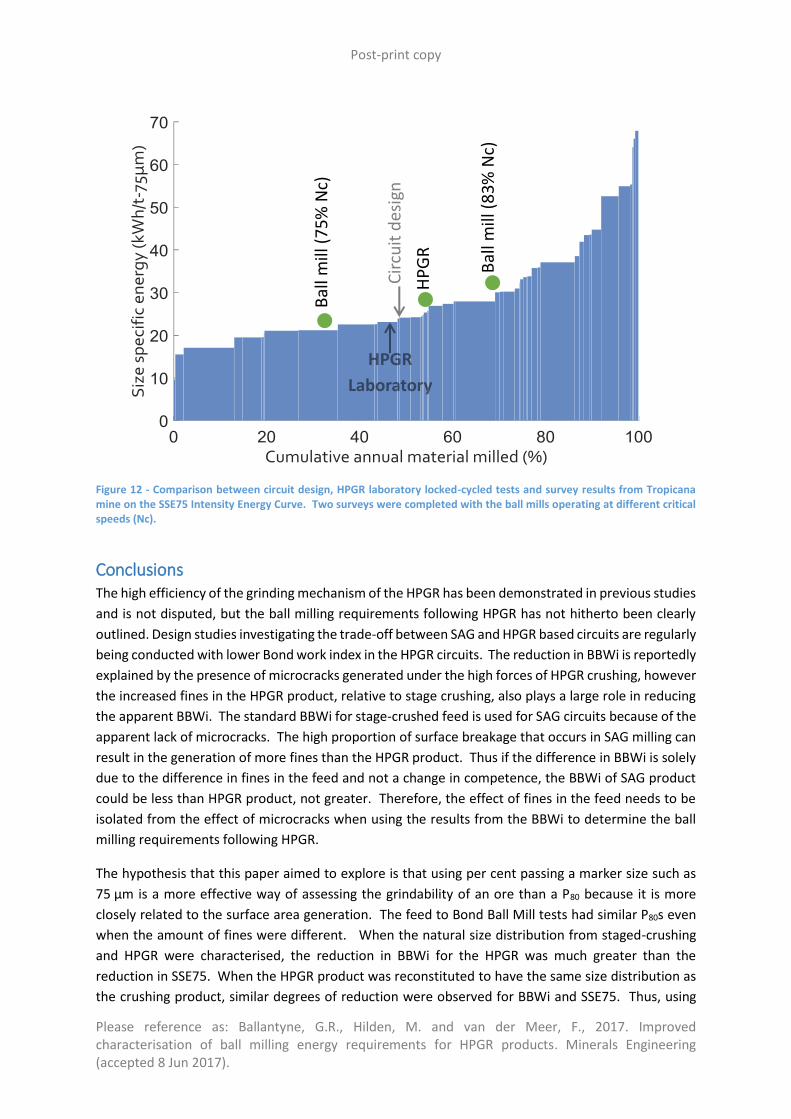
A survey was conducted at the Tropicana mine to compare the performance of the HPGR and ball mills
with the design. The ore competence was similar to the design, the Bond Standard Work index was
18.8 kWh/t and A*b was 39.8, compared with the design values of 18.9 kWh/t and 31.5 respectively.
Laboratory locked-cycle HPGR tests were also conducted on the ore. The energy required to produce
new minus 75 µm material, or Size Specific Energy (SSE75), was used to compare the laboratory,
design and operating efficiency of the circuit (see Figure 12). The efficiency of the HPGR during the
survey was similar to both the overall circuit design and the HPGR laboratory results, reflecting the
accuracy that is possible for design and operation of HPGR circuits. This is made more remarkable
since the throughput and grind sizes are significantly different between the different cases. There are
two results for the ball mill that reflect the performance of the ball mill in two separate surveys, one
conducted with the ball mill operating at 83% critical speed (Nc) and the second at 75% critical. The
performance of the mill improved at the lower speed, with a higher throughput, finer grind at lower
power consumption achieved at 75% critical speed. This result was thought to be due to a
combination of poor motor power efficiencies and reduced grinding performance. A slip energy
recovery (SER) drive is used to control the mill speed by running at slower than synchronous speeds,
therefore rotor current and shaft power are not directly proportional. The site have also identified
differences in ball size, trajectory and liners profiles at this point in time. It is clear from these results
that an operating ball mill can perform more, or less, efficiently than the HPGR in response to changes
in internal grinding conditions, independently from HPGR operation.
HP
GR
Cru
sh
SAB
C
Post-print copy
Please reference as: Ballantyne, G.R., Hilden, M. and van der Meer, F., 2017. Improved characterisation of ball milling energy requirements for HPGR products. Minerals Engineering (accepted 8 Jun 2017).
Figure 12 - Comparison between circuit design, HPGR laboratory locked-cycled tests and survey results from Tropicana mine on the SSE75 Intensity Energy Curve. Two surveys were completed with the ball mills operating at different critical speeds (Nc).
Conclusions The high efficiency of the grinding mechanism of the HPGR has been demonstrated in previous studies
and is not disputed, but the ball milling requirements following HPGR has not hitherto been clearly
outlined. Design studies investigating the trade-off between SAG and HPGR based circuits are regularly
being conducted with lower Bond work index in the HPGR circuits. The reduction in BBWi is reportedly
explained by the presence of microcracks generated under the high forces of HPGR crushing, however
the increased fines in the HPGR product, relative to stage crushing, also plays a large role in reducing
the apparent BBWi. The standard BBWi for stage-crushed feed is used for SAG circuits because of the
apparent lack of microcracks. The high proportion of surface breakage that occurs in SAG milling can
result in the generation of more fines than the HPGR product. Thus if the difference in BBWi is solely
due to the difference in fines in the feed and not a change in competence, the BBWi of SAG product
could be less than HPGR product, not greater. Therefore, the effect of fines in the feed needs to be
isolated from the effect of microcracks when using the results from the BBWi to determine the ball
milling requirements following HPGR.
The hypothesis that this paper aimed to explore is that using per cent passing a marker size such as
75 µm is a more effective way of assessing the grindability of an ore than a P80 because it is more
closely related to the surface area generation. The feed to Bond Ball Mill tests had similar P80s even
when the amount of fines were different. When the natural size distribution from staged-crushing
and HPGR were characterised, the reduction in BBWi for the HPGR was much greater than the
reduction in SSE75. When the HPGR product was reconstituted to have the same size distribution as
the crushing product, similar degrees of reduction were observed for BBWi and SSE75. Thus, using
Bal
l mill
(7
5% N
c)
Bal
l mill
(8
3% N
c)
HP
GR
Post-print copy
Please reference as: Ballantyne, G.R., Hilden, M. and van der Meer, F., 2017. Improved characterisation of ball milling energy requirements for HPGR products. Minerals Engineering (accepted 8 Jun 2017).
the SSE75 is preferred to the BBWi to characterise the grinding requirements of HPGR product versus
crusher product. A methodology to calculate the SSE75 from a standard Bond Ball Mill test has been
described. This methodology will help identify undersized ball mills following equipment that
generate different size distribution gradients from the standard staged crushing product.
This analysis exclusively focused on the Bond ball test, but in so doing, highlighted many flaws in this
test for the characterisation of HPGR products. The HPGR action is likely to result in weaker coarser
progeny, due to microcracking, and intact fines. In addition, the HPGR product is typically screened
at coarser sizes than 5 mm. The fact that the standard Bond test is conducted on -3.35 mm material
means that the selective weakening of coarser particles is not isolated. The mineral processing
practitioner should make every effort to separate the effect of changes in the shape of the size
distribution from the strength of the rock when characterising ore for ball milling following HPGR.
More measurement of the degree of weakening and microcracking would be obtained by combining
single particle strength measurements with bulk tomography measurements. This would enable the
strength by size relationship to be determined and correlated to a measure of degree of micro-
cracking. This methodology would allow the full HPGR progeny to be measured and could also be
used to measure the degree of preferential liberation that occurred. These results should then be
compared to the product from a pilot scale SAG mill to reduce the bias that could be created from
scalping the crushed feed.
References Amelunxen, P., Meadows, D., 2011. Not another HPGR trade-off study! Minerals & Metallurgical
Processing 28, 1-7.
Ballantyne, G.R., Peukert, W., Powell, M.S., 2015. Size specific energy (SSE)—Energy required to
generate minus 75 micron material. International Journal of Mineral Processing 139, 2-6.
Ballantyne, G.R., Powell, M.S., 2014. Benchmarking comminution energy consumption for the
processing of copper and gold ores. Minerals Engineering 65, 109-114.
Ballantyne, G.R., Powell, M.S., Clarke, N., Di Trento, M., Kock, F., Putland, B., 2016. Energy curve case
study (AngloGold Ashanti), SME Annual Conference and Expo (ACE), Phoenix, Arizona.
Bartholomew, K.M., McIvor, R.E., Arafat, O., 2014. Functional Performance of Ball Milling Circuits - A
plant metallurgist's tool for process characterisation and optimisation, Mill Operators Conference,
Townsville, Australia, pp. 227-231.
Battersby, M.J.G., Kellerwessel, H., Oberheuser, G., 1992. Important Advances in the Development of
High Pressure Rolls Comminution for the Minerals Industry, Extractive Metallurgy of Gold and Base
Metals, Kalgoorlie, Australia, pp. 159 - 166.
Baum, W., and Ausburn, K., 2011. HPGR Comminution for Optimization of Copper Leaching, Minerals
and Metallurgical Processing 28(2):77-81
Post-print copy
Please reference as: Ballantyne, G.R., Hilden, M. and van der Meer, F., 2017. Improved characterisation of ball milling energy requirements for HPGR products. Minerals Engineering (accepted 8 Jun 2017).
Baum, W., Patzelt, N., Knecht, J., 1997. Metallurgical benefits of high pressure roll grinding for gold
and copper recovery, Society of Mining Engineering (SME), Denver, Colorado, pp. 111-116.
Bond, F.C., 1949. Standard Grindability Tests Tabulated, AIME Transactions, p. 313.
Bond, F.C., 1952. The third theory of comminution. Transactions AIME, 484-494.
Bond, F.C., 1961. Crushing and Grinding Calculations Parts 1 and 2. British Chemical Engineering 6,
378-385, 543-548.
Bueno, M.P., Kojovic, T., Powell, M.S., Shi, F., 2013. Multi-component AG/SAG mill model. Minerals
Engineering 43–44, 12-21.
Clarke, A.J., Wills, B.A., 1989. Technical note Enhancement of cassiterite liberation by high pressure
roller comminution. Minerals Engineering 2, 259-262.
Daniel, M.J., 2007. Energy efficient mineral liberation using HPGR technology, Julius Kruttschnitt
Mineral Research Centre. The University of Queensland, (Unpublished Thesis).
Davaanyam, Z., Klein, B., Nadolski, S., 2015. Using piston press tests for determining optimal energy
input for an hpgr operation, SAG conference, Vancouver, Canada.
Esna-Ashari, M., Kellerwessel, H., 1988. Interparticle crushing of gold ore improves leaching, Randol
Gold Forum Scottsdale.
Garcia, D., Lin, C.L., Miller, J.D., 2009. Quantitative analysis of grain boundary fracture in the breakage
of single multiphase particles using X-ray microtomography procedures. Minerals Engineering 22, 236-
243.
Hogg, R., Fuerstenau, D.W., 1972. Power relationships for tumbling mills. SME-AIME 252, 418-432.
Kodali, P., Dhawan, N., Depci, T, Lin, C.L., and Miller, J.D. Particle damage and exposure analysis in
HPGR crushing of selected copper ores for column leaching, Minerals Engineering, Volume 24, Issue
13, October 2011, Pages 1478-1487
Koski, S., Vanderbeek, J., Enriquez, J., 2011. Cerro Verde concentrator - four years operating HPGRs,
SAG 2011. Department of Mining Engineering, University of British Columbia, Vancouver, B. C.,
Canada.
Levin, J., 1989. Observation on the Bond standard grindability test, and a proposal for a standard
grindability test for fine materials. SAIMM 89, 13-21.
Levin, J., 1992. Indicators of grindability and grinding efficiency. Jounal of South African Institute of
Mining and Metallurgy 92, 283-290.
Lin, C.L., Miller, J.D., Hsieh, C.H., 2012. Particle damage during HPGR breakage as described by specific
surface area distribution of cracks in the crushed products, IMPC 2012, New Delhi, India, pp. 3397 -
3410.
Post-print copy
Please reference as: Ballantyne, G.R., Hilden, M. and van der Meer, F., 2017. Improved characterisation of ball milling energy requirements for HPGR products. Minerals Engineering (accepted 8 Jun 2017).
Morrell, S., 1992. Prediction of grinding-mill power. The Institution of Mining and Mettalurgy (Section
C: Mineral processing and extractive metallurgy) 101, C25-C32.
Morrell, S., 2009. Predicting the overall specific energy requirement of crushing, high pressure grinding
roll and tumbling mill circuits. Minerals Engineering 22, 544-549.
Musa, F., Morrison, R., 2009. A more sustainable approach to assessing comminution efficiency.
Minerals Engineering 22, 593-601.
Oestreicher, C., Spollen, C.F., 2006. HPGR versus SAG mill selection for the Los Bronces grinding circuit
expansion, SAG 2006. Department of Mining Engineering, University of British Columbia, Vancouver,
B. C., Canada, pp. 110-123.
Otte, O., 1988. Polycom high pressure grinding principles and industrial application, Third Mill
Operators' Conference. AusIMM, Cobar, NSW, pp. 131-136.
Palm, N., Shackleton, N., Malysiak, V., O’Connor, C.T., 2010a. The effect of using different
comminution procedures on the flotation of platinum group minerals. In: XXVth International Mineral
Processing Congress. AusIMM, Brisbane, Australia, pp. 1077–1083.
Patzelt, N., Klymowsky, R.I.B., Knecht, J., Burchardt, E., 2005. HPGRs for hard rock applications, Randol
Innovative Metallurgy Forum, Perth, pp. 80-89.
Patzelt, N., Klymowsky, R.I.B., Knecht, J., Burchardt, E., 2006. High-pressure grinding rolls for
gold/copper applications, in: Kawatra, S.K. (Ed.), Advances in Comminution, pp. 51-68.
Patzelt, N., Knecht, J., 1996. The use of high pressure roll grinding for optimization of copper leaching
in: Baum, w. (Ed.), SME Annual Meeting, Phoenix, Arizona.
Rajamani, K., Herbst, J.A., 1984. Simultaneous estimation of selection and breakage functions from
batch and continuous grinding data. Transactions of the Institution of Mining and Metallurgy, Section
C: Mineral Processing and Extractive Metallurgy 93, 74-85.
Rowland, C.A., Kjos, D.M., 1980. Rod and ball mills, in: Mular, A.L., Bhuppa, R.B. (Eds.), Mineral
Processing Plant Design, AIME, pp. 239-278.
Schönert, K., 1988. A first survey of grinding with high-compression roller mills. International Journal
of Mineral Processing 22, 401-412.
Shi, F., Lambert, S., Daniel, M., 2006. A study of the effects of hpgr treating platinum ores, SAG 2006.
University of British Columbia, Vouncouver, Canada.
Solomon, N., Becker, M., Mainza, A., Petersen, J. and Franzidis, J.-P. 2011. Understanding the influence
of HPGR on PGM flotation behavior using mineralogy, Minerals Engineering, 24. pp 1370-1377.
Stephenson, I., 1997. The Downstream effects of high pressure grinding rolls processing (PhD thesis),
Julius Kruttschnitt Mineral Research Centre, Department of Mining, Materials and Minerals
Engineering. University of Queensland.
Post-print copy
Please reference as: Ballantyne, G.R., Hilden, M. and van der Meer, F., 2017. Improved characterisation of ball milling energy requirements for HPGR products. Minerals Engineering (accepted 8 Jun 2017).
Tavares, L.M., 2005. Particle weakening in high-pressure roll grinding. Minerals Engineering 18, 651-
657.
Tüzün, M.A., 2001. Wet Bond mill test. Minerals Engineering 14, 369-373.
van der Meer, F.P., Gruendken, A., 2010. Flowsheet considerations for optimal use of high pressure
grinding rolls. Minerals Engineering 23, 663-669.
van der Meer, F.P., Schnabel, H.G., 1997. The effect of roller press grinding on ball milling energy.
Erzmetall 50, 554-561.
Vanderbeek, J.L., Linde, T.B., Brack, W.S., Marsden, J.O., 2006. HPGR implementation at Cerro Verde,
SAG 2006. Department of Mining Engineering, University of British Columbia, Vancouver, B. C.,
Canada, pp. 45-61.
Vizcarra, T.G., Wightman, E.M., Johnson, N.W., Manlapig, E.V., 2010. The effect of breakage
mechanism on the mineral liberation properties of sulphide ores. Minerals Engineering 23, 374-382.
Wang, C., Nadolski, S., Mejia, O., Drozdiak, J., Klein, B., 2013. Energy and cost comparisons of HPGR
based circuits with the SABC circuit installed at the Huckleberry mine, 45th Annual Canadian Mineral
Processors Operators Conference, Ottawa, Ontario, pp. 121-135.
Watson, S., Brooks, M., 1994. KCGM Evaluation of High Pressure Grinding Roll Technology, Fifth Mill
Operators' Conference. AusIMM, Roxby Downs SA, pp. 69-83.
Weier, M., 2016. JKTech 2015/16 Comparative Testing Program Report, in: Chenje, T., Napier-Munn,
T., Morrell, S. (Eds.). JKTech Job 14294.
Xu, W., Dhawan, N., Lin, C.-L., Miller, J.D., 2013. Further study of grain boundary fracture in the
breakage of single multiphase particles using X-ray microtomography procedures. Minerals
Engineering 46–47, 89-94.
Acknowledgements With thanks to the Coalition for Energy Efficient Comminution (CEEC) who provided the resources to
complete this analysis and Weir Minerals, AngloGold Ashanti and Orway Mineral Consultants (OMC)
who showed enthusiasm and openness to collaborate in this investigation. As stated in the authorship
notes: comparative Bond work index data were supplied by Frank van der Meer, Evert Lessing and Ric
Stocco of Weir Minerals. And design, laboratory and operating data from Tropicana Mine were
supplied by Nick Clarke, Mike Di Trento of AngloGold Ashanti, and Fred Kock and Brian Putland of
Orway Mineral Consultants (OMC).