Improved Boiler Performance using Targeted Sootblower ...€¦ · Improved Boiler Performance using...
23
Improved Boiler Performance using Targeted Sootblower Activation 2015 EPRI Heat Rate Improvement Conference February 3-5, 2015 Steve Piche, Director Research & Development, NeuCo, Inc. [email protected]
Transcript of Improved Boiler Performance using Targeted Sootblower ...€¦ · Improved Boiler Performance using...
Improved Boiler Performance
using Targeted Sootblower
Activation
2015 EPRI Heat Rate Improvement Conference
February 3-5, 2015
Steve Piche, Director Research & Development, NeuCo, Inc.

Outline
Introduction
Modeling the Cleanliness Factor
Optimizing Blower Activation
Results
Conclusions
1

Traditional Sequence Based Blowing
2
• Blowers are grouped in zones based upon locations
• Operator activates a cleaning sequence for the zones.
• Once a zone is selected, the blowers are activated in a predetermined order.

Intelligent Sootblowing
3
• Blowers are grouped in zones based upon locations
• Software, often rules based, selects a zone for cleaning.
• Once a zone is selected, the blowers are activated in a predetermined order or
based upon simple logic.
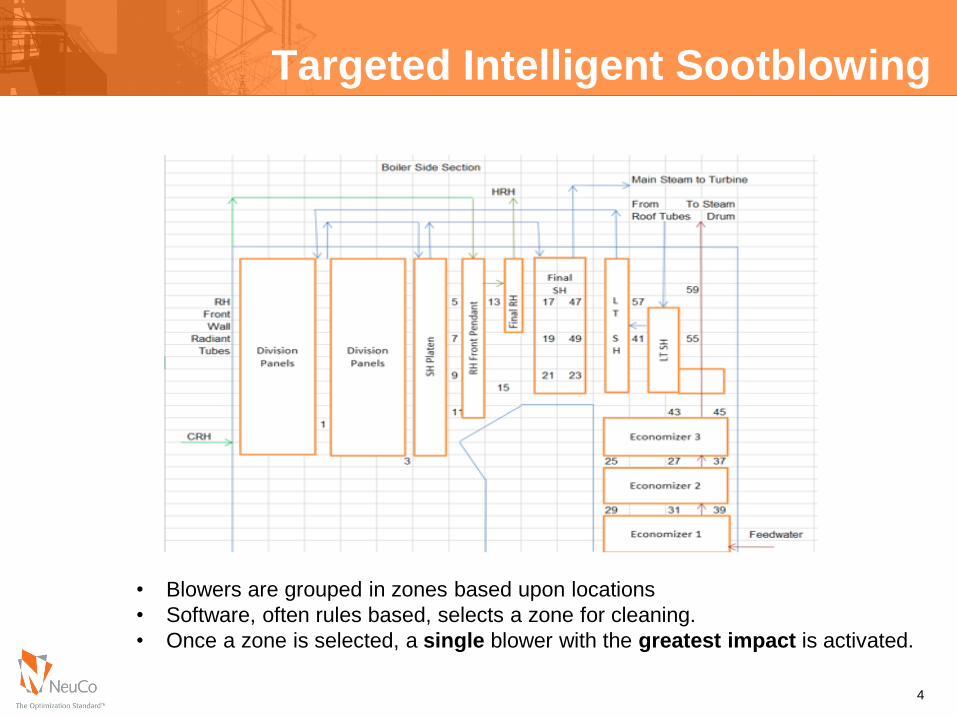
Targeted Intelligent Sootblowing
4
• Blowers are grouped in zones based upon locations
• Software, often rules based, selects a zone for cleaning.
• Once a zone is selected, a single blower with the greatest impact is activated.

Targeted Intelligent Sootblowing Technologies
A rules based expert system is used to select a
zone for cleaning.
Performance calculations are used to compute the
cleanliness factors and heat duties of boiler heat
transfer surfaces.
Neural network based models are used to represent
the relationship between blower activation and
cleanliness of the boiler sections.
In selecting a blower, optimization techniques are
used to select a blower for activation based upon
maximizing a goal (greatest impact) while observing
constraints (typical minimum and maximum idle
times).
5
Neural Network Modeling of
the Cleanliness Factors
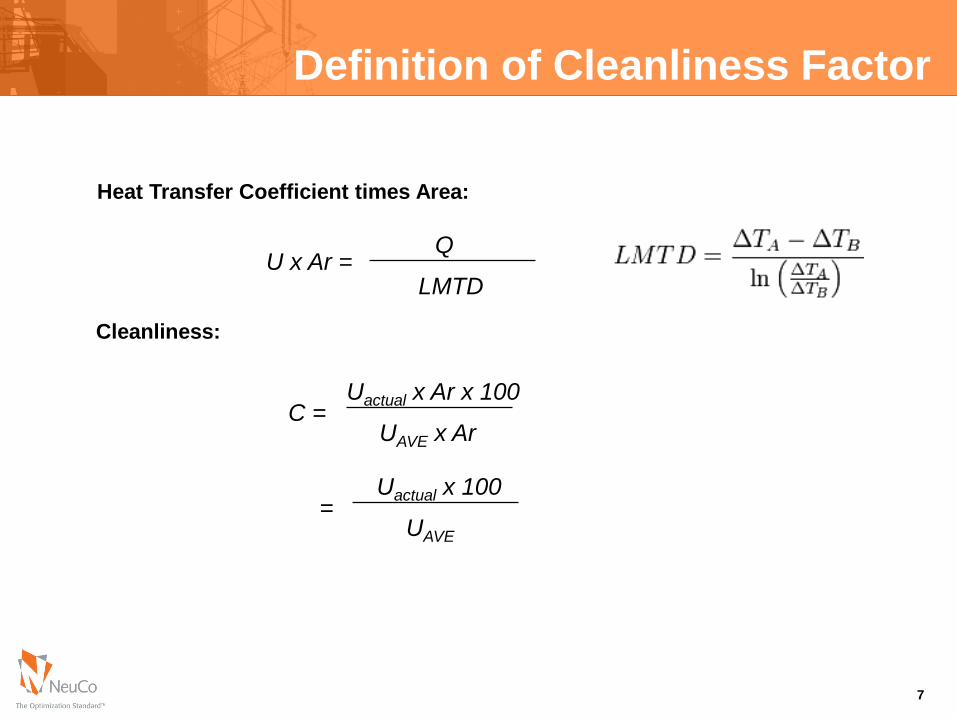
Definition of Cleanliness Factor
7
Heat Transfer Coefficient times Area:
U x Ar = Q
LMTD
Cleanliness:
C = Uactual x Ar x 100
UAVE x Ar
= Uactual x 100
UAVE

The Pyramid of Calculations for Cleanliness Factors
8
Steam Flow Calculations
Boiler Heat Duty Calculation
Boiler Efficiency
Gas Flow
Gas Temps
Cleanliness

Neural Network Model
Neural network modeling is a curve fitting approach.
Neural network models are trained using historical
data. (In this case, we used 3 months of blower
activation and heat transfer coefficient data.)
Neural network models are convenient when you
have lots of data and not very good understanding of
the first principles involved.
9
Neural
Network
Model
Blower 1 Time Since Last Blow
Blower 2 Time Since Last Blow
Blower 3 Time Since Last Blow
Heat Transfer
Coefficient or
Cleanliness
Factor

Division Panel Heat Transfer Coefficient (1 Day)
10
• Red Line: Actual heat transfer coefficient
• Navy Blue Line: Neural prediction of heat transfer coefficient
• Yellow, Light Blue and Orange Lines: Time since blower activation

Division Panel Heat Transfer Coefficient (1 week)
11
• Red Line: Actual heat transfer coefficient
• Navy Blue Line: Neural prediction of heat transfer coefficient
• Yellow, Light Blue and Orange Lines: Time since blower activation

Optimizing Blower
Selection

Scenario Evaluation
(Blower 1 with time since = 0)
13
Cleanliness
Neural
Network
Model
Blower_1_TS(t+1) = 0
Blower_2_TS(t)
Blower_3_TS(t)
Delta_Cleanliness_1_(t+1)
Cleanliness
Neural
Network
Model
+-
+
Blower_1_TS(t)
Blower_2_TS(t)
Blower_3_TS(t)
The change in cleanliness due to blower activation can be predicted by
modifying the blower time since activation from the current value to a value
of zero.

Optimization Example
If any time since last activation for a blower in the zone is
greater than the maximum idle time, then activate the
blower with the longest idle time otherwise
select the blower in a zone that maximizes the following
function:
max_i(Delta_Cleanliness_i(t+1))
subject to the constraint that the time since last blow for
blower i is greater than a minimum idle time.
14

Optimization Formulation
The previous example gives a simple optimization
formulation, more complex optimization formulations
can be allowed such as
Zone Specific Optimization Function: The optimization
formulation can be tailored for a specific zone, ie. not all
formulations for each zone need be the same.
Multiple Neural Models per Zone: Blowers in some zones
affect two heat transfer surfaces, thus, two neural models
may be needed in the formulation.
Advantage of Average Change in Heat Duty: If using two
models, it may be preferable to model the change in average
heat duty rather than average change in cleanliness. This
biases blowers to cleaning larger heating surfaces.
15

Results
Experimental Data
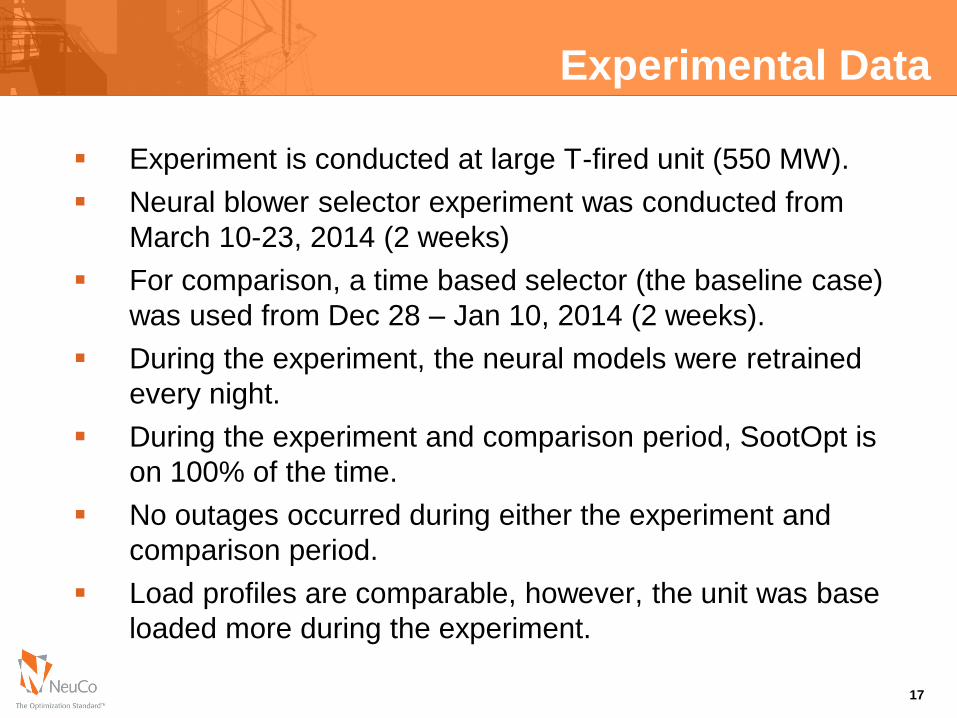
Experiment is conducted at large T-fired unit (550 MW).
Neural blower selector experiment was conducted from
March 10-23, 2014 (2 weeks)
For comparison, a time based selector (the baseline case)
was used from Dec 28 – Jan 10, 2014 (2 weeks).
During the experiment, the neural models were retrained
every night.
During the experiment and comparison period, SootOpt is
on 100% of the time.
No outages occurred during either the experiment and
comparison period.
Load profiles are comparable, however, the unit was base
loaded more during the experiment.
17

Blower Impacts West during Baseline
18

Blower Impacts West during Neural Selection
19

Sootblowing Counts
20
Zone Baseline Neural Selector Percent Change
SH Platen 93 96 3.2
Reheat 1 257 163 -36.6
Reheat 2 423 251 -40.7
Low Temp SH 225 151 -32.9
Economizer 393 448 14.0
Total 1391 1109 -20.3
20% reduction in blowing

Superheat and Reheat Temperatures
21
Baseline Scatter Plot (Temp vs MW) Neural Selector Scatter Plot (Temp vs MW)
Average Temp Baseline Neural Selector Change
Superheat East 992 997 5
Superheat West 999 998 -1
Reheat East 965 980 15
Reheat West 968 976 8
Average 7
Increases in steam temperatures results in improved heat rate.
Conclusions
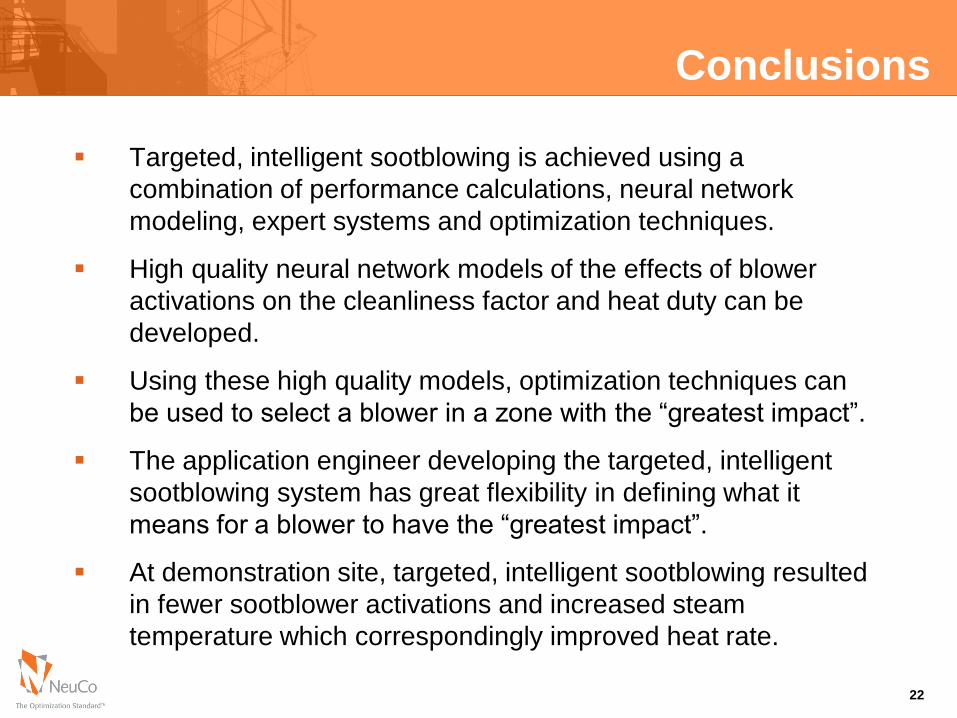
Targeted, intelligent sootblowing is achieved using a
combination of performance calculations, neural network
modeling, expert systems and optimization techniques.
High quality neural network models of the effects of blower
activations on the cleanliness factor and heat duty can be
developed.
Using these high quality models, optimization techniques can
be used to select a blower in a zone with the “greatest impact”.
The application engineer developing the targeted, intelligent
sootblowing system has great flexibility in defining what it
means for a blower to have the “greatest impact”.
At demonstration site, targeted, intelligent sootblowing resulted
in fewer sootblower activations and increased steam
temperature which correspondingly improved heat rate.
22


![Flow Visualization of Interaction between a Sootblower Jet ......flow [4, 5], or measuring sootblower jet force in-situ [6, 7]. However, the interaction of a sootblower jet with tubes](https://static.fdocuments.in/doc/165x107/60b44f6c40faaf67c553be4d/flow-visualization-of-interaction-between-a-sootblower-jet-flow-4-5.jpg)