IMPROVE Particle Monitoring Network: Status Report to...
52
IMPROVE Particle Monitoring Network: Status Report to IMPROVE Steering Committee Chuck McDade Crocker Nuclear Laboratory University of California, Davis Mammoth Cave National Park September 2006
Transcript of IMPROVE Particle Monitoring Network: Status Report to...

IMPROVEParticle Monitoring Network:
Status Report to IMPROVE Steering Committee
Chuck McDadeCrocker Nuclear Laboratory
University of California, DavisMammoth Cave National Park
September 2006

IMPROVE NetworkSummer 2006
.
IMPROVE Sites Protocol Sites
MOOS
ACAD
PRIS
PENO GRGU
CABA BRMA
PMRF
LYBR CACO
QURE MAVI
MOMO
COHI
BRIG AREN
MKGO
QUCI
DOSO SHEN JARI
SENE ISLE
BOWA VOYA
BOND
LIVO
SWAN
WIMO
CACR
UPBU
HEGL MING
BIRM
CADI
MACA
GRSM LIGO
SHRO
COHU ROMA
OKEF
SAMA SIKE
BRET CHAS
EVER VIIS
SIME
TUXE
DENA
HALE
HAVO
BIBE
GUMO
SACR
WHIT
GICL BOAP
BAND
SAPE
WHPE
PEFO
CHIR
SAGU SAWE ORPI
HILL TONT
QUVA
BALD
SIAN
IKBA SYCA
HANC MEAD
INGA BRCA
ZICA CAPI
CANY
MEVE WEMI
GRSA
WHRI
ROMO MOZI GRBA
JOSH AGTI
SAGO SAGA
RAFA
DEVA SEQU
KAIS
PINN YOSE HOOV
BLIS PORE
TRIN LAVO JARB
REDW
LABE
KALM CRLA
STAR THSI
MOHO CORI
WHPA MORA
OLYM
SNPA PASA
NOCA
SPOK
HECA
CRMO SAWT
SULA
CABI
GLAC
MONT GAMO ULBE
MELA LOST
THRO
BADL WICA
WASH
BRID
NOAB
YELL
DOME
ADPI
PHOE
COGO
PUSO
TRCR
STN sites
FLAT
NOCH
FOPE
BLMO THBA
CLPE
CRES
NEBR OMAH
CEBL
GRRI
LASU VILA
SAFO
ELLI
CHER
TALL ELDO
MALO
WARI
AMBL
SHMI
PETE
FRRE
SIPS
HOUS
RUBI
FRES
CHIC
DETR NEYO
PITT
ATLA
EGBE
MAKA

IMPROVE NetworkUrban Sites
.
IMPROVE Sites Protocol Sites
MOOS
ACAD
PRIS
OLTO GRGU
CABA BRMA
PMRF
LYBR CACO
QURE MAVI
MOMO
COHI
BRIG AREN
MKGO
QUCI
DOSO SHEN JARI
SENE ISLE
BOWA VOYA
BOND
LIVO
SWAN
WIMO
CACR
UPBU
HEGL MING
BIRM
CADI
MACA
GRSM LIGO SHRO
COHU ROMA
OKEF
SAMA SIKE
BRET CHAS
EVER VIIS
SIME
TUXE
DENA
HALE
HAVO
BIBE
GUMO
SACR
WHIT
GICL BOAP
BAND
SAPE
WHPE
PEFO
CHIR
SAGU SAWE ORPI
HILL TONT
QUVA
BALD
SIAN
IKBA SYCA
HANC MEAD
INGA BRCA
ZICA CAPI
CANY
MEVE WEMI
GRSA
WHRI
ROMO MOZI GRBA
JOSH AGTI
SAGO SAGA
RAFA
DEVA SEQU
KAIS
PINN YOSE HOOV
BLIS PORE
TRIN LAVO JARB
REDW
LABE
KALM CRLA
STAR THSI
MOHO CORI
WHPA MORA
OLYM
SNPA PASA
NOCA
SPOK
HECA
CRMO SAWT
SULA
CABI
GLAC
MONT GAMO ULBE
MELA LOST
THRO
BADL WICA
WASH
BRID
NOAB
YELL
DOME
ADPI
PHOE
COGO
PUSO
TRCR
STN sites
FLAT
NOCH
FOPE
BLMO THBA
CLPE
CRES
NEBR OMAH
CEBL
GRRI
LASU VILA
SAFO
ELLI
CHER
TALL ELDO
MALO
WARI
AMBL
SHMI
PETE
FRRE
SIPS
HOUS
RUBI
FRES
CHIC
DETR NEYO PITT
ATLA
EGBE
BALT

2005 Sample Recovery(A Channel, PM2.5 Teflon)
l 94% Q1l 96% Q2l 96% Q3l 96% Q4l 95% Annual A Channel
2003 was 95%, 2004 was 96%

2005 Sample Recovery(All channels, ABCD)
l 92% Q1l 94% Q2l 92% Q3l 94% Q4l 93% Annual ABCD
2003 was 93%, 2004 was 94%
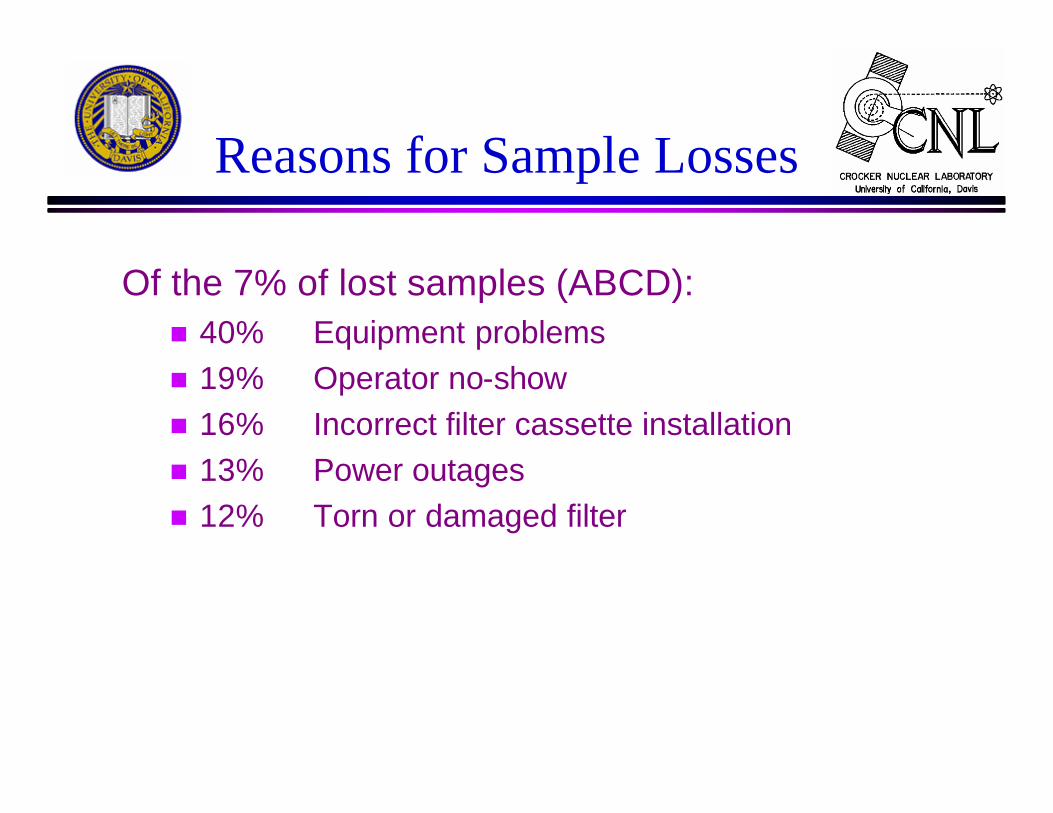
Reasons for Sample Losses
Of the 7% of lost samples (ABCD):n 40% Equipment problemsn 19% Operator no-shown 16% Incorrect filter cassette installationn 13% Power outagesn 12% Torn or damaged filter

Regional Haze Rule Requirements
A “complete” site has, for ABCD:n >75% annual recoveryn >50% recovery in each quartern <11 consecutive missed samples
6 sites failed in 2005 (8 in 2003, 5 in 2004)n Three additional sites had clogged inlets, but may
be able to substitute or simulate missing data –Chassahowitzka, Mingo, Swanquarter
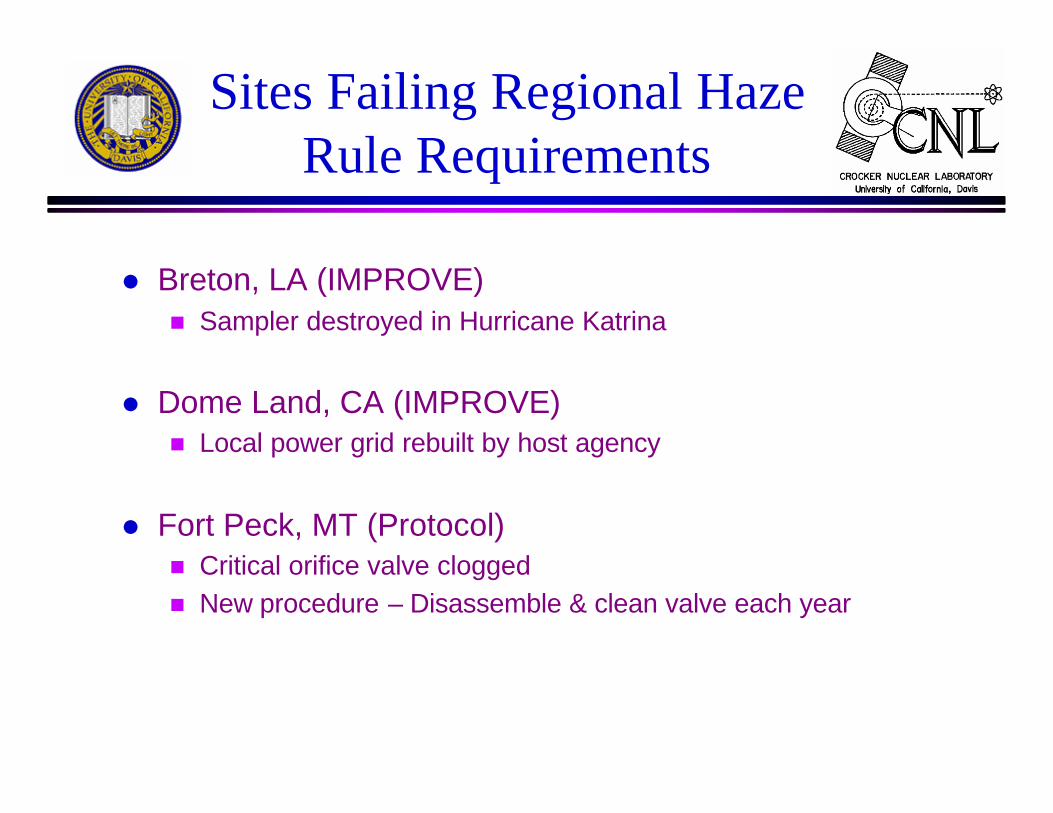
Sites Failing Regional Haze Rule Requirements
l Breton, LA (IMPROVE)n Sampler destroyed in Hurricane Katrina
l Dome Land, CA (IMPROVE)n Local power grid rebuilt by host agency
l Fort Peck, MT (Protocol)n Critical orifice valve cloggedn New procedure – Disassemble & clean valve each year
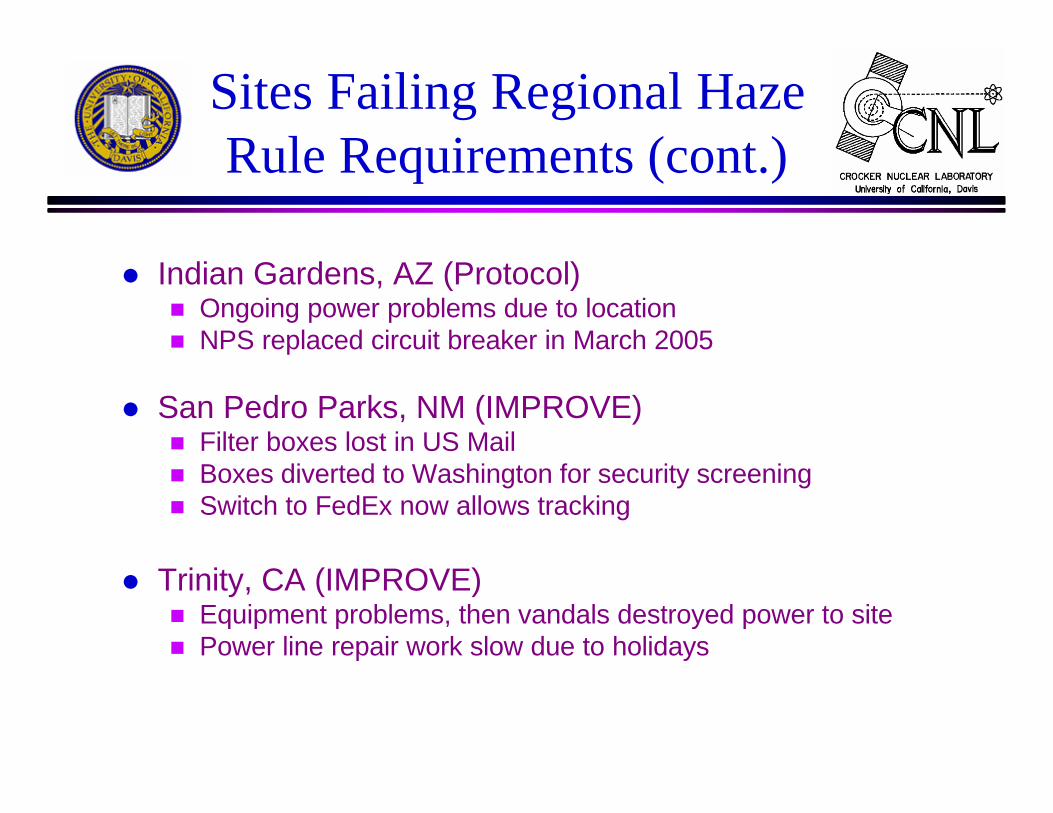
Sites Failing Regional Haze Rule Requirements (cont.)
l Indian Gardens, AZ (Protocol)n Ongoing power problems due to locationn NPS replaced circuit breaker in March 2005
l San Pedro Parks, NM (IMPROVE)n Filter boxes lost in US Mailn Boxes diverted to Washington for security screeningn Switch to FedEx now allows tracking
l Trinity, CA (IMPROVE)n Equipment problems, then vandals destroyed power to siten Power line repair work slow due to holidays

DATA MANAGEMENTAND DELIVERY
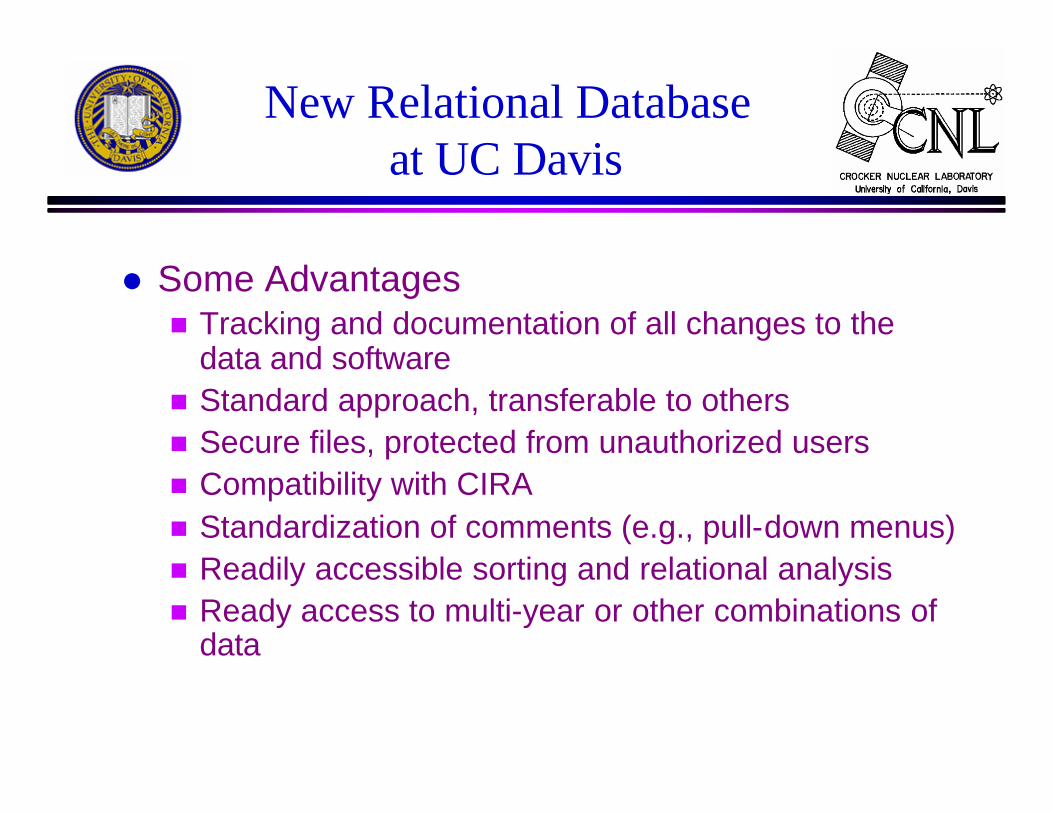
New Relational Databaseat UC Davis
l Some Advantagesn Tracking and documentation of all changes to the
data and software n Standard approach, transferable to others n Secure files, protected from unauthorized users n Compatibility with CIRA n Standardization of comments (e.g., pull-down menus) n Readily accessible sorting and relational analysis n Ready access to multi-year or other combinations of
data
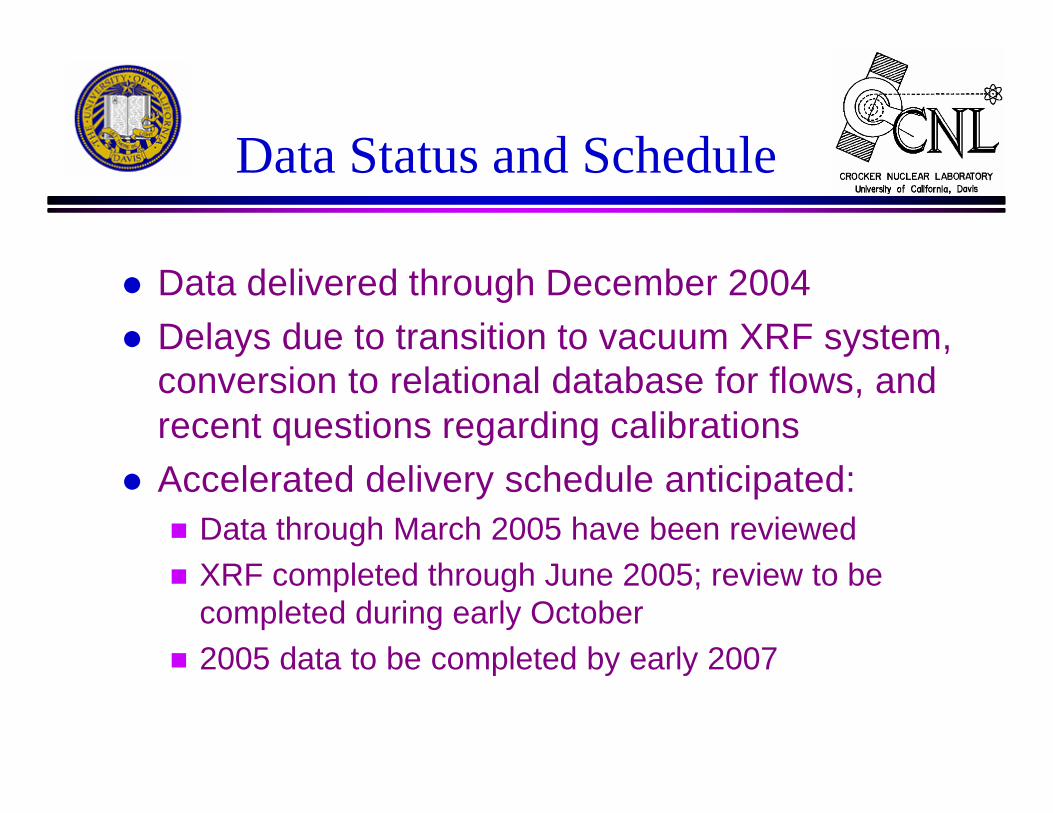
Data Status and Schedule
l Data delivered through December 2004l Delays due to transition to vacuum XRF system,
conversion to relational database for flows, and recent questions regarding calibrations
l Accelerated delivery schedule anticipated:n Data through March 2005 have been reviewedn XRF completed through June 2005; review to be
completed during early Octobern 2005 data to be completed by early 2007
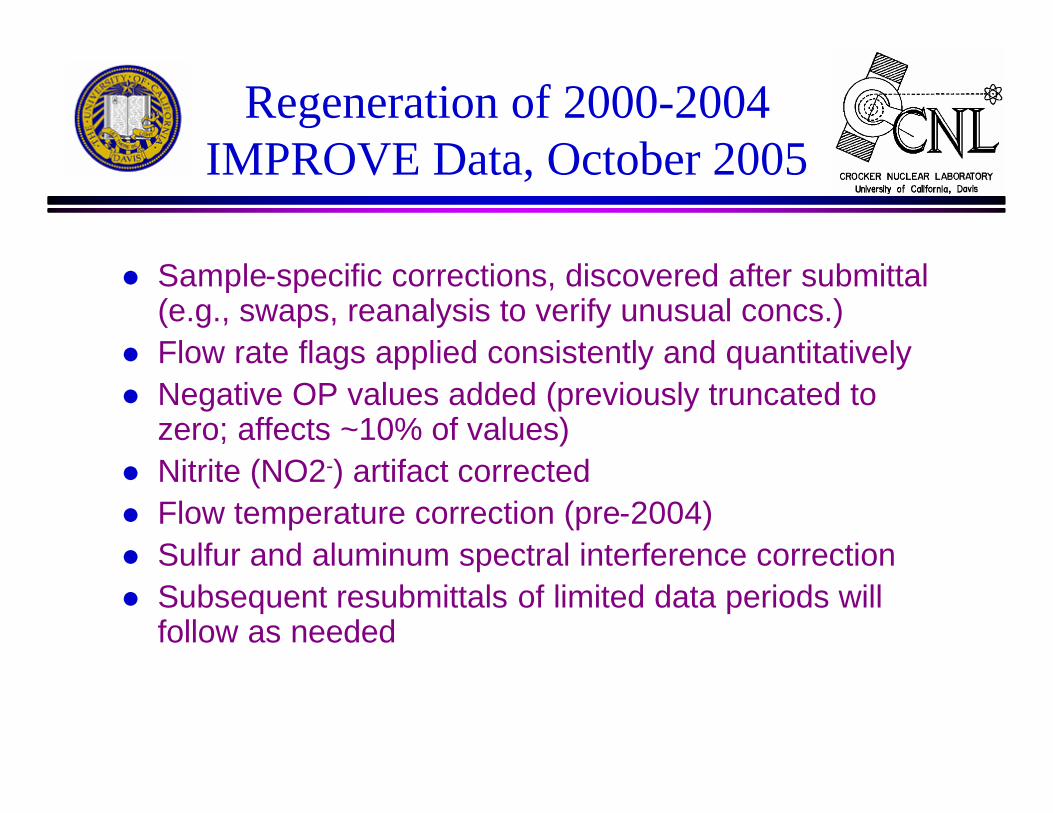
Regeneration of 2000-2004 IMPROVE Data, October 2005
l Sample-specific corrections, discovered after submittal (e.g., swaps, reanalysis to verify unusual concs.)
l Flow rate flags applied consistently and quantitativelyl Negative OP values added (previously truncated to
zero; affects ~10% of values)l Nitrite (NO2-) artifact correctedl Flow temperature correction (pre-2004)l Sulfur and aluminum spectral interference correctionl Subsequent resubmittals of limited data periods will
follow as needed
FLOW CALIBRATION TEMPERATURE ADJUSTMENT
Applied at Regeneration, 10/05
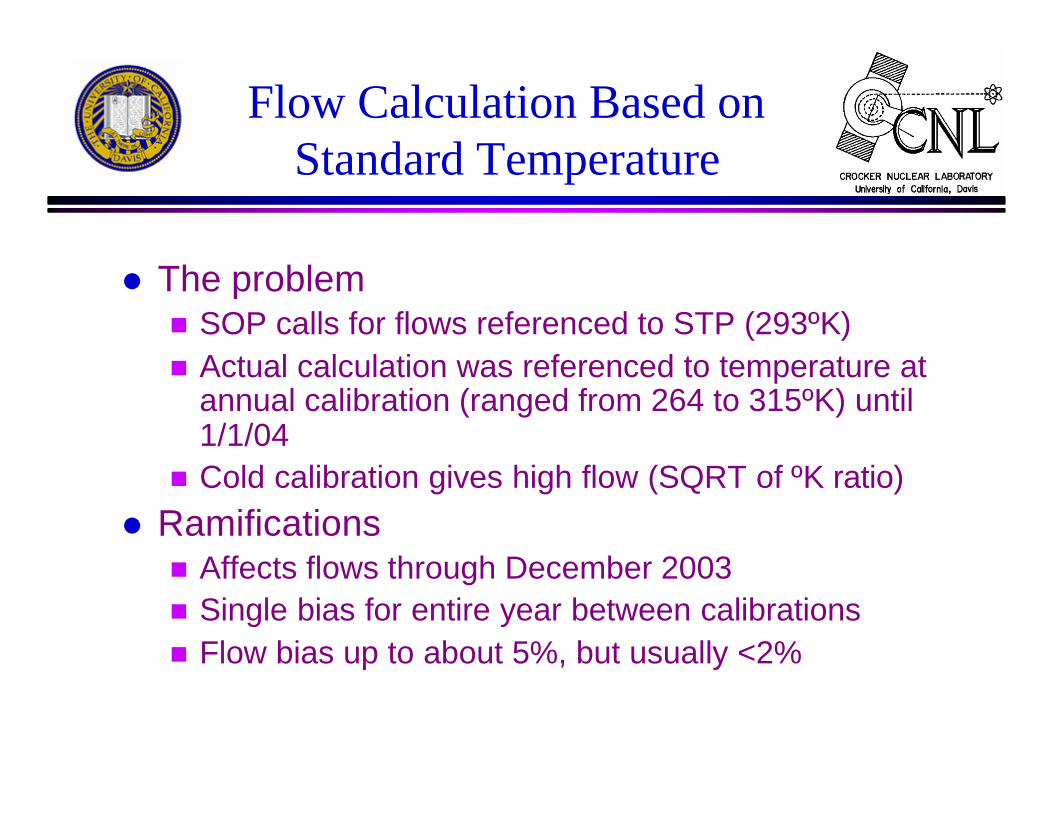
Flow Calculation Based on Standard Temperature
l The problemn SOP calls for flows referenced to STP (293ºK)n Actual calculation was referenced to temperature at
annual calibration (ranged from 264 to 315ºK) until 1/1/04
n Cold calibration gives high flow (SQRT of ºK ratio)l Ramificationsn Affects flows through December 2003n Single bias for entire year between calibrationsn Flow bias up to about 5%, but usually <2%
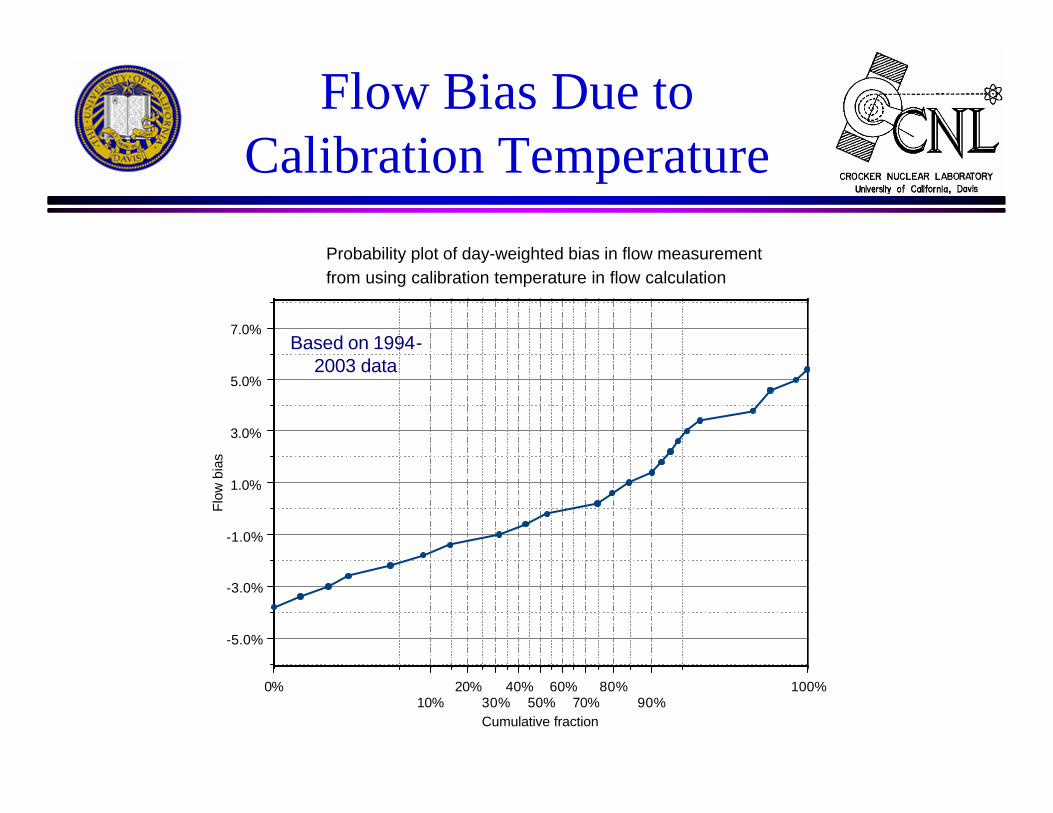
Flow Bias Due toCalibration Temperature
0%10%
20%30%
40%50%
60%70%
80%90%
100%
Cumulative fraction
-5.0%
-3.0%
-1.0%
1.0%
3.0%
5.0%
7.0%
Flo
w b
ias
Probability plot of day-weighted bias in flow measurementfrom using calibration temperature in flow calculation
Based on 1994-2003 data
XRF SPECTRAL INTERFERENCE CORRECTIONS
Applied at Regeneration, 10/05
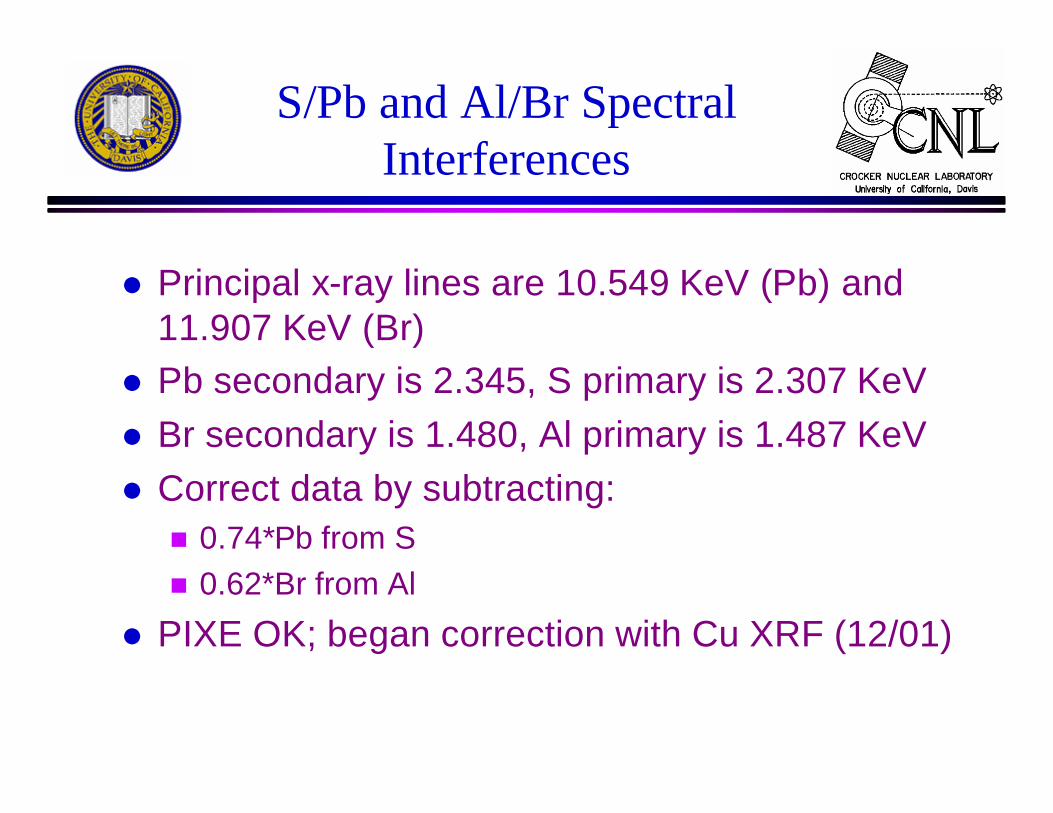
S/Pb and Al/Br Spectral Interferences
l Principal x-ray lines are 10.549 KeV (Pb) and 11.907 KeV (Br)
l Pb secondary is 2.345, S primary is 2.307 KeVl Br secondary is 1.480, Al primary is 1.487 KeVl Correct data by subtracting:n 0.74*Pb from Sn 0.62*Br from Al
l PIXE OK; began correction with Cu XRF (12/01)
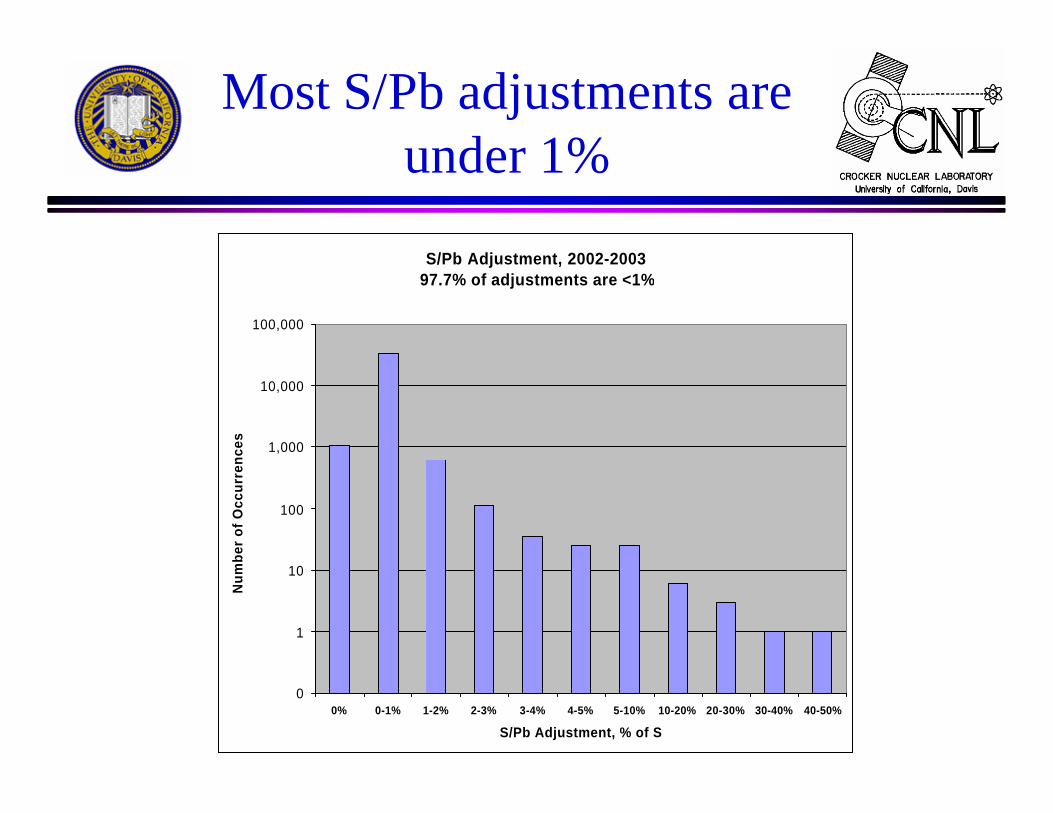
Most S/Pb adjustments are under 1%
S/Pb Adjustment, 2002-200397.7% of adjustments are <1%
0
1
10
100
1,000
10,000
100,000
0% 0-1% 1-2% 2-3% 3-4% 4-5% 5-10% 10-20% 20-30% 30-40% 40-50%
S/Pb Adjustment, % of S
Nu
mb
er o
f O
ccu
rren
ces
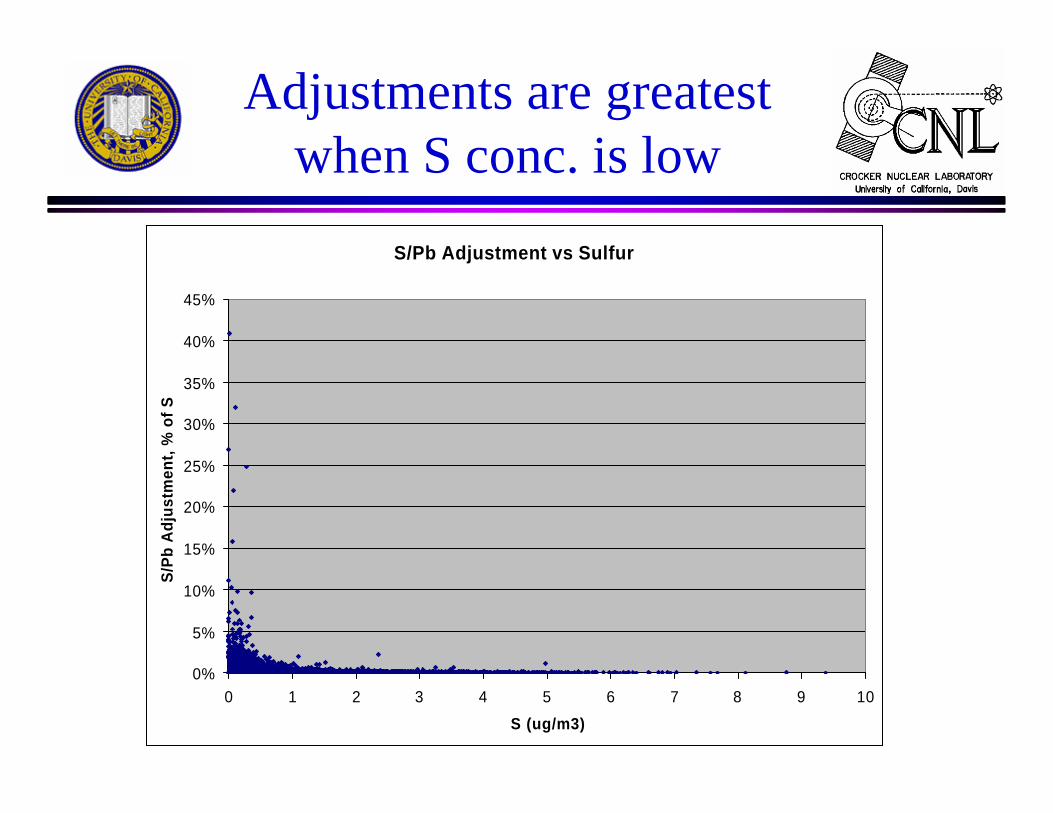
Adjustments are greatest when S conc. is low
S/Pb Adjustment vs Sulfur
0%
5%
10%
15%
20%
25%
30%
35%
40%
45%
0 1 2 3 4 5 6 7 8 9 10
S (ug/m3)
S/P
b A
djus
tmen
t, %
of
S
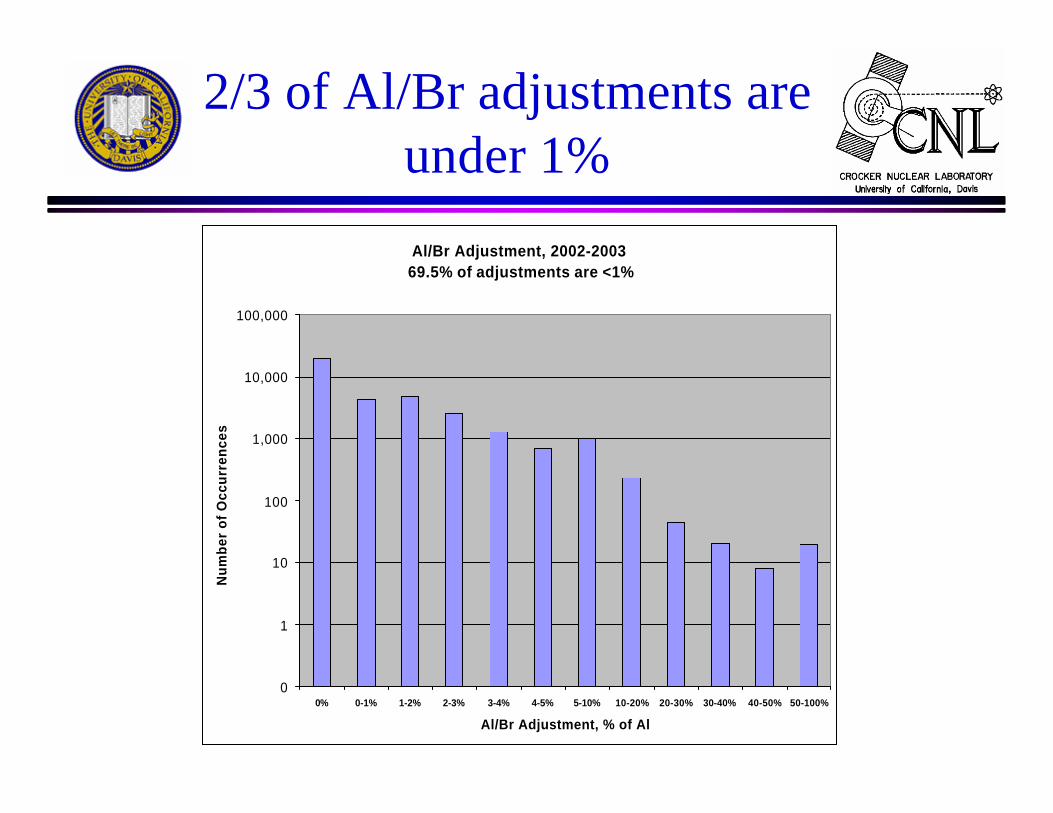
2/3 of Al/Br adjustments are under 1%
Al/Br Adjustment, 2002-200369.5% of adjustments are <1%
0
1
10
100
1,000
10,000
100,000
0% 0-1% 1-2% 2-3% 3-4% 4-5% 5-10% 10-20% 20-30% 30-40% 40-50% 50-100%
Al/Br Adjustment, % of Al
Nu
mb
er o
f O
ccu
rren
ces
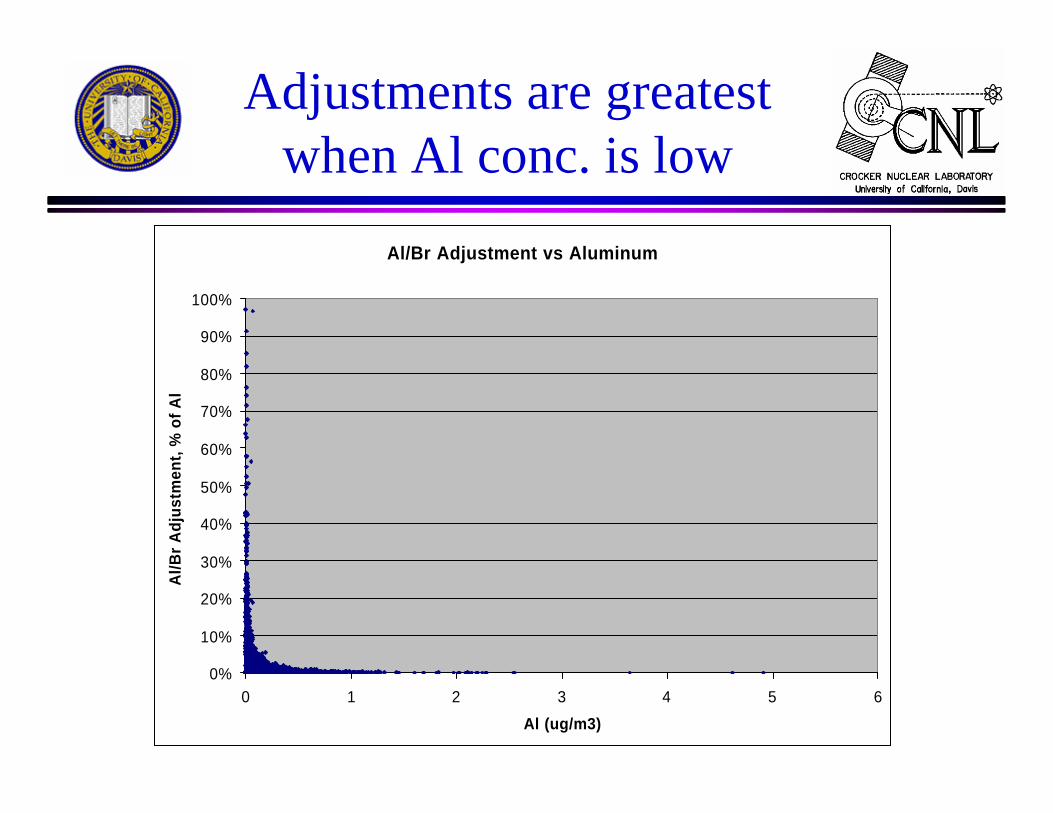
Adjustments are greatest when Al conc. is low
Al/Br Adjustment vs Aluminum
0%
10%
20%
30%
40%
50%
60%
70%
80%
90%
100%
0 1 2 3 4 5 6
Al (ug/m3)
Al/B
r A
djus
tmen
t, %
of
Al
NEW APPROACH FOR ION ARTIFACT CORRECTIONS
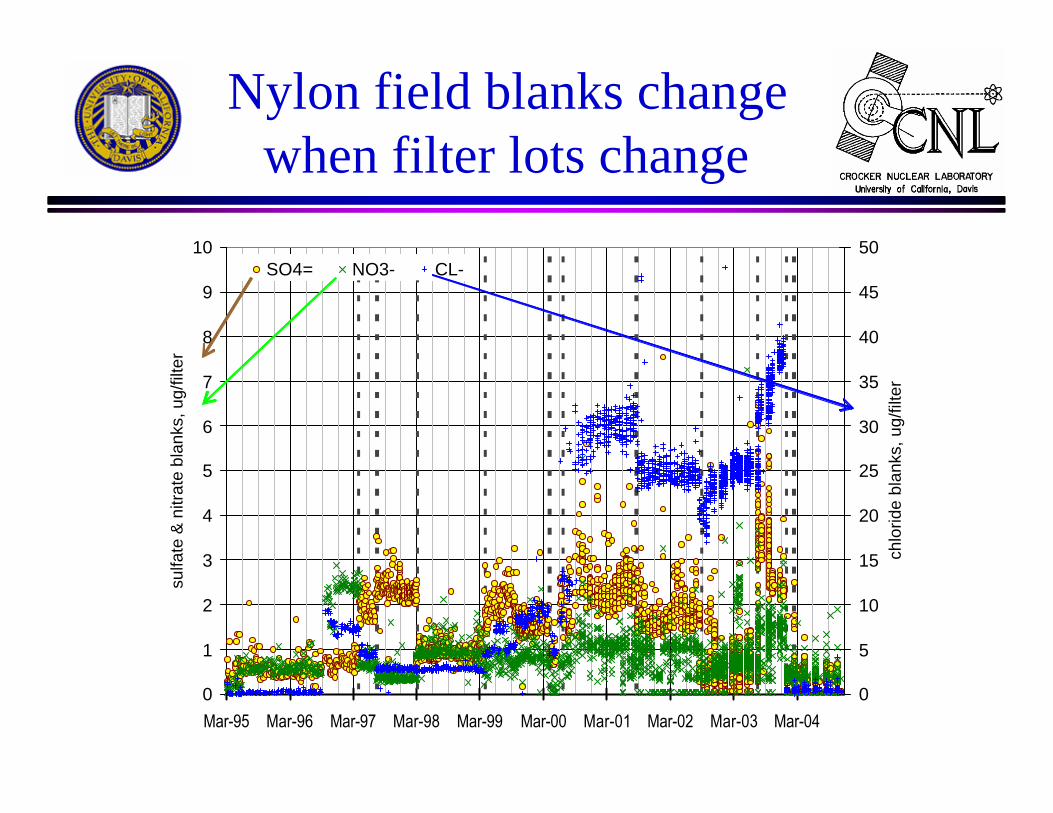
Nylon field blanks change when filter lots change
0
1
2
3
4
5
6
7
8
9
10
Mar-95 Mar-96 Mar-97 Mar-98 Mar-99 Mar-00 Mar-01 Mar-02 Mar-03 Mar-04
sulfa
te &
nitr
ate
blan
ks, u
g/fil
ter
0
5
10
15
20
25
30
35
40
45
50
chlo
ride
blan
ks, u
g/fil
ter
SO4= NO3- CL-
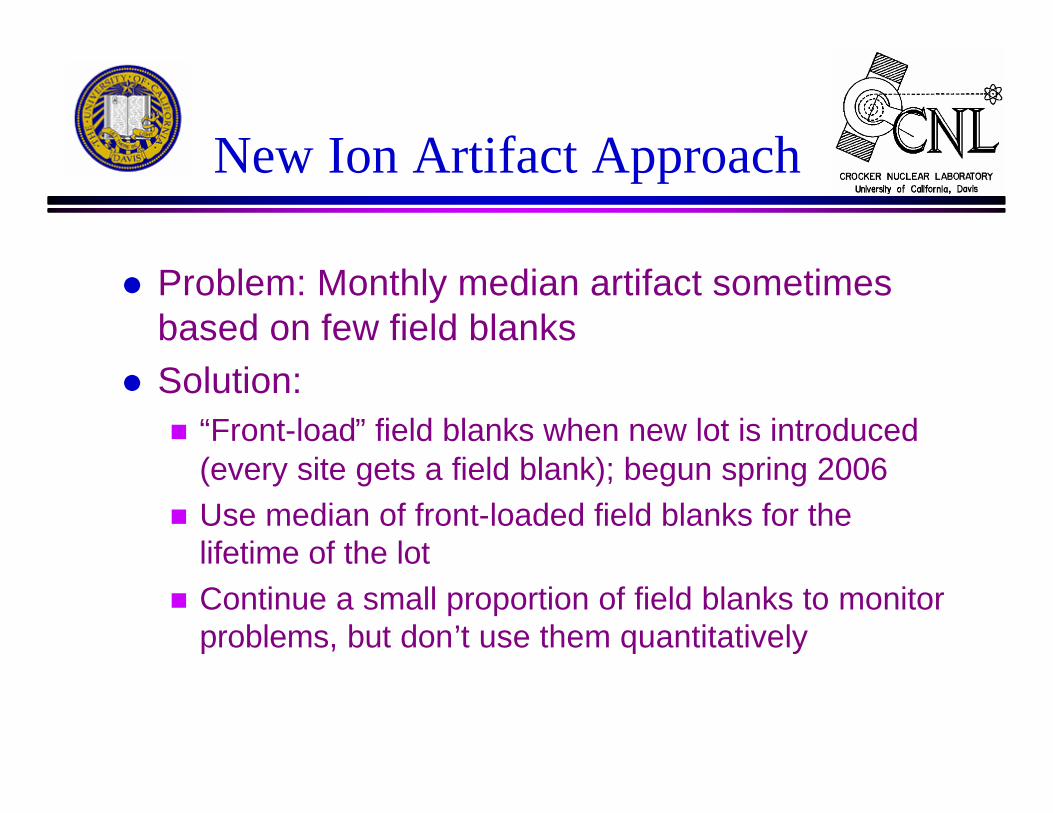
New Ion Artifact Approach
l Problem: Monthly median artifact sometimes based on few field blanks
l Solution:n “Front-load” field blanks when new lot is introduced
(every site gets a field blank); begun spring 2006n Use median of front-loaded field blanks for the
lifetime of the lotn Continue a small proportion of field blanks to monitor
problems, but don’t use them quantitatively

REDESIGN OF TEMPERATURE PROBE
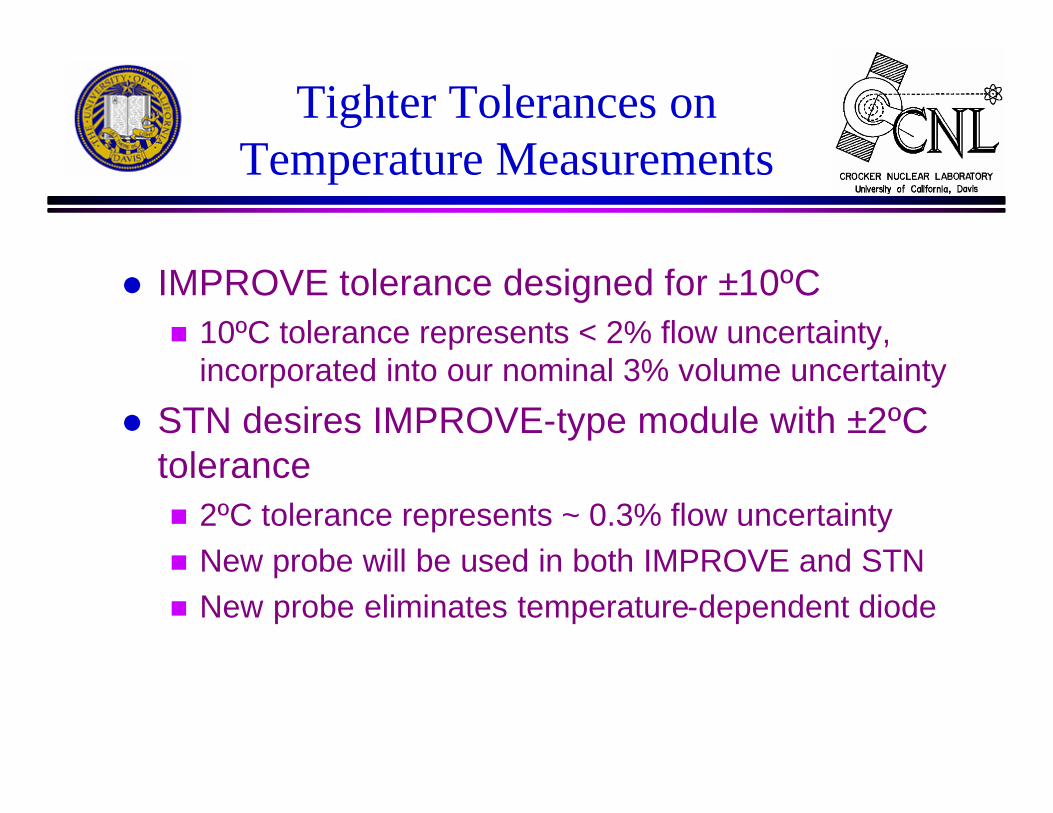
Tighter Tolerances on Temperature Measurements
l IMPROVE tolerance designed for ±10ºCn 10ºC tolerance represents < 2% flow uncertainty,
incorporated into our nominal 3% volume uncertainty
l STN desires IMPROVE-type module with ±2ºC tolerancen 2ºC tolerance represents ~ 0.3% flow uncertaintyn New probe will be used in both IMPROVE and STNn New probe eliminates temperature-dependent diode

Testing of NewTemperature Probe
l Redesigned circuitry requires voltage regulator: 5 ± 0.02 volts
l Tested 4.98, 5.00, and 5.02 regulatorsn Compared to reference temperature measurement
(Dickson Temperature Data Logger (precision ± 1° C)calibrated to Fluke meter (accuracy ± 0.3 ° C))
n Tested for 4 daysn Not a single 15 minute average was 2° C or more
from reference measurement
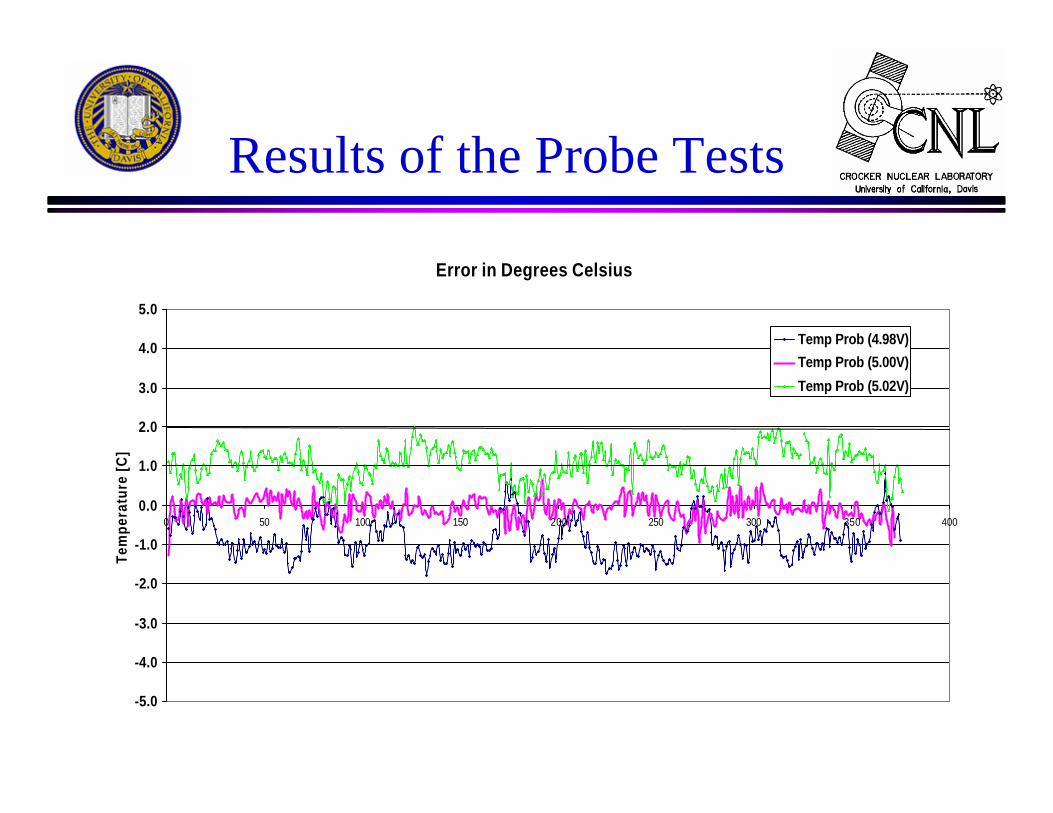
Results of the Probe Tests
Error in Degrees Celsius
-5.0
-4.0
-3.0
-2.0
-1.0
0.0
1.0
2.0
3.0
4.0
5.0
0 50 100 150 200 250 300 350 400
Tem
pera
ture
[C
]
Temp Prob (4.98V)
Temp Prob (5.00V)
Temp Prob (5.02V)

INLET CLOGGING
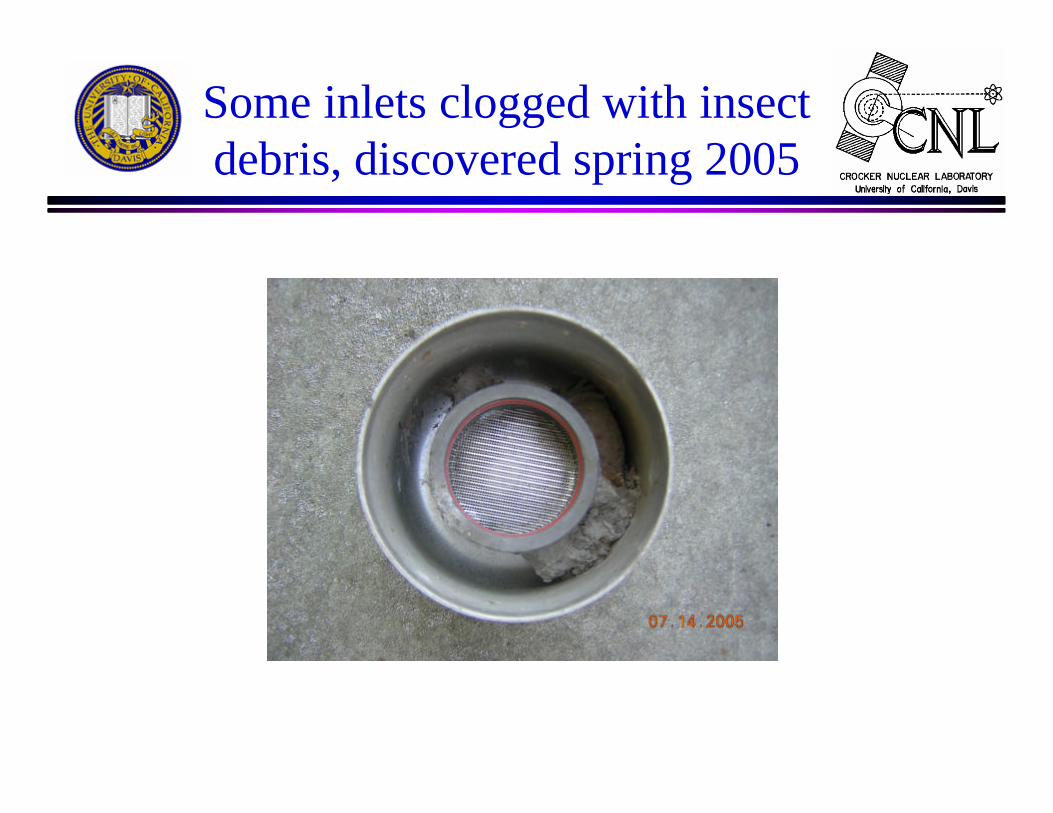
Some inlets clogged with insect debris, discovered spring 2005
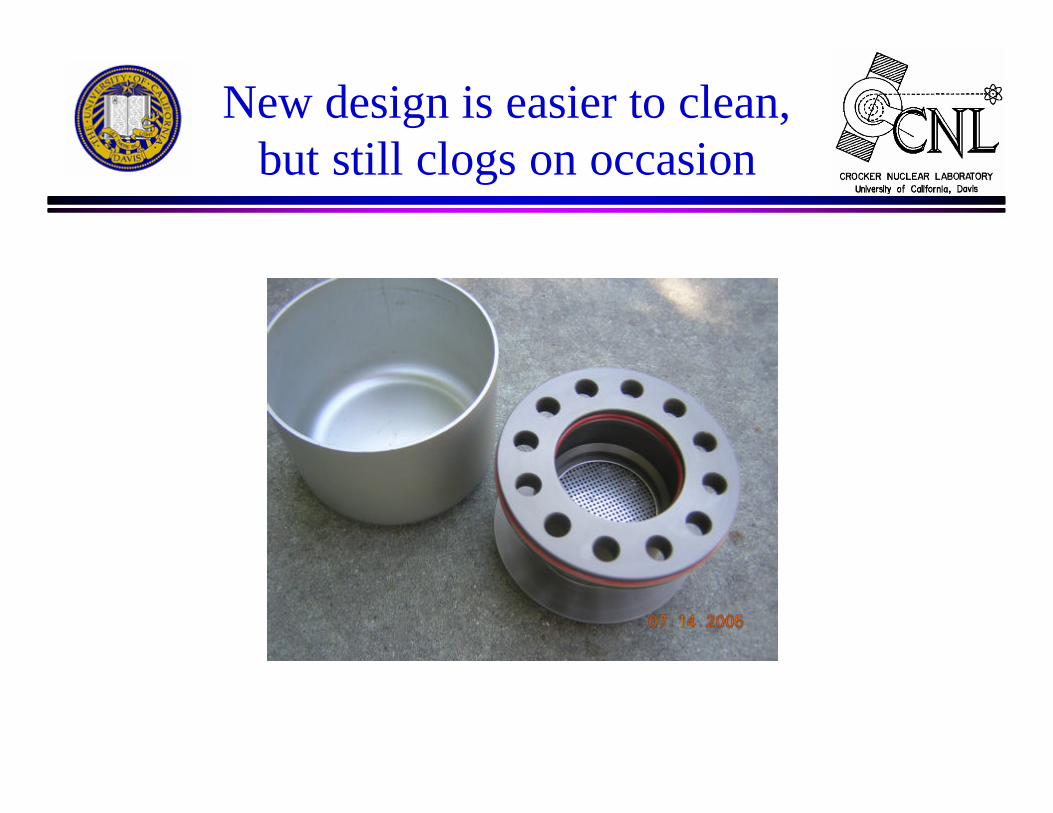
New design is easier to clean, but still clogs on occasion
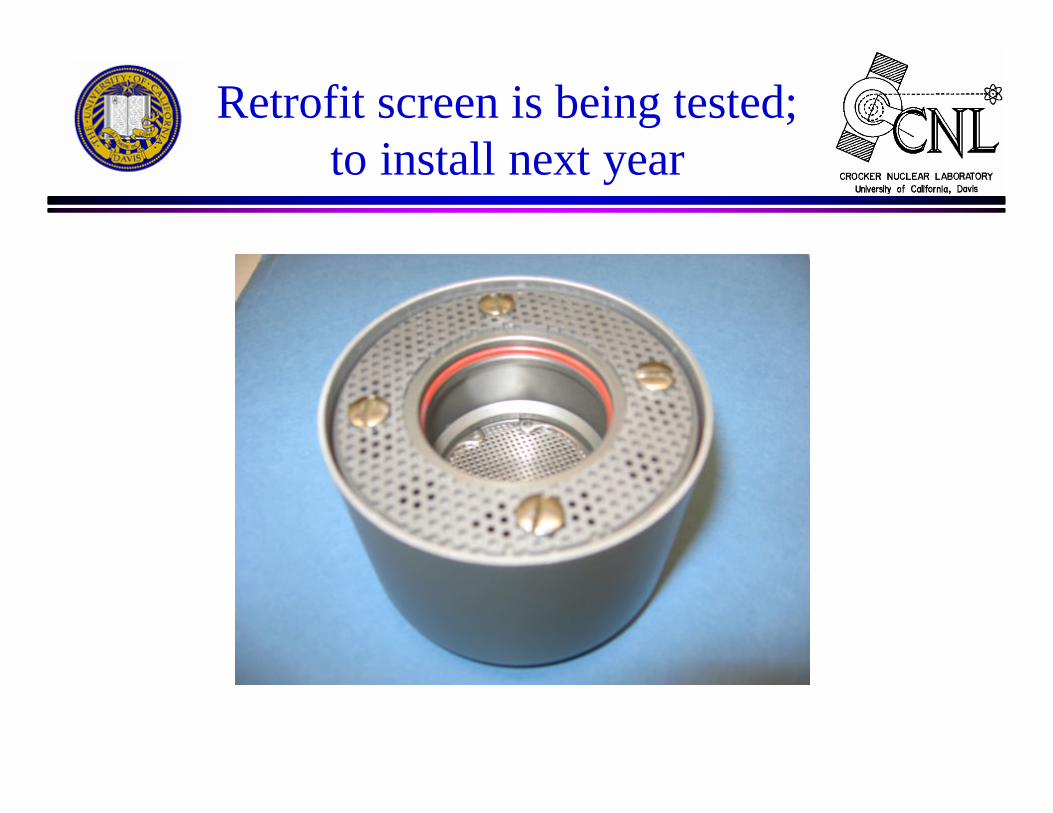
Retrofit screen is being tested; to install next year

NITRIC ACIDDENUDER TESTS
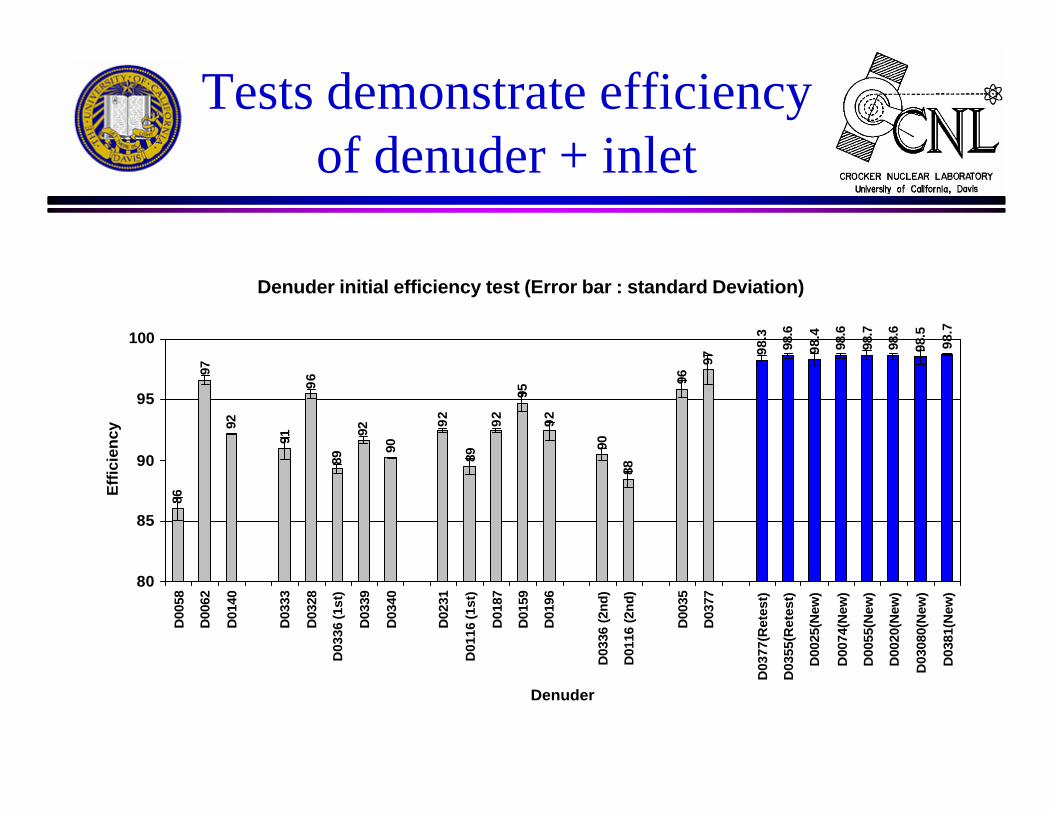
Tests demonstrate efficiency of denuder + inlet
Denuder initial efficiency test (Error bar : standard Deviation)
86
97
92
91
96
89
92
90
92
89
92
95
92
90
88
96
97
98.3
98.6
98.4
98.6
98.7
98.6
98.5
98.7
80
85
90
95
100
D00
58
D00
62
D01
40
D03
33
D03
28
D03
36 (1
st)
D03
39
D03
40
D02
31
D01
16 (1
st)
D01
87
D01
59
D01
96
D03
36 (
2nd
)
D01
16 (
2nd
)
D00
35
D03
77
D03
77(R
etes
t)
D03
55(R
etes
t)
D00
25(N
ew)
D00
74(N
ew)
D00
55(N
ew)
D00
20(N
ew)
D03
080(
New
)
D03
81(N
ew)
Denuder
Eff
icie
ncy
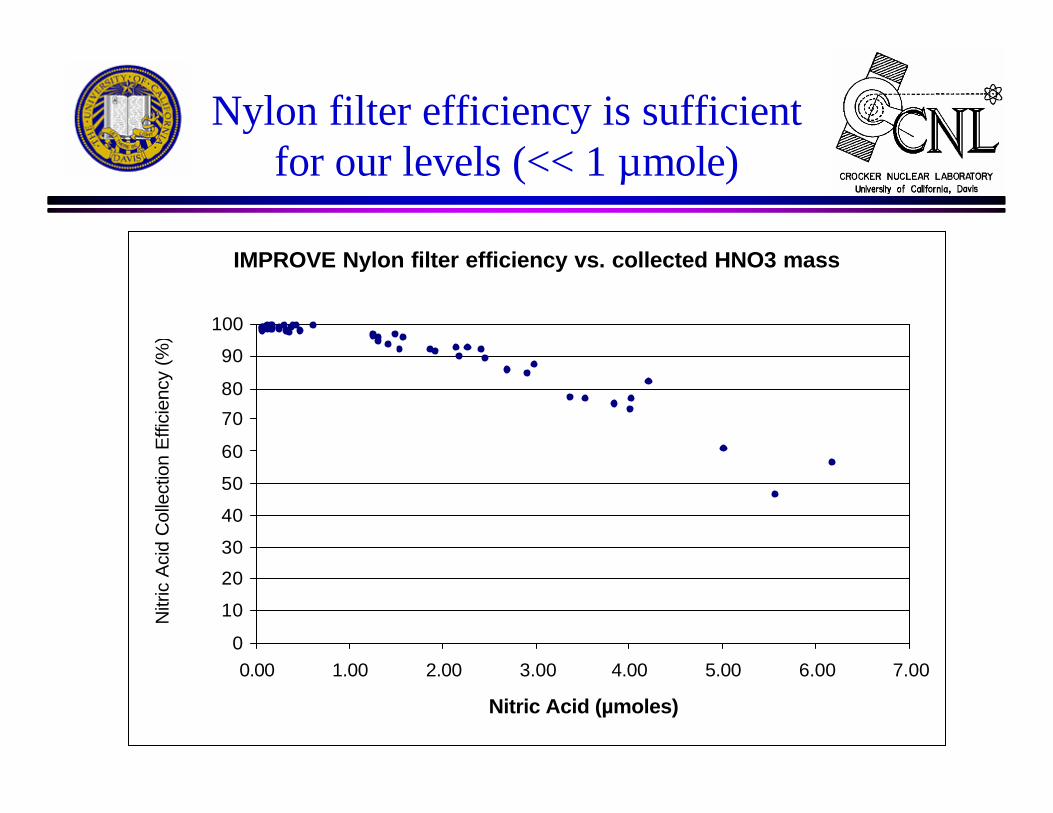
Nylon filter efficiency is sufficient for our levels (<< 1 µmole)
IMPROVE Nylon filter efficiency vs. collected HNO3 mass
0
10
20
30
40
50
60
70
80
90
100
0.00 1.00 2.00 3.00 4.00 5.00 6.00 7.00
Nitric Acid (µmoles)
Nitr
ic A
cid
Col
lect
ion
Effi
cien
cy (
%)

IMPROVE SAMPLER CYCLONE
CHARACTERIZATION
Work by Jay Turner, 2005-2006
Motivation
l Cyclone key dimensions nearly identical to the AIHL cyclone (John & Reischl, 1980)
l Lab characterization of the IMPROVE cyclone circa 1990 found strong dependence of cutpointon flowrate, differing from John & Reischl’sresults
l IMPROVE sampler uses passive flow control; flowrate can decrease with filter loading
Recent Cyclone Tests
l Jay Turner conducted extensive tests:n Test aerosols: PSL and Arizona soil dustn Used a TSI Aerodynamic Particle Sizer (APS)n Tested IMPROVE cyclone (inlet tee, cyclone, filter cassette
manifold) and AIHL cyclone (IMPROVE inlet tee, cyclone)
l Thanks to Susanne Hering for use of her laboratory at Aerosol Dynamics, Inc.!

Test Rig at ADI in Berkeley
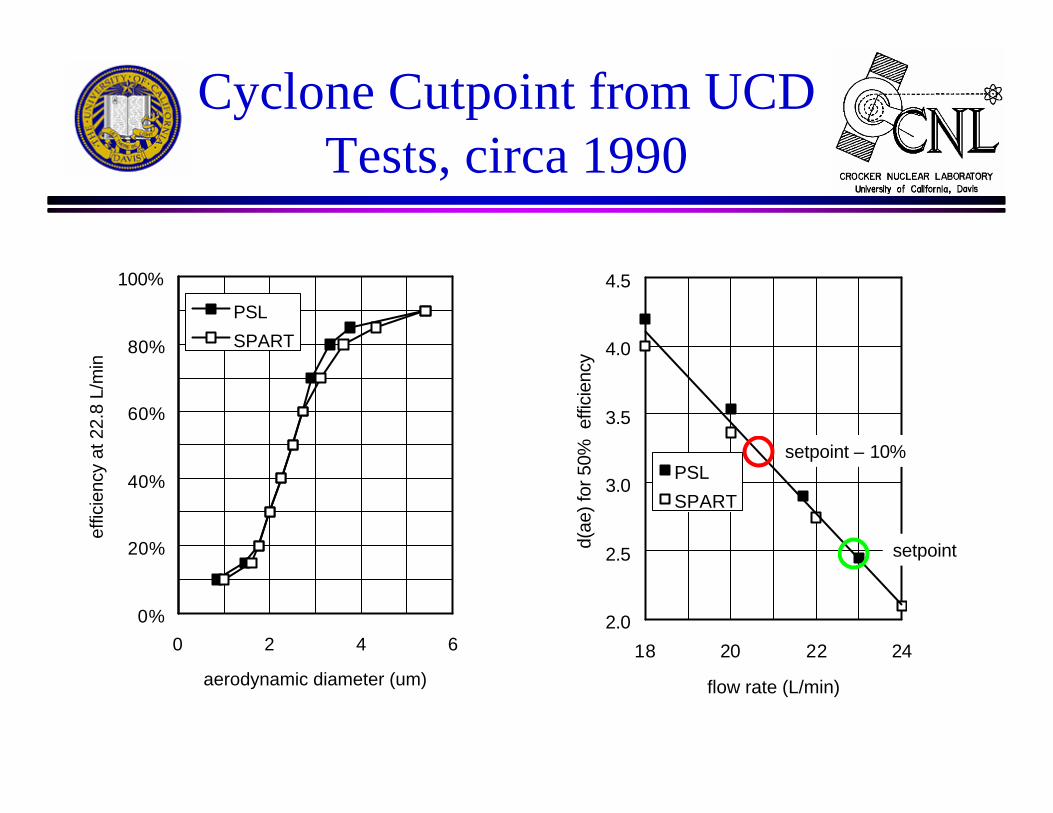
Cyclone Cutpoint from UCD Tests, circa 1990
0%
20%
40%
60%
80%
100%
0 2 4 6
aerodynamic diameter (um)
effic
ienc
y at
22.
8 L/
min
PSL
SPART
2.0
2.5
3.0
3.5
4.0
4.5
18 20 22 24
flow rate (L/min)
d(ae
) for
50%
effi
cien
cy
PSL
SPART
setpoint
setpoint – 10%
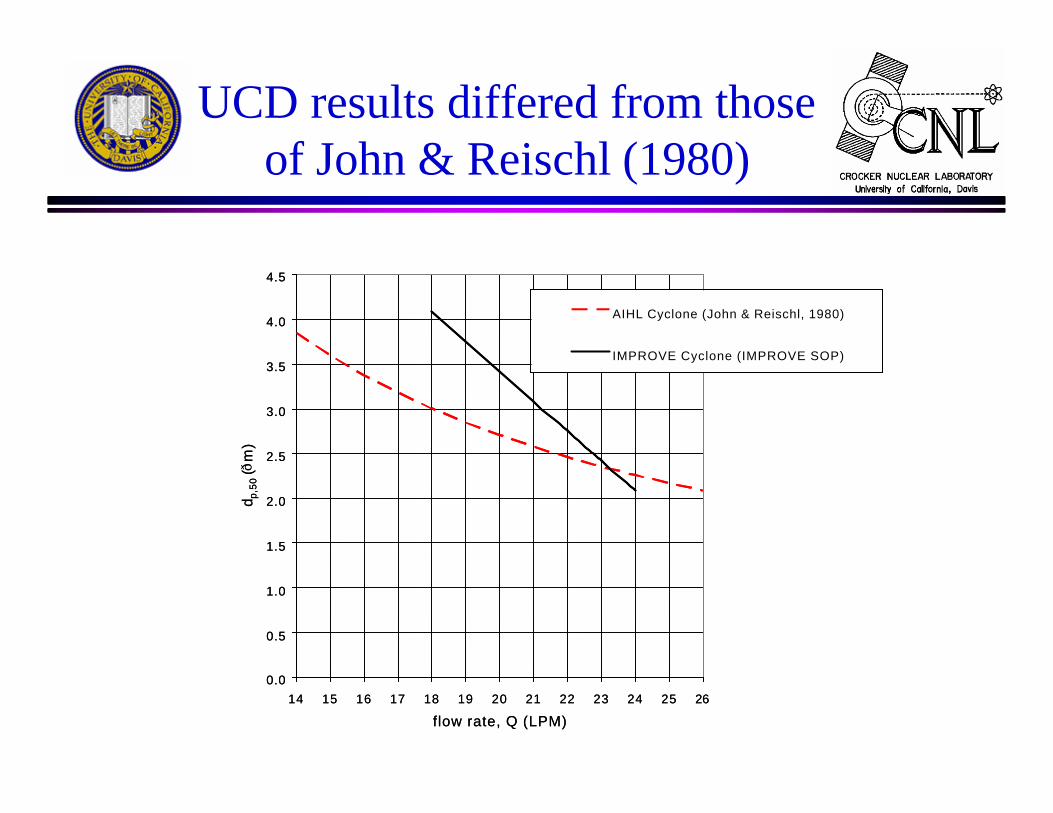
UCD results differed from those of John & Reischl (1980)
0.0
0.5
1.0
1.5
2.0
2.5
3.0
3.5
4.0
4.5
14 15 16 17 18 19 20 21 22 23 24 25 26
flow rate, Q (LPM)
d p,5
0 (ð
m)
AIHL Cyclone (John & Reischl, 1980)
IMPROVE Cyclone (IMPROVE SOP)
0.0
0.5
1.0
1.5
2.0
2.5
3.0
3.5
4.0
4.5
14 15 16 17 18 19 20 21 22 23 24 25 26
flow rate, Q (LPM)
d p,5
0 (ð
m)
AIHL Cyclone (John & Reischl, 1980)
IMPROVE Cyclone (IMPROVE SOP)

UCD tests relied on interpolation of limited data
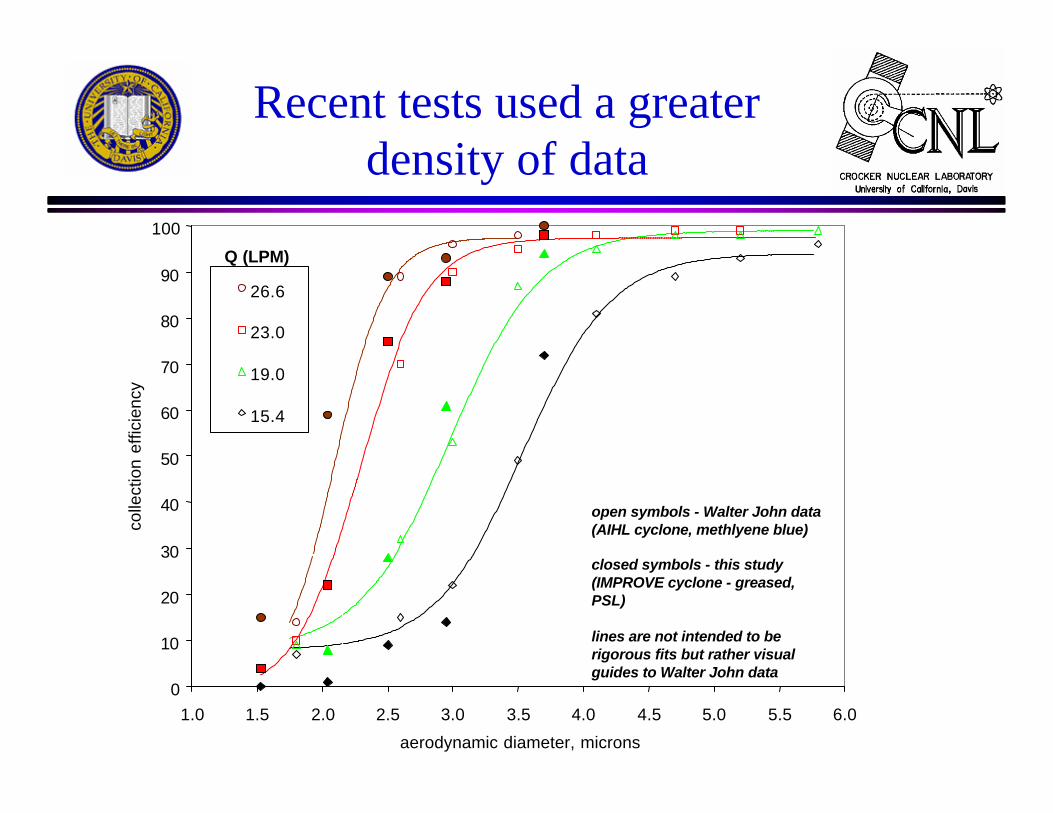
Recent tests used a greater density of data
0
10
20
30
40
50
60
70
80
90
100
1.0 1.5 2.0 2.5 3.0 3.5 4.0 4.5 5.0 5.5 6.0
aerodynamic diameter, microns
colle
ctio
n ef
ficie
ncy
26.6
23.0
19.0
15.4
open symbols - Walter John data (AIHL cyclone, methlyene blue)
closed symbols - this study (IMPROVE cyclone - greased, PSL)
lines are not intended to be rigorous fits but rather visual guides to Walter John data
Q (LPM)
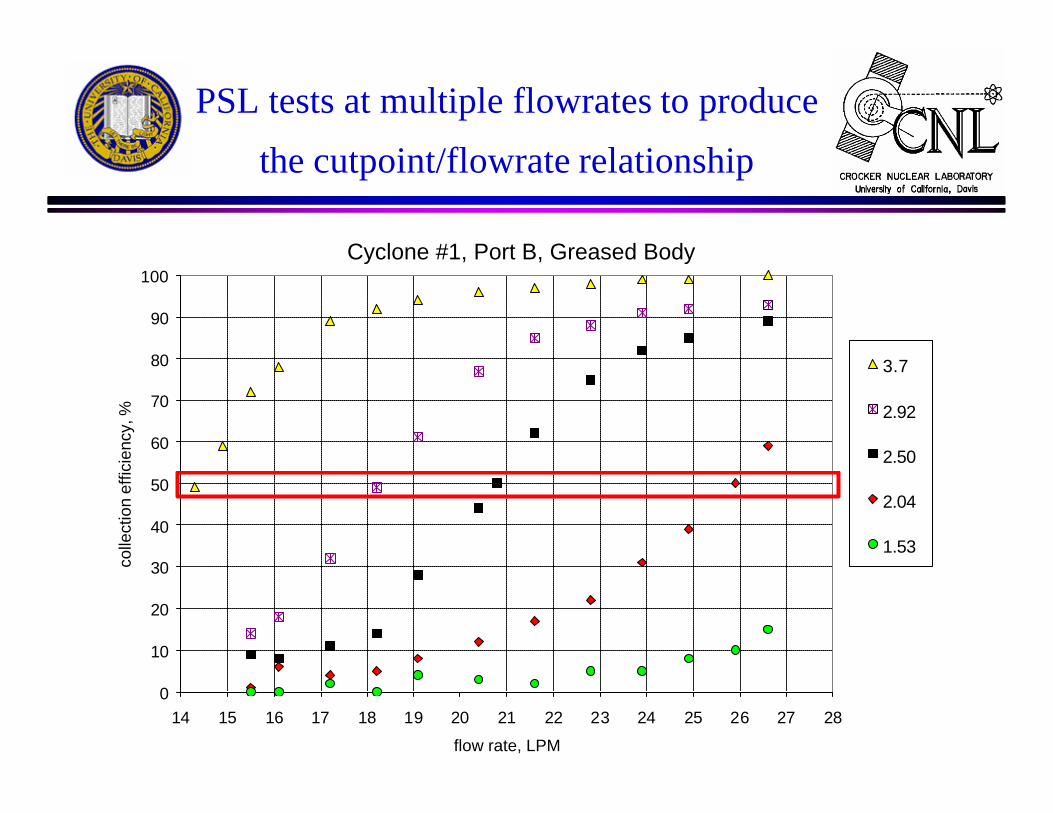
PSL tests at multiple flowrates to produce
the cutpoint/flowrate relationship
Cyclone #1, Port B, Greased Body
0
10
20
30
40
50
60
70
80
90
100
14 15 16 17 18 19 20 21 22 23 24 25 26 27 28
flow rate, LPM
colle
ctio
n ef
ficie
ncy,
%
3.7
2.92
2.50
2.04
1.53
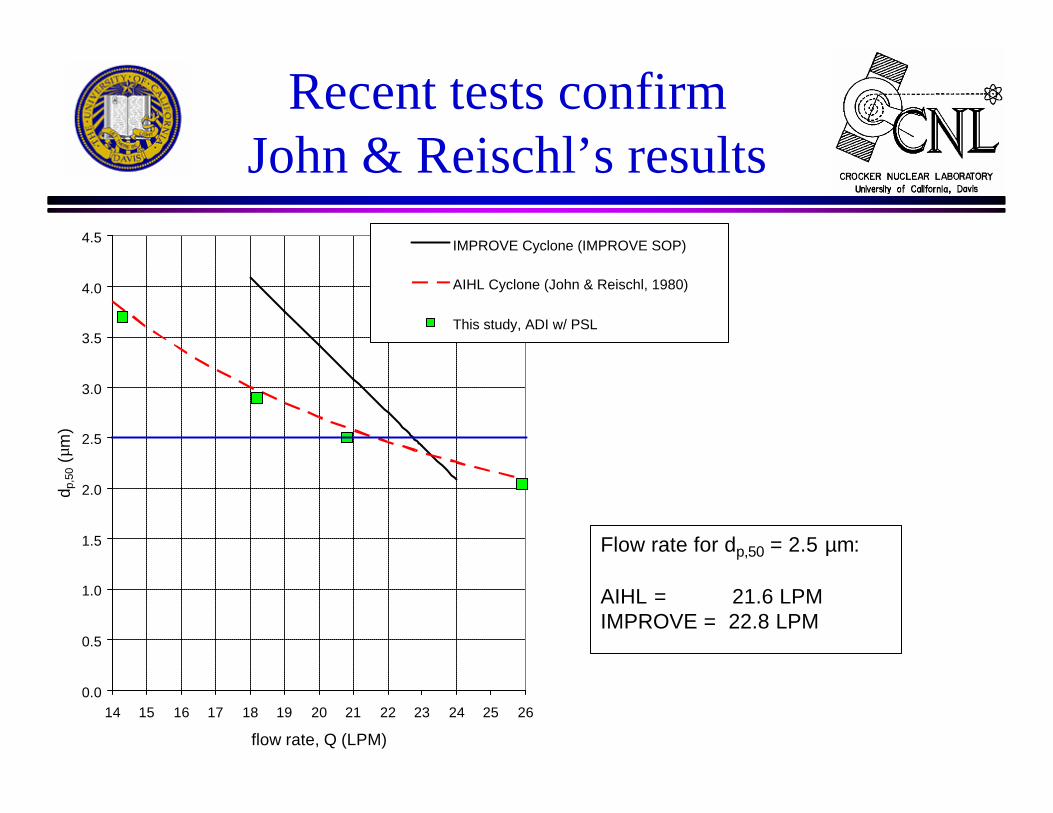
Recent tests confirmJohn & Reischl’s results
0.0
0.5
1.0
1.5
2.0
2.5
3.0
3.5
4.0
4.5
14 15 16 17 18 19 20 21 22 23 24 25 26
flow rate, Q (LPM)
d p,5
0 (µ
m)
IMPROVE Cyclone (IMPROVE SOP)
AIHL Cyclone (John & Reischl, 1980)
This study, ADI w/ PSL
Flow rate for dp,50 = 2.5 µm:
AIHL = 21.6 LPMIMPROVE = 22.8 LPM

Our tests yield the cutpoint/flowraterelationship of John & Reischl
This Study:
John & Reischl (1980):
99.0)(7.51)( −×= LPMQmdp µ
99.0)(5.52)( −×= LPMQmdp µ
flow rate (LPM)
10 12.5 15 17.5 20 22.5 25 27.5 301.0
1.5
2.0
2.5
3.0
3.5
4.0
4.5
5.0
John and Reischl (1980) - AIHL cyclone
This Study - AIHL cyclone
This Study - IMPROVE cyclone
Cutpoint/Flowrate Conclusions
l Currently assumed dependence of cutpoint on flowrate is exaggerated.
l True behavior follows the John & Reischlequation
l Remember: Penetration curves get broader with decreasing flowrate
NEW VACUUM XRF SYSTEM
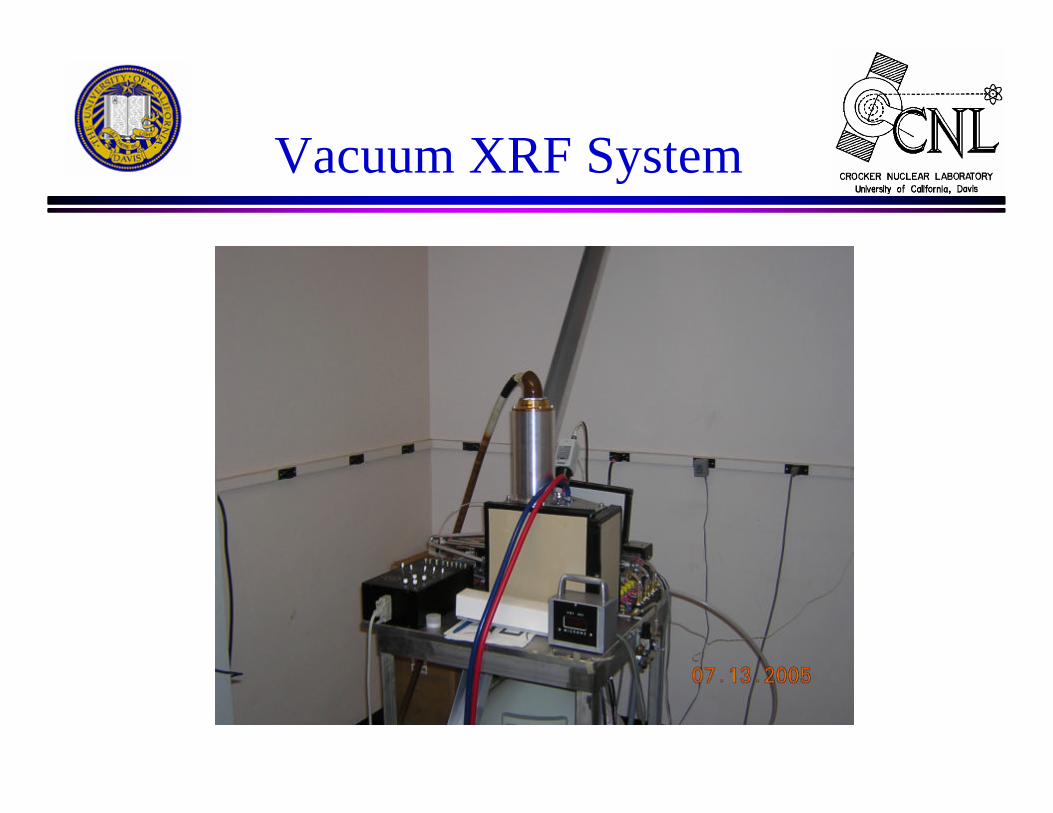
Vacuum XRF System

XRF Load-lock Chamber
Vacuum XRF Advantages
l Minimizes Ar peak interference; better MDLsl No He leakage through Be window; better
detector reliability and longer lifetimel No need for He supply