Important Information - ir.fras-le.com.brir.fras-le.com.br/enu/1179/Ingles oficial.pdf · 2...
23
Transcript of Important Information - ir.fras-le.com.brir.fras-le.com.br/enu/1179/Ingles oficial.pdf · 2...


2
Important Information
By THIS INSTRUMENT, we make statements about future events that are subject to risks and uncertainties. Such
statements are based on the beliefs and assumptions of our Management and on information that the Company
has currently access to. Statements about future events include information about our intentions, beliefs or
current expectations, as well as those of the members of the Board of Directors and Administrators of the
Company.
The statements and information about the future also include information about possible or presumed operating
results, as well as statements preceded by, followed by or that include the words "believes", "may", "will",
"continues", "expects", "anticipates", "intends", "plans", "estimates" or similar expressions.
The statements and information about the future are not guarantees of performance. They involve risks,
uncertainties and assumptions because they relate to future events, depending, therefore, on circumstances that
may either occur or not. The future results and the creation of shareholder value may differ significantly from
those expressed or suggested by statements regarding the future. Many of the factors that will determine these
results and figures are beyond our ability to control or predict.
DISC
LAIM
ER

3
Summary
Main Figures
Physical Volumes Sold
Consolidated Net Revenue
Domestic Market
Foreign Market
Consolidated EBITDA
Adjusted EBITDA
Net Income
Need for Working Capital and Cash Generation
Expectations
Possible Questions
Support Material:Net Income Comparison
Cost of Products Sold (COGS) Composition
Financial Management and Investments
Net Debt/EBITDA
Turnover and Market Value
Detailed description of the products sold

4
1Q18 1Q17 Δ % 1Q18 4Q17 Δ %
Gross Revenue * 361.1 275.8 30.9% 361.1 333.3 8.4%
Net Revenue 246.6 177.4 39.0% 246.6 221.5 11.3%
Domestic Market 116.2 98.7 17.8% 116.2 118.4 -1.9%
Foreign Market 130.4 78.7 65.7% 130.4 103.1 26.5%
Foreign Market US$ MM 40.2 24.6 63.2% 40.2 31.9 26.0%
Exports - Brazil US$ MM 18.8 14.6 28.8% 18.8 20.2 -6.9%
Gross Profit 62.8 38.9 61.2% 62.8 60.3 26.0%
Gross Margin 25.5% 22.0% 0.2 pp 25.5% 27.2% -0.1 pp
Operating Profit 70.3 5.0 1305.8% 70.3 15.8 4.0%
Operating Margin 28.5% 2.8% 9.1 pp 28.5% 7.1% 3.0 pp
EBITDA 80.7 14.4 460.5% 80.7 29.0 178.5%
EBITDA Margin 32.7% 8.1% 3.0 pp 32.7% 13.1% 1.5 pp
Net Profit 44.6 9.9 350.1% 44.6 10.5 325.2%
Net Margin 18.1% 5.6% 12.5 pp 18.1% 4.7% 13.3 pp
Adjusted EBITDA 30.6 30.6
Adjusted EBITDA Margin 12.3% 12.3%Values in R$ million (except for exports, profit per share and percentage).
(*) Includes intercompany sales.
Main Figures 1Q18

5
▲ Volumes of friction materials increased, even when comparing 1Q18 (without the acquisitions) with 1Q17;
▲ The largest volumes - added of the new acquisitions - are in Brake Pads;
▼ The smallest volumes in 1Q18 (without acquisitions) - Miscellaneous Products - are in the polymer area;
▼The reduced volumes in the polymer line is related to the lower level of production in auto industries and also because of
product models whose production has been discontinued.
Physical Volumes SoldMillions of pieces or liters.
Note: The components are detailed at the end of this report.
Unit1Q18Total
1Q18Acquisitions
1Q18Without
Acquisitions
1Q17
Friction Material
Brake linings for Heavy Vehicles (Blocks) PCS 12.678 0.218 12.460 12.298
Brake Pads PCS 7.690 1.997 5.693 5.032
Other Friction Materials PCS 3.126 0.185 2.941 2.804
Total of Friction Material PCS 23.494 2.400 21.094 20.134
Various Products
Components for the Brake System PCS 0.806 0.041 0.765
Components for the Suspension System PCS 0.272 0.272 -
Components for the Engine PCS 2.489 0.035 2.453
Other Various Products PCS 0.597 0.019 0.578
Total of Various Products PCS 4.164 0.367 3.797
Packed liquids L 0.406 0.336 0.070
Values in millions of pieces or liters.
* Brakes and Controil Polymers.
Sales by Product Line
4.932*

6
Consolidated Net Revenue 1Q18R$ million
▲ Aggregate sales by the new acquired companies (1Q18);
▲ Higher sales volumes in the Company`s main markets abroad;
▲ Average dollar rate was higher in 1Q18 (+ 3.2%);
▲ Increased national fleet on the roads;
▼ Go Live and stabilization of the new software (in Shipment Dept.) impaired delivery and billing;
▼ Impact of hedge accounting operations on revenues 1Q18 (-R$ 2.5 MM);

7
Growth in the domestic marketNet Revenue in Domestic Market | R$ million
Domestic Market
▲ Demand for brake linings (for commercial vehicles) has picked up.
▲ Production and sales of vehicles is rising (Fras-le`s evolution exceeding 30% in automakers);
▲ High backlog at the end of the first quarter;
▼ Limitation of capacity in blocks.

8
Net Revenue in the Foreign Market | R$ million
Foreign Market Foreign Market
▲ US market and Mexico with strong performance in 1Q18.
▲ New operations abroad have added more than US$ million in 1Q18;
▲ Backlog for Argentina with high balance at the end of March 2018.
▼ Impacts of hedge accounting.

9
Consolidated EBITDAR$ million
Main variations in 1Q18
› Increase in sales volumes in Brazil, USA and China.
› Armetal subsidiary, recently acquired in Argentina, surpassing the planned one;
› Best Results in the CONTROIL brand brake line and parts produced in the USA
› Goodwill calculation (Jurid do Brasil acquisiton) - purchase at a discount with operating gain of R$ 52.5 MM);
› Asset Recognition on acquisition of Jurid do Brasil (+ R$ 2.8 MM);
› Advisory services in M&A projects (- R$ 2.3 MM)

10
Adjusted EBITDAR$ million

11
Net IncomeR$ million
▲Increase in sales volumes in Brazil, USA and China;
▲ Controlled Armetal surpassing the goal, and project advancement (Controil's brake line and parts produced in the USA);
▲ Increased net income in 1Q18, influenced by operating gain on the acquisition of Jurid at a discount;
▼ Negative financial result (reduction of investments on account of the acquisitions);
▼ Increased exchange rates and bank rates in Argentina;
▼Deferred income tax, on the calculation of fair value, on account of the acquisition of the controlled company Jurid of Brazil (R$17.8 MM)
12
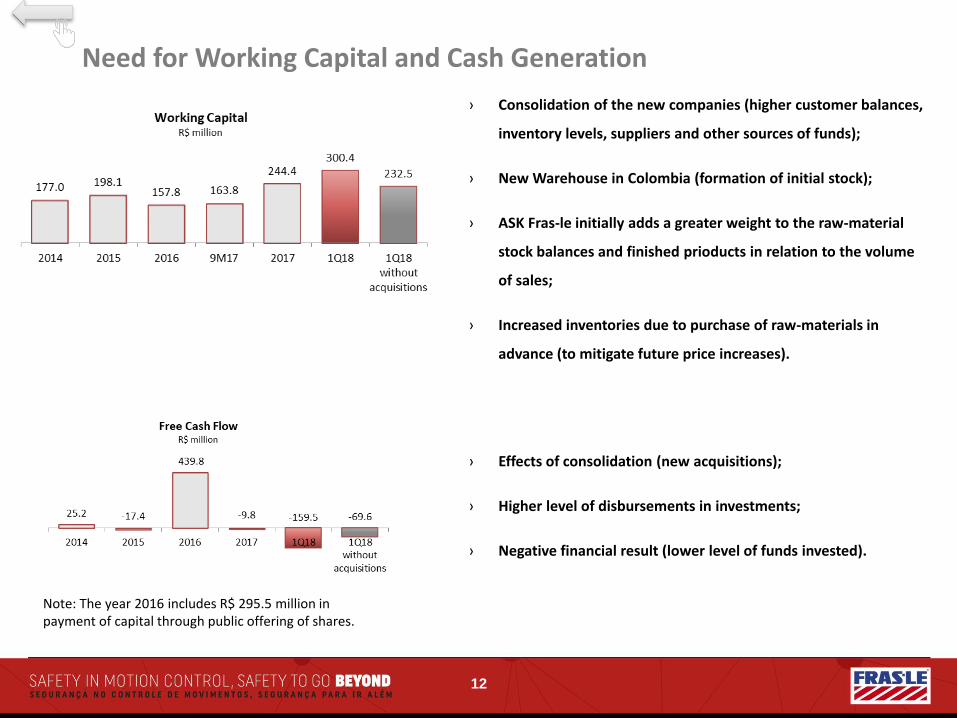
Need for Working Capital and Cash Generation
› Consolidation of the new companies (higher customer balances,
inventory levels, suppliers and other sources of funds);
› New Warehouse in Colombia (formation of initial stock);
› ASK Fras-le initially adds a greater weight to the raw-material
stock balances and finished prioducts in relation to the volume
of sales;
› Increased inventories due to purchase of raw-materials in
advance (to mitigate future price increases).
› Effects of consolidation (new acquisitions);
› Higher level of disbursements in investments;
› Negative financial result (lower level of funds invested).
Note: The year 2016 includes R$ 295.5 million in payment of capital through public offering of shares.

13
In the short term:
› Increasing demand and progress in expansion projects;
› Foreign market with growth trend (Nafta).
› Investments in technology and expansion of production capacity;
› Optimism and growth of global economy, leading to inflationary pressure.
In the medium term, progress in strategic initiatives:
› Continued expansion;
› Greater diversification of product portfolio;
› Business expansion through foreign operations;
› Stabilization and synergy gains with the recent acquisitions (operational efficiency);
Expectations

14
Possible Questions
› Pipeline of Mergers & Acquisitions;
› Fras-le in readiness for increased demand.

15
Investor Relations AreaSite: http://ri.fras-le.com.br
E-mail: [email protected]: +55 (54) 3239.1517
Thank You!


17
R$ millionNet Income Comparison

18
Cost of Products Sold (COGS) Composition – 1Q18
19
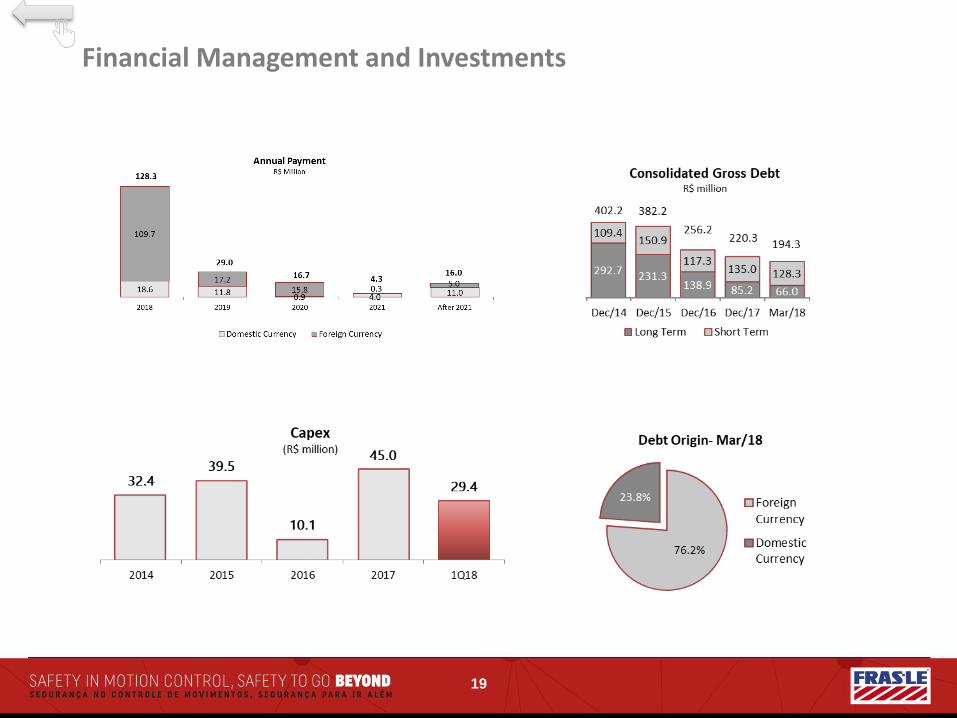
Financial Management and Investments
20
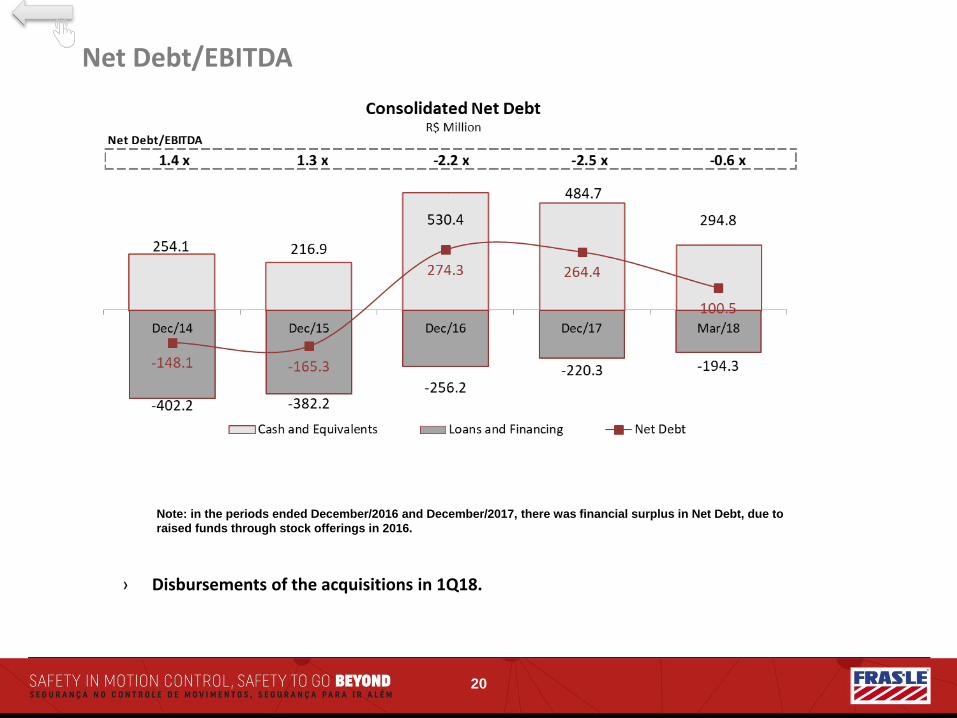
Net Debt/EBITDA
Note: in the periods ended December/2016 and December/2017, there was financial surplus in Net Debt, due to
raised funds through stock offerings in 2016.
› Disbursements of the acquisitions in 1Q18.

21
Turnover and Market ValueMarket Cap
R$ 1.2 billion

22
Products
Friction Material
Brake linings for Heavy Vehicles (Blocks) Brake linings for commercial vehicles.
Brake PadsBrake pads for commercial vehicles, automobiles, motorcycles
and small-sized aircraft.
Other Friction Materials
Brake linings for automobiles, railway shoes, Brake Shoes for
commercial vehicles and automobiles clutch facings, molded
linings, universal sheets and industrial products.
Various Products
Components for the Brake SystemDiscs, drums, wheel Hubs, hydraulic cylinders, servo brake,
repair kits, actuators, and retaining valves.
Components for the Suspension SystemShock absorbers, shock absorbers kits, suspension bushing kits,
pivots, trays, ball joints
Components for the EnginePistons, valves, water pumps, oil pumps, fuel pumps, hoses, air
filters, gaskets.
Packed liquidsBrake fluids, coolants, Antifreeze, anticorrosive, additives,
Lubricants.
Other Various Products
Polymer materials that do not fall into the previous categories,
Cardan shaft and accessories, bearings, cross pieces, axles,
repair kits, pinion, crown, homokinetic joint gaskets, flange,
linkage bar, reaction bar, side steering rod, rod ends, joints,
backing plates, riveting machines, rivets, dies and iron and
steel scrap.
Detailed Description of Sold Products
Detailed description of the products sold
<Physical Volumes Sold

23
Investor Relations AreaSite: http://ri.fras-le.com.br
E-mail: [email protected]: +55 (54) 3239.1517