Importance of Demand-side Analysis -...
31
Importance of Demand-side Analysis mobile telecom example from T@BOP3 data Harsha de Silva LIRNEasia, Colombo, Sri Lanka CPRsouth4 Tutorial Session Negambo Sri Lanka, 5-6 December 2009
Transcript of Importance of Demand-side Analysis -...

Importance of Demand-side Analysismobile telecom example from T@BOP3 data
Harsha de SilvaLIRNEasia, Colombo, Sri Lanka
CPRsouth4Tutorial SessionNegambo Sri Lanka, 5-6 December 2009

Agenda
Why not supply-side analysis Why demand-side analysis Some basic theory of demand Consumer behavior example using mobile
phones among the BOP

Agenda
Why not supply-side analysis Irrelevance The unique-relevance
Why demand-side analysis Some basic theory of demand Demand function Price and income elasticity of demand
Consumer behavior example social influence in adoption of mobile phones among the BOP

Why not supply-side analysis
General irrelevance But, the unique-policy-relevance
Market failures Policy formulation
Universal service obligations Access Deficit Charges
Government failures

High-income households Low-income households
Original level of access
Affordability frontier
Access Gap; Geographic and economic constraints leading to under supply. Specific universal access targets and subsidy scheme
Market Efficiency Gap; distorted markets leading to under supply. Improve market effeciency; private investment and competition. Transparent regulatory framework
Market failuresunderstanding reality
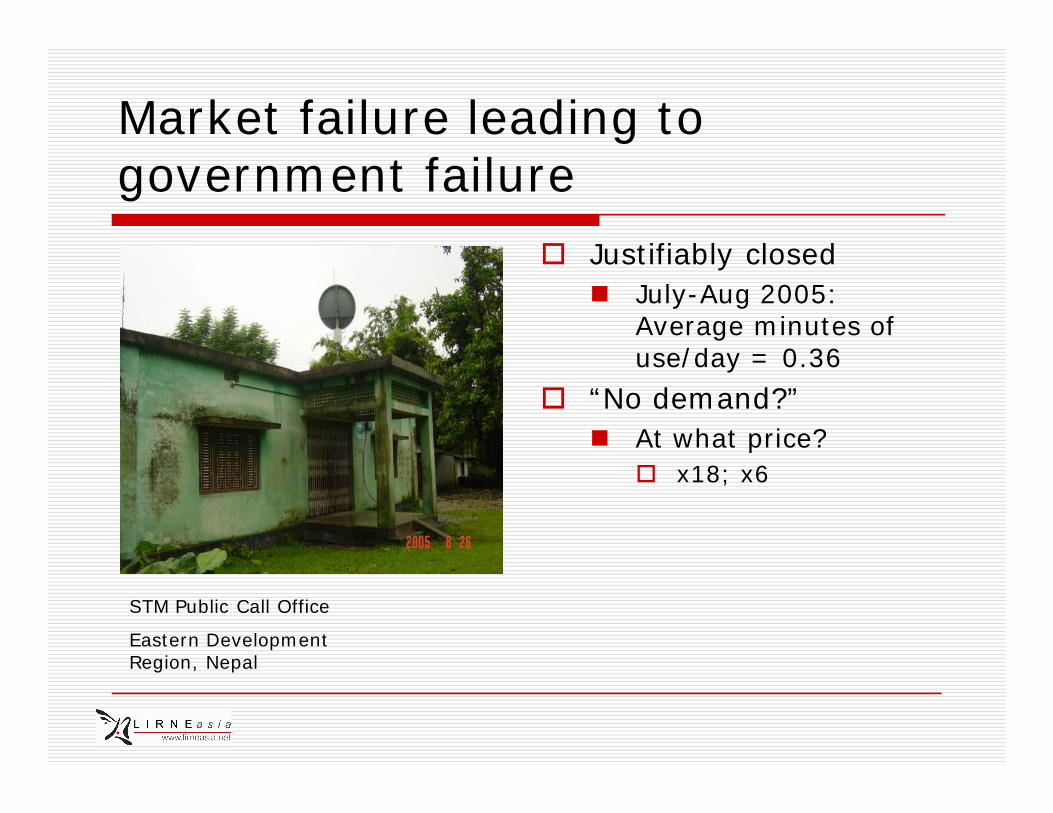
Market failure leading to government failure
Justifiably closed July-Aug 2005:
Average minutes of use/day = 0.36
“No demand?” At what price?
x18; x6
STM Public Call Office
Eastern Development Region, Nepal

Agenda
Why not supply-side analysis Irrelevance The unique-relevance
Why demand-side analysis Some basic theory of demand Demand function Price and income elasticity of demand
Consumer behavior example social influence in adoption of mobile phones among the BOP

Why demand-side analysis
Photograph courtesy of Daily Mirror, November 2009

Agenda
Why not supply-side analysis Irrelevance The unique-relevance
Why demand-side analysis Some basic theory of demand Demand function Elasticity of demand
Consumer behavior example social influence in adoption of mobile phones among the BOP

The demand function
D = f (P, Pn…Pn-1, Y, T,…) P = Price of the service Price elasticity of demand
Pn…Pn-1 = Prices of other services Prices of substitutes and complements Cross price elasticity of demand
Y = Consumer incomes Level and distribution of income Income elasticity of demand
T = Tastes and preferences; consumer behavior Social influence example

Agenda
Why not supply-side analysis Irrelevance The unique-relevance
Why demand-side analysis Some basic theory of demand Demand function Elasticity of demand
Consumer behavior example Social influence in adoption of mobile phones
among the BOP. The demand function.

BOP in emerging Asiarepresentative BOP sample in 6 countries2
BOP SEC groups D+E; age 15-60
Maps well with < USD 2/day
The T@BOP3 study (2008-2009) QN: Sep. 2008; 9,540 BOP representative
sample; 50% 1-week diary BN 2,050; PK 1,814; IN 3,152; LK 924; PH 800;
TH 800 Fieldwork The Nielsen Company
QL: Feb-Mar 2009; 60 protocols; FGD, UME, DI

Background to the findings‘almost universal’ access…2
...low but growing adoption
What drives adoption? How important is social influence in the demand function?

Gistsocial influence is important in mobile adoption1
Empirical evidence on importance of social influence in mobile phone adoption
Leading to social policy implications impact on the demand function

Theoretical frameworklong history; several angles1
Social influence Original ‘subjective norm’ [Theory of Reasoned
Action; Fishbein and Ajzen, 1975 … Venkatesh, 2003 … van Biljon and Kotze, 2008 etc.] Consumer behaviour [behavioral intensions, attitudes] Social pressure exerted by others Social coercion, imitation and normalization [Chen and
Sutano, 2007]
Perceived [social] benefit Extension of Technology Acceptance Model [Davis et
al., 1989] Social + economic benefit T@BOP2; ‘blurring lives and livelihoods’ Donner, 2009
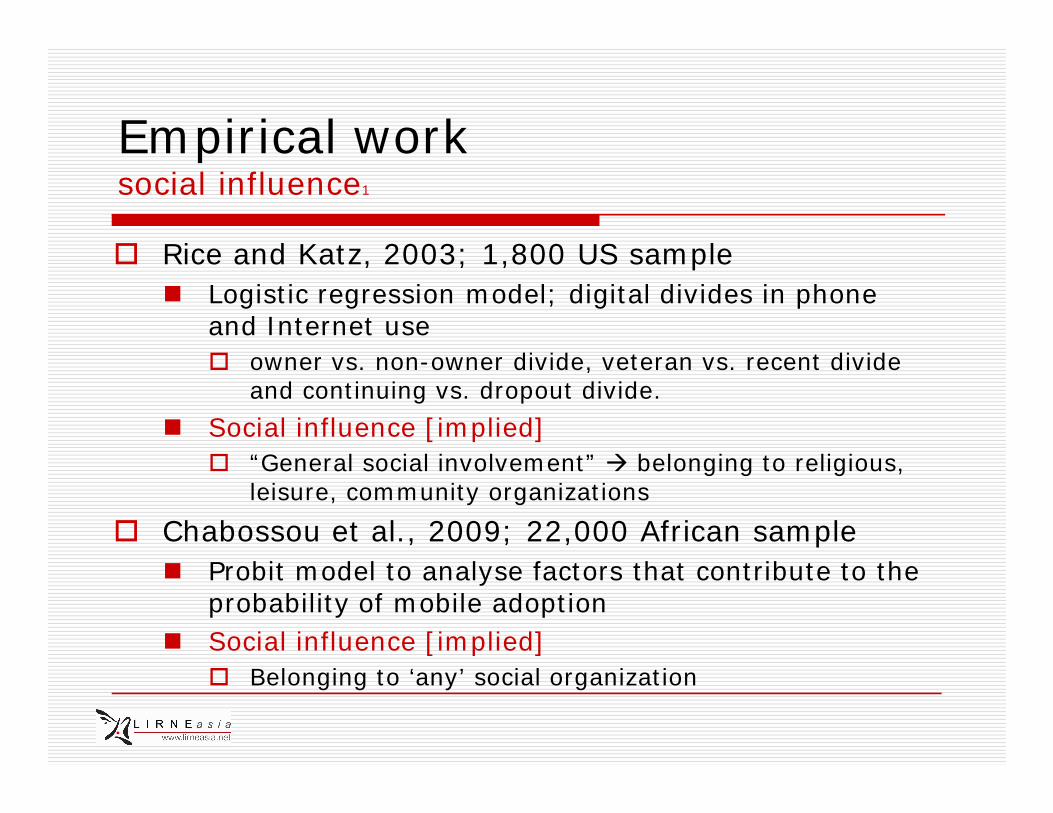
Empirical worksocial influence1
Rice and Katz, 2003; 1,800 US sample Logistic regression model; digital divides in phone
and Internet use owner vs. non-owner divide, veteran vs. recent divide
and continuing vs. dropout divide.
Social influence [implied] “General social involvement” belonging to religious,
leisure, community organizations
Chabossou et al., 2009; 22,000 African sample Probit model to analyse factors that contribute to the
probability of mobile adoption Social influence [implied]
Belonging to ‘any’ social organization

Innovation social influencemeasuring social pressure
Passive Belonging to social group
Active How many in closest network of 5 people own a
mobile phone 0, 1, 2, 3, 4 or all 5 If more people own a phone, then the pressure
to own will be more Social pressure argument of Chen and Sutano, 2007; Von
Bijon & Kotze, 2008; Mark & Poltrok, 2001 Adoption threshold argument by Valentene (1996) etc. Low
vs. high threshold. Personal networks vs. social systems

Characteristics of adoptersstrong link with adoption among network2

Likelihood of adoptionincreases with more in network adopting
Odds ratio [prob. of adoption] / [prob. of not adoption]
Odds of adoption increases by 37%; i.e., 1.37 to 1, with each member in network adopting
Odds of adoption is 4.86 when none of the members adopting to all members adopting

Innovation social benefitmeasuring social benefit
Aggregated Benefit from adoption or usage Early work on TAM extended by many;
Venkatesh et al., 2003; VB&K, 2008 etc.
Disaggregated Emergency-related benefits Social benefits Economic benefits de Silva & Zainudeen, 2007

Benefit categoriesemergency, social and economic
3; No change 4; somewhat improved
5; improved2; somewhat worsened
1; worsened
Scale Improved

Characteristics of adoptersbenefits appreciated either way3

Perceived increase in social benefit has significant positive impact on adoption Linked to emergency benefit Linked to economic benefit
Likelihood of adoptionIncreases with greater perceived benefit

Mediating factors in adoptionreiterating previous findings for the most part
Demographics Age; younger higher odds Gender; male higher Education; more higher Location not necessarily urban [walk-time
proxy] is higher
Socioeconomic factors Income; higher higher odds TV/radio in household higher

Adoption diagramTastes and preferences in the demand function
Social pressureSocial and
Otherbenefits
Demographic and socioeconomicfactors
Ease of use etc.
adoption

Country-wise breakdownnetwork; socio-economic benefits

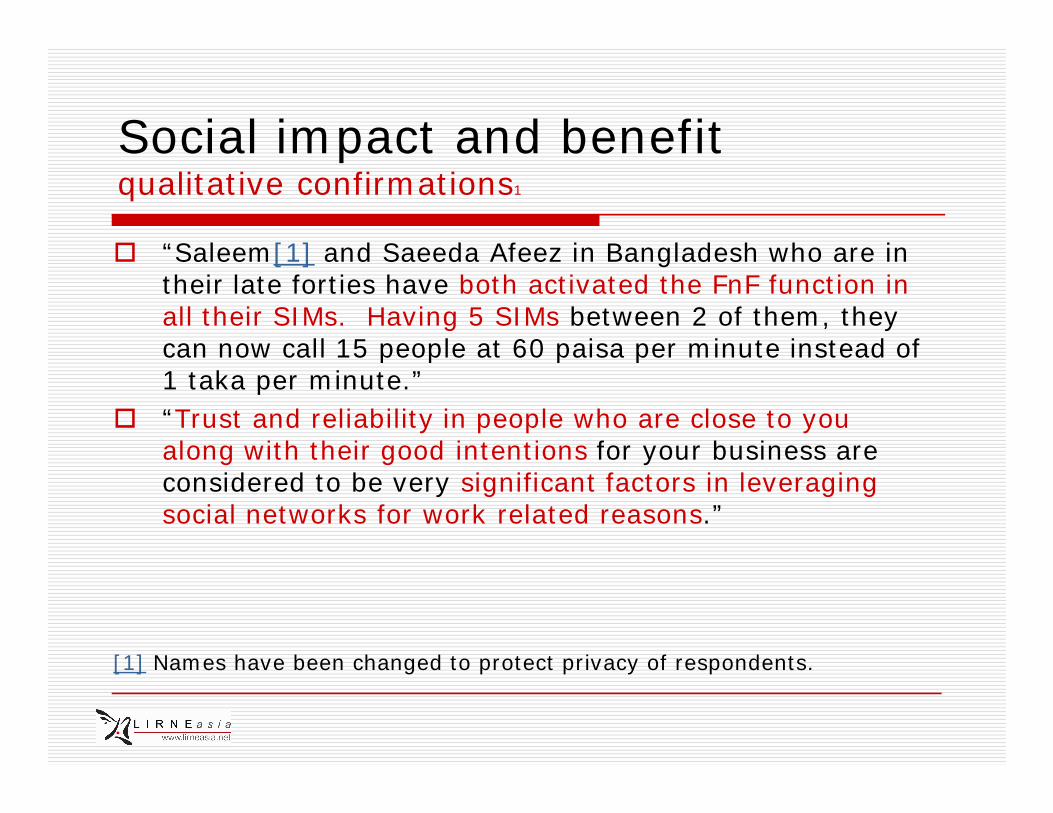
Social impact and benefitqualitative confirmations1
“Saleem[1] and Saeeda Afeez in Bangladesh who are in their late forties have both activated the FnF function in all their SIMs. Having 5 SIMs between 2 of them, they can now call 15 people at 60 paisa per minute instead of 1 taka per minute.”
“Trust and reliability in people who are close to you along with their good intentions for your business are considered to be very significant factors in leveraging social networks for work related reasons.”
[1] Names have been changed to protect privacy of respondents.

Conclusions2
impact on the demand function
People seem to be getting connected in ‘groups’ Not new, but empirical evidence with probabilities
Input side: Social pressure significant Unique moment in time; closest 5 with phones still
ranging from 0-5
Output side: Socio-economic benefits significant “Blurring” of lives and livelihoods
Network marketing Promotions for group adoption

Summary
Why not supply-side analysis Irrelevance The unique-relevance
Why demand-side analysis Some basic theory of demand Demand function Elasticity of demand
Consumer behavior example Social influence in adoption of mobile phones
among the BOP. The demand function.