
Importance of CCS and Global Status · Importance of CCS and Global Status ... 80% of the world’s...
30
Importance of CCS and Global Status Carbon Capture and Storage – Deep Dive Workshop Asian Development Bank 6 June 2016
Transcript of Importance of CCS and Global Status · Importance of CCS and Global Status ... 80% of the world’s...
Importance of CCS and Global Status
Carbon Capture and Storage – Deep Dive Workshop
Asian Development Bank
6 June 2016
Presentation Overview
Why is CCS important?
The contribution of CCS to reduce global emissions
Cost of mitigation without CCS
Global Status of CCS
Summary

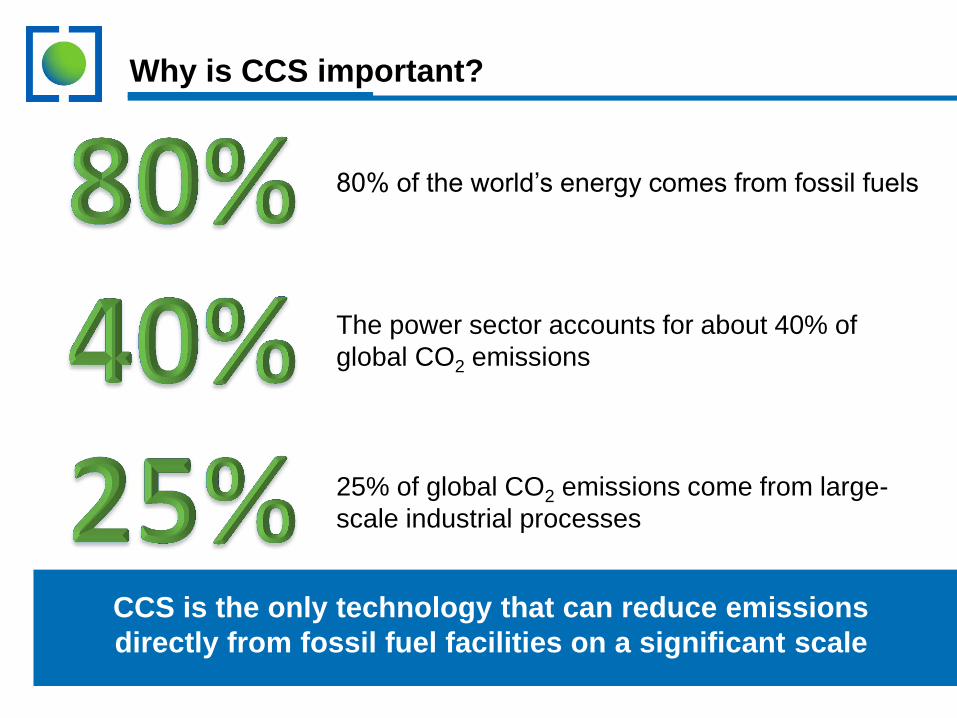
Why is CCS important?
Why is CCS important?
80% of the world’s energy comes from fossil fuels
The power sector accounts for about 40% of
global CO2 emissions
25% of global CO2 emissions come from large-
scale industrial processes
CCS is the only technology that can reduce emissions
directly from fossil fuel facilities on a significant scale
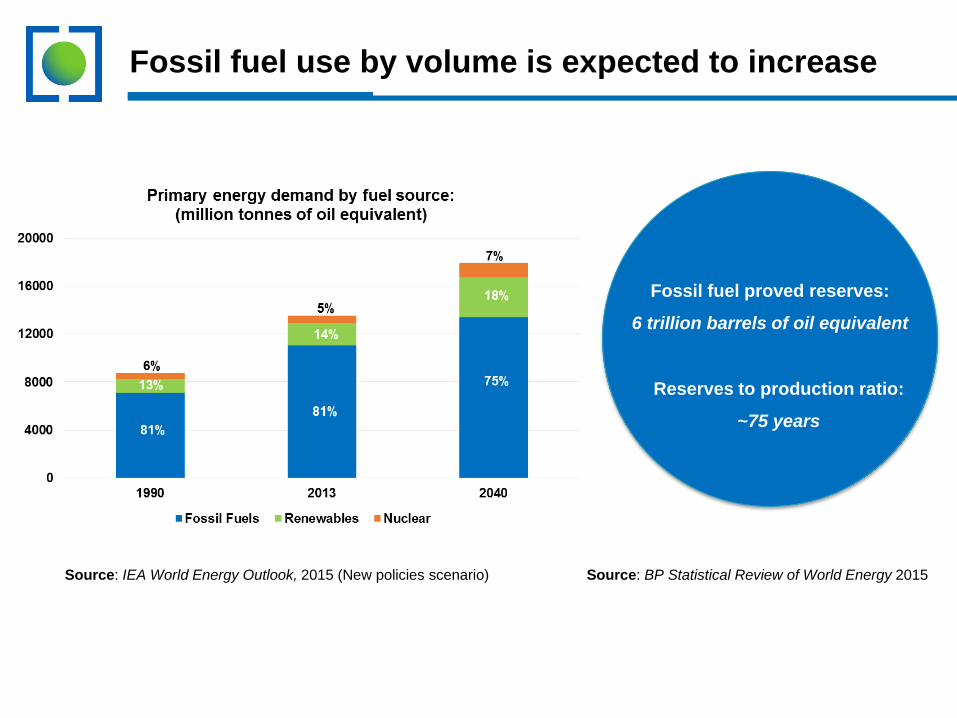
Fossil fuel use by volume is expected to increase
Source: BP Statistical Review of World Energy 2015
Fossil fuel proved reserves:
6 trillion barrels of oil equivalent
Reserves to production ratio:
~75 years
Source: IEA World Energy Outlook, 2015 (New policies scenario)
The contribution of CCS to reduce
global emissions
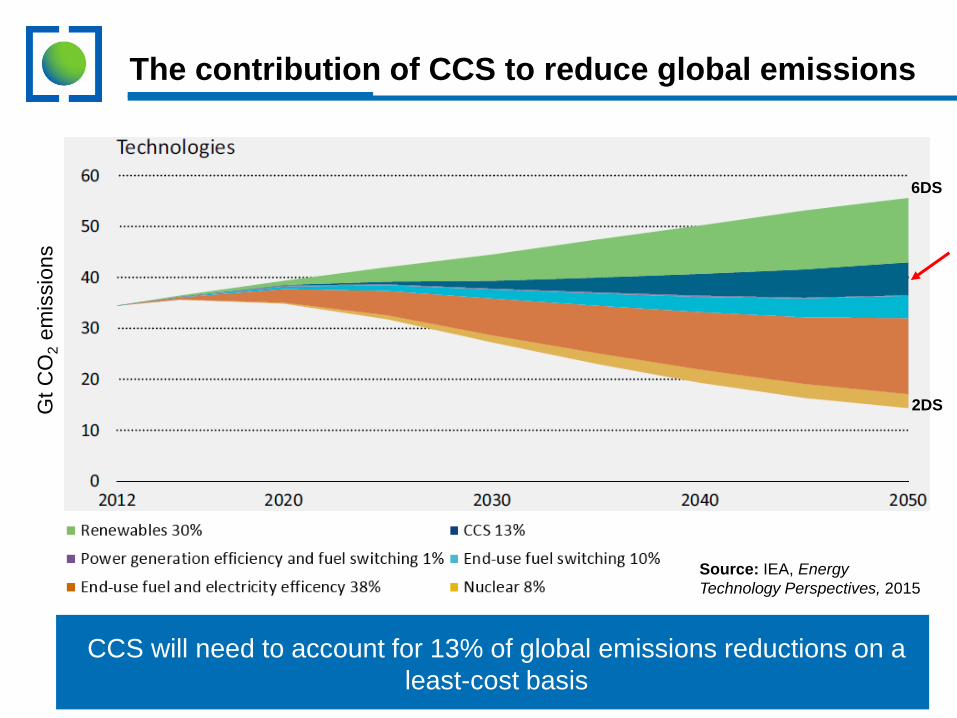
The contribution of CCS to reduce global emissions
Source: IEA, Energy
Technology Perspectives, 2015
CCS will need to account for 13% of global emissions reductions on a
least-cost basis
Gt
CO
2 e
mis
sio
ns
6DS
2DS
Cost of mitigation increases without
CCS – by an estimated 138%

Mitigation costs more than double in scenarios with
limited availability of CCS
*Percentage increase in total discounted mitigation costs (2015-2100) relative to default technology assumptions – median estimate
+ 7% + 6%
+ 64%
+ 138%
Baseline cost with all mitigation options utilized
Source: IPCC Fifth Assessment Synthesis Report, Summary for Policymakers, November 2014.
Cost increase under limited technology availability scenarios
50
100
150
Pe
rce
nta
ge*
Nuclear phase out Limited solar/wind
Limited bioenergy
No CCS

Global Status of CCS – a proven
technology at large scale
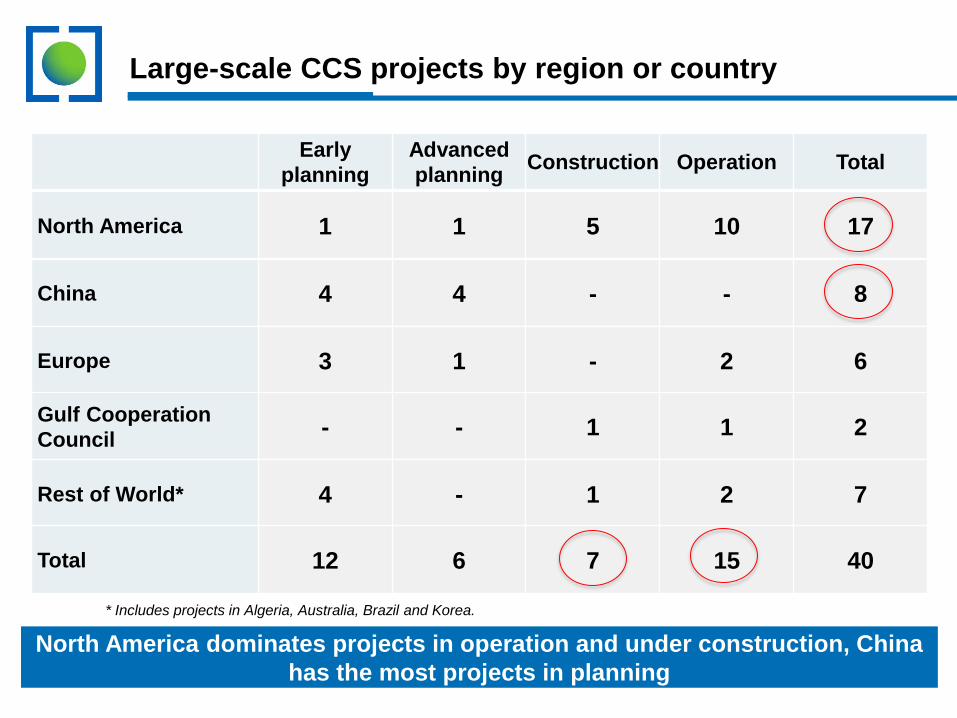
Large-scale CCS projects by region or country
North America dominates projects in operation and under construction, China
has the most projects in planning
North America 1 1 5 10 17
Early
planning Advanced
planning Construction Operation Total
China 4 4 - - 8
Europe 3 1 - 2 6
Gulf Cooperation
Council - - 1 1 2
Rest of World* 4 - 1 2 7
Total 12 6 7 15 40
* Includes projects in Algeria, Australia, Brazil and Korea.
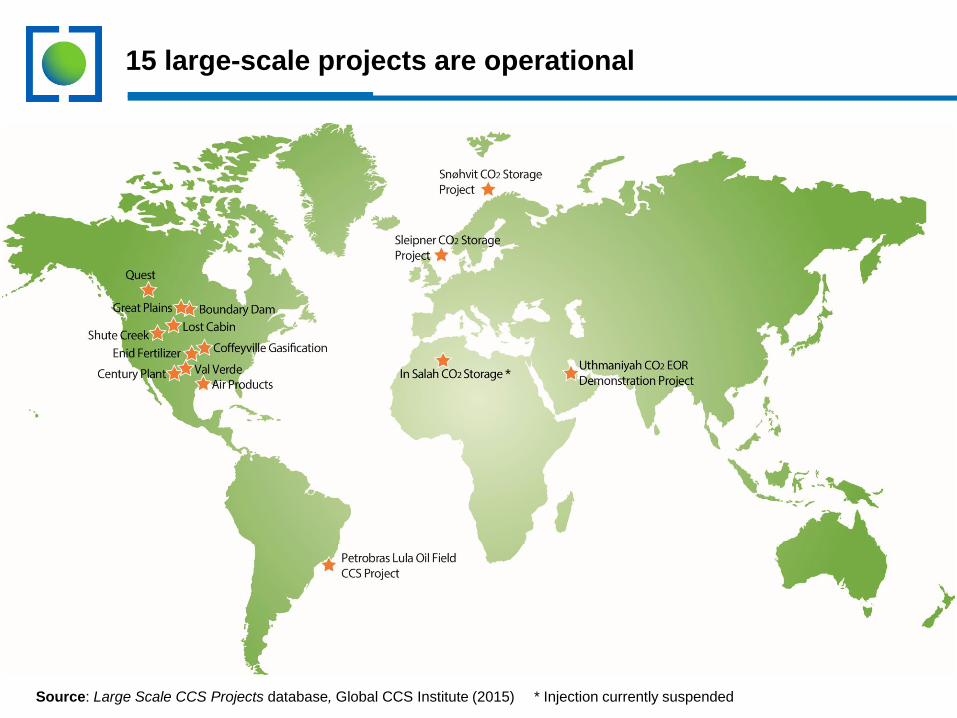
15 large-scale projects are operational
Source: Large Scale CCS Projects database, Global CCS Institute (2015)
*
* Injection currently suspended
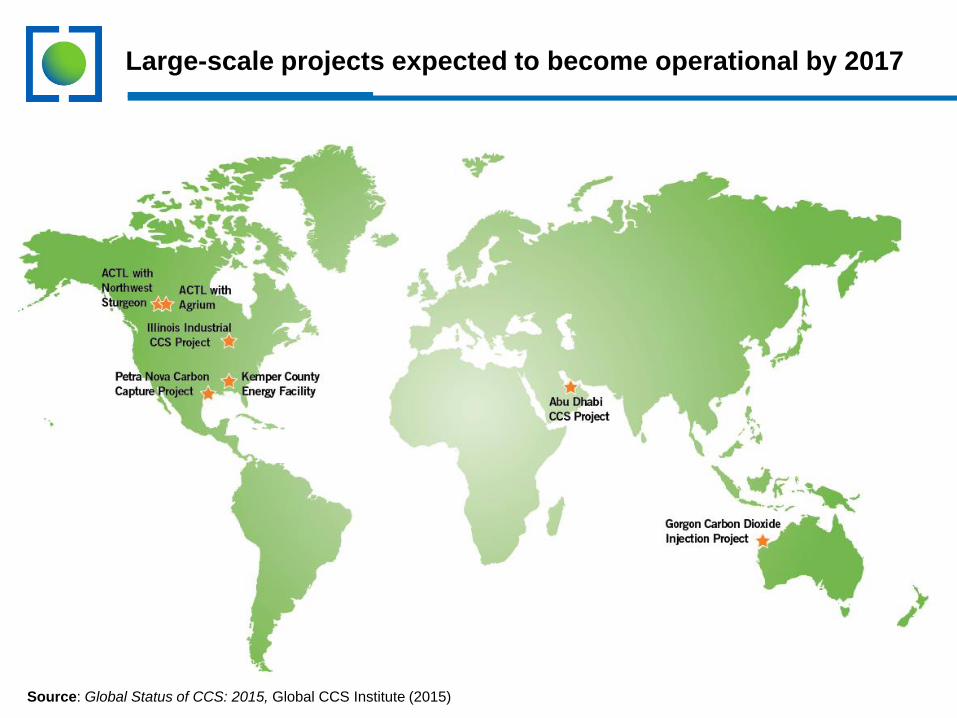
Large-scale projects expected to become operational by 2017
Source: Global Status of CCS: 2015, Global CCS Institute (2015)
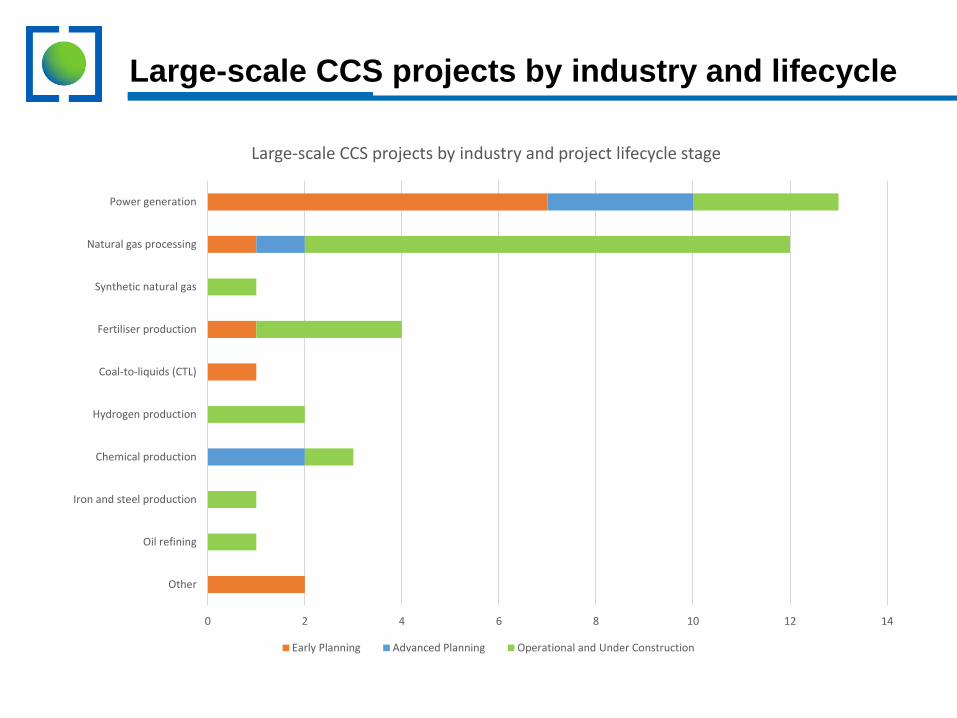
Large-scale CCS projects by industry and lifecycle
0 2 4 6 8 10 12 14
Other
Oil refining
Iron and steel production
Chemical production
Hydrogen production
Coal-to-liquids (CTL)
Fertiliser production
Synthetic natural gas
Natural gas processing
Power generation
Large-scale CCS projects by industry and project lifecycle stage
Early Planning Advanced Planning Operational and Under Construction
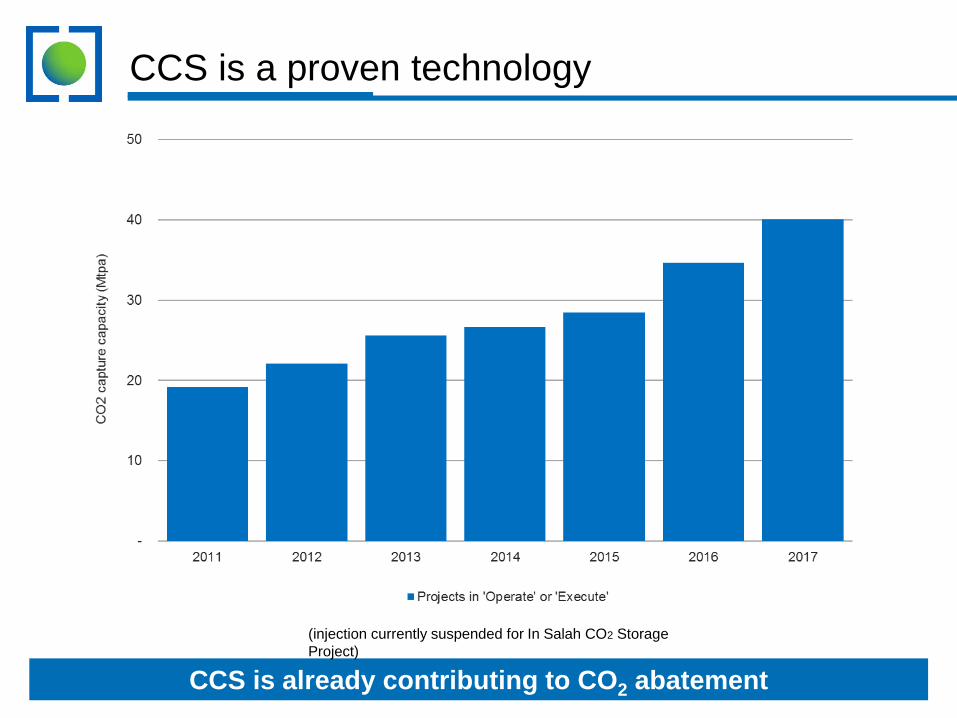
CCS is a proven technology
CCS is already contributing to CO2 abatement
(injection currently suspended for In Salah CO2 Storage
Project)
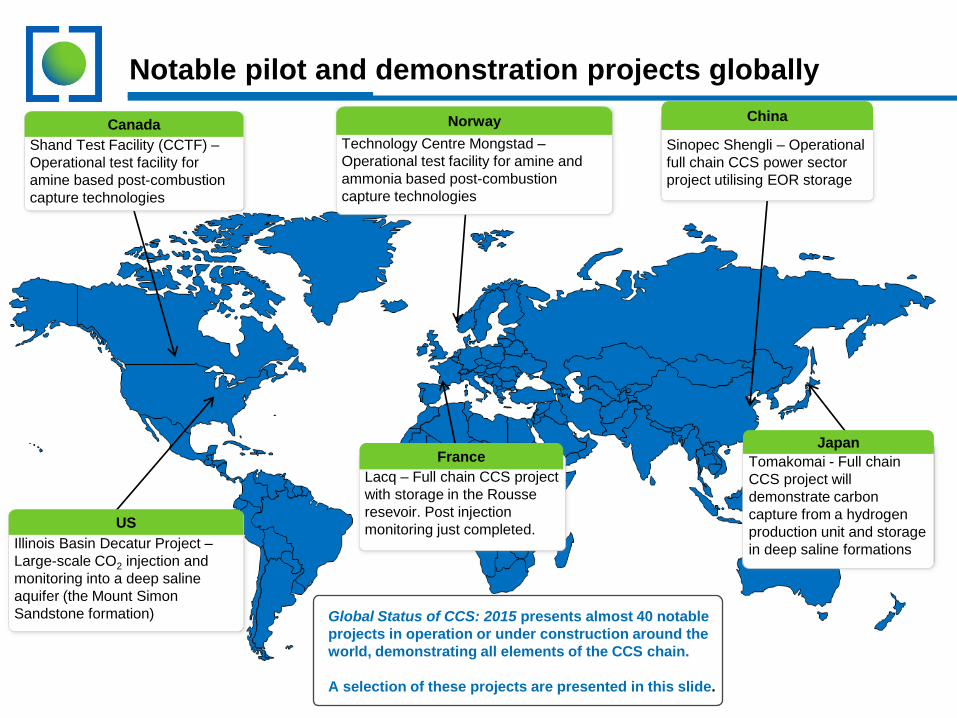
Notable pilot and demonstration projects globally
Illinois Basin Decatur Project –
Large-scale CO2 injection and
monitoring into a deep saline
aquifer (the Mount Simon
Sandstone formation) Global Status of CCS: 2015 presents almost 40 notable
projects in operation or under construction around the
world, demonstrating all elements of the CCS chain.
A selection of these projects are presented in this slide.
Technology Centre Mongstad –
Operational test facility for amine and
ammonia based post-combustion
capture technologies
Norway
Tomakomai - Full chain
CCS project will
demonstrate carbon
capture from a hydrogen
production unit and storage
in deep saline formations
Japan
US
• Shand Carbon Capture
Shand Test Facility (CCTF) –
Operational test facility for
amine based post-combustion
capture technologies
Canada
Sinopec Shengli – Operational
full chain CCS power sector
project utilising EOR storage
China
Lacq – Full chain CCS project
with storage in the Rousse
resevoir. Post injection
monitoring just completed.
France

Summary

Why is CCS important?
• The majority of the world’s emissions comes from fossil fuel facilities
The contribution of CCS to reduce global emissions
• IEA estimates CCS will need to contribute 13% of global emission reductions
on a least cost basis
Cost of mitigation increases without CCS
• The IPCC estimate that the cost of achieving our global emission reductions
without CCS will increase by an estimated 138%
Global Status of CCS – proven at large scale
• 15 large scale projects already operating.
• 7 under construction
• Many smaller scale projects in operation
Summary


Appendix Slides
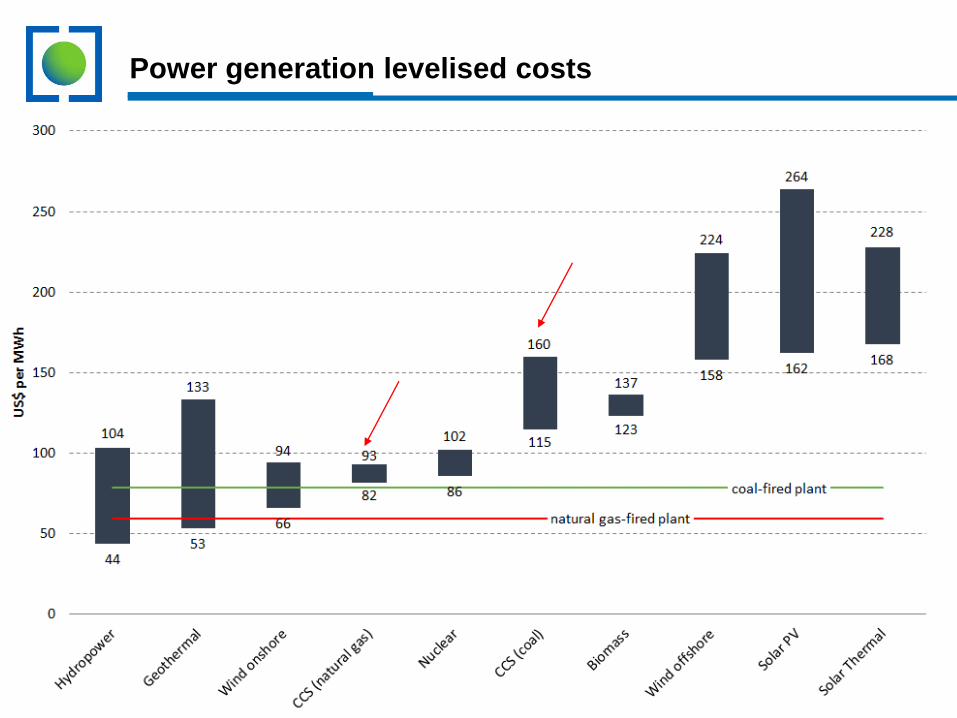
Power generation levelised costs
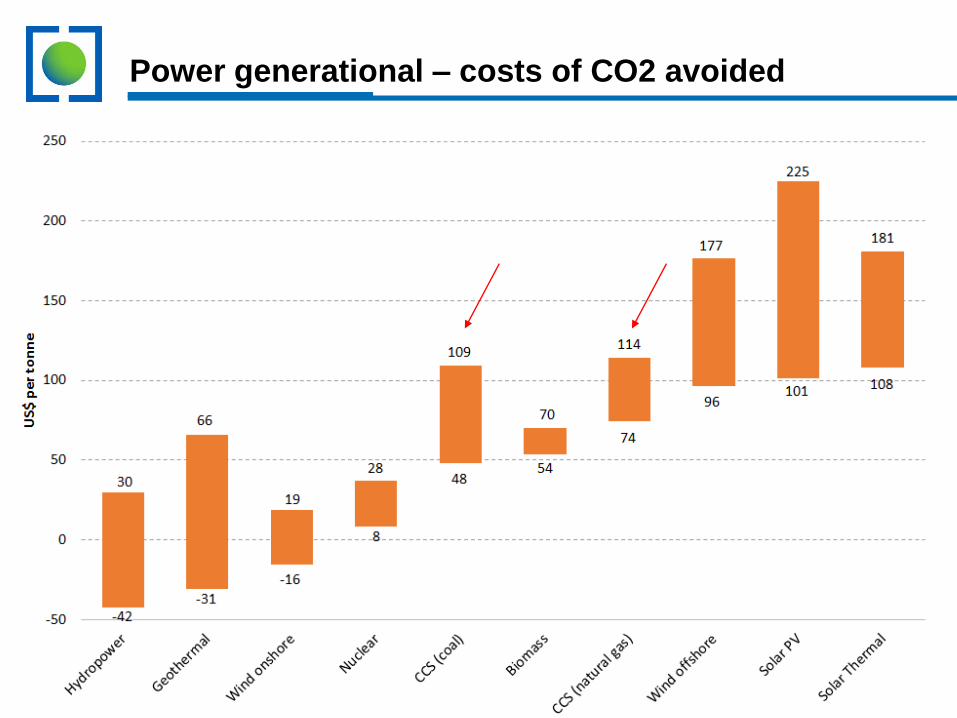
Power generational – costs of CO2 avoided
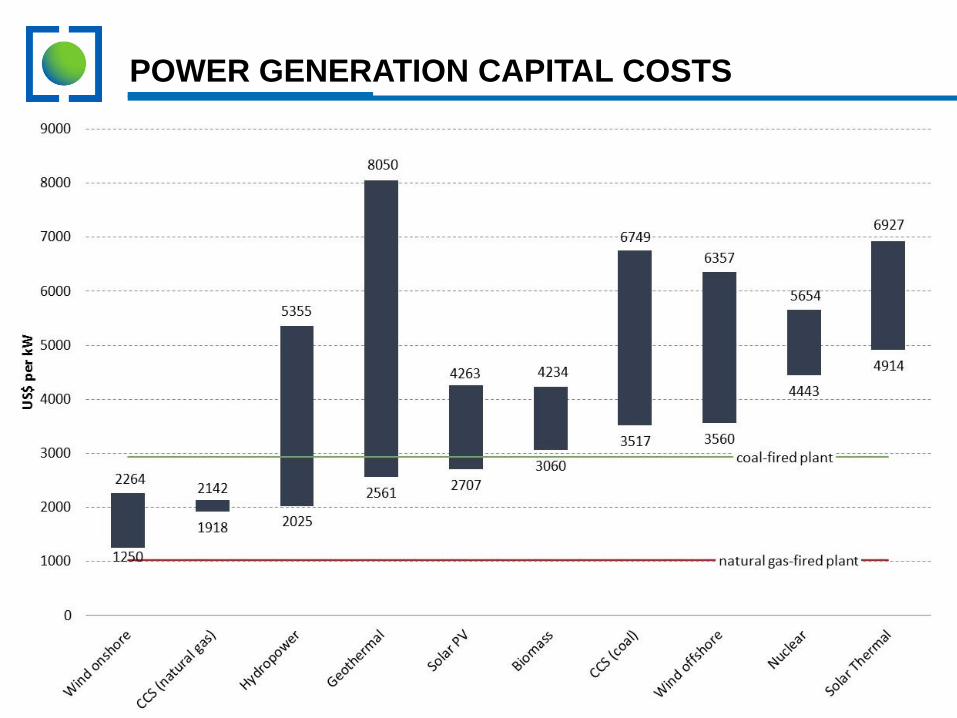
POWER GENERATION CAPITAL COSTS
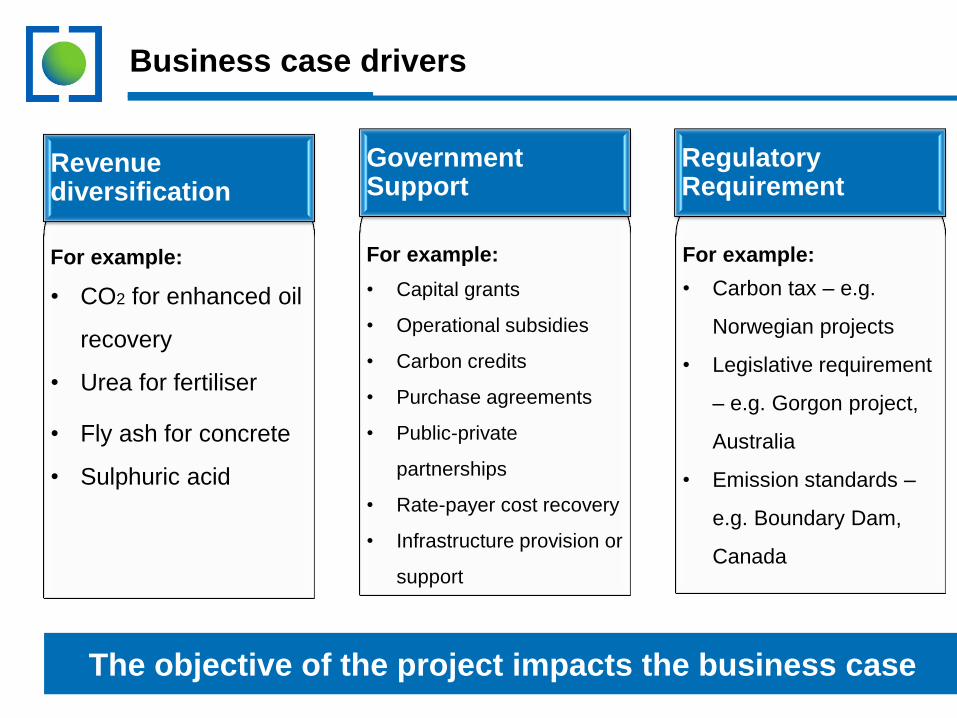
Business case drivers
For example:
• CO2 for enhanced oil
recovery
• Urea for fertiliser
• Fly ash for concrete
• Sulphuric acid
Revenue diversification
For example:
• Capital grants
• Operational subsidies
• Carbon credits
• Purchase agreements
• Public-private
partnerships
• Rate-payer cost recovery
• Infrastructure provision or
support
Government Support
For example:
• Carbon tax – e.g.
Norwegian projects
• Legislative requirement
– e.g. Gorgon project,
Australia
• Emission standards –
e.g. Boundary Dam,
Canada
Regulatory Requirement
The objective of the project impacts the business case
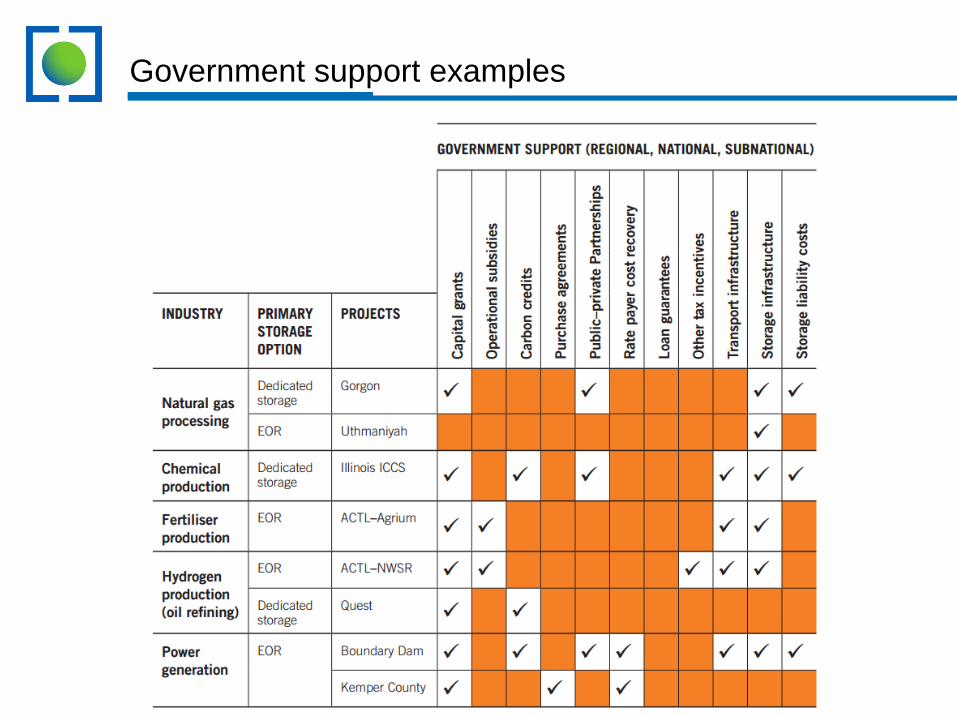
Government support examples

2015
EOR
Dedicated Geological
Power
Generation
*** Institute estimate
Actual and expected operation dates for projects in
Operating 2017 2016
Hydrogen
production
Natural gas
processing
Chemical
production
Iron and steel
production
Synthetic
natural gas
Fertiliser
production
Oil refining
2018 2019 2020
= 1Mtpa of CO2 (areas of circle are proportional to capacity)
Coal-to-liquids
* Injection currently suspended
Boundary
Dam
Kemper
Petra
Nova
ROAD
Sargas
Texas
Sinopec Shengli
Illinois Industrial
Yanchang
Sinopec
Qilu
Abu Dhabi
ACTL Agrium Coffeyville
Century
Plant Enid
Fertilizer
Val Verde
Air Products
Lost Cabin
Lula
Snøhvit Sleipner
Shute Creek
In Salah*
Uthmaniyah
Quest
Gorgon***
ACTL Sturgeon
Petro China
Jilin
Great
Plains
operation, construction and advanced planning
** Storage options under evaluation
TCEP
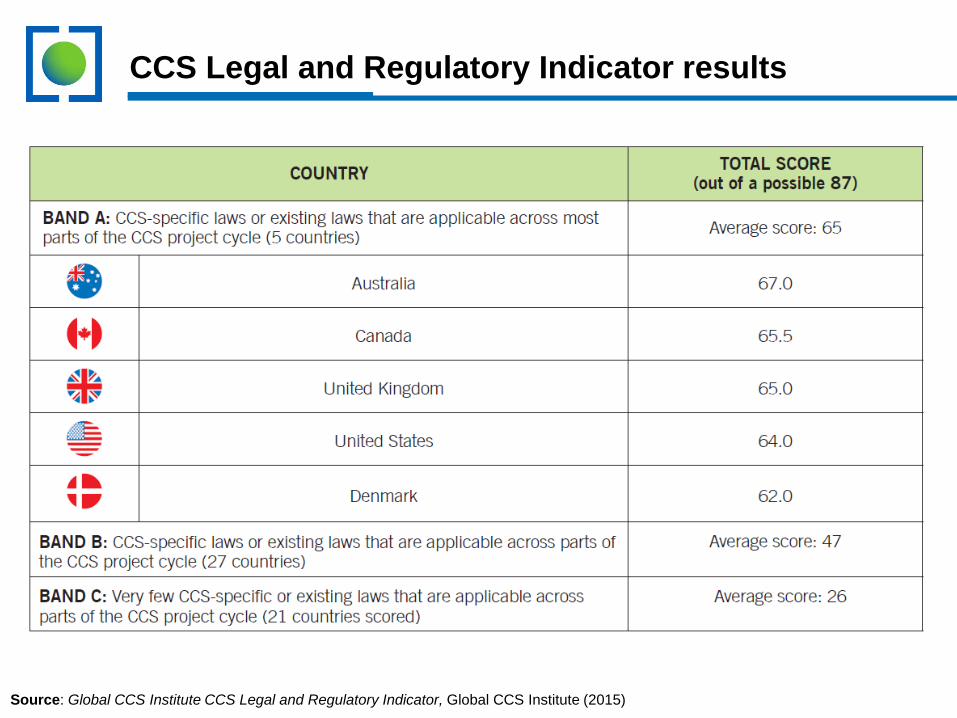
CCS Legal and Regulatory Indicator results
Source: Global CCS Institute CCS Legal and Regulatory Indicator, Global CCS Institute (2015)
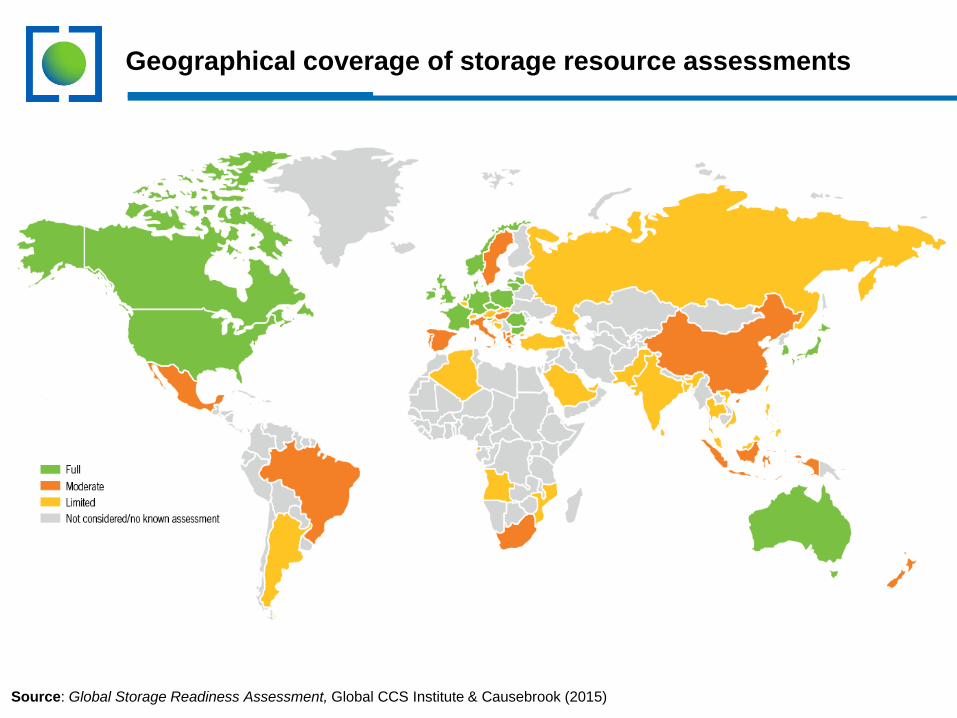
Geographical coverage of storage resource assessments
Source: Global Storage Readiness Assessment, Global CCS Institute & Causebrook (2015)
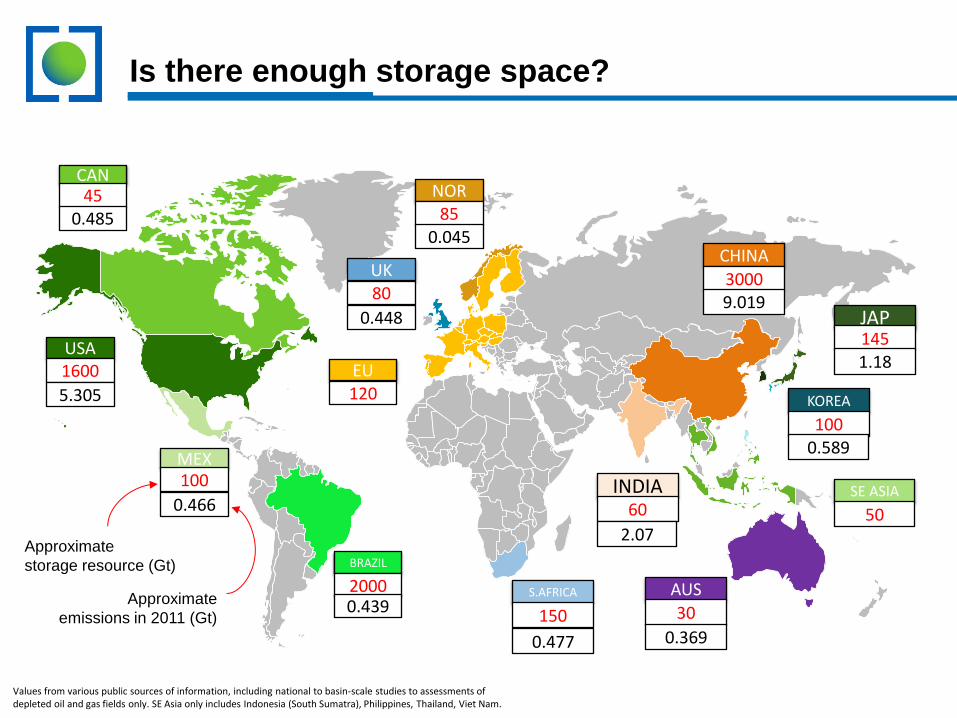
Approximate
storage resource (Gt)
Values from various public sources of information, including national to basin-scale studies to assessments of depleted oil and gas fields only. SE Asia only includes Indonesia (South Sumatra), Philippines, Thailand, Viet Nam.
Is there enough storage space?
USA 1600
BRAZIL
2000
MEX 100
S.AFRICA
150
EU 120
UK 80
NOR 85
INDIA 60
JAP 145
KOREA
100
SE ASIA
50
CHINA
3000
CAN 45
0.485
5.305
0.439
2.07
0.045
0.466
1.18
AUS
30
0.369
0.589
0.477
0.448 9.019
Approximate
emissions in 2011 (Gt)
Energy Penalty Considerations
1. R&D aimed at reducing energy penalty
2. Renewables could potentially be used to generate
some additional power requirements
3. New build – can scale up to offset parasitic load
• Not a significant cost driver