Implications of Web Mercator and Its Use in Online Mapping
17
ARTICLES Implications of Web Mercator and Its Use in Online Mapping Sarah E. Battersby Department of Geography / University of South Carolina / Columbia / SC / USA Michael P. Finn Center of Excellence for Geospatial Information Science / United States Geological Survey (USGS) / Denver / CO / USA E. Lynn Usery Center of Excellence for Geospatial Information Science / United States Geological Survey (USGS) / Rolla / MO / USA Kristina H. Yamamoto National Geospatial Technical Operations Center / United States Geological Survey USGS / Denver / CO / USA ABSTRACT Online interactive maps have become a popular means of communicating with spatial data. In most online mapping systems, Web Mercator has become the dominant projection. While the Mercator projection has a long history of discus- sion about its inappropriateness for general-purpose mapping, particularly at the global scale, and seems to have been virtually phased out for general-purpose global-scale print maps, it has seen a resurgence in popularity in Web Mercator form. This article theorizes on how Web Mercator came to be widely used for online maps and what this might mean in terms of data display, technical aspects of map generation and distribution, design, and cognition of spatial patterns. The authors emphasize details of where the projection excels and where it does not, as well as some of its advantages and disadvantages for cartographic communication, and conclude with some research directions that may help to develop better solutions to the problem of projections for general-purpose, multi-scale Web mapping. Keywords: online mapping, Web Mercator, map projections, GIScience, cartography RE ´ SUME ´ Les cartes interactives en ligne sont devenues un moyen populaire de communiquer au moyen de donne ´es spatiales. Dans la plupart des syste `mes de cartographie en ligne, la projection de Mercator sur le Web est devenue la projection domi- nante. La projection de Mercator soule `ve depuis longtemps des discussions sur son caracte `re inapproprie ´ en cartographie ge ´ne ´rale, particulie `rement a ` l’e ´chelle de la plane `te, et elle semble avoir a ` peu pre `s disparu des cartes imprime ´es a ` l’e ´chelle mondiale d’usage ge ´ne ´ral, mais on a constate ´ un regain de popularite ´ de la projection de Mercator sur le Web. Cet article pre ´sente une the ´orie sur la fac ¸on dont la projection de Mercator sur le Web s’est ge ´ne ´ralise ´e pour les cartes en ligne et sur ce que cela pourrait signifier pour l’affichage des donne ´es, les aspects techniques de la production et de la distribu- tion de cartes, la conception et la cognition des tendances spatiales. Les auteurs mettent en e ´vidence des de ´tails sur les aspects ou ` la projection excelle et sur ceux ou ` elle n’excelle pas, ainsi que certains de ses avantages et inconve ´nients pour la communication cartographique. Ils concluent par des pistes de recherche qui peuvent aider a ` trouver une meilleure solution au proble `me des projections destine ´es a ` la cartographie ge ´ne ´rale a `e ´chelles multiples sur le Web. Mots cle ´s : cartographie en ligne, Mercator sur le Web, projections cartographiques, science SIG, cartographie Introduction Persistent misuse of the equatorial Mercator projec- tion, especially for world maps having nothing to do with navigation, taunts cartographically savvy geogra- phers. —Monmonier (2004, 121) As Monmonier (2004) suggests, misuse of the Mercator projection has taunted cartographers and geographers for decades, perhaps centuries. Cartographers and geographers seem to have kept a trained eye out to find and report in- appropriate uses of the Mercator projection in print form; nonetheless, the cartographic community has now seem- ingly turned a blind eye to the return of the projection as Web Mercator. Cartographica 49:2, 2014, pp. 85–101 doi:10.3138/carto.49.2.2313 85
Transcript of Implications of Web Mercator and Its Use in Online Mapping

ARTICLES
Implications of Web Mercator and Its Use inOnline Mapping
Sarah E. BattersbyDepartment of Geography / University of South Carolina / Columbia / SC / USA
Michael P. FinnCenter of Excellence for Geospatial Information Science / United States Geological Survey (USGS) / Denver / CO / USA
E. Lynn UseryCenter of Excellence for Geospatial Information Science / United States Geological Survey (USGS) / Rolla / MO / USA
Kristina H. YamamotoNational Geospatial Technical Operations Center / United States Geological Survey USGS / Denver / CO / USA
ABSTRACT
Online interactive maps have become a popular means of communicating with spatial data. In most online mappingsystems, Web Mercator has become the dominant projection. While the Mercator projection has a long history of discus-sion about its inappropriateness for general-purpose mapping, particularly at the global scale, and seems to have beenvirtually phased out for general-purpose global-scale print maps, it has seen a resurgence in popularity in Web Mercatorform. This article theorizes on how Web Mercator came to be widely used for online maps and what this might mean interms of data display, technical aspects of map generation and distribution, design, and cognition of spatial patterns. Theauthors emphasize details of where the projection excels and where it does not, as well as some of its advantages anddisadvantages for cartographic communication, and conclude with some research directions that may help to developbetter solutions to the problem of projections for general-purpose, multi-scale Web mapping.
Keywords: online mapping, Web Mercator, map projections, GIScience, cartography
RESUME
Les cartes interactives en ligne sont devenues un moyen populaire de communiquer au moyen de donnees spatiales. Dansla plupart des systemes de cartographie en ligne, la projection de Mercator sur le Web est devenue la projection domi-nante. La projection de Mercator souleve depuis longtemps des discussions sur son caractere inapproprie en cartographiegenerale, particulierement a l’echelle de la planete, et elle semble avoir a peu pres disparu des cartes imprimees a l’echellemondiale d’usage general, mais on a constate un regain de popularite de la projection de Mercator sur le Web. Cet articlepresente une theorie sur la facon dont la projection de Mercator sur le Web s’est generalisee pour les cartes en ligne etsur ce que cela pourrait signifier pour l’affichage des donnees, les aspects techniques de la production et de la distribu-tion de cartes, la conception et la cognition des tendances spatiales. Les auteurs mettent en evidence des details sur lesaspects ou la projection excelle et sur ceux ou elle n’excelle pas, ainsi que certains de ses avantages et inconvenients pourla communication cartographique. Ils concluent par des pistes de recherche qui peuvent aider a trouver une meilleuresolution au probleme des projections destinees a la cartographie generale a echelles multiples sur le Web.
Mots cles : cartographie en ligne, Mercator sur le Web, projections cartographiques, science SIG, cartographie
Introduction
Persistent misuse of the equatorial Mercator projec-
tion, especially for world maps having nothing to do
with navigation, taunts cartographically savvy geogra-
phers.
—Monmonier (2004, 121)
As Monmonier (2004) suggests, misuse of the Mercator
projection has taunted cartographers and geographers for
decades, perhaps centuries. Cartographers and geographers
seem to have kept a trained eye out to find and report in-
appropriate uses of the Mercator projection in print form;
nonetheless, the cartographic community has now seem-
ingly turned a blind eye to the return of the projection as
Web Mercator.
Cartographica 49:2, 2014, pp. 85–101 doi:10.3138/carto.49.2.2313 85

In this paper, we discuss issues of relevance to the cartog-
raphers, geographers, map users, and map designers who
are producing and using Web maps based on the Web
Mercator projection. We emphasize several positive, nega-
tive, and sometimes questionable aspects related to tech-
nical map projection characteristics, data processing and
delivery, map design, and the cognitive and educational
challenges specific to the Mercator and Web Mercator
projections. Our goal is not to vilify the projection but
to discuss what it is and why it is being used and to raise
issues with the applicability of the projection in a carto-
graphic environment that is becoming increasingly focused
on simple, accessible Web-based map creation and delivery.
This particularly time-relevant discussion arises as the last
decade has seen a major shift in the way that Web maps
are being used, the purposes for which they are being
designed, and the increase in accessibility of the maps for
almost any end user to customize and distribute. Judging
from the number of online mapping applications cur-
rently available, a noticeable shift has occurred from Web
maps as local-scale, reference maps to a ubiquitous, all-
purpose, all-scale reference and thematic map product.
With this shift to general purpose and thematic map-
ping across scales, the Web Mercator projection presents
new challenges that need to be addressed – and critically
evaluated – to understand the implications of the projec-
tion for communicating spatial information.
The Basics of Mercator and Web Mercator
The Mercator projection is a cylindrical map projection
introduced by Gerardus Mercator in 1569. Mercator de-
picted the map projection on a huge world map of 21 sec-
tions, and the projection became essential in the develop-
ment of projections (Keuning 1955; Snyder 1987). This
projection is one of the most widely known and has a
long history of use for global-scale mapping. The Merca-
tor projection is a conformal projection, preserving local
angles around points. Although conformality is, in itself,
a desirable property for certain map uses (e.g., naviga-
tion), preservation of this property comes at the expense
of distorting other potentially desirable map properties –
such as area. In the Mercator projection, the lack of area
preservation manifests in massive inflation of area (rela-
tive to other regions) in the areas toward the poles. This
inflation is most noticeable (and most often discussed) in
the land areas in the northern hemisphere.
On the other hand, the Web Mercator projection is a
more recent introduction, probably from the early twenty-
first century, that we discuss more in a later section.
While the Web Mercator projection has many similarities
with the traditional Mercator projection, some notable
differences exist. In this section we provide a technical
introduction to Web Mercator and its applicability for
digital mapping. We also discuss in more detail the differ-
ences, benefits, and problems with Web Mercator versus
Mercator.
a mathematical look at mercator versus web mercator
We follow Snyder (1987) in presenting the rectangular
coordinates (map coordinates) for the Mercator projec-
tion. The coordinates based on a sphere can be found in
Equations 1 and 2.
x ¼ Rð�� � 0Þ ð1Þ
y ¼ R ln tan�
4þ ’
2
� �ð2Þ
where R is the radius of the sphere (at map scale), and j is
latitude and l is longitude (both in radians). Note that if
j is � �2
then y is infinite.
To use j in latitude and l in degrees, Equations 3 and 4
are employed:
x ¼ �Rð�0 � �00Þ
1800ð3Þ
y ¼ R ln tan 450 þ ’0
2
� �ð4Þ
Note that if j is e90� then y is infinite.
The rectangular coordinates (map coordinates) for the
Mercator projection based on an ellipsoid of revolution
(sometimes called the spheroid) can be found in Equa-
tions 5 and 6.
x ¼ að�� � 0Þ ð5Þ
y ¼ a
2ln tan
�
4þ ’
2
� � 1� e sin ’
1þ e sin ’
� �e2
" #ð6Þ
where a is the semi-major axis of the ellipsoid and e is the
ellipsoid’s eccentricity (more technically, its first eccen-
tricity), defined by Equation 7.
e ¼ "
að7Þ
where " equals the linear eccentricity and is calculated by
Equation 8.
" ¼ffiffiffiffiffiffiffiffiffiffiffiffiffiffiffia2 � b2p
ð8Þ
where b equals the semi-minor axis of the ellipsoid.
With respect to how Mercator and Web Mercator differ,
basically Web Mercator is just a special case of Mercator
on a sphere (with radius 6,378,137.0 m) and projected
from latitude and longitude coordinates from the World
Geodetic System 1984 (WGS 84) ellipsoid. From the per-
spective of developing this ‘‘new’’ projection for use in
Web mapping, how did this come about? Somewhere in
the evolution of Web Mercator from Mercator, it was de-
cided to make Web Mercator the same as Mercator except
with an R (radius) that is equal to a, the semi-major axis
of the ellipsoid of revolution, as opposed to a nominal R
Sarah E. Battersby et al.
86 Cartographica 49:2, 2014, pp. 85–101 doi:10.3138/carto.49.2.2313

for the radius of Earth modelled as a sphere. Thus, in
some communities, Web Mercator is also known as
Spherical Mercator. The Spatial Reference Organization
(http://spatialreference.org) uses the term ‘‘Spherical Mer-
cator’’ and states,
Used by certain Web mapping and visualization applications.
Uses spherical development of ellipsoidal coordinates. Relative
to an ellipsoidal development errors of up to 800 meters in
position and 0.7 percent in scale may arise. It is not a recog-
nized geodetic system. (Spatial Reference Organization 2014)
Furthermore, by the current convention the value of the
Web Mercator radius is equal to the semi-major axis of
the WGS84 datum (National Imagery and Mapping Agency
2000). So why does confusion exist between Mercator
and Web Mercator? Aitchison (2011) notes that the Web
Mercator projection, as commonly used by most online
mapping systems (e.g., Google Maps, Bing Maps, and
ArcGIS Online), defines the underlying geographic co-
ordinates using WGS84 but projects them as if they were
defined on a sphere.
What is the difference in radius between the Mercator and
Web Mercator? The mean radius, R1, as defined by the
International Union of Geodesy and Geophysics (IUGG)
is as follows:
R1 ¼2a þ b
3ð9Þ
where a equals the semi-major axis of the Earth and b equals
the semi-minor axis of the Earth.
For the Earth, according to Moritz (2000), the mean radius
is equal to 6,371,008.7714 m. The Earth’s authalic (‘‘equal
area’’) radius is the radius of a hypothetical perfect sphere
which has the same surface area as the reference ellipsoid,
and further, the volumetric radius is defined as the radius
of a sphere of volume equal to the ellipsoid (equations are
available for both of these radii in Moritz 2000, 130). The
authalic mean radius is equal to 6,371,007.1810 m, and
the volumetric radius is equal to 6,371,000.7900 m. Inter-
estingly, perhaps, is the value that the commonly used
GCTP (General Cartographic Transformation Package) uses
for the sphere, which is 6,370,997.0 m (Finn and others
2012).
What this means in terms of Mercator and Web Mercator
is simply that different measurements of the Earth exist
for each of these projections used today. While historically
the Mercator projection was developed on a spherical
Earth model, subsequent implementation may be based
on either the sphere or ellipsoid. Implementations of the
Mercator projection typically rely on the best Earth model
available. Web Mercator, in contrast, always uses a spher-
ical Earth, with a radius equal to the semi-major axis of
the ellipsoid of revolution. This difference manifests itself
as a function of latitude. Further, if or when the standard
Mercator projection is used on a sphere, the value for the
radius of that sphere is important to recognize because,
as a fundamental component of functions used to calcu-
late angles and distances, different values for the radius
will provide differences in derived values for cartographic
measurements.
It is impossible to say what value of R is used by current
online mapping/Web mapping services with any certainty
because of the myriad of programs, application program-
ming interfaces (API), and individual programmer prefer-
ences available. A single value of R is not likely, but in
addition to the values mentioned in this section, two of
the more commonly used values come from Esri’s pro-
jection definition for ‘‘WGS 1984 Web Mercator’’ and
the definition of the European Petroleum Survey Group
(EPSG) 3785 (Popular Visualization Sphere). Both use
the radius value of 6,378,137.0 m, which matches the
published WGS84 ellipsoid parameters of Subirana and
others (2011).
From a cartographic and mathematical perspective, scale
factor, defined as the ratio of the scale at a particular loca-
tion and direction on a map to the stated scale of the
map, is another notable difference between Mercator and
Web Mercator. For a conformal map projection, the scale
factor at a point is undeviating in all directions. This is the
case for the Mercator projection (a conformal projection)
but it is not for Web Mercator (Lapaine and Usery 2013).
a perceptual look at mercator versus web mercator
From a purely visual perspective, at the global scale, the
difference between the two projections is impossible to
identify (Figure 1). But although the visual difference at
the global scale is not apparent, a substantial distortion
Figure 1. Mercator and Web Mercator. At this scale theshapes of the two projections appear identical.
Implications of Web Mercator and Its Use in Online Mapping
Cartographica 49:2, 2014, pp. 85–101 doi:10.3138/carto.49.2.2313 87

still exists between the two projections, up to a 50-km dif-
ference in location coordinates at the extreme north and
south latitudes (Figure 2 and Figure 3). For a global-scale
wall map, if one assumes a fairly typical world wall map
size of approximately 50 inches by 32 inches, and with a
map scale of 1:32,000,000, this would be a difference of
about 1.5 mm in location (with R ¼ a, as noted in the
last section). With this small potential difference in loca-
tion, from a perceptual standpoint Mercator and Web
Mercator projections can be considered the same.
At a global scale, identifying the difference between the
two projections with the naked eye is virtually impossible.
But as mentioned previously in the technical evaluation,
the projections have some notable mathematical differ-
ences that are still of importance when it comes to data
display and analysis.
why web mercator?
Given that cartographers and geographers have long dis-
cussed the inappropriateness of the Mercator projection
for general purpose global-scale mapping, why has the
Web Mercator variant been embraced so thoroughly by
the mapping community? Inherent issues with represent-
ing the three-dimensional irregular Earth onto two dimen-
sions continue to plague geographers and cartographers
just as they did with those from centuries past. Ideally, a
projection that is conformal, equal area, and equidistant
will be used to solve our mapping needs; however, with-
out such a perfect model of the world, sacrifices must be
made, and Web Mercator has been selected as a ‘‘good
enough’’ solution that has persevered. In some respects,
this solution may have been a convenient choice made by
someone, and the online mapping systems designed with
Web Mercator became popular enough to become the
standard to which everyone else conformed. In this section
we discuss some of the reasons why the Web Mercator
projection works well and describe where it does not.
In general, Web Mercator is a good choice for online
mapping, particularly at the global scale because, as previ-
ously explained, it simplifies the standard Mercator pro-
jection by mapping the Earth to a sphere, which allows
Figure 2. Approximate difference in northing forcoordinates between Mercator and Web Mercator.
Figure 3. Close-up look at the difference between Mercator (black) and Web Mercator (green).
Sarah E. Battersby et al.
88 Cartographica 49:2, 2014, pp. 85–101 doi:10.3138/carto.49.2.2313

for simpler (and therefore quicker) calculations; Web
Mercator also readily supports Web map service require-
ments for indexing ‘‘the world map’’ and allowing for
continuous panning and zooming to any area, at any loca-
tion, and at any scale. Note that these beneficial character-
istics are the same for other conformal, cylindrical projec-
tions, but unlike Web Mercator, these other projections
are not in general use for online mapping.
Web Mercator also has benefits because the Mercator pro-
jection is a conformal projection. Although Web Mercator
is not technically conformal (see Zinn 2010), the visual
difference between Web Mercator and Mercator is non-
existent, and for most general purpose mapping the distor-
tions to local angles are minimal. This distinction between
the two projections is most important for large-scale
mapping. As a cylindrical map, the Mercator projection
has the property that north is always the same direction
anywhere on the map, a characteristic that is not pre-
served on non-cylindrical map projections. For online
mapping these properties of maintaining a north-up ori-
entation and (close to) conformality allow us to imple-
ment seamless panning and zooming using a single pro-
jection (Strebe 2009). While equal-area projections are
often suggested for global-scale thematic mapping, this is
impractical for Web maps because angular distortion
would vary across the location or the projection would
have to be recalculated on the fly based on the zoom/pan
location.
So how important is the conformal/‘‘not conformal’’ issue
to online mapping? The essence is the point that we
mentioned about Web Mercator using a spherical Earth
model with ellipsoidal coordinates. To some this concept
is apples and oranges, whereas to others it is oranges and
tangerines (shades of the same fruit) – meaning the differ-
ence is either important or not depending on the use and
the user. So the ‘‘well-informed user’’ becomes a more im-
portant participant. For a well-informed user who under-
stands the difference between the projections, he/she can
assess the importance for the task at hand. But for users
who are unaware that a difference even exists, they cannot
critically assess the accuracy and validity of the mapped
data. The conformal/‘‘not conformal’’ point is, at its heart,
a cartographic versus geodetic issue. Professionals in these
realms understand the issues of each projection; however,
for the non-professionals designing Web maps and for the
end users interpreting the maps, understanding or even
being aware of these issues can present a major challenge.
Zinn (personal communication, 15–16 March 2012) opines
that ‘‘the argument for the Web Mercator is that it’s suitable
for the web. I agree. My argument against the Web Mer-
cator is that it’s become a bona fide projection in GIS
where it can do harm in the hands of the uninformed.’’
One should note that Web Mercator is not computation-
ally faster than Mercator if using Mercator (spherical)
with a nominal radius; it is only faster than Mercator
on the ellipsoid. In other words, computationally faster
means latitude and longitude are used from the ellipsoid,
but instead of the ellipsoidal equations, the spherical
equations are used, because this computation is faster. If
the ellipsoidal equations are used, the electrical costs (for
an enterprise, for example) could be very high (Strebe
2009 suggests that this calculation would be millions of
dollars per year), with associated environmental issues,
not to mention the ever-present issues and concerns asso-
ciated with compatibility and interoperability with the
‘‘mashup’’ community (mashup maps combine a user’s
data and existing Web-based maps to create a new map
application or display). Furthermore, Strebe (personal
communication, 15–16 March 2012) contends, ‘‘We’ve
always had a ‘Web Mercator’ and a ‘Web-any-thing-
else’ projection. Small-scale projections assume a sphere
[. . .] When a small-scale map goes into preparation,
nobody bothers to transform the ellipsoidal coordinates
to spherical-datum coordinates before projecting to the
sphere because the difference would be imperceptible
[. . .] [Google and the like] represent (perhaps) the first
widespread use of the spherical Mercator for large scale
maps.’’
As discussed in more detail later, substantial issues related
to the use of Web Mercator must be addressed, even if it
does express a notable benefit for online mapping pur-
poses. One of the most important issues arises when the
map is ‘‘zoomed’’ to a large-scale mapping of a local area
and calculations are made from that scale rendering (Zinn,
personal communication, 15–16 March 2012).
A History of Web Mercator
In this section we discuss the transition to Web Mercator
for Web mapping. We first provide a short overview of
map projection choices for navigational Web map appli-
cations in the last few decades (mid-1990s to present)
and then discuss in more detail justifications for Web
Mercator as a solution to several Web mapping problems
that arose as Web maps transitioned from primarily local-
scale mapping solutions to more global-scale interactive
maps.
the early years: local-scale computer-based mapping
In exploring the history of Web Mercator, we initially the-
orized that the projection (or another Mercator variant)
may have been used as early as the 1980s with the distri-
bution of CD-ROM or other computerized pan/zoomable
commercial maps. This hypothesis seemed plausible be-
cause of the benefit of a projection that was always
north-up, which eliminates issues of north moving as the
user panned around the map. Granted, other options
would provide the same characteristic (e.g., an equi-
rectangular projection); however, we hypothesized that
Implications of Web Mercator and Its Use in Online Mapping
Cartographica 49:2, 2014, pp. 85–101 doi:10.3138/carto.49.2.2313 89

the added benefit of Mercator’s conformality would have
been of interest because of an early focus on local-scale
mapping (e.g., in Microsoft Streets, Delorme’s Simply
Streets, etc.).
We evaluated the Microsoft Streets ’98 (released in 1998)
and Delorme Simply Streets (released in 1997) software
packages to gain some insight on early automated map-
ping software and the projection used. At this time (late
1990s), apparently, no clear standard or preference existed
for projection or implementation of interactivity for pan-
ning and zooming. So in retrospect, likely during product
design for each software package, the cartographic team
would simply fit the solution to the problem.
For Microsoft Streets ’98, the projection used was clearly
not Mercator based and, in fact, was not even a cylindrical
projection – which is surprising since cylindrical pro-
jections are generally better when the area needs to be
divided into regular-sized tiles. Likely the projection used
is either Lambert Conformal Conic or Albers Equal Area
(Figure 4), as these projections are a more traditional
cartographic choice than a Mercator-related projection
for mapping the entire US region. Additionally, the Micro-
soft Streets ’98 system did not rely on tiling but instead ap-
pears to have used one large graphic for the entire mapped
area (US-focused) and rotated the graphic to north-up as
the user panned around the map using slippy-map func-
tionality, which is the ability to dynamically pan the map
by grabbing and sliding it in any direction (Figure 5). This
ability eliminated the need for a cylindrical projection that
maintained a constant north-up perspective.
On the other hand, the Delorme Simply Streets 1997
product appears to use multiple projections. At the maxi-
mum extent (the conterminous United States), the main
map appears to be in a Mercator projection while the
overview map is an equirectangular projection (Figure 6).
Figure 4. Microsoft Streets ’98 zoomed to the smallest scale available.
Figure 5. As the user pans around the map in MicrosoftStreets ’98, the map rotates to maintain a north-up per-spective. In this graphic, note the rotation of WashingtonState compared to the angle shown in Figure 4.
Sarah E. Battersby et al.
90 Cartographica 49:2, 2014, pp. 85–101 doi:10.3138/carto.49.2.2313

Figure 6. Delorme Simply Streets USA, showing the main window (top) in a Mercator projection and the overviewwindow (bottom) suggesting an equirectangular projection.
Implications of Web Mercator and Its Use in Online Mapping
Cartographica 49:2, 2014, pp. 85–101 doi:10.3138/carto.49.2.2313 91

But when the user pans in on the main map, the pro-
jection changes, perhaps suggesting some projection of
vector graphics on the fly – note the differences in the
appearance of the state of Alaska shown in Figure 7.
Though Delorme Simply Streets 1997 is navigated using
an interactive compass rather than a slippy-map interface,
insufficient evidence exists to suggest that a tile-based
system was used.
the modern era: web-based mapping
As navigation programs moved from an era of being
strictly local computer–based to an era where it was more
feasible to distribute navigation products in a Web-based
format, there was also a (slow) shift in the design to en-
hance the maps to meet the expectations of a wide range
of users with a wide range of mapping interests. Although
it is hard to say exactly when and where the Web Mer-
cator projection originated, the popularity of its use de-
finitely seems tied to the era when Google Maps was
introduced (2005). Web Mercator has now been readily
adopted by Google Maps, Microsoft Bing Maps, Yahoo
Maps, Esri’s ArcGIS Online, OpenStreetMap, and The Na-
tional Map of the US Geological Survey and therefore has
become the de facto standard for online maps.
the road to web mercator
In the early years of Web mapping (e.g., 1996 with the
introduction of MapQuest), just as can be seen with the
older CD-ROM-based systems, neither Mercator nor Web
Mercator appeared to have been the single projection of
choice. Although one cannot go back in time to explore
the older Web map implementations of the mid-1990s,
sufficient archival material exists to explore the basic
structure of the Web maps, including the map projection
used. We should note that while several Web mapping sites
were available, MapQuest has a fairly well-documented
history from the mid-1990s, so we have emphasized Map-
Quest in our discussion of the transition in map projec-
tions – this is not to imply that MapQuest was in some
way superior or that the choices for that one mapping
option are reflective of all of the mapping sites.
In thinking about appropriateness of projections for Web
maps, consider the importance of the initial purpose for
which these maps were designed – finding locations and
directions for relatively small areas (typically city to coun-
try scale). For example, early versions (late 1990s) of the
MapQuest site restricted zooming to a scale no smaller
than ‘‘National’’ (Figure 8). While we were unable to find
examples of these early versions of the MapQuest site
zoomed out to this scale, a slightly more modern version
of the site (Figure 9; approximately 2005) lists ‘‘Country’’
as the smallest scale and shows a little more than a conti-
nental view. In this period of the mid-2000s, MapQuest
was still based on an equirectangular projection (Map-
Quest 2012). This equirectangular projection would allow
for the relatively easy creation of a tiling system to cover
a mapped area from the local to the global scale, as Map-
Quest had seemingly implemented for its display.
The switch from equirectangular projections, which were
just as suited for global-scale tiling systems, seems to be
tied to the introduction of Google Maps in 2005. In
2003, Lars and Jens Rasmussen, with Australians Noel
Gordon and Stephen Ma, co-founded Where 2 Tech-
nologies, a mapping-related start-up in Sydney, Australia.
Their mapping program, which became Google Maps,
Figure 7. At the same level of zoom, as the map is panned, Alaska drastically changes in appearance in Delorme SimplyStreets USA.
Sarah E. Battersby et al.
92 Cartographica 49:2, 2014, pp. 85–101 doi:10.3138/carto.49.2.2313
was first planned to be downloaded by users. Where 2
Technologies subsequently pitched the scheme for a
purely Web-based product to Google management, shift-
ing the method of distribution (CNET 2005; Kiss 2009).
Where 2 Technologies was procured by Google in October
2004 to produce the free, browser-based software Google
Maps (Taylor 2005). With this switch to browser-based
Google Maps, which provided an easy interface for global-
scale mapping – including the now common slippy-map
interface for panning – there was a larger adoption of the
Web Mercator projection for other Web maps.
The shift to the Web Mercator projection is likely tied to
the recording of EPSG:90913 in 2007 (OSM 2012), which
formalized the choice of projection made by Lars and Jens
Rasmussen. This temporary EPSG code was created to
define the Spherical Mercator projection being used in
Google Maps (see OSGEO 2013). The International Pro-
ducers of Oil and Gas (OGP), formerly the EPSG, main-
tains and publishes sets of parameters for coordinate
reference systems. This publication provides a standard
definition of projections according to EPSG codes, a
now common reference for map projections. Currently
EPSG:3857 is the code assigned to WGS84 Web Mercator
(Auxiliary Sphere), sometimes incorrectly referred to as
‘‘Google Mercator’’ because of its association with Google
Maps. After the formalization of the EPSG for Web Mer-
cator, several other online mapping systems switched to
Web Mercator. For instance, MapQuest switched to Web
Mercator in 2011, to ‘‘be more user-friendly, especially for
those dealing with multiple data sources and finding that
the standard for online mapping has increasingly shifted
towards the more popular Mercator Projection’’ (Map-
Quest 2011).
Concerns with Web Mercator
For better or worse, Web Mercator is now an accepted
standard for online mapping and has been embraced
widely by online map creators and developers. In this
section we examine issues surrounding this adoption and
discuss the potential implications of the projection from
technical/mathematical, cognitive, educational, and design
perspectives.
Figure 8. MapQuest, unknown date – though this appears to be running in Netscape and Windows 95, so we estimatemid- to late 1990s. Note the scale bar’s smallest scale for zoom is ‘‘National.’’ (Image courtesy of Computer HistoryMuseum; http://www.computerhistory.org/revolution/the-web/20/392/2345.)
Implications of Web Mercator and Its Use in Online Mapping
Cartographica 49:2, 2014, pp. 85–101 doi:10.3138/carto.49.2.2313 93

technical issues
Though Web Mercator has become a readily adopted
standard for online maps, it is still less than ideal in
many instances, especially when considering smaller than
global areas and, particularly, high-latitude regions. Un-
like Mercator, Web Mercator does not preserve the shape
and relative angles at each point, and if scale factor at a
point needs to be calculated with a high level of accuracy,
then the computational efficiency of Web Mercator is
slower than both spherical and ellipsoidal Mercator (Zinn
2010).
The effects of choosing Web Mercator as the projection
for online mapping can be empirically seen when running
the associated calculations with tile-caching schemes.
Early Internet maps habitually used a single large raster
file for every zoom level, which was re-rendered with
every change to zoom level or direction. The introduction
of tile caching for online maps in the first decade of the
twenty-first century allowed for a better and faster user
experience, as the single image files were carved up into
smaller tiles. Although the choice of projection does not
affect prime parameters such as the degrees per pixel
(DPP), map width, ground resolution, or map scale, it
does affect the kilometre per degree (km/deg) measure-
ments. The km/deg measurements can vary considerably
from actual ground km/deg values, based on the choice
of projection (expanded upon below). The ground km/
deg measurement is a function of the arc length of the
parallel (Equation 10; Torge 2001).
dL ¼ N cos �d� ð10Þ
where dL equals arc length of the parallel, N equals the
radius of curvature in the prime vertical, f equals the
latitude at the parallel in question, and dl equals the dif-
ference in two longitudes. The radius of curvature in the
prime vertical is calculated by Equation 11.
N ¼ a
ð1� e2 sin2 �Þ12
ð11Þ
When calculated on a sphere, Equation 10 becomes Equa-
tion 12 because N equals R, the radius of the sphere.
Figure 9. MapQuest, circa 2005. Note that the map did not zoom out much past continental scale and that the projec-tion was clearly not Mercator based. (Source: http://money.howstuffworks.com/mapquest3.htm)
Sarah E. Battersby et al.
94 Cartographica 49:2, 2014, pp. 85–101 doi:10.3138/carto.49.2.2313
dL ¼ R cos �d� ð12Þ
Normally, parameters for a specifically defined ellipsoid
are given in terms of the semi-major axis, a, and the flat-
tening factor (sometimes referred to as the geometrical
flattening), f. To calculate dL from the above equations,
we need to calculate b in terms of f as follows:
f ¼ a � b
a
And, thus, we can find b as follows:
b ¼ að1� f Þ ð14Þ
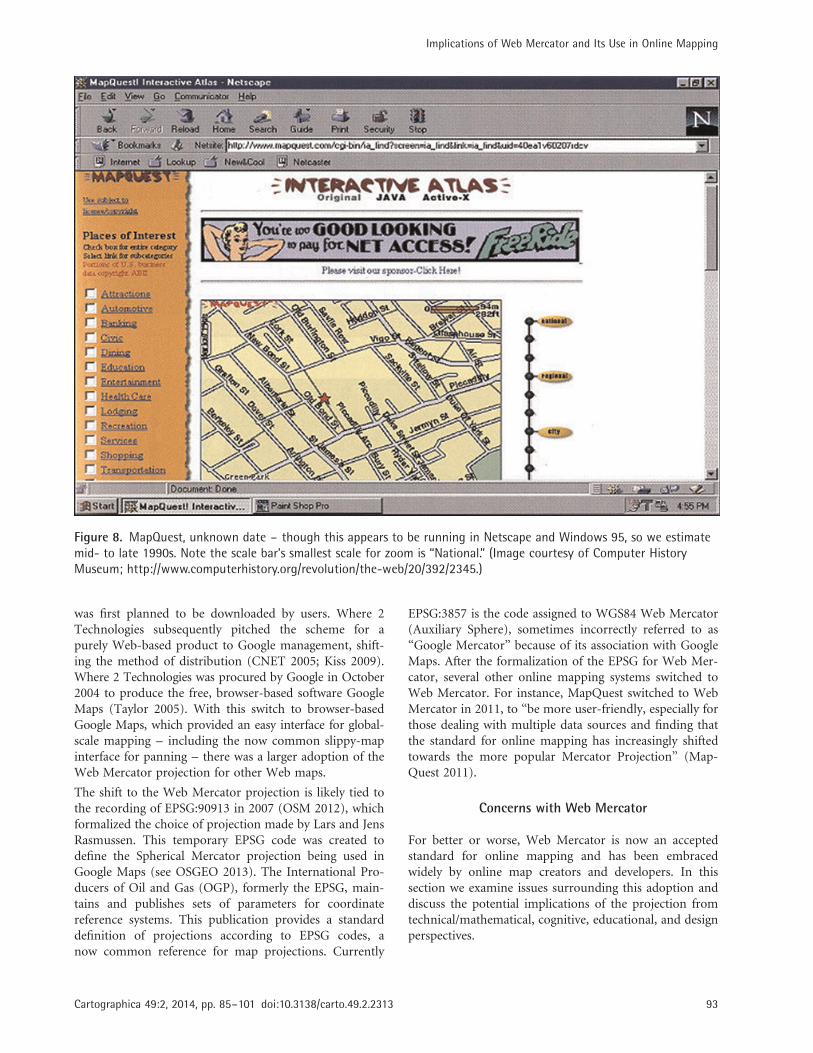
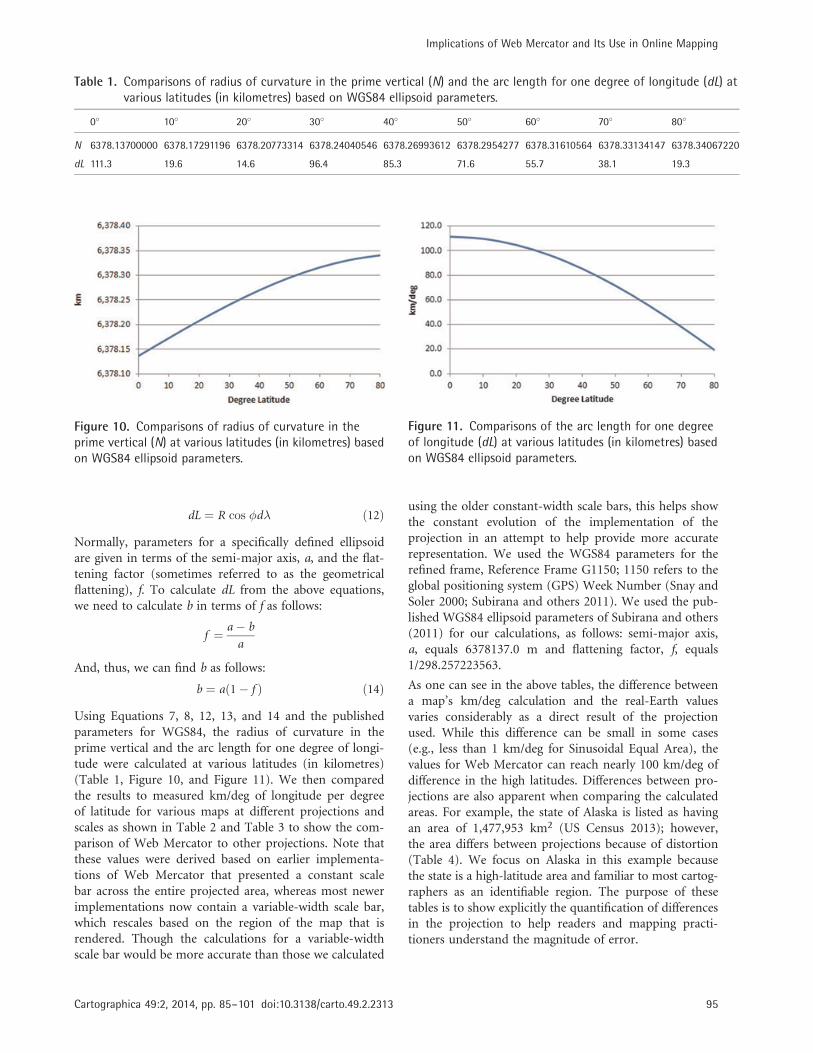
Using Equations 7, 8, 12, 13, and 14 and the published
parameters for WGS84, the radius of curvature in the
prime vertical and the arc length for one degree of longi-
tude were calculated at various latitudes (in kilometres)
(Table 1, Figure 10, and Figure 11). We then compared
the results to measured km/deg of longitude per degree
of latitude for various maps at different projections and
scales as shown in Table 2 and Table 3 to show the com-
parison of Web Mercator to other projections. Note that
these values were derived based on earlier implementa-
tions of Web Mercator that presented a constant scale
bar across the entire projected area, whereas most newer
implementations now contain a variable-width scale bar,
which rescales based on the region of the map that is
rendered. Though the calculations for a variable-width
scale bar would be more accurate than those we calculated
using the older constant-width scale bars, this helps show
the constant evolution of the implementation of the
projection in an attempt to help provide more accurate
representation. We used the WGS84 parameters for the
refined frame, Reference Frame G1150; 1150 refers to the
global positioning system (GPS) Week Number (Snay and
Soler 2000; Subirana and others 2011). We used the pub-
lished WGS84 ellipsoid parameters of Subirana and others
(2011) for our calculations, as follows: semi-major axis,
a, equals 6378137.0 m and flattening factor, f, equals
1/298.257223563.
As one can see in the above tables, the difference between
a map’s km/deg calculation and the real-Earth values
varies considerably as a direct result of the projection
used. While this difference can be small in some cases
(e.g., less than 1 km/deg for Sinusoidal Equal Area), the
values for Web Mercator can reach nearly 100 km/deg of
difference in the high latitudes. Differences between pro-
jections are also apparent when comparing the calculated
areas. For example, the state of Alaska is listed as having
an area of 1,477,953 km2 (US Census 2013); however,
the area differs between projections because of distortion
(Table 4). We focus on Alaska in this example because
the state is a high-latitude area and familiar to most cartog-
raphers as an identifiable region. The purpose of these
tables is to show explicitly the quantification of differences
in the projection to help readers and mapping practi-
tioners understand the magnitude of error.
Table 1. Comparisons of radius of curvature in the prime vertical (N) and the arc length for one degree of longitude (dL) atvarious latitudes (in kilometres) based on WGS84 ellipsoid parameters.
0� 10� 20� 30� 40� 50� 60� 70� 80�
N 6378.13700000 6378.17291196 6378.20773314 6378.24040546 6378.26993612 6378.2954277 6378.31610564 6378.33134147 6378.34067220
dL 111.3 19.6 14.6 96.4 85.3 71.6 55.7 38.1 19.3
Figure 10. Comparisons of radius of curvature in theprime vertical (N) at various latitudes (in kilometres) basedon WGS84 ellipsoid parameters.
Figure 11. Comparisons of the arc length for one degreeof longitude (dL) at various latitudes (in kilometres) basedon WGS84 ellipsoid parameters.
Implications of Web Mercator and Its Use in Online Mapping
Cartographica 49:2, 2014, pp. 85–101 doi:10.3138/carto.49.2.2313 95
Table 2. Comparisons of the arc length for one degree of longitude (dL) (in km) at 10� increments for five differentglobal map projection/scale combinations based on WGS84 ellipsoid parameters*
Degree of latitude 0� 10� 20� 30� 40� 50� 60� 70� 80�
Earth: km/deg latitude 111.3 19.6 14.6 96.4 85.3 71.6 55.7 38.1 19.3Plate Carree 1:50,000,000 US map
Map measurement: cm per 5� long 1.2 1.2 1.2 1.2 1.2 1.2km/deg 120 120 120 120 120 120Delta �15.4 �23.6 �34.7 �48.4 �64.3 �81.9
Plate Carree 1:200,000,000 world mapMap measurement: cm per 10� long 0.6 0.6 0.6 0.6 0.6 0.6 0.6 0.6 0.6
km/deg 120 120 120 120 120 120 120 120 120Delta �8.7 �10.4 �15.4 �23.6 �34.7 �48.4 �64.3 �81.9 �100.7
Mercator scale variableMap measurement: cm per 15� long 5.55 5.55 5.55 5.55 5.55 5.55 5.55 5.55 5.55
cm per 100 statute miles 0.5 0.5 0.55 0.6 0.7 0.8 1.00 1.5 3.1km/deg 119.1 119.1 108.3 99.2 85.1 74.4 59.5 39.7 19.2Delta �7.8 �9.5 �3.7 �2.8 0.2 �2.9 �3.9 �1.6 0.1
Web Mercator 1:70,000,000 US mapMap measurement: cm per 5� long 0.8 0.8 0.8 0.8 0.8 0.8
km/deg 112 112 112 112 112 112Delta �7.4 �15.6 �26.7 �40.4 �56.3 �73.9
Web Mercator 1:230,000,000 world mapMap measurement: cm per 10� long 0.5 0.5 0.5 0.5 0.5 0.5 0.5 0.5 0.5
km/deg 115 115 115 115 115 115 115 115 115Delta �3.7 �5.4 �10.4 �18.6 �29.7 �43.4 �59.3 �76.9 �95.7
* The Web Mercator entries are based on calculations from initial implementations (constant scale) of the projection. Also, while wehave examined comparisons between numerous projections, only cylindrical projections are shown, for simplicity’s sake.
Table 3. Comparisons of the arc length for one degree of longitude (dL) and various map projections for Alaska atvarious latitudes (in kilometres) based on WGS84 ellipsoid parameters. (Note: the Web Mercator entry is basedon calculations from initial implementations (constant scale) of the projection.)
50� 60� 70�
Earth: km/deg latitude 71.6 55.7 38.1Albers 1:15,000,000 Alaska map
Map measurement: cm per 10� long 4.8 3.7 2.6km/deg 72.0 55.5 39.0Delta �0.4 0.2 �0.9
Plate Carree 1:20,000,000 Alaska mapMap measurement: cm per 5� long 2.9 2.9 2.9
km/deg 116 116 116Delta �44.4 �60.3 �77.9
Web Mercator 1:50,000,000 Alaska mapMap measurement cm per 5� long 1.15 1.15 1.15
km/deg 115 115 115Delta �43.4 �59.3 �76.9
Sarah E. Battersby et al.
96 Cartographica 49:2, 2014, pp. 85–101 doi:10.3138/carto.49.2.2313

To summarize the above equations and calculations, the
technical issues with Web Mercator can be seen in the
km/deg measurements and area measurements. In addi-
tion, these issues increase in severity as one moves closer
to the poles. These equations explain in detail the techni-
cal issues with distortion in Web Mercator and compare
them to distortion in several other common projections
for reference. Because distortion is a necessary part of
map projections, the calculations presented are relevant
to any measurements taken in base maps or for calcula-
tions in thematic maps. Map projection distortion affects
every measurement on the map, and readers and designers
need to be aware of these technical details.
cognitive issues
[W]e strongly urge book and map publishers, the
media and government agencies to cease using
rectangular world maps for general purposes or artistic
displays. Such maps promote serious, erroneous
conceptions by severely distorting large sections of the
world, by showing the round Earth as having straight
edges and sharp corners, by representing most distances
and direct routes incorrectly, and by portraying the
circular coordinate system as a squared grid. The
most widely displayed rectangular world map is the
Mercator.
—Resolution (1989)
Numerous suggestions have been made that map projec-
tions have substantial influence on the shape and struc-
ture of cognitive maps, dating back (at least) to the early
twentieth century with G.J. Morrison’s warning that
‘‘people’s ideas of geography are not founded on actual
facts but on Mercator’s map’’ (quoted in Monmonier
1995, 21). The belief that an individual’s general knowl-
edge of geography and cognitive map are based on famil-
iarity with the Mercator projection has been a pervasive
theme in geographic literature (e.g., Robinson’s suggestion
that people have been ‘‘brainwashed’’ by the Mercator pro-
jection; Robinson 1990, 103). By the late 1980s, the dis-
cussion surrounding the Mercator projection had become
heated enough for seven North American cartographic
societies to adopt a resolution against rectangular map
projections – with the Mercator projection the only one
specifically called out by name.
Though suggestions about the impact of distortions from
map projections, often specifically focused on Mercator,
have been common in the literature, relatively little em-
pirical research can provide a concrete confirmation of
the relationship between the Mercator projection and
related distortions in peoples’ cognitive maps. In a series
of sketch mapping studies, Saarinen (Saarinen and others
1996; Saarinen 1999) and others (e.g., Chiodo 1997) have
suggested a measurable ‘‘Mercator Effect’’ and have dem-
onstrated that potential Mercator-like artefacts (e.g., size
of countries and continents) could be found in children’s
sketch maps of the world (Saarinen 1999). But these
studies provided little to no direct quantitative compari-
son of the distortions in the sketch maps to the Mercator
projection – though some similarities between the sketch
properties and the Mercator projection were clearly visible.
In further human subject research, Battersby and Montello
(2009) have examined memory-based estimates of land
areas for regions around the world. In this study, little
evidence was found of an overwhelming Mercator influ-
ence on the participants’ cognitive maps – implying that
the feared Mercator influence was less of an issue than
previously suggested. Perhaps this lack of relationship is
due to better education about the distortion patterns in
the projection and the ability to compensate for it –
though Battersby (2009) sheds further light on the chal-
lenges of compensating for perceived distortion which
makes this seem somewhat unlikely. Perhaps this is simply
a sign that at the time at which the data were collected,
the participants in the study were not of an age where
they had been overly exposed to the Mercator projection
and thus had limited opportunity for it to overly influence
their cognitive map. This might make sense and help
explain potential contradiction in the stated impacts of
the Mercator projection between Battersby and Montello’s
(2009) work suggesting no substantial Mercator influence
and earlier studies by Saarinen and others (1996) suggest-
ing a Mercator influence. Saarinen and others (1996) and
Saarinen (1999) conducted research in the 1990s, a time
when the Mercator projection was more likely to be in
use as a classroom reference.
As Web maps have become more prevalent as general
purpose references, likely the most widely displayed cylin-
drical world map is now the Web Mercator. As such, it
seems fair that cartographers hearken back to the resolu-
tion from 1989 and work to understand better the poten-
tial impacts that the prevalence of the map projection may
have on our perception of global-scale spaces.
Table 4. Comparisons of area of Alaska for differentprojections.
Projection Area of Alaska (km2)
Albers Equal Area Conic 1,517,411.29Alaska Albers 1,517,411.29Sinusoidal 1,517,422.58Lambert Conformal Conic 1,631,416.79Lambert Azimuthal Equal Area 1,517,412.27Plate Carree 3,485,157.46Mercator 8,181,068.03Web Mercator 8,191,239.76
Implications of Web Mercator and Its Use in Online Mapping
Cartographica 49:2, 2014, pp. 85–101 doi:10.3138/carto.49.2.2313 97

educational issues
Although the Mercator (and Web Mercator) projections
present positive characteristics when used for taking bear-
ings between locations, for most educational purposes this
is not a common task for evaluation of global-scale spatial
patterns. More likely, global-scale maps are being used for
evaluating distance- and area-based spatial relationships –
characteristics that are not appropriately represented for
many locations and attributes in the Mercator projection
(as discussed in Vujakovic 2002 and MacEachren 1995).
For reference mapping in atlases, Monmonier (1995) reports
several (admittedly non-systematic) studies in Britain and
the United States which indicated that the Mercator pro-
jection was nowhere to be found. Regardless, Monmonier
also notes that ‘‘the Mercator projection was alive and
well, if not thriving, among wall maps’’ (Monmonier 1995,
21). Since 1995, our own (admittedly non-systematic)
evaluation of classroom wall maps indicates that the
Mercator projection has largely fallen out of favour in
this context as well, with compromise projections such as
‘‘the visually accurate Robinson projection’’ (as Rand
McNally describes one of its world map combinations),
Winkel Tripel, and Gall Stereographic commonly found
in catalogues of global-scale wall maps for educational
use. Though Mercator projection maps seem to be less
common, we were still able to find a few instances of
Mercator projection maps for purchase from educational
map resellers.
While Mercator-based wall maps seem to have fallen out
of favour as classroom references, the Mercator projection
has still managed to maintain a notable place of promi-
nence in the classroom. Perhaps contrary to the desire to
minimize familiarity with the Mercator projection as a
representation for global-scale space, it appears to have
become a favourite example when teaching about map
projections. In a cursory review of materials from seven
cartography, GIS, and human geography textbooks that
include sections focused on map projections and distor-
tion, we found that the only projection common to all of
the textbooks was the Mercator projection.
Though Mercator does provide a good example for ex-
treme distortion of areas at the global scale, the impact of
emphasizing the projection and the two most distinctively
exaggerated regions (Greenland and Antarctica) may have
had the unintentional effect of enforcing the Mercator
distortion pattern as a generic map projection characteris-
tic. For instance, Battersby and Kessler (2012) examined
cues used to identify distortion in six map projections
(two compromise, two conformal, and two equal area)
and found notable patterns of reliance on Mercator-related
cues (e.g., Antarctica, Greenland, and general ‘‘polar re-
gions’’ frequently listed as cues for areal distortion) for
almost all of the projections examined.
design considerations
A common theme in cartography lectures and textbooks
is that map projections should be selected based on their
appropriateness for the user’s data, the geographic area
being mapped, and the types of measurements that a
reader might need to make (Snyder 1987; Robinson and
others 1995; Usery and others 2003; Slocum and others
2009; Finn and others 2013). With the rigidity of the
online mapping platform, where tiled base maps are
typically provided, the average designer does not have
any option other than Web Mercator. The designer is
thus required to compromise on – or, in the case of the
designers who are not aware of the issues surrounding
map projections, flat-out ignore – the guidelines suggested
for appropriate projection selection. If this projection selec-
tion is considered with respect to the map communication
process, there are two primary areas of concern – the
information source/transmitter (the designer and his/her
knowledge of projection distortion) and the receiver (the
map reader and his/her knowledge of the projection dis-
tortion).
With respect to the understanding of the map designer,
there is no choice of projection, so the design decisions
are mostly restricted to whether or not the designer under-
stands the implication of map projection distortion so
that the map design and implementation can compensate
for it. For instance, does the designer understand that
while drawing (or coding) a straight line to connect two
locations on the map is easy, this action does not imply
the shortest path? Or that any map feature defined in size
by pixels will not be of equal area in different locations on
the map? Fortunately, some mapping APIs now accom-
modate for Web Mercator–related distortion, though this
accommodation requires that all features added to a map
are defined appropriately in the API and that the map
designer does not rely on graphic features that would
not self-modify as the map scale changes (e.g., creating
reusable circular buffer graphics of a set pixel diameter).
In addition, from a design standpoint, a cartographer will
typically select a projection based on what is appropriate
for the map purpose and geographic extent. Unfortu-
nately, with Web maps in their current implementations,
limited options are available to select custom projections.1
Thus, the projection used (Web Mercator) is likely to be
considered suboptimal for the display of data. For in-
stance, as Dent and others (2009, 50) state, ‘‘the property
of equivalency is often the overriding concern in thematic
cartography.’’ This sentiment is echoed across other cartog-
raphy textbooks particularly for global-scale choropleth
maps (e.g., Slocum and others 2009) – and equivalency
is something the Web Mercator does not provide. Recog-
nizing that this idea of equivalency in map projections has
been noted as an ‘‘overriding concern in thematic cartog-
raphy,’’ it is interesting how quickly the idea of equivalent
Sarah E. Battersby et al.
98 Cartographica 49:2, 2014, pp. 85–101 doi:10.3138/carto.49.2.2313

projections for thematic mapping has been pushed aside
in favour of easy tools for producing interactive Web
map mashups.
With respect to the map reader, there are additional issues
to consider – partly because the map reader has no say in
how the information on the map is presented (even if he
or she can turn layers on/off or contribute in a Web 2.0
situation, the overall look and functionality has already
been determined by the designer); the reader is left with
the interpretation task. In this interpretation task, the map
may become ‘‘more real than experience,’’ as suggested
in Egenhofer and Mark’s (1995, 8) ‘‘Naıve Geography.’’
When a person is evaluating maps that present distorted
areas, the ability to correctly interpret spatial patterns is
hindered; the spatial relationships are incorrect, so how
can the interpretation be correct? The projection issue is
somewhat forgivable for relatively large-scale mapping
(such as state/small country), but only for equatorial re-
gions where the distortion is minimized. For large-scale
mapping, the distortion in non-equatorial regions can be
substantial and can easily mislead the reader. Even though
across a single large-scale map the distortion will be
relatively consistent within the map, comparisons to any
other area may be misleading because of the variance
in scale between the maps – unless they are at the same
latitude.
Conclusion and Future Research Directions
In this paper we have discussed numerous issues surround-
ing the use of the Web Mercator projection for general
purpose mapping. While there are benefits to the use of
the projection, there are also substantial limitations that
should be considered by map designers and users. In
terms of furthering the state of Web map development
and use, several research questions can be addressed:
f A possible risk of democratizing map creation and
allowing users to make their own mashup is that
more inappropriately designed maps can be dis-
tributed farther and faster, as the projection of the
base maps is likely going to be inappropriate for
most purposes. How do we address this issue? How
do we train designers who may have little to no train-
ing in map projections to address issues of distortion
in their maps? How do we design Web maps that are
‘‘smarter’’ and can help guide designers in successful
compensation for distortions in the projection? Al-
though the current need for education is with re-
spect to distortion patterns in Web Mercator, these
questions are relevant for whatever other projections
may become available. All projections present distor-
tion, and the type and pattern of that distortion will
vary from projection to projection, so acknowledge-
ment of the distortion and design with a critical eye
to the distortion is important for clear and appro-
priate map communication.
f Can better projections be used? Several tools (e.g.,
Finn and others 2004) and sets of suggested guide-
lines exist for selecting appropriate projections for
large- and small-scale mapping. Can these projec-
tions be incorporated into the base Web maps to
minimize distortion in a seamless way, and is this
computationally feasible for systems where millions
or billions of maps are served every day? For in-
stance, can we incorporate base maps that respond
to user panning and zooming as demonstrated in
Jenny’s (2012) adaptive composite map projections?
f Is the return to a Mercator-type projection going to
bring back the feared Mercator cognitive map that
was discussed heavily in the 1980s and led to the
resolution against ‘‘rectangular’’ map projections for
global-scale data?
f In many Web maps, we provide options for satellite
views and map views, as well as overlays of traffic,
weather, and other themes – would it help if map
readers were provided with distortion views or over-
lays to clarify distortions of values such as area and
distances?
f Is a better ‘‘replacement’’ map projection available
for online mapping that keeps the desired traits of
Web Mercator while, at the same time, improving
the fidelity of mensuration associated with high-
quality cartographic standards, particularly with re-
spect to large areas (large regions to continental scales)?
f Can this replacement projection for online mapping
be consistent with Web mapping tile-caching schemes
already in widespread use in the GIScience com-
munity and thus meet the larger spatial data infra-
structure and interoperability requirements?
f Can APIs using the Web Mercator be designed with
intelligence to warn the user of incorrect results
because of the projection?
The results from research addressing the above questions,
as well as many other related topics, will aid in the de-
velopment of better, more effective, and less distorted
general purpose Web maps.
Acknowledgements
The authors thank daan Strebe for his valuable comments
and conversations as we were preparing this paper. Any
use of trade, firm, or product names in this publication is
for descriptive purposes only and does not imply endorse-
ment by the US government.
Note
1 We note that we have seen examples of polar projections inArcGIS Online, so perhaps there will be more opportunity tocustomize projection selection in the future. Granted, thiswill require that the map designers feel comfortable select-ing an appropriate projection.
Implications of Web Mercator and Its Use in Online Mapping
Cartographica 49:2, 2014, pp. 85–101 doi:10.3138/carto.49.2.2313 99

References
Aitchison, A. 2011. The Google Maps/Bing Maps SphericalMercator Projection. Available at http://alastaira.wordpress.com/2011/01/23/the-google-maps-bing-maps-spherical-mercator-projection/
Battersby, S.E. 2009. ‘‘The Effect of Global-Scale Map-ProjectionKnowledge on Perceived Land Area.’’ Cartographica 44(1): 33–44.http://dx.doi.org/10.3138/carto.44.1.33
Battersby, S.E., and F.C. Kessler. 2012. ‘‘Cues for InterpretingDistortion in Map Projections.’’ Journal of Geography 111(3): 93–101. http://dx.doi.org/10.1080/00221341.2011.609895
Battersby, S.E., and D.R. Montello. 2009. ‘‘Area Estimation ofWorld Regions and the Projection of the Global-Scale CognitiveMap.’’ Annals of the Association of American Geographers 99(2):273–91. http://dx.doi.org/10.1080/00045600802683734
Chiodo, J.J. 1997. ‘‘Improving the Cognitive Development of Stu-dents’ Mental Maps of the World.’’ Journal of Geography 96(3):153–63. http://dx.doi.org/10.1080/00221349708978777
CNET. 2005. Google Mapper: Take Browsers to the Limit. Avail-able at http://news.cnet.com/Google-mapper-Take-browsers-to-the-limit/2100-1038_3-5808658.html
Dent, B.D., J.S. Torguson, and T.W. Hodler. 2009. Cartography:Thematic Map Design, 6th ed. New York: McGraw-Hill.
Egenhofer, M.J., and D.M. Mark. 1995. ‘‘Naıve Geography.’’ InSpatial Information Theory: A Theoretical Basis for GIS, LectureNotes in Computer Science 988, ed. A.U. Frank and W. Kuhn, 1–15. Berlin: Springer. http://dx.doi.org/10.1007/3-540-60392-1_1
Finn, M.P., D.R. Steinwand, J.R. Trent, R.A. Buehler, D. Mattli, andK.H. Yamamoto. 2012. ‘‘A Program for Handling Map Projectionsof Small Scale Geospatial Raster Data.’’ Cartographic Perspectives71: 53–67.
Finn, M.P., E.L. Usery, S.T. Posch, and J.C. Seong. 2004. ‘‘A DecisionSupport System for Map Projections of Small Scale Data.’’ USGSScientific Investigations Report 2004–5297. Available at http://cegis.usgs.gov/projection/pdf/dss_paper_final.pdf
Finn, M.P., E.L. Usery, L. Woodard, and K.H. Yamamoto. 2013.‘‘The Logic of Selecting an Appropriate Map Projection in aDecision Support System (DSS).’’ Accepted for publication inMap Projection Choice, ed. M. Lapaine. International Carto-graphic Association.
Jenny, B. 2012. ‘‘Adaptive Composite Map Projections.’’ IEEETransactions on Visualization and Computer Graphics 18(12):2575–82. http://dx.doi.org/10.1109/TVCG.2012.192
Keuning, Johannes. 1955. ‘‘The History of Geographical Map Pro-jection until 1600.’’ Imago Mundi 12(1): 1–24. http://dx.doi.org/10.1080/03085695508592085
Kiss, Jemima. 2009. ‘‘Secrets of a Nimble Giant.’’ Guardian, 17June. Available at http://www.theguardian.com/technology/2009/jun/17/google-sergey-brin
Lapaine, M., and E.L. Usery. 2013. ‘‘Map Projections and ReferenceSystems.’’ Accepted for publication in Cartography and Geo-graphic Information, ed. B. Rystedt. International CartographicAssociation.
MacEachren, A.M. 1995. How Maps Work: Representation,Visualization, and Design. New York: Guilford.
MapQuest. 2011. ‘‘Flash Maps API: Now in Mercator!’’ Available athttp://devblog.mapquest.com/2011/03/29/flash-maps-api-now-in-mercator/
MapQuest. 2012. ‘‘Flash Maps API v7.x Migration Guide.’’ Avail-able at http://developer.mapquest.com/web/documentation/sdk/flash/migrationguide
Monmonier, M. 1995. Drawing the Line: Tales of Maps andCartocontroversy. New York: Holt.
Monmonier, M. 2004. Rhumb Lines and Map Wars: A Social His-tory of the Mercator Projection. Chicago: University of ChicagoPress. http://dx.doi.org/10.7208/chicago/9780226534329.001.0001
Moritz, H. 2000. ‘‘Geodetic Reference System 1980.’’ Journal ofGeodesy 74(1): 128–33. http://dx.doi.org/10.1007/s001900050278
National Imagery and Mapping Agency. 2000. ‘‘Department ofDefense World Geodetic System 1984: Its Definition and Rela-tionships with Local Geodetic Systems,’’ NIMA TR8350.2, 3rd ed.,Amendment 1. Washington, DC: Department of Defense.
OSGEO. 2013. ‘‘Spherical Mercator – Open Layers.’’ Available athttp://trac.osgeo.org/openlayers/wiki/SphericalMercator
OpenStreetMap [OSM]. 2012. ‘‘EPSG:3857.’’ Available at http://wiki.openstreetmap.org/wiki/EPSG:3857
American Cartographic Association, American GeographicalSociety, Association of American Geographers, Canadian Carto-graphic Association, National Council for Geographic Education,National Geographic Society, and Special Libraries Association,Geography and Map Division Resolution. 1989. ‘‘ResolutionRegarding the Use of Rectangular World Maps.’’ AmericanCartographer 16(3): 223.
Robinson, A., J.L. Morrison, P.C. Muehrcke, A.J. Kimerling, andS.C. Guptil. 1995. Elements of Cartography, 6th ed. New York:John Wiley & Sons.
Robinson, A.H. 1990. ‘‘Rectangular World Maps – No!’’ Profes-sional Geographer 42(1): 101–4. http://dx.doi.org/10.1111/j.0033-0124.1990.00101.x
Saarinen, T.F. 1999. ‘‘The Euro-Centric Nature of Mental Maps ofthe World.’’ Research in Geographic Education 1(2): 136–78.
Saarinen, T.F., M. Parton, and R. Billberg. 1996. ‘‘Relative Size ofContinents on World Sketch Maps.’’ Cartographica 33(2): 37–48.http://dx.doi.org/10.3138/F981-783N-123M-446R
Slocum, T.A., R.B. McMaster, F.C. Kessler, and H.H. Howard. 2009.Thematic Cartography and Geovisualization, 3rd ed. UpperSaddle River, NJ: Prentice Hall.
Snay, R.A., and T. Soler. 2000. ‘‘Modern Terrestrial ReferenceSystems Part 3: WGS 84 and ITRS.’’ Professional Surveyor, March.
Snyder, J.P. 1987. Map Projections – A Working Manual. Vol.1395. U.S. Geological Survey Professional Paper. Washington, DC:USGS.
Spatial Reference Organization. 2014. SR-ORG Projection 6864 –EPSG:3857. Available at http://spatialreference.org/ref/sr-org/6864/
Strebe, d. 2009. Why Mercator for the Web? Isn’t the MercatorBad? http://mapthematics.com/forums/viewto-pic.php?f=8&t=251
Sarah E. Battersby et al.
100 Cartographica 49:2, 2014, pp. 85–101 doi:10.3138/carto.49.2.2313

Subirana, J.S., J.M.J. Zornoza, and M. Hernandez-Pajares. 2011.Reference Frames in GNSS. Available at http://www.navipedia.net/index.php/Reference_Frames_in_GNSS
Taylor, B. 2005. Mapping Your Way. Available at http://google-blog.blogspot.com/2005/02/mapping-your-way.html
Torge, W. 2001. Geodesy, 3rd ed. Berlin: de Gruyter. http://dx.doi.org/10.1515/9783110879957
US Census. 2013. Alaska Quickfacts. Available at http://quick-facts.census.gov/qfd/states/02000.html
Usery, E.L., J.C. Seong, D.R. Steinwand, and M.P. Finn. 2003.
‘‘Accurate Projection of Small-Scale Raster Datasets.’’ Proceed-ings 21st International Cartographic Conference, Durban, SouthAfrica. International Cartographic Association.
Vujakovic, P. 2002. ‘‘Whatever Happened to the ‘New Cartogra-phy’? The World Map and Development Mis-Education.’’ Journalof Geography in Higher Education 26(3): 369–80. http://dx.doi.org/10.1080/0309826022000019936
Zinn, N. 2010. Web Mercator: Non-Conformal, Non-Mercator.Available at http://www.hydrometronics.com/downloads/Web%20Mercator%20-%20Non-Conformal,%20Non-Mercator%20(notes).pdf
Implications of Web Mercator and Its Use in Online Mapping
Cartographica 49:2, 2014, pp. 85–101 doi:10.3138/carto.49.2.2313 101