Implications of changes in UNFCCC GHG Inventory … of changes in UNFCCC GHG Inventory Reporting...
14
Implications of changes in UNFCCC GHG Inventory Reporting Guidelines on the Review of Second Biennial Reports Third Meeting of Lead Reviewers for the Review of Biennial Reports and National Communications of Annex I Parties 3-4 March, Bonn, Germany Nalin Srivastava Mitigation Data Analysis programme, UNFCCC secretariat
Transcript of Implications of changes in UNFCCC GHG Inventory … of changes in UNFCCC GHG Inventory Reporting...
Implications of changes in UNFCCC GHG
Inventory Reporting Guidelines on the
Review of Second Biennial Reports
Third Meeting of Lead Reviewers for the Review of Biennial Reports and National
Communications of Annex I Parties
3-4 March, Bonn, Germany
Nalin Srivastava
Mitigation Data Analysis programme, UNFCCC secretariat

Outline
GHG inventory information in BR
Significant changes in the new GHG inventory reporting guidelines (24/CP.19)
Implications of changes in the GHG inventory GLs for BR2 review

GHG Inventory Information in
Biennial Report
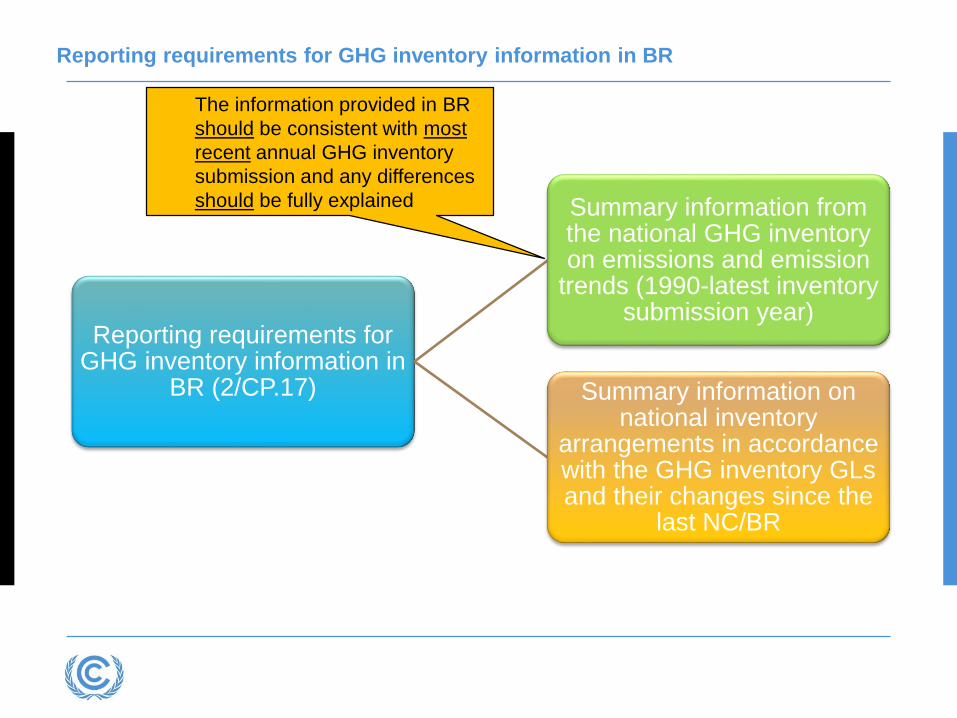
Reporting requirements for GHG inventory information in BR
Reporting requirements for GHG inventory information in
BR (2/CP.17)
Summary information from the national GHG inventory on emissions and emission
trends (1990-latest inventory submission year)
Summary information on national inventory
arrangements in accordance with the GHG inventory GLs and their changes since the
last NC/BR
The information provided in BR
should be consistent with most
recent annual GHG inventory
submission and any differences
should be fully explained
Significant Changes in the New
GHG Inventory Reporting
Guidelines (24/CP.19)

Significant changes in the new GHG inventory reporting guidelines
(Decision 24/CP.19)
New GHG inventory guidelines (24/CP.19)
National inventory
arrangements
New GHGs
New GWP values
Use of the 2006 IPCC Guidelines
-Improved methods & defaults
-New source/sink categories
-Encouragement for the use of
Wetlands Supplement
NF3, new F-gases,
indirect CO2 & N2O
GWP values
from AR4
instead of
SAR
Mandatory reporting on
national inventory
arrangements

New Global Warming Potential (GWP) values from AR4
21(SAR)
25 (AR4)
+19%
CH4
310 (SAR)
298 (AR4)
-4%
N2O
GWPs of different F-gases have changed by different percentage amounts
F-gases

Inclusion of new GHGs
“New” GHGs
Direct GHGs
NF3
New
species of F gases (IPPU sector)
Indirect GHGs
CO2 (to be included in national totals if reported)
N2O (not to be included in national
totals)
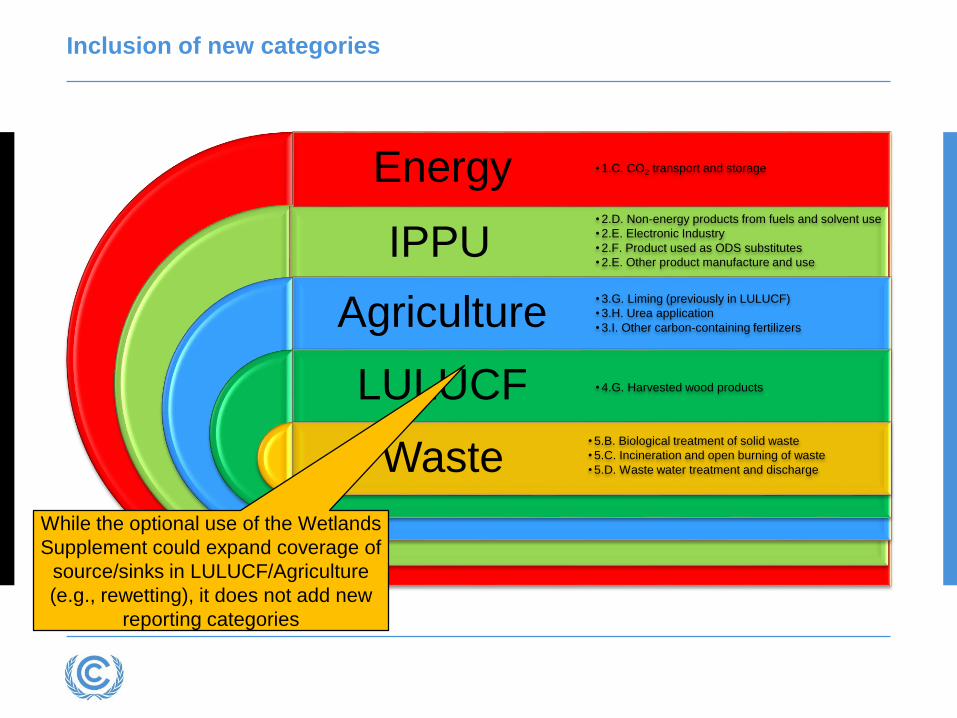
Inclusion of new categories
Energy
IPPU
Agriculture
LULUCF
Waste
• 1.C. CO2 transport and storage
• 2.D. Non-energy products from fuels and solvent use
• 2.E. Electronic Industry
• 2.F. Product used as ODS substitutes
• 2.E. Other product manufacture and use
• 3.G. Liming (previously in LULUCF)
• 3.H. Urea application
• 3.I. Other carbon-containing fertilizers
• 4.G. Harvested wood products
• 5.B. Biological treatment of solid waste
• 5.C. Incineration and open burning of waste
• 5.D. Waste water treatment and discharge
While the optional use of the Wetlands
Supplement could expand coverage of
source/sinks in LULUCF/Agriculture
(e.g., rewetting), it does not add new
reporting categories

Enhanced reporting on national inventory arrangements
• The earlier Annex I inventory reporting guidelines had one provision specifying that
the National Inventory Report should include a description of the institutional
arrangements for inventory preparation
• The revised Annex I inventory reporting guidelines have an entire section on the
national inventory arrangements with detailed provisions on generic and specific
functions of national inventory arrangements:
Inventory planning
Inventory preparation
Inventory management
Implications of Changes in the
GHG Inventory Guidelines for BR2
Review

Impact of changes in the GHG inventory GLs on GHG emissions and
trends
• A comparison of the total emissions (w/ & w/o LULUCF) for 1990 and 2012 in the
2014 and 2015 submissions of Australia, EU, New Zealand and Russian Federation
reveals the following facts.
• In almost all cases, total GHG emissions (with or without LULUCF) in both 1990 and
2012 increased in the 2015 submission as compared to the 2014 submission
o The increase ranged from < 1% for EU (w/ LULUCF) to >62% for New Zealand
(w/ LULUCF)
o Decrease in total emissions (w/ LULUCF) observed only for Australia
• Among the main factors that could be considered responsible for the changes in
GHG emissions are the new GWP values for CH4 and N2O and the inclusion of new
categories and gases
• The shares of CH4 increased and that of N2O decreased in both 1990 and 2012
emissions in the 2015 submission as compared to the 2014 submission
o Decrease in the share of CH4 emissions in 2012 was observed only for Australia

Implications of changes in the GHG inventory GLs for BR2 review
• The GHG emissions and their trends of most Parties will likely change from BR1 to BR2 in
all gases and sectors
• The BR review does not involve in-depth technical examination of the GHG inventory as
well as its comparison with that in earlier BRs
o Time-series consistency of the GHG inventory is to be reviewed in the GHG
inventory review
• Changes in the GHG Inventory GLs will, therefore, have no direct implication for the
review of GHG inventory and trends in the BR2 review
• However, the use of the 2006 IPCC GLs and the new GWP values may have implications
for the transparency of information on effects of mitigation actions and projections in terms
of their consistency with GHG emissions and trends
• Although not a review issue, more substantial information on national inventory
arrangements (mandatory and more elaborate in the revised inventory guidelines
according to 24/CP.19) and their changes is expected in BR2 as this information is based
on the inventory reporting guidelines

Thank you for your attention!