Implicaciones Economicas de La Teoria Del Conflicto
34
IMPLICATIONS OF AN ECONOMIC THEORY OF CONFLICT: Hindu-Muslim Violence in India BY A NIRBAN M ITRA AND D EBRAJ R AY 1 August 2012, revised December 2013 ABSTRACT We model inter-group conflict driven by economic changes within groups. We show that if group incomes are low, increasing group incomes raises violence against that group, and lowers violence generated by it. We then apply the model to data on Hindu-Muslim violence in India. Our main re- sult is that an increase in per-capita Muslim expenditures generates a large and significant increase in future religi ous conflict. An increase in Hindu expend iture s has negat ive or no effect. These findings speak to the origins of Hindu-Muslim violence in post-Independence India. Journal of Economic Literature Classification Numbers: C33, D31, D74. Keywords: Conflict, income distribution, religious violence, uneven growth. 1. I NTRODUCTION We study Hindu-Mu slim conflict in post-In depend ence India throug h the lens of economics. We allow for two channels that link economics to conflict. Under the first, Hindu-Muslim violence is the systematic use of a particular marker (religion, in this case) for appropriating economic sur- plus, either directly through resource-grabbing or looting, or indirectly through exclusion from jobs, businesses or property. Under the second, existing inter-group hatreds are re-ignited or ex- acerbated by economic progress within one of the groups. Both approaches have the same formal representation, which makes robust predictions regarding the effect of group incomes on inter- group violence. We examine these predictions empirically. The recurrent episodes of Hindu-Muslim conflict in India (going back to Partition and earlier) form the moti vat ion for this paper. Even if we exclude the enormit y of human losses from relig ious violence during Partition, such conflict has continued through the second half of the twentieth centur y , account ing for over 7,000 deaths over 1950–200 0. There is reason to belie ve that the situation may not hav e changed much since: witne ss, for instance, the rampan t Hindu-Musl im viole nce unleashe d in the Indian stat e of Gujar at in 2002. It may be argued that these numbers are small relative to the overall population of India. From a pure arithmetical perspective they are, 1 Mitra: University of Oslo; Ray: New York University. Ray is grateful for funding from the National Science Foun- dation (SES-1261560), the Fulbright Foundation and for hospitality from the Indian Statistical Institute during a year of leave from NYU. Thanks to Abhijit Banerjee, V. Bhaskar, Sam Bowles, Sugato Dasgupta, Oeindrila Dube, Joan Esteban, Mukesh Eswaran, Raji Jayaraman, David Ludden, Michael Manove, Kalle Moene, Andrew Oswald and Ro- hini Pande for useful discussions, and to Steve Wilkinson for granting us access to a dataset on religious conflict. We thank Jay Dev Dubey for his able research assistance. We are grateful to five anonymous referee s for their valuable comments. We particularly thank Co-Editor Jesse Shapiro, who went beyond the call of duty in his detailed reading of the manuscript, making many constructive suggestions that greatly improved both the content and the exposition.
Transcript of Implicaciones Economicas de La Teoria Del Conflicto

8/12/2019 Implicaciones Economicas de La Teoria Del Conflicto
http://slidepdf.com/reader/full/implicaciones-economicas-de-la-teoria-del-conflicto 1/34
IMPLICATIONS OF AN ECONOMIC THEORY OF CONFLICT:
Hindu-Muslim Violence in India
B Y A NIRBAN M ITRA AND D EBRAJ R AY 1
August 2012, revised December 2013
A BSTRACT
We model inter-group conict driven by economic changes within groups. We show that if groupincomes are low, increasing group incomes raises violence against that group, and lowers violencegenerated by it. We then apply the model to data on Hindu-Muslim violence in India. Our main re-sult is that an increase in per-capita Muslim expenditures generates a large and signicant increasein future religious conict. An increase in Hindu expenditures has negative or no effect. Thesendings speak to the origins of Hindu-Muslim violence in post-Independence India.
Journal of Economic Literature Classication Numbers : C33, D31, D74.
Keywords: Conict, income distribution, religious violence, uneven growth.
1. I NTRODUCTION
We study Hindu-Muslim conict in post-Independence India through the lens of economics. Weallow for two channels that link economics to conict. Under the rst, Hindu-Muslim violence isthe systematic use of a particular marker (religion, in this case) for appropriating economic sur-plus, either directly through resource-grabbing or looting, or indirectly through exclusion from jobs, businesses or property. Under the second, existing inter-group hatreds are re-ignited or ex-acerbated by economic progress within one of the groups. Both approaches have the same formalrepresentation, which makes robust predictions regarding the effect of group incomes on inter-group violence. We examine these predictions empirically.
The recurrent episodes of Hindu-Muslim conict in India (going back to Partition and earlier) formthe motivation for this paper. Even if we exclude the enormity of human losses from religiousviolence during Partition, such conict has continued through the second half of the twentiethcentury, accounting for over 7,000 deaths over 1950–2000. There is reason to believe that thesituation may not have changed much since: witness, for instance, the rampant Hindu-Muslimviolence unleashed in the Indian state of Gujarat in 2002. It may be argued that these numbers
are small relative to the overall population of India. From a pure arithmetical perspective they are,1Mitra: University of Oslo; Ray: New York University. Ray is grateful for funding from the National Science Foun-dation (SES-1261560), the Fulbright Foundation and for hospitality from the Indian Statistical Institute during a yearof leave from NYU. Thanks to Abhijit Banerjee, V. Bhaskar, Sam Bowles, Sugato Dasgupta, Oeindrila Dube, JoanEsteban, Mukesh Eswaran, Raji Jayaraman, David Ludden, Michael Manove, Kalle Moene, Andrew Oswald and Ro-hini Pande for useful discussions, and to Steve Wilkinson for granting us access to a dataset on religious conict. Wethank Jay Dev Dubey for his able research assistance. We are grateful to ve anonymous referees for their valuablecomments. We particularly thank Co-Editor Jesse Shapiro, who went beyond the call of duty in his detailed readingof the manuscript, making many constructive suggestions that greatly improved both the content and the exposition.

8/12/2019 Implicaciones Economicas de La Teoria Del Conflicto
http://slidepdf.com/reader/full/implicaciones-economicas-de-la-teoria-del-conflicto 2/34
2
but they do not capture the less measurable consequences of conict: displacement, insecurity,segregation, loss of livelihood, widespread fear and the sapping of the morale of an entire society.
Like the many episodes of ethnic violence that have occurred all around the world, it is prima faciereasonable that there is an economic component to Hindu-Muslim conict. There is, of course, nogetting away from the facts of sheer hatred and mistrust, or what one might call the “primordialistexplanations” for ethnic violence. Nor does one necessarily need to get away from primordialism,provided that we entertain the possibility that the economic progress of one’s enemies may heightenthe resentment and spite that one feels. But equally, there could be the systematic use of violencefor economic gain, for the control — via appropriation or systematic exclusion — of property,occupations, business activity and resources (see, e.g., Das (1992), Andr´ e and Platteau (1998),Collier and Hoefer (1998, 2004), Dube and Vargas (2013), Field, Levinson, Pande and Visaria(2008), Iyer and Do (2009) and the recent survey by Blattman and Miguel (2010)). This economicperspective is no contradiction to the use of noneconomic markers (such as religion) in conict. 2
In this paper, we take the economic approach to conict seriously, and apply it to Hindu-Muslimconict. We construct a simple theory that allows us to link observable economic variables to
conict outcomes. We use the theory to interpret new evidence on the relationship between incomeand violence in India. In the model (see Section 3), there are two groups: Hindus and Muslims.Depending on the circumstances, members of either group can be aggressors or victims in aninter-religious conictual encounter. We view such violence as decentralized, though it may placeagainst a backdrop of religious antagonism and orchestrated support from group leaders.
Consider encounters across members of different religious groups: an accident, an assault or con-frontation, an isolated murder or rape. When religion is involved, if only by chance, such encoun-ters could boil over into a larger conict or riot. A potential aggressor involved in the confrontationmust decide whether to take advantage of the situation and frame it as a religious conict, in whichmembers of the other religion can be targeted. The act itself may be motivated by the prospectof economic gain (via direct appropriation or economic exclusion of the victim) or it may be theexpression of animosity and resentment, as long as that resentment is sensitive to the economicsituations of aggressor and victim.
At the same time, a potential victim can try to defend himself. We consider two technologiesof protection. One is “human”: the recruitment of community members to safeguard against thepossibility of attack. The other is “physical”: the use of barricades and gated communities, orthe acquisition of weapons. We allow for both avenues, but recognize that their relative use willdepend on the economic status of the potential victim.
Our main result (Proposition 1) states that if a group is relatively poor to begin with, an increasein the average incomes of the group — controlling for changes in inequality — must raise violence
perpetrated against that group . In contrast, the effect on violence perpetrated by that group onmembers of the other group is generally negative. 3
2Indeed, as Esteban and Ray (2008) and Ray (2009) have argued, there may be good economic reasons for conict tobe salient along noneconomic (“ethnic”) lines, rather than along the classical lines of class conict long emphasizedby Marxist scholars.3These nuanced connections between economic growth and conict suggest that the overall relationship between thetwo could be non-monotonic. Dube and Vargas (2013) make a parallel observation in the context of resource shocksand violence in Colombia.

8/12/2019 Implicaciones Economicas de La Teoria Del Conflicto
http://slidepdf.com/reader/full/implicaciones-economicas-de-la-teoria-del-conflicto 3/34
3
We use a unique dataset on Hindu-Muslim violence between 1950 and 1995, compiled by AshutoshVarshney and Steve Wilkinson, and extended by us to 2000. It summarizes reports from The Timesof India on Hindu-Muslim conicts in India in the second half of the twentieth century. We usecounts of the number of people killed, or injured, or the number of riot outbreaks.
We match the data to the large scale household surveys that are conducted quinquennially as part of the National Sample Surveys (NSS). We use data from three consecutive “thick rounds”: the 38thin 1983, the 43rd in 1987–88 and the 50th in 1993–94. We compute average per capita monthlyexpenditures in each round for Hindu and Muslim households in 55 regions, 4 and so work with athree-period panel.
In several different panel specications with different sets of controls, Hindu per-capita expendi-tures have a negative effect on conict, while the coefcient on Muslim per-capita expenditures issignicant and positive. The coefcients are also large. Depending on the exact specication (seeTable 3 for baseline results), a 1% increase in Hindu per-capita expenditure is predicted to decreasecasualties by anywhere between 3–7%, while the same increase in Muslim per-capita expenditureincreases casualties by 3–5%. We conclude that an increase in Hindu prosperity is negatively as-
sociated with greater religious fatalities in the near future, while the opposite is true of Muslimprosperity.
The paper subjects these ndings to a number of different robustness checks. In all these exercises,the effect of Muslim expenditures remains strong and signicant. By and large, the same is true of Hindu expenditure, though in some specications signicance is lost. While the reader is invitedto study these robustness exercises in detail, it is worth mentioning here that we nd no similareffect of religious group expenditures on social unrest more generally; see Section 5.2. The effectwe uncover appears to hold only for instances of Hindu-Muslim conict.
We interpret our results in light of the model in Section 3. Such an interpretation suggests thatHindu groups have largely been the aggressors in Hindu-Muslim violence in India, or at least inHindu-Muslim violence driven by instrumental, specically economic considerations. 5 Section 2provides historical context for the model, including references to case studies in which attacks onthe Muslim community can be traced to various forms of Muslim economic empowerment.
We emphasize that the above interpretation follows jointly from the theory and the data, and alter-native interpretations are possible. Section 5 discusses other explanations with possibly differentimplications, such as the funding of violence.
The literature on ethnic violence is vast and we do not pretend to review it here: the treatise byHorowitz (2000) is an excellent entry point. It is probably fair to say that the economics of violencehave not been given center-stage in most of these writings, the focus being more on other correlatesof conict, such as politics, historical antagonisms, or the presence of ethnic divisions. 6
At the broad level of cross-country correlates, there is some evidence that negative shocks toper-capita income are conictual (Collier and Hoefer 1998, Fearon and Laitin 2003, Miguel,
4NSS does not collect data on incomes.5Our ndings do not speak to baseline levels of violence, but to the sensitivity of conict to economic change. However,the model in the Online Appendix shows that the two are related in some circumstances.6See, e.g., Collier and Hoefer (1998), Fearon and Laitin (2003), Montalvo and Reynal-Querol (2005), and Esteban,Mayoral and Ray (2012).

8/12/2019 Implicaciones Economicas de La Teoria Del Conflicto
http://slidepdf.com/reader/full/implicaciones-economicas-de-la-teoria-del-conflicto 4/34
4
Satyanath and Sergenti 2004). But in specic cases, economic shocks can have complex effects,as Dube and Vargas (2013) observe in their study of resource shocks and violence in Colombia. 7
Furthermore, there is little evidence for the argument that the relative deprivation of a group (oreconomic inequality more generally), is conictual; see, for instance, Midlarksy (1988) or Lich-bach (1989). This ambiguity shows up not just at the cross-country level, but also in specic studies
such as those by Spilerman (1970, 1971, 1976), Wilson (1978) and Olzak and Shanahan (1996) onrace riots in the urban United States.
One reason for the lack of a connection is that cross-group inequality is correlated with increasedsegregation of the groups. They interact little and so the frictions are low: as in a caste-based orfeudal society, each group knows its place. But as the fortunes of the deprived group improve,the previously advantaged groups may feel threatened, and react with violence. In the words of Olzak and Shanahan (1996), “[W]hen groups come to occupy the same niche, the historicallymore powerful or advantaged group attempts to exclude competitors. When the less powerful re-sist these attempts, racial conict and violence ensues.” 8 This viewpoint has two implications:rst, that economic progress can be conictual; and second, that changes in inequality have am-biguous effects on violence. By linking group incomes to violence and showing that the incomesof antagonistic groups can have opposing effects on the conict between them, our paper buildsupon and contributes to this point of view.
2. BACKGROUND ON H INDU -M USLIM VIOLENCE IN INDIA
As already noted, Hindu-Muslim violence in India extends back to the pre-Partition era. It reacheda peak during Partition, and then settled down to sporadic episodes with regular frequency, all theway up to the present day. Many thousands have died from it, not counting the loss of livelihoodsor property. There is reason to believe that economic factors play a role in this violence, just as
they do in religious or ethnic violence elsewhere.9
For instance, Upadhyaya (1992) documents the targeting of Muslim sari dealers in the 1991Varanasi riots. They were clearly viewed as business rivals. A similar targeting of Muslim clothmanufacturers is seen in the case of the 1984 Bhiwandi riots; see Rajgopal (1987) and Khan (1992):
“[T]he 1984 riots were largely the outcome of business rivalry, though the immediate provocationwas provided by the Shivaji Jayanthi procession. The well-entrenched and the newly emergingtraders came to perceive competition between them in trade along religious lines. When the com-petition happens to be between merchants belonging to two religious groups, communal motivesare imputed for the success or the failure of the different groups.” (Rajgopal, 1987)
Of Meerut, where Muslim powerloom owners had started to diversify economic activity from clothweaving and printing into other sectors, such as transport and auto-repair, Engineer (1987) writes:
7Bazzi and Blattman (2013) make a similar point using commodity price shocks.8See also the “split labor” market theory of Bonacich (1972), which argues that labor from clearly demarcated groupsof weaker economic strength, such as immigrants, are often used to wear down organized labor, leading to inter-groupviolence.9See, for instance, Bohr and Crisp (1996) on Kyrgystan, Andr e and Platteau (1998) on Rwanda, Horowitz (2001) onthe Ivory Coast and other regions, or Mamdani (2010) on Darfur.

8/12/2019 Implicaciones Economicas de La Teoria Del Conflicto
http://slidepdf.com/reader/full/implicaciones-economicas-de-la-teoria-del-conflicto 5/34
5
“If [religious zeal] is coupled with economic prosperity, as has happened in Meerut, it has a mul-tiplying effect on the Hindu psyche. The ferocity with which business establishments have beendestroyed in Meerut bears testimony to this observation. Entire rows of shops belonging to Mus-lims . . . were reduced to ashes.”
Economic targeting during conict is not conned to eliminating rival businesses or workers. Itcan consist in direct attacks on entire localities, so as to drive out an ethnic group and affect eitherhousing prices or the opportunity to buy and build. In their analysis of the 2002 Gujarat conict,Field, Levinson, Pande and Visaria (2008) study locations in which valuable housing was retainedby mill workers in residential colonies when the textile mills shut down:
“Once the mills closed, preferential treatment of these lands under the Bombay Rent Control Actimplied that residents were granted stronger than average tenancy rights. Since tenancy rights arenot transferable on formal real estate markets, mounting tensions between Hindus and Muslims inGujarat led to a territory war rather than segregation in these locations. As tension mounted, actsof violence and intimidation were used to push out residents belonging to the religious minoritygroup.”
This is only one of several studies in which housing is implicated as a factor inuencing violence.For instance, Das’s (2000) report on the Hindu-Muslim riots in Calcutta in 1992 observes that
“[I]t appears that that ‘promoters’ played a crucial role in inaming the riot whose victims . . . wereslum-dwellers. Their obvious aim was to clear the bustees [or slums] for construction projects. . . Theexpectation was that once such people could be forced to abandon their establishments the real-tors would have ‘an easy way to rake in the fast buck’. . . What actually took place in 1992 was aland-grabbing riot under a communal garb.”
For more on direct economic targeting in Hindu-Muslim violence, see Bagchi (1990), Khan (1992),and the discussion in Wilkinson (2004, Ch. 2).
It seems reasonably clear that in most of these accounts, Muslims suffer a share of the losses thatis entirely out of proportion to their population representation (though there are instances runningthe other way, as in the certain parts of Calcutta during the 1992 riots, such as Metiabruz). Thatisn’t particularly surprising as Muslim populations are generally minorities, and implicit politicalor police support for Hindu rioters has often been alleged. Drawing on the 9th and 10th AnnualReports of the Minorities’ Commission, Wilkinson (2004, p. 30) observes that
“Muslims suffer disproportionately as a result of Hindu-Muslim riots. Hard numbers are difcultto obtain, but of 526 Hindu-Muslim incidents that occurred from 1985 to 1987 in 10 major states,Muslims (12% of the population) accounted for 60% of the 443 deaths, 45% of the 2,667 injuries,and 73% of the property damage. Given that Muslims are, as a community, much poorer than
Hindus the relative effect of communal riots on Muslims economic life is even greater than thesepercentages suggest. . . The fact that Muslims suffer disproportionate losses in riots and that Muslimbusinessmen are more often the victims of looting has convinced many scholars and activists thatriots are nothing more than a particularly brutal method of protecting Hindu merchants marketshare.”
Yet writers such as Wilkinson and Horowitz only irt with the economic argument. While opento the possibility that economic causes may be afoot, their point is that it is one thing to state that
8/12/2019 Implicaciones Economicas de La Teoria Del Conflicto
http://slidepdf.com/reader/full/implicaciones-economicas-de-la-teoria-del-conflicto 6/34
6
conict has a strong economic component, and another to say that economic changes precipitateconict. So, for instance, Wilkinson (2004, p.30–31) asserts:
“Despite the disparate impact of riots on Hindus and Muslims, however, little hard evidence sug-gests that Hindu merchants and nancial interests are fomenting anti-Muslim riots for economicgain. . . The fact that economically motivated violence against Muslims occurs after a riot breaksout does not necessarily prove that this is why the violence broke out in the rst place.”
This echoes the earlier cautionary note sounded in Horowitz (2001, p. 211):
“It is difcult to know how seriously to take commercial competition as a force in targeting choices.In some north Indian cities serious competition has subsisted without any violent episodes. Therole that commercial competition is said to play is said to be a covert, behind-the-scenes role,which makes proof or disproof very difcult.”
In what follows, we take the economic argument a step further.
3. THEORY
3.1. A Model. There are two groups. Members of one group can attack those of the other, possiblyby exploiting a past confrontation or violent incident with a possible religious interpretation. Theindividuals involved — in their role as aggressors — decide whether or not to take matters furtherby “communalizing” the incident. 10 At the same time, members of either group — in their role aspotential victims — seek security against the possibility of such attacks.
Formally, Nature moves rst and generates aggressor-victim pairs belonging to two different reli-gious groups. Each aggressor observes the victim’s income or wealth. The victim does not observeaggressor income; this captures the idea that a potential victim makes decisions about protectionbefore an attack occurs. One way to interpret our empirical ndings is that it throws some light onthe probability that Nature chooses aggressors from one group rather than the other. In short, bothgroups will have aggressors and victims, the question is one of the relative proportions of each.
A potential victim is characterized by his income or wealth, which we denote by y. Let α be theperceived probability of this person being attacked. A victim can seek protection against attack;think of this as “defense” d. While not directly affecting α itself (though in equilibrium α will beendogenous), an individual’s investment in defense lowers the probability that the attack will beeffective. Write this probability as p = p(d), with p continuous and decreasing in d. While weregard d somewhat abstractly here, it has several interpretations to which we return below. Fornow, we simply view a potential victim with income y as picking d to maximize
(1 − α)y + α { p(d)(1 − µ)y + [1 − p(d)](1 − β )y} − c(d),where c(d) is the direct or opportunity cost of defense, assumed continuous and increasing in d, µ isthe fraction of gross income lost by the victim in the event of successful attack, and β (presumablysmaller than µ) is the fraction lost in case an attack occurs and turns out to be unsuccessful, where
10Of the Moradabad riots in 1980, Rajagopal (1987, p. 75) observes that “[t]he incident was sparked off by the entryof a pig towards the Namazis (Muslims offering prayers). . . .” A more common list (p. 87) includes “encroachment onplaces of worship”, “music before mosques”, “teasing of girls belonging to the other community”, and “provocativearticles in magazines.”

8/12/2019 Implicaciones Economicas de La Teoria Del Conflicto
http://slidepdf.com/reader/full/implicaciones-economicas-de-la-teoria-del-conflicto 7/34
7
the word “successful” is used from the aggressor’s point of view. 11 This specication incorporatesthe fact that an attack, successful or not, may still be costly to the victim: 0 ≤ β < µ ≤ 1.
This problem is equivalent to the one of choosing d to minimize
α(µ − β ) p(d) + [c(d)/y ],
where the rst term details the extra loss that will accrue from a successful attack, and the secondterm is the cost of lowering the success probability. Under our assumptions, there is always asolution to the maximization problem. As we track the choices of d (and so p = p(d)) over differentvalues of α, we obtain a best response mapping in (α, p) space, which we call the protection function .
The second best response mapping yields the probability of attack as a function of the perceivedprobability of success p. Call this the attack function . Suppose that a potential aggressor withincome z must decide whether or not to participate in violence against an individual with incomey. Participation involves an opportunity cost, incurred in the fraction of time t spent on conict.That time could have been spent in productive work. The income loss is therefore tz . (We extend
this setting to include the expenditure of nancial resources in Section 5.3; see also the onlineAppendix.) The gain could be economic or psychic but, as discussed above, it is positively relatedto the victim’s income y. Denote the gain by λy. Then an attack will be launched if
(1 − p)[1 − t]z + p([1 − t]z + λy) > z.Rearranging, we may rewrite this condition as
(1) z < (λp/t )y.The value (λp/t ) establishes a threshold ratio of attacker to victim income below which the attackerwill willingly engage in conict. It is intuitive that a higher probability of success p makes it moreattractive to attack, and that an increase in the opportunity cost t makes it less attractive.
It follows that a potential victim with income y faces a likelihood α of being attacked, given by(2) α = πA(λp/t )y,where π is the probability of a cross-religious encounter, p is the perceived probability of suc-cess, and A is the cumulative distribution function of aggressor incomes, which we assume to becontinuous and strictly increasing everywhere. 12
3.2. Equilibrium. We may now formalize an equilibrium notion for conict. This is a collectionof attack and success probabilities, α∗(y) and p∗ (y), one such pair for every victim income y,such that α∗ is determined by the optimal decisions of the population of potential attackers, given p∗ , while p∗ is determined by the optimal decisions of potential victims, given α∗ . A simple
11One could just easily write this out in a more sequenced way. For instance, there could be some explicit prior stageat which defense resources are chosen, followed by a second stage in which attacks possibly happen. Our results arealso robust to the use of a constant-elasticity utility function dened on net income. The Online Appendix, which thereader is encouraged to read, contains a precise formulation of these and other issues.12Note that in deriving the attack function, we’ve used the exogenous income y of the potential victim. In actuality,y may be depleted by expenditures on defense, and it may be augmented by the economic gains of the victim in hisrole (in other contexts) as aggressor. Similarly, we’ve used the exogenous income z of the aggressor, and haven’tadjusted it for his attack or defense activities elsewhere. The Online Appendix builds a formal model based on thissimplication.

8/12/2019 Implicaciones Economicas de La Teoria Del Conflicto
http://slidepdf.com/reader/full/implicaciones-economicas-de-la-teoria-del-conflicto 8/34

8/12/2019 Implicaciones Economicas de La Teoria Del Conflicto
http://slidepdf.com/reader/full/implicaciones-economicas-de-la-teoria-del-conflicto 9/34
9
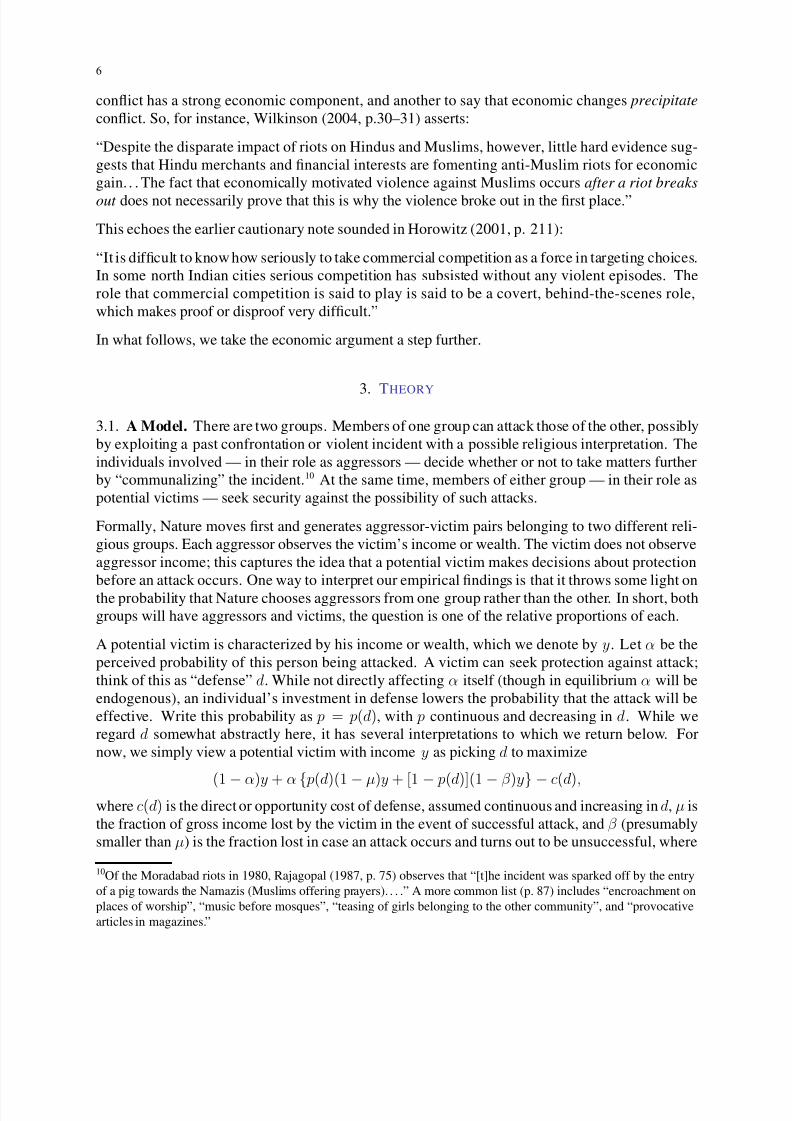
d*
F/y
F/y'
d
! ( µ- " ) p(d )
c(d ) /y
! ( µ- " ) p(d )+[c(d )/ y] (Income-Normalized) Expected Cost to Victim
(A ) The Defense Response
!
p
Best response (attack)
Best response (defence)
(B ) Equilibrium
F IGURE 2. A CHANGE IN GROUP FORTUNES : LOW INCOME . In Panel A, a victim’s
optimal choice of defence remains unchanged, as cost and benet move together. In PanelB, this leads to a negligible shift in the protection function and a sizable change in the attack function, so that the probability of attack climbs.
First traverse a cross-section of victim incomes. Imagine drawing a variety of attack and protectionfunctions for different values of the income of a potential victim. It is obvious that the net effect of such changes on α will be ambiguous. Richer victims are a more attractive target for attack, but onthe other hand they invest more on protection. The net impact of victim wealth on the probabilityof attack can, therefore, go in either direction. Panel B of Figure 1 summarizes this situation.
However, the effect of an across-the-board change in group incomes is different. To understandthis, one must study the technology of protection or defense, because the cost of deploying thattechnology will vary with group incomes. Think of two components to protection. The rst com-ponent is human: protection provided by other individuals in the same community. This is ensured,rst and foremost, by living in that community, or at least within easy reach of community mem-bers. 13 Yet that choice cannot but come at a cost. The principal component of that cost lies inthe implicit contract of protection. It may well be the case that compatriots would spontaneouslydefend a potential victim, but such defense is rarely free: by and large, equal contributions willhave to be made to the community or obligations incurred, such as the reciprocal protection of oth-ers. But the cost of that reciprocity must be commensurate with the opportunity cost of providingprotection services, which is related to the average of group incomes to which our victim belongs.We therefore expect that the cost of “human protection” will be proportional to group incomes .
The second component of protection largely involves the use of physical capital: the purchase of security through the use of high walls, barricades, and rearms. This sort of protection is generallyextremely effective in reducing attack, but involves high xed costs: the purchase of weaponry(and the hiring of security guards to use them), the erection of high walls around one’s property,and so on. Unlike human protection, the cost of this component will be less-than-proportionately
13In the Hindu-Muslim case, see, for instance, Mahadevia (2002) and Chandoke (2009) on the high residential seg-regation in Ahmedabad. Over 70% of the Ahmedabad sample studied in Field, Levinson, Pande and Visaria (2008)lived in segregated communities.

8/12/2019 Implicaciones Economicas de La Teoria Del Conflicto
http://slidepdf.com/reader/full/implicaciones-economicas-de-la-teoria-del-conflicto 10/34
10
related to group incomes, and to the extent that it is fully reliant on physical capital, not related atall. Specically, we suppose that
c(d) = min {wd,F ∗ + w∗d},
where the rst entry represents a protection technology with a dominant human component, and
the second a technology with a dominant physical component, with the potential advantage that ithas lower variable costs. That is, w > w∗ ≥ 0. The important assumption that we make is thatthe variable costs w are fully human (and borne by individuals in the same group), and thereforeproportional to average group incomes.
P ROPOSITION 1. Assume that w is proportional to average group incomes. Then:
(a) There exists a threshold income y∗ such that an equiproportionate increase in group incomesthat keeps all incomes below y∗ increases the probability of attack on group members.
(b) An equiproportionate increase in the incomes of a group unambiguously lowers attacks insti-gated by members of that group.
Parts (a) and (b) represent the two faces of economic fortune. An improvement in the fortunes of apotential victim make him a more lucrative target, so that violence increases. An improvement inthe fortunes of a potential aggressor increases the opportunity cost of engaging in conict, so thatviolence decreases. The sign of the correlation between group incomes and subsequent violencetells us something about whether that group contains a preponderance of victims or attackers.
To understand how the proposition works, consult Figure 2. Consider a potential victim, whoseincome increases (in the same proportion as his group’s) from y to y . The thin downward-sloping line in Panel (a) is the function α(µ − β ) p(d), which is the expected loss per unit of victim income in the event of an attack. The piecewise linear segment in that panel is the function
c(d) = min {wd,F ∗
+ w∗
d}, deated by victim income y. The thick nonlinear curve is the sum of these two functions, which our individual seeks to minimize via choice of d.
Given that our individual’s income shift mirrors the overall group shift, and that w/y is unaffectedby group income, there is no change in the sum of the two curves up to some threshold, after whichit moves down. This happens because xed costs are effectively reduced when deated by risingincome, and the ratio of subsequent variable cost w∗ to income could be reduced as well. The sumof the two functions therefore moves as shown in Panel A. However, in this panel, the individualin question has low income, and the capital-intensive technology is not attractive even after theeffective xed cost shifts down. A change in group incomes then has no effect on the optimallychosen defense expenditure of that individual.
Moving over to Panel B with this information, we see that when incomes are low, the variable costof defense expenditure moves in tandem with incomes, and the protection function does not shiftwith a change in group incomes. At the same time, each individual in the group becomes a moreattractive target: the attack function shifts upward, and it becomes more protable to launch anattack for any xed value of p. The net effect is an increase in equilibrium attack probability.
It is easy enough to dene a threshold y∗ which is sufcient to generate all the effects above. Notethat the highest probability of an attack is bounded above by π, the probability of a cross-religiousconfrontation. If, at this level, it is optimal for an individual to choose the “human protection”

8/12/2019 Implicaciones Economicas de La Teoria Del Conflicto
http://slidepdf.com/reader/full/implicaciones-economicas-de-la-teoria-del-conflicto 11/34
11
d*
F/y
F/y'
d
c(d ) /y
! ( µ- " ) p(d )
d*'
! ( µ- " ) p(d )+[c(d )/ y] (Income-Normalized) Expected Cost to Victim
(A ) The Defense Response
!
p
Best response (attack)Best response (defence)
(B ) Equilibrium
F IGURE 3. A CHANGE IN GROUP FORTUNES : H IGH INCOME . In Panel A, a victim’s
optimal choice of defence shifts away from human mode. In Panel B, this leads to a sizableshift in both attack and protection function, so that the probability of attack changes inambiguous fashion.
technology, then by the rst part of Observation 1, it is optimal to do so for all lower levels. It isstraightforward to see that such a threshold must exist. 14
For individuals with incomes that exceed this threshold, the capital-intensive technology may beattractive. If it is attractive both before and after the change in group incomes, then the effecton d will depend on the ratio of w∗ to y. If w∗ is a fully human cost and involves the use of fellow group members, it will again be proportional to group means, and previous arguments apply.
The ambiguity arises from individuals whose incomes cross the threshold. Figure 3 shows whathappens with incomes that rely on the human technology before the change, but move into thexed-cost technology after the change. Panel A shows that it is now possible for there to be a sharpupward jump in defense expenditures. 15 The protection function shifts downwards, as in Panel B,while the attack function (as before) shifts upwards. The net effect will depend on the relativestrengths of these two shifts, and it is ambiguous.
The effect on overall attacks will depend on the proportion of individuals who fall below thethreshold for which the capital-intensive technology is never used. The more individuals there arein this category, the more likely it is that economic improvement will generate greater violencedirected against the group in question.
In contrast, consider a potential aggressor, whose income increases from z to z , and look at theattacks perpetrated by him. Given the assumptions of our model, there is no ambiguity here at all:the opportunity cost of engaging in violence goes up, and aggression must decline. Formally, the
14Recall that w is linear in average incomes and is therefore bounded above by a fraction of Y , if all incomes in societyare smaller than Y . Moving Y down lowers w and must create a cross-over to the human protection technology atsome positive level even if w∗ = 0 . This level is sufcient for our needs (it may be far from necessary).15By mixing across individuals who are indifferent between making this change, we can always make sure that thegraph of the protection function is continuous, so that an equilibrium exists.

8/12/2019 Implicaciones Economicas de La Teoria Del Conflicto
http://slidepdf.com/reader/full/implicaciones-economicas-de-la-teoria-del-conflicto 12/34
12
inequality (1) is less likely to hold for any aggressor-victim pair, and so — all other things beingequal — the probability of attack, as given by (2), must come down.
4. EMPIRICAL
ANALYSIS
4.1. Data. Systematic statistical information on outbreaks of religious violence in India is rela-tively hard to come by, and our choice of time period is constrained by the available overlap of conict data and economic information. On conict, we use a dataset compiled by Steven Wilkin-son and Ashutosh Varshney. (See, in particular, the recent use of this data in Wilkinson, 2004.) Itsummarizes reports from The Times of India , a leading national newspaper, on Hindu-Muslim con-icts in India in the second half of the twentieth century. This dataset has information on deaths,injuries, and arrests. It does not provide hard information on which side initiated the violence, for inmost cases that issue would necessarily be mired in subjectivity. For every report of Hindu-Muslimviolence, the dataset provides the date of incidence of the riot, the name of the city/town/village,
the district and state, its duration, the number of people killed, injured and arrested and the reportedproximate cause of the riot.
The following summary provides some sense of the pervasiveness and intensity of Hindu-Muslimriots in post-Independence India. Between 1950 and 1995, close to 1,200 separate riot episodeswere reported, with over 7,000 individuals killed. Between 1950 and 1981, the average numberof Hindu-Muslim riots in India was 16 per year. This same number for the period between 1982and 1995 happens to exceed 48. Over these 14 years, a total of 674 riots were reported with closeto 5000 deaths. Therefore, over half the reported riots between 1950 and 1995 (and around 2/3 of total deaths) occurred during a period that was less than one-third as long as the total period forwhich we have data. In other words, religious conict appears to have sharpened signicantly aswe move from 1950–81 to 1982–95.
We utilize the Varshney-Wilkinson data from 1979 to 1995. Furthermore, we have extended thisconict dataset by a period of ve years, i.e., from 1996 to 2000. 16 The main reason for limitingourselves to this time period is the non-availability of reliable data on economic conditions (byreligious group) for earlier years. At the same time, the observations made above highlight theimportance of religious violence in the 1980s and 90s.
We use three different count measures from the dataset: the number of people killed or injured(“casualties”), the number of people killed or the number of riot outbreaks over the period. In allcases, we take aggregates over a ve year period in each location.
As for economic data, large scale household surveys are conducted quinquennially in India as partof the National Sample Surveys (NSS). The survey rounds cover the entire nation and capturemonthly expenditure incurred by sample households for domestic consumption. 17
16In conducting this exercise, we have adhered to the same data collection protocol as followed in the construction of the original dataset. To ensure consistency, we have kept the source of these data (from 1996-2000) the same as thatused by Varshney and Wilkinson; namely, the reports from The Times of India .17Unfortunately, a well-known problem in the case of the NSS is that we do not have income data on a nationwidescale, and expenditure is the closest we can get.

8/12/2019 Implicaciones Economicas de La Teoria Del Conflicto
http://slidepdf.com/reader/full/implicaciones-economicas-de-la-teoria-del-conflicto 13/34
13
The earliest “thick” round that provides spatially disaggregated economic information by religionis the 38th round (1983). 18 We use three such “thick” rounds: the 38th (1983), the 43rd (1987–1988) and the 50th (1993–94). For all of these rounds there is information on the religious afli-ation of the household, or more precisely, the head of the household. This enables us to computethe per-capita monthly expenditure of Hindu and Muslim households.
However, we are further restricted by the relative lack of spatial disaggregation in the 38th and the50th rounds, which do not permit identication of the surveyed households all the way down to thedistrict level. To use all three rounds (and thereby exploit the panel structure), we must aggregatethe Varshney-Wilkinson dataset up to the regional level in India, “regions” being formally denedas areas that are midway between the state and the district. We do so for 55 such regions, whichtogether span 14 major Indian states and account for more than 90% of the Indian population. 19
We also employ a number of controls: population by region, religious polarization across Hindusand Muslims, the literacy rate , the completion rate for primary education , urbanization , calculatedas the percentage of urban households in the region, the share of regional Lok Sabha seats wonby the Bharatiya Janata party (BJP), and Gini coefcients as controls for expenditure inequality
among Hindu and Muslims.
4.2. Preliminary Observations. Although incidents of Hindu-Muslim violence have been re-ported all over India, there are some regions that appear to be particularly prone to such outbreaks.The “conict” columns of Table 1 tell us that the states of Gujarat and Maharashtra have witnessedmajor outbreaks whereas states like Punjab, Haryana and Orissa have experienced very few suchincidents.
The “expenditure” columns of Table 2 provide a quick guide to Hindu-Muslim expenditure dis-parities in different states of India. The table provides state averages as well within-state regionalvariations. On the whole, Hindu households have a higher average monthly per-capita expenditure
than their Muslim counterparts. But Table 2 also reveals the large variation in Hindu-Muslim ex-penditure ratios across the regions of India. This ratio was as low as 0.36 in a region in Orissa in1983 and as high as 1.93 in a region in Haryana in 1993–94.
Around the time period considered in our study, several changes impacted differentially on Hindusand Muslims, thereby allowing for a degree of independent movement in their incomes. Here aretwo examples. First, positive shocks to oil prices, starting with the concerted efforts of OPECin the 1970s, resulted in a huge increase in the demand for labor from the Gulf countries. Thatresulted in a substantial emigration of workers from India to the Gulf over the next few decades.In particular, members of the Muslim communities in Kerala, Tamil Nadu and Andhra Pradesh
18NSS surveys which occur annually utilize smaller samples and hence are referred to as “thin” rounds. However, the
rounds performed quinquennially draw upon larger samples (about 120,000 households per survey); hence the term“thick”.19We leave out border states with their own specic sets of problems: Jammu & Kashmir and Himachal Pradesh inthe north, and the north-eastern states of Assam, Arunachal Pradesh, Manipur, Meghalaya, Nagaland, Sikkim andTripura. There are two specic issues with these areas: (i) NSS does not survey all regions within these states (owingto hilly terrain, safety issues, national security reasons due to border skirmishes, etc.), and (ii) for the border statesit is sometimes difcult to tell whether a reported riot is indeed civilian in nature or due to the Army clashing withextremist groups. In addition, the north-eastern states (which happen to be sparsely populated) have an insignicantMuslim population: they are primarily Hindus, Christians, Buddhists and Scheduled Tribes. So even in the violencedataset there are almost no reports of riots there.

8/12/2019 Implicaciones Economicas de La Teoria Del Conflicto
http://slidepdf.com/reader/full/implicaciones-economicas-de-la-teoria-del-conflicto 14/34
14
State 1984-88 1989-93 1994-98Casualties Killed Outbreak Casualties Killed Outbreak Casualties Killed Outbreak
Andhra Pradesh 320 48 14 226 165 11 141 8 2Bihar 62 18 4 647 485 29 187 42 6Gujarat 1932 329 97 1928 557 75 639 2 3
Haryana 0 0 0 6 4 2 0 0 0Karnataka 300 38 19 430 82 32 235 39 7Kerala 17 0 2 42 5 3 0 0 0Madhya Pradesh 139 17 8 794 174 12 22 2 1Maharashtra 1250 333 57 2545 808 29 238 9 11Orissa 0 0 0 62 16 6 0 0 0Punjab 13 1 1 0 0 0 0 0 0Rajasthan 14 0 4 302 75 15 66 6 3Tamil Nadu 21 1 1 125 12 5 67 33 5Uttar Pradesh 963 231 38 1055 547 48 217 50 22West Bengal 71 19 7 148 59 12 0 0 0
TABLE 1. Descriptive Statistics: Conict. Sources and Notes. Varshney-Wilkinson dataseton religious riots. “Conict” is measured by aggregates of casualties (killed + injured), killed andoutbreaks over a ve-year period.
1983 1987-8 1993-4State H-M exp. ratio Min Max H-M exp. ratio Min Max H-M exp. ratio Min Max
Andhra Pradesh 0.99 0.96 1.09 0.99 0.92 1.17 0.99 0.84 1.16Bihar 0.98 0.88 1.12 1.07 1.02 1.12 1.03 0.93 1.16Gujarat 1.02 0.89 1.19 0.98 0.78 1.14 1.06 0.88 1.13
Haryana 1.20 1.07 1.53 0.96 0.85 1.05 1.60 1.39 1.93Karnataka 0.98 0.84 1.19 1.00 0.83 1.07 1.01 0.69 1.15Kerala 1.10 1.07 1.19 1.15 1.15 1.16 1.01 0.92 1.16Madhya Pradesh 0.92 0.78 1.38 0.86 0.71 1.04 0.88 0.62 1.16Maharashtra 1.04 0.97 1.25 1.04 0.74 1.29 1.12 0.87 1.42Orissa 0.69 0.36 1.04 0.85 0.58 0.93 0.96 0.73 1.13Punjab 0.86 0.75 1.15 1.21 1.19 1.22 1.18 1.08 1.34Rajasthan 0.97 0.43 1.18 1.02 0.46 1.19 1.22 1.06 1.35Tamil Nadu 1.06 0.82 1.44 0.88 0.80 0.94 0.98 0.85 1.05Uttar Pradesh 1.12 1.01 1.23 1.11 0.95 1.54 1.08 0.93 1.31West Bengal 1.18 1.05 1.26 1.21 1.05 1.31 1.25 1.07 1.38
TABLE 2. Descriptive Statistics: Economic Data. Sources and Notes. National SampleSurvey 38th, 43rd and 50th rounds. H-M exp. ratio = Hindu per-capita expenditure/ Muslim per-capita expenditure, average value for the state. The range for the state comes from the constituentregions of the state.
contributed to this steady ow of migrant workers (see, e.g., Azeez and Begum (2009)). In turn,this ow resulted in remittances back to India from the Gulf, some of it resulting in highly visible

8/12/2019 Implicaciones Economicas de La Teoria Del Conflicto
http://slidepdf.com/reader/full/implicaciones-economicas-de-la-teoria-del-conflicto 15/34
15
(A ) Conict and Muslim Expenditure ( B ) Conict and Hindu Expenditure
F IGURE 4. CONFLICT AND PER -C APITA E XPENDITURE . Each panel plots the residual
of casualties after region and time effects have been removed, in the 5-year period followingexpenditures. Each line segment connects three data points for a region.
real estate booms. 20 Second, the trade liberalization process in India, set in motion in 1991, has ledto the continuation and heightening of changes with even earlier origins. In particular, while somesectors made substantial gains from this liberalization process, the unorganized tertiary sector hassuffered, certainly in relative and perhaps in absolute terms. After all, this sector has practically nosafety nets to cope with the structural changes accompanying globalization. It is well known (see,e.g., Basant (2012)) that Muslims are heavily concentrated in this sector; furthermore, they mostlyhappen to be poor and self-employed. Therefore, such Muslim households were more at the mercyof the broad, sweeping changes which liberalization brought in its wake.
We combine these economic changes with information on Hindu-Muslim conict from the Varshney-Wilkinson dataset. As a starting observation, Figure 4 considers (the logarithm of) Hindu and Mus-lim per-capita expenditure by region at each of three rounds of the NSS, and conict measured by(the logarithm of) total “casualties” — killed plus injured — in the ve-year period starting im-mediately after the rounds. Because regions vary so widely in average conict levels and becausethere are nationwide trends over the three periods, we remove region-specic and time-speciceffects. With no other controls in place, the gure plots the two sets of residuals.
The remarkable pattern that emerges is one we will repeatedly verify over several robustnesschecks: conict appears to react signicantly and positively to an increase in Muslim per-capitaexpenditures, while the opposite reaction occurs to an increase in Hindu per-capita expenditure:conict declines. Indeed, we display each regional observation as a line segment joining three ob-servations, so the reader can even see the effect “region by region”: the line segments are generallyupward-sloping in the rst panel of the Figure, and downward-sloping in the second. A secondobjective of our paper is to interpret these two different effects by constructing and applying asimple theory of economic violence.
20See, for instance, Rajagopal (1987, p. 35): “The boom in the economy of the Arab countries in the Middle Easthas been a blessing . . . the youths and the entrepreneurs among the Muslims have also capitalized on this boom. Thisaccounts for a distinct spurt in the economic afuence of Muslims in certain parts of the country.”

8/12/2019 Implicaciones Economicas de La Teoria Del Conflicto
http://slidepdf.com/reader/full/implicaciones-economicas-de-la-teoria-del-conflicto 16/34
16
4.3. Specication. For the reasons given in the theoretical section of this paper, we are interestedin the effect of Hindu and Muslim per-capita expenditures on religious violence. As already de-scribed, our dependent variables are different measures (or specically, counts) of Hindu-Muslimviolence. The independent variables and the expected signs on them come from the theory. Recallthat in equilibrium, violence is proportional to the total number of attacks, given by
π ν 1 y2
F 1(λ1 p2(y2)y2/t 1)dF 2(y2) + ν 2 y1
F 2(λ2 p1(y1)y1/t 2)dF 1(y1) ,
where π is the probability of a cross-match and subscript i stands for variables pertaining to groupi. The rst term within the square brackets denotes attacks generated by aggressors in group 1 onvictims in group 2, and the second term switches the roles of the two groups. The weights ν 1 andν 2 tell us how important each conguration is in generating the overall conict that we observe.
The cross-match probability π will be increasing in both the extent of Hindu-Muslim polarizationas well as in overall population. Proposition 1 tells us, additionally, that attack data will dependon average incomes in each group. Taken together, this motivates a Poisson specication in whichthe parameter depends on all these variables, with possibly additional region- and time-specicvariation. This motivates the baseline Poisson specication that we use:
E (Count i,t |X it , γ i ) = γ i exp(Xit β + τ t )
where we add in region effects γ i as well as time effects τ t in the panel regressions below. Note,the subscript i represents region while t denotes time.
We also use the Negative Binomial and OLS specications as robustness checks. OLS has theadvantage of easier interpretation of the coefcients compared to count models such as the Poissonand Negative Binomial. However, to avoid losing observations in cases where reported conict iszero, we add a very small number (0.01) to the total count variable, so that the dependent variablefor the OLS regressions is actually ln(count + 0.01). So our OLS specication is:
ln(count it + 0 .01) = γ i + τ t + X it β + error it .The most important variables in X are, of course, Muslim and Hindu per-capita expenditures (ourproxies for per-capita income), and in some variants their ratio. Population and some measure of Muslim presence are always included as controls in every specication (despite the region xedeffects, these are important variables that potentially vary with time). Muslim “presence” is mea-sured in two ways: we use either the share of Muslim households in the region, or a measure of Hindu-Muslim polarization along the lines proposed by Esteban and Ray (1994) and Montalvoand Reynal-Querol (2005). 21 To be sure, in all the regressions we either control for Muslim per-centage or religious polarization but never both simultaneously. The correlation between these twovariables is very high (about 0.97).22 We also control for expenditure inequality among Hindu and
Muslims, as our predictions pertain to balanced increases in income for either group.The basic controls are constructed using the data from the NSS rounds. In some specications, wealso use an expanded set of controls, to be described below. In all the specications, expendituresand population are entered logarithmically, and all other controls are brought in linearly.
21The degree of religious polarization for a region is dened by 4 s 2j (1 − s j ) for j = H, M where H denote Hindus
and M Muslims and s j denotes the population share of j in the region.22In some areas, there are other dominant religious groups (like Sikhs in Punjab), so that Muslim percentage andHindu-Muslim polarization measure different things. But these cases are exceptions rather than the rule.

8/12/2019 Implicaciones Economicas de La Teoria Del Conflicto
http://slidepdf.com/reader/full/implicaciones-economicas-de-la-teoria-del-conflicto 17/34
17
Poisson[1]
Poisson[2]
Poisson[3]
Neg. Binom.[4]
OLS[5]
Hindu per-capita expenditure ***-8.325 ***-7.869 ***-6.824 -3.310 *-8.462(0.005) (0.005) (0.003) (0.131) (0.085)
Muslim per-capita expenditure ***5.627 ***5.103 ***4.670 **3.872 ***9.523(0.000) (0.000) (0.001) (0.023) (0.009)
Population 3.353 4.280 3.914 0.744 -1.230(0.554) (0.468) (0.496) (0.132) (0.877)
Religious Polarization 5.103 *5.552 *5.566 1.094 6.860(0.104) (0.054) (0.056) (0.715) (0.408)
Literacy Rate 0.021 0.023 -0.015 -0.043(0.298) (0.242) (0.525) (0.552)
Urbanization Rate -0.020 -0.017 0.015 -0.055(0.258) (0.354) (0.405) (0.371)
Gini: Hindu per-capita exp. -5.426 4.121 -14.473(0.317) (0.521) (0.342)
Gini: Muslim per-capita exp. 3.399 -5.952 -11.073(0.497) (0.362) (0.451)
1% rise in Hindu exp. reduces conict by 8.0% 7.6% 6.5% 3.2% 8.1%
1% rise in Muslim exp. raises conict by 5.7% 5.2% 4.8% 3.9% 9.9%
Log-Likelihood/Adjusted R2 -3,468 -3,416 -3,357 -302.20 0.348
Observations 129 129 129 129 129
TABLE 3 . The Effect of Hindu and Muslim Expenditures on Regional Conict:
FE regressions with Poisson, Negative Binomial and OLS, respectively. Sources and
Notes. Varshney-Wilkinson dataset on religious riots, National Sample Survey 38th, 43rd and 50throunds. “Conict” is measured by regional aggregates of casualties (killed or injured) over a ve-year period starting immediately after the expenditure data. Robust standard errors clustered byregion; corresponding p-values in parentheses. Time dummies included in all regressions. *signi-cant at 10% **signicant at 5% ***signicant at 1%
We look at the effect of these expenditure variables on Hindu-Muslim conict starting the year rightafter the corresponding expenditure round. Specically, expenditures from the 38th round (1983)are matched with conict during 1984-88, the 43rd round (1987-88) expenditures are matched withconict during 1989-93 while the 50th round (1993-94) expenditures are matched with conictduring 1994-1998. Lag specications and issues of endogeneity are discussed in some detail below.All specications utilize both region and time xed effects.
4.4. Basic Results. Table 3 contains the main results for our region-based panel specication.We present three different regression models: the rst two are count models (Poisson and NegativeBinomial, respectively) and the third is OLS.

8/12/2019 Implicaciones Economicas de La Teoria Del Conflicto
http://slidepdf.com/reader/full/implicaciones-economicas-de-la-teoria-del-conflicto 18/34
18
For each of the three regression models, we display three columns. The rst column has minimalcontrols (only population and a measure of Muslim presence), while the second column controlsin addition for literacy and urbanization. The third column further includes measures of within-Hindu and within-Muslim inequalities. In all panel specications with or without controls, thecoefcient on Muslim expenditures is signicant and positive. In contrast, Hindu expenditures
exhibit a negative effect on casualties.The coefcients on both Hindu and Muslim expenditures are also large. A one percent increase inMuslim expenditures is predicted to increase casualties — starting the very next year — by around5% in the xed effects Poisson model. The corresponding estimate for the Negative Binomialmodel is around 3%. The same change in Hindu expenditure has corresponding effects rangingfrom − 7% in the Poisson specication to − 3% for the Negative Binomial model. To be sure, a1% increase in expenditure may require a bit more than a 1% increase in underlying incomes, if the consumption function is concave, or if there is smoothing of income shocks via insurance orcredit. But there is little doubt that the effect is signicant and large, and strongly suggests that anincrease in Muslim prosperity is positively associated with greater religious fatalities in the nearfuture, while the opposite is true of a change in Hindu prosperity.
Below, we discuss several variations. Before we do so, we take explicit note of the controls forwithin-group economic inequality, as measured by the Gini coefcients on Hindu and Muslim ex-penditures. The controls, introduced in Column 3 of our basic specication, will be used in all therelevant variations below. It is important to maintain these controls as our theoretical predictionsregarding income changes and its consequent effect on violence are based on “balanced changes”in group incomes. To be sure, “unbalanced changes”, or changes in inequality, can also have theirown set of effects (see Esteban and Ray, 2008, 2011, and Huber and Mayoral, 2013), but this isnot something we seriously investigate in this paper. In any case, the inclusion or exclusion of inequality controls makes no serious difference to the main results of the paper.
In what follows, we explore the robustness of the basic nding to alternative specications, anddiscuss questions of interpretation.
4.5. Variations. The basic results are robust to the many different variations we’ve tried; wediscuss some of them in this section.
4.5.1. Other Dependent Variables. The use of alternative count variables generate similar results.We can move to progressively coarser indicators: the number killed in riots or simply the numberof outbreaks. Table 4 records some of these ndings. As before, we report results for all threeregression models: Poisson, Negative Binomial and OLS. For each of the three models, the rstcolumn runs the exercise for all killed, while the second column does so for the number of reported
riots. All these variants consistently report that an increase in Muslim per-capita expenditure ispositively and substantially correlated with later occurrences of conict.
4.5.2. Expenditure Ratios. Table 3 has the interesting feature that Muslim and Hindu expenditureshave not only the opposite sign, they have roughly the same impact. Indeed, in all our specica-tions, the two expenditures can be easily replaced by their ratio. As expected, a higher ratio of Muslim to Hindu income, controlling for overall per-capita income, is positively and signicantlyassociated with greater subsequent conict. See column 1 in Table 5.

8/12/2019 Implicaciones Economicas de La Teoria Del Conflicto
http://slidepdf.com/reader/full/implicaciones-economicas-de-la-teoria-del-conflicto 19/34
19
Poisson Negative Binomial OLS[1]
Killed[2]
Outbreak [3]
Killed[4]
Outbreak [5]
Killed[6]
Outbreak
Hindu per-capita expenditure -0.073 -2.122 -2.249 *-5.369 -4.267 **-6.304(0.976) (0.393) (0.293) (0.069) (0.339) (0.019)
Muslim per-capita expenditure 0.852 *2.493 **3.692 **4.158 **6.415 ***6.421(0.636) (0.067) (0.030) (0.016) (0.043) (0.006)
1% rise in Hindu exp. reduces conict by 0.1% 2.1% 2.3% 5.2 % 4.2% 6.0%
1% rise in Muslim exp. raises conict by 0.9% 2.5% 3.7% 4.2% 6.6% 6.6%
Log-Likelihood/Adjusted R2 -730.84 -149.57 -193.27 -128.76 0.402 0.435
Observations 126 132 126 132 126 132
TABLE 4. The Effect of Hindu and Muslim Expenditures on Regional Conict: FEregressions with Poisson, Negative Binomial and OLS, respectively (variations).Sources and Notes. Varshney-Wilkinson dataset on religious riots, National Sample Survey 38th,43rd and 50th rounds. All counts over a ve-year period starting immediately after the expendituredata. Robust standard errors clustered by region; corresponding p-values in parentheses. Controlsfor population, religious polarization, literacy rate, urbanization rate, Gini coefcients for Hindusand Muslims and time dummies included in all regressions. *signicant at 10% **signicant at 5%***signicant at 1%.
4.5.3. Politics. Our basic empirical specication does not include a satisfactory variable that cap-tures the ambient political climate, which might inuence Hindu-Muslim violence. In particular,the period of our study coincides with the rise of Hindu politics in many parts of India. A usefulindicator for this is the strength of the Bharatiya Janata Party (BJP) in the region. The BJP is apolitical party that is traditionally associated with a platform of respect for “Hindu values” and thecreation of a State based on those values. We use “BJP share”, the fraction of Lok Sabha (nationallevel parliament) seats in the region that is held by that Party.
Given that politics plays a major role in determining the extent of Hindu-Muslim rioting in India(see, e.g., Wilkinson (2004)), we can ask if our ndings are merely a reection of the effect thatthe BJP’s presence in a region has on regional violence.
In Table 5, we report some results for main measure of conict, namely, casualties (see in particu-lar, column 2). The basic nding that Muslim expenditures signicantly and positively affect con-ict, while Hindu expenditures exhibit (if anything) an opposite effect, remains entirely unaltered.The coefcient on BJP share is mostly not signicant and the sign varies across specications. Toaddress the concern that more local political factors (which are not captured by the share of theBJP in national parliamentary seats) may inuence the pattern of riots, we create an additionalcontrol: the share of votes obtained by the BJP in state-level electoral districts within a region. 23
23This variable is positively correlated with BJP’s share in parliamentary seats (correlation coefcient is about 0.65).

8/12/2019 Implicaciones Economicas de La Teoria Del Conflicto
http://slidepdf.com/reader/full/implicaciones-economicas-de-la-teoria-del-conflicto 20/34
20
[1]Exp. Ratio
[2]Politics
[3]Urban
[4]Urban
[5]Urban
Hindu per-capita expenditure ***-6.825 **-5.096(0.003) (0.024)
Muslim per-capita expenditure ***4.668 *3.617(0.001) (0.056)
Muslim-Hindu exp. ratio ***4.783 **3.772 *2.521(0.000) (0.042) (0.090)
Per-capita expenditure -3.356 -2.477 -2.911(0.208) (0.182) (0.167)
% Lok Sabha held by BJP -0.030 0.915 0.928 0.118(0.965) (0.144) (0.152) (0.878)
Literacy rate Y Y N N YPrimary education completion rate N N Y Y NUrbanization rate Y Y N N N
1% rise in Muslim-Hindu exp. ratio raises conict by 4.9% 3.8% 2.5%
1% rise in Hindu exp. reduces conict by 6.5% 4.9%
1% rise in Muslim exp. raises conict by 4.8% 3.7%
Log-Likelihood/Adjusted R2 -3,318.69 -3,357.20 -3,064.43 -3,028.97 -3,735.57
Observations 129 129 123 123 123
TABLE 5 . The Effect of Hindu and Muslim Expenditures on Regional Conict:Poisson Fixed Effects regressions (Robustness). Sources and Notes. Varshney-Wilkinsondataset on religious riots, National Sample Survey 38th, 43rd and 50th rounds. All counts over ave-year period starting immediately after the expenditure data. Dependent variable in all columnsis Casualties (= Killed + Injured). Robust standard errors clustered by region; corresponding p-
values in parentheses. Columns (3) – (5) uitlize only urban households. Controls for population,religious polarization, Gini coefcients for Hindus and Muslims and time dummies included in allregressions. *signicant at 10% **signicant at 5% ***signicant at 1%
This additional control makes no difference to the results; also, it is not signicant in any of thespecications. 24
4.5.4. Urban Conict. Hindu-Muslim riots are primarily an urban phenomenon; rural India iswitness to fewer cases of religious riots. One way to deal with this situation is to restrict attentionto urban households in our NSS expenditure rounds. We do so, and the ndings are presented in
columns 3–5 of Table 5. The results are in line with what we have obtained earlier, as the differentspecications in that table show.
4.5.5. Different Lags. Our main specication relates Muslim and Hindu expenditures “today” tosubsequent conict, or more precisely, to a ve-year aggregate of conict starting the followingyear. It is clear that some degree of lagging is necessary, as there are effects running the other wayin contemporaneous correlations, which is an issue that we return to in Section 5.1. At the same24See Online Appendix for detailed results.

8/12/2019 Implicaciones Economicas de La Teoria Del Conflicto
http://slidepdf.com/reader/full/implicaciones-economicas-de-la-teoria-del-conflicto 21/34
21
F IGURE 5. D IFFERENT LAG STRUCTURES . The coefcients on Hindu and Muslim per-capita expenditures have been plotted against “time” which goes from − 2 to 3. Theseestimates come from Poisson Fixed Effects regression specications. The underlying re-gressions are collected in a table in the Online Appendix. The 95% condence intervalsaround each coefcient have also been plotted.
time, it is a safe presumption that our effect should die out with very long lags. It is easy enoughto explore the effects of different lag structures on our regressions. That is, we match the threeexpenditures rounds with different 5-year periods of conict that start with n years into the future.
Detailed regressions are collected in the Online Appendix, but a visual depiction of the results isto be found in Figure 5, which reports on n = − 2, − 1, 0, 1 (our baseline case), 2 and 3. Thecoefcients of the per–capita expenditures (Hindu and Muslim, separately) have been plotted withrespect to “time” ( n). Observe that “contemporaneous conict” 25(n = − 2) appears to be nega-tively related to Muslim expenditures. As the lag is increased, the sign switches and turns positive.For lags larger than the ones we have chosen, the positive relationship diminishes and then anyassociation between the variables progressively disappears. These results testify to the robustnessof our basic ndings.
5. C ONCERNS
We raise three concerns, and describe what we do to alleviate them.
5.1. Endogeneity. While we explicitly regress conict over a ve-year period on anterior Hinduand Muslim expenditure, the question of endogeneity needs to be addressed. Even though weconnect expenditure change to conict starting a year later, conict may well be serially correlated.
25It is contemporaneous in the sense that the 38th round (1983) is matched with conict during 1981-85, the 43rdround (1987-88) is matched with conict during 1986-90 and the 50th round (1993-94) is matched with conictduring 1991-1995.

8/12/2019 Implicaciones Economicas de La Teoria Del Conflicto
http://slidepdf.com/reader/full/implicaciones-economicas-de-la-teoria-del-conflicto 22/34
22
For instance, some regions do exhibit violence more persistently over time than others, and besides,there is truth to the aphorism that “violence begets violence”. To be sure, the region-specic xedeffects are meant to capture the time-invariant features of the region which make it violence-prone.But of course, the effects that we’re referring to are not generally time-invariant.
If conict starting a year later is highly correlated with conict today, there is effectively thepossibility of reverse causation. But Section 2 makes it clear that conict destroys Muslim propertyand wealth, and therefore reduces Muslim expenditure; see, e.g., Engineer (1984, 1994), Rajgopal(1987), Bagchi (1990), Khan (1992), Thakore (1993), Brass (1997), Das (2000), Engineer (1994),and the excellent summary of these and others in Wilkinson (2004). That the impact is negative isnot very surprising as Muslims are a minority and happen to be poorer on average than their Hinducounterparts. It stands to reason that they would be less able to protect their lives and property in theevent of a religious riot. However, the lagged relationship we obtain between Muslim expenditureand conict in every one of the tables so far is just the opposite .
In short, the particular concern of reverse causation appears to runs the other way.
But the problem could be more subtle. Consider episodes of conict followed by periods of relativequiescence. Suppose conict depresses Muslim income. In the quiet period that follows, incomeswould recover. If conict ares up again along the violence-peace-violence cycle, that might gen-erate a situation in which Muslim expenditures are positively correlated with future conict. To besure, such an argument, even without the empirical resolution we attempt below, rests on a some-what delicate conceptual foundation. For expenditures to revert to pre-conict levels, conict mustbe temporary. Yet, for those expenditures to be correlated with (without causally inuencing) fu-ture conict, current and future conict must be positively correlated. The greater this correlation,the less space there is for the mean-reversion to occur to begin with. But the possibility exists.
The omitted variable problem is of course, quite general, and there are possibly several factorsthat would affect both group incomes and conict. An important example is the elite funding of conict, particularly by inows from the Gulf countries. To some extent, overall changes in Gulf fortunes are subsumed in the time dummies, but not to the extent that different Indian regions aredifferentially represented in the Gulf. Because remittances also ow for peaceful purposes, Muslimexpenditures (which presumably include the effect of those remittances) could be correlated withGulf funding for other, conictual objectives.
To address these issues, we undertake two separate exercises, with the second building on the rst.These are to be viewed as explorations that add to the overall weight of evidence. It would be anoverstatement to assert that we account for all possible confounding factors (particularly, those dueto omitted variables) and hence the results should be interpreted with appropriate circumspection.
5.1.1. 2SLS With Hindu and Muslim Income Indices. We begin with a broad classication of oc-cupational groupings, and then use the NSS data on expenditures (by occupation) to form proxiesof national average returns for Hindus and Muslims in each occupational class. For each religion,construct the weighted average of these returns, with weights given by the regional employmentshare over occupational groups. That generates an “income index” for each region and each reli-gion. Changes in occupational composition at the regional level, coupled with changes in nationalreturns by occupation, will affect these indices. We use them as instruments for Hindu and Muslim

8/12/2019 Implicaciones Economicas de La Teoria Del Conflicto
http://slidepdf.com/reader/full/implicaciones-economicas-de-la-teoria-del-conflicto 23/34
23
expenditures. Specically, we take the ratio of the Muslim index to the Hindu index and use thisas an instrument for the ratio of Muslim to Hindu expenditures at the regional level.
In short, we exploit the fact that Muslims and Hindus are concentrated differently over occupationalclasses. Presumably, such differential concentration stems from their specialization — over time— in different activities, their acquisition of skills and so on. For instance, an occupational classsuch as “Manufacture of Leather and Leather Products” has a disproportionate share of Muslims— in relation to their population numbers — and this is true across all the different time periods.To limit the potential for conict to inuence the occupational structure, we employ a rather broadpartition of occupations. We use a total of 18 broad-brush sectors. 26 That is, just 18 sectors areused to partition the entire labor force of India.
Column 1 in Table 6 presents the 2-SLS result for “casualties”; the corresponding OLS regressionis reported in column 4 for ease of comparison. We report on other dependent variables such as“killed” and “outbreak” in the Online Appendix. Observe that the coefcient on the instrumentedMuslim-Hindu expenditure ratio variable is positive and signicant like in the OLS regression.However, the magnitudes of the two are statistically different. 27 A 1% increase in the Muslim-
Hindu expenditure ratio in a region raises casualties by 7.1% in the OLS FE model and by 26.8%in the 2-SLS specication. This latter effect is extremely large. While we accept that the 2-SLSestimates suggest that overall impact of economic factors on conict is substantive, we wouldinterpret the difference in magnitudes with real caution given that our sample size is limited. (Seealso the discussion on the GMM estimates below.)
5.1.2. GMM With Lagged Conict and Income Indices. To explicitly allow for the possibility thatpast conict might affect expenditures, we turn to the linear system GMM estimation procedure fordynamic panels suggested by Arellano and Bover (1995) and further developed by Blundell andBond (1998). This estimation method recognizes the fact that current expenditures may be affectedby previous conict, so that expenditures, while predetermined, are not strictly exogenous. Theidea is to use lagged expenditures as instruments for current expenditures after rst-differencing(to eliminate unobserved xed effects). Using this procedure a two-step system GMM estimator isdeveloped based on appropriate moment conditions for both sets of equations — in rst-differencesand in levels. 28 In addition, we include the Hindu and Muslim income indices described above inthe set of instruments.
Moreover, this method is designed to provide consistent estimates for dynamic panels which in-clude a lagged dependent variable as a regressor for short panels ( N → ∞ while T is xed). Table
26The 18 sectors are: (1) Agricultural Production and Plantations, (2) Livestock Production, (3) Fishing, (4) Miningand Quarrying (Coal; Crude Petrol and Natural Gas; Metal Ore; Other), (5) Manufacture of Food Products and Inedible
Oils, (6) Manufacture of Beverages, Tobacco and Tobacco products, (7) Manufacture of Textiles (Cotton; Wool, Silk,Articial; Jute, Veg. Fibre; Textile Products), (8) Manufacture of Wood and Wooden Products, (9) Manufacture of Paper, Paper Products, Publishing, Printing and Allied Industries, (10) Manufacture of Leather, and of Leather and FurProducts, (11) Manufacture of Rubber, Plastic, Petroleum, Coal ; Chemicals and Chemical Products, (12) Manufactureof Non-Metallic Mineral Products, (13) Basic Metal and Alloy Industries, (14) Manufacture of Metal Products andParts, except Machinery and Transport Equipments, (15) Manufacture of Machinery, Machine Tools and Parts exceptElectrical Machinery, (16) Manufacture of Electrical Machinery, Appliances, Apparatus and Supplies and Parts, (17)Manufacture of Transport Equipments and Parts and (18) Other Manufacturing Industries.27The difference in the coefcients is signicant at the 95% level.28See Cameron and Trivedi (2005) and Roodman (2006) for a detailed formal exposition.

8/12/2019 Implicaciones Economicas de La Teoria Del Conflicto
http://slidepdf.com/reader/full/implicaciones-economicas-de-la-teoria-del-conflicto 24/34
24
A. Addressing Endogeneity B. Placebo Tests, All Riots[1]
2-SLS[2]
GMM[3]
GMM[4]
OLS[5]
Poisson[6]
Neg Bin[7]
OLS
Muslim-Hindu exp. ratio ***26.831 *8.587 **11.518 **7.122 -0.066 -0.012 -0.056(0.004) (0.085) (0.035) (0.034) (0.552) (0.949) (0.696)
Past Casualties -0.107(0.416)
First StageMuslim index/Hindu index ***0.782
(0.001)F -statistic 10.63
Hansen J test, P > χ 2 0.537R2 0.056 0.346 0.028Overall t, P > χ 2 0.000 0.000 0.000 0.545Observations 129 129 86 129 165 165 1651% rise in ratio changes conict by 26.8% 8.6% 11.5% 7.1% -0.07% -0.01% -0.06%
TABLE 6. Addressing Endogeneity, and Placebo Tests. Sources and Notes. Varshney-Wilkinson dataset on religious riots, National Sample Survey 38th, 43rd and 50th rounds; Govt. of India dataset on crime. All counts over a ve-year period starting immediately after the expendituredata. Dependent variable is Casualties (=killed+injured). Columns 1-4 addresses endogeneity con-cerns. Column 1 reports the 2SLS specication with the rst-stage regression coefcient on the IVreported below. Columns 2 and 3 utilize GMM specications following Blundell and Bond (1998).Column 4 is the corresponding OLS specication (for comparison). Columns 5–7 report placebotest results for “All Riots,” which are casualties based on the Government of India dataset on crimeand hence contains numbers for all kinds of riots (not necessarily Hindu-Muslim riots). Robuststandard errors clustered by region; corresponding p-values in parentheses. Controls for population,religious polarization, literacy rate, urbanization rate, BJP presence, Gini coefcients for Hindus
and Muslims and time dummies included in all regressions. *signicant at 10% **signicant at 5%***signicant at 1%
6 contains some results based on this estimation procedure. In the columns 2 and 3 of this table,we report results for the dependent variable casualties ; in column 3, we control for past levelsof violence, thereby exploiting the full advantages of the system GMM estimation procedure. Ineach specication, the (robust) standard errors are based on the two-step GMM estimation methodwith bias-correction as proposed by Windmeijer (2005). The small p-values for the measure of overall t (columns 2–3) are reassuring, as is the large p-value associated with the Hansen J-testfor overidentication (column 3).
The coefcient estimates from the GMM regressions are closer to the OLS estimates in relationto the 2-SLS ones. In particular, a 1% increase in the Muslim-Hindu expenditure ratio in a regionraises casualties by 8.6% (and 11.5% when directly controlling for past conict) according to theGMM estimates.
5.2. Religious Rioting Versus General Rioting. It might be argued that a rise in Muslim ex-penditure (controlling for Hindu expenditure), or more generally a rise in the ratio of Muslim to

8/12/2019 Implicaciones Economicas de La Teoria Del Conflicto
http://slidepdf.com/reader/full/implicaciones-economicas-de-la-teoria-del-conflicto 25/34
25
Hindu expenditures, is just a proxy for overall Hindu stagnation, which could be associated withan increase in social unrest quite generally, and not just in Hindu-Muslim conict. This argumentwould maintain that a concomitant rise in Hindu-Muslim conict is just a by-product of this over-all uptick in social unease, and could therefore not be interpretable as directed violence against aspecic community.
One can test this hypothesis in many ways. We do so by using the Government of India dataseton Crime in India, which has data on “all riots”. That would presumably include but not belimited to Hindu-Muslim riots. 29 Though Hindu-Muslim riots must form an important componentof “all riots”, it is by no means the dominant component. There are numerous sources of unrestin a country as culturally diverse as India. Examples include caste conict (between upper andlower caste Hindus), Maoist insurgencies (often taking the form of a class struggle), separatistuprisings (in the forms of ethnic groups demanding an “autonomous state”: Bodoland, Gurkhaland,Telengana, etc.), conicts over land, and all sorts of political clashes.
We run a variety of specications to evaluate this argument. The Online Appendix contains adetailed table. We report the specication using Muslim-Hindu expenditure ratios in columns 5–7
of Table 6. Note that an increase in this ratio is not associated with a increase in overall socialunrest. In fact when comparing columns 4 and 7, the null hypothesis that the effect of expenditureratio on “all riots” is the same (in elasticity terms) as that on religious riots is rejected at the 95%level ( p–value = 0.013).
5.3. Muslim Incomes and the Funding of Violence. We use the theory in Section 3 to interpretthe empirical ndings. Recall that we describe a two-group model in which aggressors in eachgroup can initiate a conict with victims in the other group. We’ve argued that a balanced increasein the incomes of a group should lead to unambiguously higher levels of attacks being perpetratedagainst them. (There is more to loot, or greater urgency to exclude, or more reasons to hate.) Incontrast, an increase in incomes reduces attacks perpetrated by that group. (The opportunity costof violence increases.) The theory therefore permits the following interpretation of our empiricalresults. The fact that Muslim expenditures display a strong and positive connection with conict,while Hindu incomes have just the opposite effect, allows us to suggest that Hindu groups havebeen more responsive to economic considerations in precipitating Hindu-Muslim violence in post-Independence India.
This interpretation is in line with the Indian experience. Section 2 refers to several case studieswhich describe a Hindu reaction to what they perceive as the invasion of their occupational orentrepreneurial turf by Muslims. It is possible that in other situations the opposite may have beentrue, but as we’ve already noted, Muslims come off far worse, on average, in conictual encounters.
This is not surprising, as Indian Muslims constitute a minority. At the same time, it is impossible tobe sure from the case studies alone that one group has engaged in a more systematic perpetration of economic violence than the other. Most incidents follow earlier incidents in a cycle of retribution,and no incident can be viewed in isolation. The question of whether one group has engaged “moresystematically” in violence cannot be answered through case studies alone, though these providevaluable indicative information. We view our results as adding to this body of evidence.
29It is important to note that this dataset does not have specic information regarding Hindu-Muslim violence.

8/12/2019 Implicaciones Economicas de La Teoria Del Conflicto
http://slidepdf.com/reader/full/implicaciones-economicas-de-la-teoria-del-conflicto 26/34
26
One counterargument to our interpretation is that the positive impact of Muslim expenditures onviolence stems from Muslim , not Hindu aggression. Specically, rising Muslim incomes make iteasier to fund conict, outweighing the negative opportunity cost effects of direct participation.That, too, would generate a positive relationship between the income of an aggressor group andsubsequent conict.
While hard empirical information on the funding of religious conict does not appear to be avail-able, it is reasonable that nancial resources play a role in organized violence. The question iswhether it is this phenomenon that lies behind the correlations we do observe. The fact that theHindu coefcient is negative means that if “funding effects” are responsible for what we see, theyare somehow observed only for Muslim groups while the effect is entirely obliterated and reversedfor Hindu groups. That is possible, but in light of the fact that Muslims are by far the larger losersin outbreaks of violence, the simultaneous conjunction of all these explanations — Muslims fundconict, Hindus don’t, Hindus are on average richer, Muslims are by far the bigger per-capita losers— appears unlikely.
Next, there are good reasons to suppose that “funding effects” will not heighten conict in situa-
tions of balanced growth in group incomes, which is precisely the focus of our empirical exercise.To see this, recall the analysis from Section 3, and reconstruct the attack function to include twoalternatives: direct participation in violence, and the funding of violence. These two alternativesare affected very differently by an increase in income. Direct participation is reduced (the oppor-tunity cost of time goes up), while the funding of violence is increased (the opportunity cost of nancial contributions is lowered). 30 To capture the latter effect we now endow the attacker witha strictly concave utility function u on consumption x, which we take to have constant elasticity:u(x) = x1− σ / (1 − σ) for σ > 0.31
As before, suppose that a potential aggressor with income z must decide whether or not to inictviolence on an individual with income y. He can do so via direct participation, which involvesa time opportunity cost of t . Or he can fund an equivalent amount of violence by paying for theopportunity cost of someone else’s time at the rate of f . The net return to “participatory violence”is then
P (z ) = (1 − p)u([1 − t]z ) + pu([1 − t]z + λy),while the net return to monetary of “funded violence” is given by
M (z ) = (1 − p)u(z − f ) + pu(z − f + λy),
where, just as we had earlier, λy stands for the economic equivalent of the spoils from a victimwith income y in the event of a successful attack.
The question is what a balanced growth in group incomes does to the funding requirement f . If
violence is principally carried out by individuals from the same group as the aggressor , then f must rise in roughly proportional fashion to z . We then have
P ROPOSITION 2. A balanced increase in group incomes that causes both the funding requirement f and all aggressor incomes z to rise in equal proportion, must reduce attacks perpetrated bymembers of that group.
30Esteban and Ray (2011) develop these observations to connect within-group inequality to violence.31When σ = 1 , u is logarithmic.

8/12/2019 Implicaciones Economicas de La Teoria Del Conflicto
http://slidepdf.com/reader/full/implicaciones-economicas-de-la-teoria-del-conflicto 27/34
27
z
d ( z )
m ( z )
u ( z )
F IGURE 6 . PARTICIPATION AND F UNDING : LOW AND HIG H INCOMES
An increase in z raises the opportunity cost of time, thereby reducing participatory violence. Asfor funded violence, a proportionate increase of f with z keeps the opportunity cost of violenceconstant as a proportion of z . At the same time, the looting of a victim with the same income yappears less attractive in relative terms. So in both cases, violence perpetrated by the group mustdecline. (The formal arguments rely on the constant-elasticity formulation of utility; see Appendix.In addition, the online Appendix integrates this extension fully into the basic model of Section 3.)
Faced with Proposition 2, it is still possible to assert either that paid attackers are not from thesame religious group, or that funding pays for non-human inputs into violence. 32 In either case f will not change (or won’t change in proportion) when z does. We would actually defend the claimthat same-group human input is, in fact, central to funded violence, but we can go a step further byconsidering an implication of this contrary viewpoint: that the funding effect must be stronger athigher levels of income.
P ROPOSITION 3. Suppose that both funding and direct participation can be used to generate aviolent attack, and that f does not change with z . Then:
(a) If funded violence is preferred to participatory violence at income z , the same preference ismaintained for all z > z .
(b) If funded violence is preferred to peace at income z , then it is preferred for all higher incomes.
(c) If participatory violence is preferred to peace at income z , then it is preferred for all lower
incomes.
Figure 6 illustrates the proposition, which we prove formally in the Appendix. Payoff from partic-ipatory violence dominates all other payoffs at low incomes, while payoffs from funded violencedominate at high incomes. This makes perfect sense once we consider the opportunity costs of time and money. It follows that when the distribution of income is concentrated on relatively lowincomes, an increase in aggressor income is likely to result in a decline in violence, as individuals
32The latter argument is analogous to that carried out for the protection function in Section 3.

8/12/2019 Implicaciones Economicas de La Teoria Del Conflicto
http://slidepdf.com/reader/full/implicaciones-economicas-de-la-teoria-del-conflicto 28/34
28
F IGURE 7 . D IFFERENT REGIONAL SAMPLES . The (%) effect on conict of a 1% changeHindu and Muslim per-capita expenditures have been plotted on the vertical axis for 3 differ-ent regional samples: all “non-high” regions, all “intermediate” regions, and all “non-low”regions. A region is “low” if Muslim/Hindu expenditure ratios in that region are systemati-cally lower than the national average for every one of the three time periods, and “non-low”otherwise. “High” and “non-high” are dened analogously. A region is “intermediate” if itis neither high nor low.
move from the rst zone of participatory violence into the second zone of peace. The opposite
effect holds when incomes are relatively high: individuals will move from the peace zone into thefunded violence zone.
That suggests a test: if funded violence drives the positive relationship between Muslim expendi-tures and subsequent conict, then Proposition 3 applies, and the positive effect should be stronger in richer regions . Figure 7 provides one way of examining this relationship. We dene a regionto be “low” if Muslim/Hindu expenditure ratios in that region are systematically lower than thenational average for every one of the three time periods, and “non-low” if it is not low. In similarfashion, we may dene the “high” regions, and by negation, the “non-high” regions. Finally, saythat a region is “intermediate” if it is neither high nor low. 33
Figure 7 plots the effect on casualties (in % terms) of a 1% change in Hindu and Muslim expen-ditures for these three different regional groupings. The gure (and its accompanying table in theOnline Appendix) shows that there are no discernible differences in the effect across the three setsof regions. If we believe the funding argument, we must also accept the conclusion that the poorerregions are funding conict to the same degree as the richer regions, even after controlling forinequality, an observation that runs up against (or certainly is not supportive of) Proposition 3.
33We take this approach so as to preserve a relatively large number of regions in each grouping, otherwise we quicklyrun out of statistical power. We have tried several alternative specications with no essential difference in the results.
8/12/2019 Implicaciones Economicas de La Teoria Del Conflicto
http://slidepdf.com/reader/full/implicaciones-economicas-de-la-teoria-del-conflicto 29/34
29
6. S UMMARY AND CONCLUDING R EMARKS
Our empirical investigations yield a central result, which we explore from a number of angles.An increase in Muslim well-being, measured by per-capita Muslim expenditures, leads to a largeand signicant increase in religious conict in the short to medium run; specically, in a ve-year
aggregate of conict starting from the very next year (relative to the expenditure year). In contrast,an increase in Hindu well-being has either an insignicant or a negative effect on future conict.We obtain this nding using a three-period Indian panel with region and time effects employedthroughout.
This result is robust along a number of dimensions. It is robust to different measures of religiousconict: numbers killed, numbers killed+injured, or coarser outcomes such as the number of riots.It persists whether we use the absolute values of Hindu and Muslim expenditures, or their ratio. Itis robust to the inclusion of several controls, such as literacy rates and the degree of urbanization.It is robust to the inclusion of political variables, such as the share of the BJP in total Lok Sabhaseats.
Our nding is also robust to the use of alternative lag structures, as long as we focus on conict following the change in expenditure. That isn’t surprising, as the contemporaneous relationshipbetween conict and Muslim per-capita expenditure is negative, a phenomenon well-documentedin studies that show that Muslims suffer disproportionately from religious violence in India. Inthe light of this fact, it is remarkable that the association between Muslim per-capita expendituresand subsequent conict is precisely reversed, and turns positive. Indeed, a rise in Muslim per-capita expenditures seems to increase conict starting from the very next year and for some yearsonwards. Relatedly, we discuss the question of endogeneity in some detail. We instrument for theratio of Muslim to Hindu expenditures using an index that we construct from data on occupationalstructure. Next, we use two-stage GMM estimation with lagged expenditure and our occupationalincome indices as joint instruments. In addition, we introduce controls for current conict. In all
of these exercises, our results persist. As a nal check, we show that a parallel investigation for allriots in India — which include but are by no means restricted to Hindu-Muslim riots — show nosystematic relationship between Muslim per-capita expenditures and conict. The relationship weuncover is specic to riots between two religious groups, and not conict in general.
Our preferred interpretation is based on the theory outlined in Section 3. But that theory can beplaced in a context. There are many case studies in which attacks on the Muslim community canbe traced to various forms of Muslim economic empowerment; see the references in Section 2.Moreover, we’ve shown in Section 5.3 that alternative theories, such as conict created by thefunding of Muslim groups, are not consistent with the available empirical evidence.
An ongoing (and not entirely coolheaded) conversation is invariably present in India over whichside is largely “at fault” when religious violence breaks out. This debate, as one might imagine,is politically and emotionally charged, and the “evidence” offered up in one reading is predictablychallenged by another. Some incidents, such as the demolition of the Babri Masjid in 1992 orthe attacks in Mumbai in 2008, are relatively clear-cut in the immediate identity of their initiators,though — to be sure — their antecedents may go back a long way. Other incidents can be traced tostill earlier incidents along the well-worn trail of revenge and retribution, and there is no clear-cutperpetrator.

8/12/2019 Implicaciones Economicas de La Teoria Del Conflicto
http://slidepdf.com/reader/full/implicaciones-economicas-de-la-teoria-del-conflicto 30/34
30
To some, the question of whether there is systematic perpetration by one group is a politicallyloaded question to which only an ideological answer is possible. No incident can be viewed in iso-lation, and it is easy enough to argue that a particular episode has roots that have been convenientlyignored by the ethnographer. Perhaps there is no such thing anyway as systematic perpetration “byone side”.
But — while important — it is unclear that all conict is driven by chicken-and-egg-like processes,with their original roots entirely lost in time. Those familiar with particular histories, such as themodern history of India, will know that there are group leaders on either side of the Hindu-Muslimconict that have systematically attempted to take advantage of inter-group tensions. To understandwhether one group has done so “more systematically” than the other is not just important from apolicy perspective, it is crucial to our intellectual understanding of the politics of a society, andto the policies that one must adopt. It is also important to note that we uncover an asymmetryin the sensitivity or response of violence to economic change. It is indeed possible that such anasymmetry can be compatible with a symmetric level of “baseline” violence perpetrated by bothgroups.
Finally, we do not believe that a particular religious group is intrinsically more predisposed to theuse of violence. In a parallel universe (or in another country) with a different social history and adifferent demography, the outcomes may well have been very different.
R EFERENCES
A ND R E , C. AND J-P H . PLATTEAU (1998), “Land Relations Under Unbearable Stress: RwandaCaught in the Malthusian Trap,” Journal of Economic Behavior and Organization 34, 1–47.
A RELLANO , M. AN D S. B OND (1991), “Some tests of specication for panel data: Monte Carloevidence and an application to employment equations.” Review of Economic Studies 58: 277-97.
A RELLANO , M. AND O. B OVER (1995), “Another look at the instrumental variables estimationof error–components models.” Journal of Econometrics 68: 29-51.
A. A ZEEZ AND M. B EGUM (2009), “Gulf Migration, Remittances and Economic Impact,” Journalof Social Sciences .
BAGCHI , A. (1990), “Predatory Commercialization and Communalism in India,” in S. Gopal (ed), Anatomy of a Confrontation , New Delhi: Penguin.
BASANT , R. (2012), “Education and Employment among Muslims in India: An Analysis of Pat-terns and Trends” W.P. No. 2012-09-03, Indian Institute of Management, Ahmedabad, India.
B LATTMAN , C. AND E . M IGUEL (2010), “Civil War,” Journal of Economic Literature 48, 3–57.
B LUNDELL , R., AN D S. BOND (1998), “Initial conditions and moment restrictions in dynamicpanel data models.” Journal of Econometrics 87: 115-143.
B OH R , A. AND S. CRISP (1996), “Kyrgyzstan and the Kyrgyz,” in G. Smith (ed.), The Nationali-ties Question in the Post-Soviet States , New York and London: Longman Publishers.

8/12/2019 Implicaciones Economicas de La Teoria Del Conflicto
http://slidepdf.com/reader/full/implicaciones-economicas-de-la-teoria-del-conflicto 31/34
31
C AMERON , A.C. AND P.K. T RIVEDI (2005), “Microeconometrics: Methods and Applications.”Cambridge: Cambridge University Press.
C HANDHOKE , N. (2009), “Civil Society in Conict Cities: The Case of Ahmedabad,” Crisis StatesResearch Centre Working Papers Series 2, 64. Crisis States Research Centre, London School of Economics and Political Science.
C OLLIER , P. AND A. H OEFFLER (1998), “On Economic Causes of Civil War,” Oxford EconomicPapers 50, 563–573.
C OLLIER , P. AND A. H OEFFLER (2004), “Greed and Grievance in Civil War,” Oxford EconomicPapers 56, 563–595.
DAS , S. (2000), “The 1992 Calcutta Riots in Historical Continuum: A Relapse into ‘CommunalFury’,” Modern Asian Studies 34, 301.
D UB E , O. AND J . VARGAS (2013), “Commodity Price Shocks and Civil Conict: Evidence fromColombia,” forthcoming, Review of Economic Studies .
D UFLO , E. AN D R . PANDE (2007), “Dams, Quarterly Journal of Economics 122 , 601–646.
E NGINEER , A. (1984), “The Causes of Communal Riots in the Post-Partition Period in India,”in A. Engineer (ed.), Communal Riots in Post-Independence India , Hyderabad: Sangam Books,33–41.
E NGINEER , A. (1994), “Communal Violence in Kanpur,” Economic and Political Weekly , Febru-ary 26, 473–474.
E STEBAN , J. AN D D. R AY (1999), “Conict and Distribution,” Journal of Economic Theory 87 ,379–415 (1999).
E STEBAN , J. A ND D. R AY (2007), “Polarization, Fractionalization and Conict,” Journal of Peace Research 45, 163–182 (2007).
E STEBAN , J. AN D D. R AY (2008), “On the Salience of Ethnic Conict,” American Economic Review 98, 2185–2202.
E STEBAN , J. AND D. R AY (2011), “A Model of Ethnic Conict,” Journal of the European Eco-nomic Association 9, 496–521.
F EARON , J. AND D. L AITIN (2003), “Ethnicity, Insurgency, and Civil War,” American PoliticalScience Review 97, 75–90.
F IELD , E., L EVINSON , M. , PANDE , R. AND S. V ISARIA (2008), “Segregation, Rent Control,
and Riots: The Economics of Religious Conict in an Indian City,” American Economic Review(Papers and Proceedings).
H OROWITZ , D. (2000), Ethnic Groups in Conict , Second Edition, University of California Press.
H OROWITZ , D. (2001), The Deadly Ethnic Riot , University of California Press.
H UBER , J. AND L . M AYORAL (2013), “Inequality, Ethnicity and Civil Conict,” mimeo., Institutode An alisis Econ omico, Barcelona.

8/12/2019 Implicaciones Economicas de La Teoria Del Conflicto
http://slidepdf.com/reader/full/implicaciones-economicas-de-la-teoria-del-conflicto 32/34
32
IYE R , L. AND Q-T. D O (2009), ”Geography, Poverty and Conict in Nepal,” forthcoming, Journalof Peace Research .
JHA , S. (2013), “Trade, Institutions and Ethnic Tolerance: Evidence from India,” forthcoming, American Political Science Review .
K HA N , D. (1992), “Meerut Riots: An Analysis,” in P. Kumar (ed.), Towards Understanding Com-munalism , Chandigarh: Centre for Research in Rural and Industrial Development, 465.
M AHADEVIA , D. (2002), “Communal Space over Life Space: Saga of Increasing Vulnerability inAhmedabad,” Economic and Political Weekly November 30, 4850–4358.
M IGUEL , E., S ATYANATH , S. AND E. SERGENTI (2004), “Economic Shocks and Civil Conict:An Instrumental Variables Approach, Journal of Political Economy 112 , 725–753.
M ONTALVO , J. AND M. R EYNAL -Q UEROL (2005), “Ethnic Polarization, Potential Conict, andCivil Wars,” American Economic Review 95, 796–813.
R AJGOPAL , P. (1987), Communal Riots in India , New Delhi: Uppal Publishing House/Centre forPolicy Research.
R AY , D. (2009), “Costly Conict Under Complete Information,” mimeo., Department of Econom-ics, New York University.
ROODMAN , D. (2006), “How to do Xtabond2: An Introduction to Difference and System GMMin Stata.” Stata Journal 9(1), StataCorp LP, 86–136
T HAKORE , D. (1993), “The Burning of Bombay,” Sunday , January 24–30, 28–37.
VARSHNEY , A. AND STEVEN W ILKINSON (2004). “Dataset on Hindu–Muslim Violence in India,Version 2.” October 8, 2004.
W ILKINSON , S. (2004), Votes and Violence: Electoral Competition and Ethnic Riots in India ,Cambridge: Cambridge University Press.
W INDMEIJER , F. (2005), “A nite sample correction for the variance of linear efcient two–stepGMM estimators.” Journal of Econometrics 126 : 25–51.
YAARI , M. (1969), “Some Remarks on Measures of Risk Aversion and on Their Uses,” Journal of Economic Theory 1, 315–329.
A PPENDIX
Proof of Observation 1. First we show that the protection function is downward-sloping. Recallthat d is chosen to minimize
α(µ − β ) p(d) + [c(d)/y ],
where µ − β > 0. Pick two values of α , call them α1 and α2, with α2 > α 1. Let d1 and d2 be twocorresponding minima. Certainly,
α1(µ − β ) p(d1) + [c(d1)/y ] ≤ α1(µ − β ) p(d2) + [c(d2)/y ],

8/12/2019 Implicaciones Economicas de La Teoria Del Conflicto
http://slidepdf.com/reader/full/implicaciones-economicas-de-la-teoria-del-conflicto 33/34
33
while at the same time,
α2(µ − β ) p(d2) + [c(d2)/y ] ≤ α2(µ − β ) p(d1) + [c(d1)/y ],Combining these two inequalities, we must conclude that
(α2 − α1)[ p(d2) − p(d1)] ≤ 0.
It follows that p(d2) ≤ p(d1), as required.
The fact that the attack function is (weakly) increasing is an immediate consequence of (2). It willbe strictly increasing when the cdf F is strictly increasing everywhere.
Finally, the graphs of both functions can be made continuous by spreading individuals in differ-ent proportions over their optimal actions (in case the best-response is multi-valued somewhere).Moreover, the relevant endpoint conditions are met. So a unique equilibrium exists.
Proof of Proposition 2 . Note that the condition for participatory violence is given by
(1 − p)([1 − t]z )1− σ
1 − σ + p
([1 − t]z + λy)1− σ
1 − σ ≥
z 1− σ
1 − σ,
and dividing through by [(1 − t)z ]1− σ on both sides, we get
(3) 1 − p
1 − σ + p
1 + λy(1 − t )z
1− σ
1 − σ ≥
1(1 − t)1− σ .
We see immediately from (3) that there exists a unique threshold value z ∗ such that participatoryviolence is preferable to peace for z < z ∗ , while the opposite is true when z > z ∗ .
When f is proportional to z , exactly the same observation goes through for funded violence. Sim-ply dene t ≡ f /z , and apply the previous argument.
Proof of Proposition 3 . (a) Funded violence uses a payment of f to achieve the same probabilisticresult that participatory violence achieves for a payment of tz . It follows that the former will bepreferred to the latter if and only if z > f /t .
(b) The proposition asserts that if funded violence dominates peace for some z , then it does so forall z > z . This is equivalent to the condition of nonincreasing global risk aversion; see Axiom V inYaari (1969). By Remark 7 and the subsequent discussion on pp. 326–327, we see that decreasingabsolute risk aversion (DARA) in the sense of Arrow implies Axiom V. But our utility functionsatises DARA.
(c) Follows from the same argument as in the proof of Proposition 2.

8/12/2019 Implicaciones Economicas de La Teoria Del Conflicto
http://slidepdf.com/reader/full/implicaciones-economicas-de-la-teoria-del-conflicto 34/34
34
State Region Code Casualties M/H Exp.Period I Period II Period III Period I Period II Period III
Andhra Pradesh Coastal AP1 0 3 0 1.004507 1.091982 .9764359Andhra Pradesh Inland Northern AP2 312 220 141 1.038641 .9156198 1.064655Andhra Pradesh South Western AP3 8 0 0 .9166893 1.052765 1.196671Andhra Pradesh Inland Southern AP4 0 3 0 .9912738 .8575357 .8631487
Bihar Southern BI1 16 38 31 1.069841 .8966287 .8629227Bihar Northern BI2 45 166 155 .8955503 .9364876 .9712139Bihar Central BI3 1 443 1 1.14185 .984996 1.072345
Gujarat Eastern GU1 13 829 16 .842355 1.277648 1.138291Gujarat Plains Northern GU2 1526 911 1 1.117543 1.045082 .882774Gujarat Plains Southern GU3 311 174 0 .8843232 .8737228 1.00092Gujarat Dry Areas GU4 26 7 0 1.054092 .9967834 1.002777Gujarat Saurashtra GU5 56 7 622 .8979987 .9043204 .8817747
Haryana Eastern HAR1 0 6 0 .9330744 .9526062 .7195345Haryana Western HAR2 0 0 0 .653703 1.174521 .5173813
Karnataka Coastal & Ghat KTK1 0 48 36 .8412368 1.201041 1.45227Karnataka Inland Eastern KTK2 50 2 12 1.189586 .9304261 .9984706Karnataka Inland Southern KTK3 181 200 81 .9829123 .9992417 1.096229Karnataka Inland Northern KTK4 69 180 106 1.057045 .9818084 .869728
Kerala Northern KE1 0 6 0 .8434259 .8615004 .8620393
Kerala Southern KE2 17 36 0 .9358429 .871028 1.088838Madhya Pradesh Chattisgarh MP1 0 25 0 1.277899 1.407446 1.614995Madhya Pradesh Vindhya MP2 0 0 0 .9776053 1.090256 1.155049Madhya Pradesh Central MP3 43 507 0 .977567 1.032186 .9767985Madhya Pradesh Malwa Plateau MP4 62 228 0 1.274306 1.123192 .8642549Madhya Pradesh South Central MP5 0 0 0 .9756939 .9741977 1.134518Madhya Pradesh South Western MP6 34 34 0 1.119037 1 .413961 1.221877Madhya Pradesh Northern MP7 0 0 0 .7267752 .9629654 .9172089
Maharashtra Coastal MAH1 621 2447 51 .9742841 1.171711 .9900791Maharashtra Inland Western MAH2 162 25 0 .9499936 .8866885 .8947135Maharashtra Inland Northern MAH3 136 47 165 .7971309 .7896825 .9842166Maharashtra Inland Central MAH4 197 20 44 .9700853 .8033 .8699216Maharashtra Inland Eastern MAH5 134 6 0 1.035705 .7726147 .7019697Maharashtra Eastern MAH6 0 0 0 .9955956 1.348744 1.151897
Orissa Coastal OR1 0 62 0 .965429 1.100203 .8838249Orissa Southern OR2 0 0 0 2.282952 1.717748 .9707198Orissa Northern OR3 0 0 0 2.758474 1.07864 1.375739Punjab Northern PU1 13 0 0 1.325563 .819111 .9253177Punjab Southern PU2 0 0 0 .8700712 .8409578 .7445471
Rajasthan Western RJ1 6 37 0 .9857437 .8666831 .839959Rajasthan North Eastern RJ2 0 161 66 .8458781 .8425692 .7995163Rajasthan Southern RJ3 8 21 0 2.316313 2.172886 .9456905Rajasthan South Eastern RJ4 0 83 0 1.026613 1.090762 .7404696
Tamil Nadu Coastal Northern TN1 21 82 51 1.16093 1.05886 1.035249Tamil Nadu Coastal TN2 0 0 0 1.213718 1.238767 1.170456Tamil Nadu Southern TN3 0 43 1 .6930835 1.060303 .9730101Tamil Nadu Inland TN4 0 0 15 .8313742 1.226216 .9505917
Uttar Pradesh Himalayan UP1 0 0 0 .8449162 .6477033 .8109938Uttar Pradesh Western UP2 628 812 90 .8156493 .8381398 .8111452
Uttar Pradesh Central UP3 100 140 68 .9139733 .8625087 1.042183Uttar Pradesh Eastern UP4 235 103 59 .989118 1.051022 1.073385Uttar Pradesh Southern UP5 0 0 0 .9527379 .9129332 .7660533West Bengal Himalayan WB1 0 0 0 .8492237 .8596027 .93025West Bengal Eastern Plains WB2 58 0 0 .791344 .8848535 .9269146West Bengal Central Plains WB3 13 139 0 .8389444 .7647896 .7248861West Bengal Western Plains WB4 0 9 0 .9558726 .951232 .8094822
TABLE 7. Regional level Descriptive Statistics: Sources and Notes. Varshney-Wilkinson