Implementing pest management of diamondback …...for control and feeds on undersides of leaves...
315
Implementing pest management of diamondback moth Greg Baker SA Research & Development Institute Project Number: VG00055
Transcript of Implementing pest management of diamondback …...for control and feeds on undersides of leaves...

Implementing pest management of
diamondback moth
Greg Baker SA Research &
Development Institute
Project Number: VG00055
danikah
Stamp

VG00055 This report is published by Horticulture Australia Ltd to pass on information concerning horticultural research and development undertaken for the vegetable industry. The research contained in this report was funded by Horticulture Australia Ltd with the financial support of Syngenta, Aventis Crop Science Pty Ltd, Dow AgroSciences Australia Ltd (NSW), NuFarm Limited, Department of Natural Resources & Environment and the vegetable industry. All expressions of opinion are not to be regarded as expressing the opinion of Horticulture Australia Ltd or any authority of the Australian Government. The Company and the Australian Government accept no responsibility for any of the opinions or the accuracy of the information contained in this report and readers should rely upon their own enquiries in making decisions concerning their own interests. ISBN 0 7341 0980 6 Published and distributed by: Horticultural Australia Ltd Level 1 50 Carrington Street Sydney NSW 2000 Telephone: (02) 8295 2300 Fax: (02) 8295 2399 E-Mail: [email protected] © Copyright 2004

1
Horticulture Australia Limited
PROJECT VG00055 (30 June 2003) – FINAL REPORT
Implementing Pest Management of Diamondback Moth
Greg Baker et al.
Research Providers: South Australian Research and Development Institute Department of Primary Industries, Victoria University of Adelaide Queensland Department of Primary Industries Department of Agriculture, WA Department of Primary Industries, Water and Environment, Tasmania NSW Agriculture
January 2004

2
HAL Project VG00055 Project Leader: Greg Baker Entomology Unit SARDI GPO Box 397 Adelaide SA 5001 Phone: +61-8-8303-9544 Fax: +61-8-8303-9542 Email: [email protected] This report details the research and extension delivery undertaken in Project VG00055 on the integrated management of diamondback moth, Plutella xylostella (L.), and other pests of Australian brassica vegetable crops. Main findings, industry outcomes and recommendations to industry along with suggested areas of future research are discussed. January 2004 HAL Disclaimer: Any recommendations contained in this publication do not necessarily represent current Horticulture Australia policy. No person should act on the basis of the contents of this publication, whether as to matters of fact or opinion or other content, without first obtaining specific, independent professional advice in respect of the matters set out in this publication. South Australian Research and Development Institute Disclaimer: IMPORTANT NOTICE. This report is intended as a source of information only. Although SARDI has taken all reasonable care in preparing this report, neither SARDI nor its officers accept any liability resulting from the interpretation or use of the information set out in this report. Information contained in this report is subject to change without notice. The report is not intended for publication or distribution to any other person or organisation.

3
ACKNOWLEDGMENTS The Project Team acknowledge the funding provided by Horticulture Australia Limited, the Australian brassica vegetable growers through the AUSVEG levy, Aventis CropScience, BASF Australia Ltd, CropCare Australasia, Dow AgroSciences Australia Ltd, DuPont (Australia) Ltd, NuFarm Ltd, Sumitomo Chemical and Syngenta Crop Protection Pty Limited. Support from the participating institutions, South Australian Research and Development Institute; Department of Primary Industries, Victoria; University of Adelaide; Queensland Department of Primary Industries; Department of Agriculture WA; Department of Primary Industries, Water and Environment, Tasmania; and NSW Agriculture, is also acknowledged. In addition, the Project team wish to recognize the invaluable assistance provided by members of the AUSVEG Brassica Grower in helping guide and oversee the direction of this project, and the generous support of the Vegetable IDO’s, particularly Craig Feutrill (Brassica IDO), and of the numerous growers who co-operated with field trials, field days, etc. Specific acknowledgments are provided at the end of each research and extension report. The Project leader thanks the team members for their willing co-operation and openness throughout the Project. Without this goodwill the achievements of this Project would have been substantially diminished. THE PROJECT TEAM Greg Baker (SARDI) Françoise Berlandier (WADA) Nancy Endersby (DPI Victoria) Lionel Hill (DPIWE Tasmania) Leigh James (NSW Agriculture) Dijana Jevremov (SARDI) Mike Keller (Adelaide University) Peter Ridland (DPI Victoria) Nancy Schellhorn (SARDI) Bronwyn Walsh (QDPI) Felicity Wardlaw (DPIWE Tasmania)

4
CONTENTS Media Summary--------------------------------------------------------------------------------------- 6 Technical Summary ---------------------------------------------------------------------------------- 7 Introduction-------------------------------------------------------------------------------------------10 Research Reports ------------------------------------------------------------------------------------14 Scouting Crop Scouting Research NANCY SCHELLHORN, CATE PAULL AND ANDREW HAMILTON --------12 WA Report on Crop Scouting FRANÇOISE BERLANDIER-------------------------------------------------------------22 Insecticide Resistance Management National Insecticide Resistance Testing Program for Diamondback Moth, 2000-2003 NANCY ENDERSBY, PETER RIDLAND AND JINGYE ZHANG ---------------26
The AIRAC “Two-Window” Insecticide Resistance Management Strategy, 2000-2003 GREG BAKER ------------------------------------------------------------------------------33
WA Report on The AIRAC “Two-Window” Insecticide Resistance Management Strategy FRANÇOISE BERLANDIER-------------------------------------------------------------40 Movement On-Farm Movement of Moths and Parasitoids NANCY SCHELLHORN, CATE PAULL AND GITA SIEKMANN --------------41 Property-to-Property Movement NANCY SCHELLHORN, LOU MARATOS AND JUDY BELLATI --------------44 Natural Enemies Managing Natural Enemies MICHAEL KELLER -----------------------------------------------------------------------50 The Impact of Parasitoid Wasps on Plutella xylostella in Perth, WA FRANÇOISE BERLANDIER AND DAVID COUSINS -----------------------------62
Dissemination of the Biological Control Agent, Trichogramma, on Brassica Vegetable Seedlings
PETER RIDLAND AND SWARNA HEWA-KAPUGE------------------------------70 Insecticides Adulticidal Activity of Insecticides NANCY SCHELLHORN, CATE PAULL AND LOU MARATOS-----------------76
The Influence of Temperature on the Performance of Five New Insecticides for DBM Control GREG BAKER AND KEVIN POWIS---------------------------------------------------80
Pest Control Using Imidacloprid as an Insecticidal Dip for Brassica Vegetable Seedlings BRONWYN WALSH AND MIKE FURLONG----------------------------------------84

5
Cultivar Effects
Cultivar Effects on Oviposition Preference, Larval Feeding and Development Time of DBM ANDREW HAMILTON, NANCY ENDERSBY, PETER RIDLAND AND MELISSA NEAL-------------------------------------------------------------------------------------------------93
Extension Activities-------------------------------------------------------------------------------- 101 APPENDIX A: Journal of Economic Entomology manuscript “A dynamic binomial sequential sampling plan for Plutella xylostella on broccoli and cauliflower in Australia.” - 113 APPENDIX B: NSW DBM Scouting Project – Mary Cannard, University of Western Sydney.------------------------------------------------------------------------------------------------- 123 APPENDIX C: 1999/2000 Bioassay Results For National Insecticide Resistance Testing Program. ------------------------------------------------------------------------------------- 126 APPENDIX D: 2000/2001 Bioassay Results For National Insecticide Resistance Testing Program. ------------------------------------------------------------------------------------- 147 APPENDIX E: 2001/2002 Bioassay Results For National Insecticide Resistance Testing Program. ------------------------------------------------------------------------------------- 166 APPENDIX F: 2002/2003 Bioassay Results For National Insecticide Resistance Testing Program. ------------------------------------------------------------------------------------- 186 APPENDIX G: International Journal of Pest Management manuscript “The use of dusts and dyes to mark populations of beneficial insects in the field.” ------------------------- 200 APPENDIX H: The role of surrounding vegetation and refuges: Increasing the effectiveness of predators and parasitoids in cotton and broccoli systems. ---------------------------- 214 APPENDIX I: The Communication Plan ---------------------------------------------- 223 APPENDIX J: Workshops --------------------------------------------------------------- 237 APPENDIX K: Press releases, media items, factsheets------------------------------ 244 APPENDIX L: Team and R&D Committee meetings ------------------------------- 259 APPENDIX M: Newsletters & IPM Brochure ---------------------------------------- 273 APPENDIX N: Handbook modules----------------------------------------------------- 285 APPENDIX O: Surveys ------------------------------------------------------------------ 289

6
MEDIA SUMMARY Diamondback moth (DBM) is a key Brassica pest with a marked ability to rapidly become resistant to insecticides. Building on the foundations laid in project VG97014 this project aimed to improve the cost-effectiveness of DBM control with sound insecticide resistance management (IRM) tactics and to increase the adoption of integrated pest management (IPM) based on crop monitoring and conservation of natural enemies. The key outcomes were:
• A substantial improvement in the awareness and adoption of good IPM and IRM principles and practices by Australian Brassica vegetable growers.
• A major investment in extension activities, focused through grower consultation. Products include a ‘Brassica IPM National Newsletter’, an insecticide toxicity chart, an IPM brochure for community education, 45 grower workshops, 78 articles and 36 media reports.
• A new crop-monitoring guide that helps growers and consultants make informed decisions about pest control, incorporates benefits from natural enemies, and saves pest control costs while still delivering a high quality crop. This guide is explicitly linked with the IRM strategy and Insecticide Toxicity Chart and can be used as a complete IPM/IRM package.
• A national DBM resistance-screening program has revealed declines in resistance levels to old insecticides and no evidence of changes in susceptibility to new insecticides.
• DBM and parasitoid dispersal studies suggest that mature harvested plants can be left in the field to act as a nursery for producing parasitoids that will disperse more widely and readily on-farm than DBM.
• The finding that a low frequency of DBM are moving between properties underscores that the best chance growers have to delay resistance to the new insecticides is by following the “two-window” IRM strategy.
• Spraying insecticides to kill moths is an ineffective strategy that may in fact increase the rate of resistance.
These developments are improving the economics of Brassica vegetable production, increasing the lifespan of the new DBM insecticides, enhancing the benefits from natural enemies, and improving worksafe outcomes and consumer attitudes through reduced reliance on sprays.
Future R&D is required on regional movement of DBM to integrate IPM/IRM between the Brassica oilseed, forage and vegetable industries, an in-field parasitism detection kit, integration of IPM for other Brassica pests, better management of the natural enemy complex, and to further educate growers and chemical resellers on Brassica IPM/IRM. The Key recommendations to industry are to monitor crops to make an informed spray decision, if a spray is needed to follow the IRM strategy, and to conserve natural enemies by choosing insecticides that are soft to beneficials but effective against DBM.

7
TECHNICAL SUMMARY The Problem Diamondback moth (DBM), Plutella xylostella (L.), is the most destructive pest of Brassica vegetables in Australia. It is difficult to control with insecticides because it has fast development, overlapping generations, continually available host-plants, low threshold numbers for control and feeds on undersides of leaves thereby avoiding spray deposits. Further, DBM rapidly evolves insecticide resistance, and control by natural enemies is disrupted due to the lack of integrated pest management (IPM) programs to more effectively deal with the problem. This project aimed to provide Brassica growers with improved IPM tools, which are more cost-effective, limit insecticide resistance and conserve and better incorporate natural enemies into the management system, as well as responding to consumer and worksafe concerns about pesticides. The Project Science The research focused in a number of key areas:
• The development and validation of a dynamic crop-monitoring guide, which assesses the need to spray based on the number of plants infested with DBM larvae, the crop type, market destination, the stage of crop development and parasitism levels, and interfaces well with the insecticide resistance management (IRM) strategy and Insecticide Toxicity Chart.
• The annual insecticide-resistance screening of DBM populations, collected from vegetable districts in each State, against ten insecticides, including the five new chemistries and Bacillus thuringiensis var kurstaki.
• Studies of on-farm and farm-to-farm movement of DBM and natural enemies using fluorescent dyes to mark field populations.
• Investigations to demonstrate the benefits of planting flowers that provide nectar to natural enemies, and to devise tactics using specific flowering plants to enhance natural enemy performance in Brassica vegetable systems.
• Assessment of the likely impact of targeting DBM sprays at the moth life-stage. • Assessment of the effect of temperature on the efficacy of the five new DBM
insecticides. • Assessment of the efficacy of an imidacloprid seedling dip for the control of several
difficult-to-control early-season Brassica pests in QLD. • A proof-of-concept study to disseminate a DBM parasitoid (Trichogramma pretiosum)
with seedling transplants. • A study of the comparative susceptibility of popular Brassica vegetable cultivars to
DBM.
The Key Research Findings, Extension Highlights and Industry Outcomes • The new crop monitoring guide, which can be accessed at http://www.dpi.vic.gov.au/
(Click on ‘Agriculture & Food’), improves upon the scouting threshold and action chart developed in VG97014, and:
o helps agronomists and growers make more informed decisions about DBM control,
o saves money for growers by reducing spray costs while still delivering a high quality crop, and
o links to the IRM strategy and Insecticide Toxicity Chart. • Surveys revealed that the adoption of crop monitoring and the “two-window” IRM
strategy in the Brassica industry is increasing. This is assisting growers to control DBM and other key pests more cost-effectively and with less selection pressure for resistance.

8
o Annually updated, regionally specific versions of the “two-window” IRM strategy have been distributed to growers, consultants and re-sellers. When each new window begins, a fax or mail-out reminder is sent directly to growers and consultants.
• Insecticide resistance screening of DBM populations from around the nation identified widespread synthetic pyrethroid resistance. With the exception of some reduced susceptibility to fipronil in a QLD population, there was no evidence of any shift in susceptibility in any of the screened populations to the new DBM insecticides and Bacillus thuringiensis.
• Studies of the local movement of DBM and its parasitoids have revealed that in actively growing crops most DBM moths remain within several tens of metres of where they emerged, and their parasitoids move greater distances. Following crop cultivation disturbance, more of the parasitoids dispersed than before cultivation, suggesting that disturbance increased parasitoid movement, which was not the case for DBM.
o These findings have important implications for IRM and the development of new ways to better integrate beneficials into the cropping system.
They suggest that mature harvested plants can be left in the field to act as a nursery crop for producing parasitoids that will disperse more widely and readily than DBM.
• Property-to-property movement studies show that a low frequency of DBM and beneficials are moving between properties even when host plants are available on the property of origin.
o Given that some moths are moving between properties, the best chance that growers have to delay resistance is by following the “two-window” IRM strategy.
o These estimates of moth movement can be used to model development and dilution of resistance in DBM populations to further improve the Brassica industry’s IRM tactics.
• Parasitoids are more active and live longer when they have access to nectar sources. However, field experiments to test the benefits of planting flowers that provide nectar to natural enemies have been unable to demonstrate a significant effect.
o Some Brassica growers are already planting alyssum as a nectar source among their crops, and other growers are leaving mature crop stands to flower. Although this can't be recommended with confidence, it is expected that levels of control by parasitoids should be greater and parasitism more reliable when floral nectar is available.
• To enhance Brassica IPM, an Insecticide Toxicity Chart has been developed that allows growers to select products with minimal impact on natural enemies.
o This chart, together with the IRM strategy flyer and the crop monitoring guide, provide the Australian Brassica vegetable industry with a comprehensive package for pest and natural enemy management.
• Spraying insecticides to kill DBM moths is an ineffective strategy that may in fact increase the selection rate for insecticide resistance.
• Lab bioassays indicate that at temperatures as low as 15°C there appears to be no practical impairment of the efficacy of the five new DBM insecticides.
• QLD trials indicate that imidacloprid may be an effective seedling-dip treatment against difficult-to-control, early-season brassica pests such as thrips, cabbage centre grub, silverleaf whitefly and DBM.
• An attempt to enhance the field biocontrol of DBM by developing a parasitoid dissemination system using seedling transplants has proven unsuccessful.
• A study of the DBM susceptibility of common Brassica vegetable cultivars found there was no oviposition preference by DBM for seedlings of any of the popular broccoli or

9
cauliflower varieties tested. Of the cabbages tested in a larval feeding study, Green Coronet was significantly more susceptible to feeding damage than Savoy King, and the development time of larvae on Green Coronet was shorter.
• Thorough grower and community consultation has focused the project’s extension effort and produced:
o the Project Communication Plan, o the ‘Brassica IPM National Newsletter’, o 45 workshops, including presentations by international Brassica IPM experts, o novel promotion techniques for boosting workshop attendance, o 22 press releases, 67 articles published, 13 radio interviews, 11 fact sheets and
one television appearance, o a colour IPM brochure for community education, o numerous handouts and mailouts to growers and consultants, including a
laminated DBM lifecycle chart and new modules for the project Handbook ‘Integrated Management of DBM in Crucifers’,
o a survey which indicated community support for reduced pesticide use, despite the possibility of encountering pest contamination of produce.
Recommendations That Brassica vegetable growers:
• make spray decisions based on the new crop-monitoring guide, • adhere to the AIRAC ‘two-window” IRM strategy, • spray to target larvae rather than moths, and • consult the Insecticide Toxicity Chart and choose insecticides that are soft on natural
enemies. Contribution to New Technology The new crop-monitoring guide and the Insecticide Toxicity Chart. The crop-monitoring guide, each State’s IRM strategy and the Insecticide Toxicity Chart can be accessed at http://www.dpi.vic.gov.au/ (Click on ‘Agriculture & Food’, then ‘Plant Disease & Pests’).

10
INTRODUCTION Historical background to project Diamondback moth (DBM) is the most destructive pest of Brassica vegetables worldwide, including Australia. Damage is caused by larvae tunnelling into the heads of cabbage and Brussels sprouts and by pupal contamination inside cauliflower and broccoli florets. In extreme cases, produce is rendered unmarketable and damaged crops are ploughed in. For the past 50 years the principal control tactic for DBM has been the use of synthetic insecticides. These treatments invariably disrupt natural enemies, and select for insecticide resistance in DBM. Due to the progressive development of synthetic pyrethroid (SP) and organophosphate (OP) resistance in Australia in the 1980’s and 1990’s, it became necessary to spray more frequently to achieve control of DBM. Growers found themselves on a “chemical treadmill”. Despite the increased spraying, crop losses due to DBM attack continued, often on a larger scale than previously experienced. In the late 1990’s two important developments occurred in Australia. Firstly, a national industry-funded (HRDC levy) project (VG97014) to advance the integrated management of DBM in Brassica vegetables was initiated. Secondly, five new DBM insecticides were sequentially registered for use in Brassica vegetable crops. These insecticides each have different modes of action and metabolism, and several are relatively safe to natural enemies. These developments provided a unique opportunity to improve DBM management and to limit the further development of insecticide resistance by DBM and other Brassica pests. Project VG97014 devised and promoted a “two-window” insecticide resistance management (IRM) strategy in conjunction with AVCARE, and promoted integrated pest management (IPM) as a method for dealing with Brassica pests. Several things were actively promoted: the strategic use of insecticides with timing of applications based on information gained through crop monitoring, techniques to achieve good spray coverage, the avoidance of tank mixes of multiple insecticides, the use of clean seedlings, the maintenance of vigorous plants to resist pests and diseases and the use of crop breaks to reduce DBM numbers and levels of insecticide resistance. Research into DBM movement between vegetable crops was initiated to improve future IPM and IRM systems. Why it was undertaken VG97014 took the first steps in making growers aware of DBM’s biology and the potential for improving its management and reducing spraying through crop monitoring. Growers were able to realize short-term benefits by improving spray application, substituting the new insecticides and Bacillus thuringiensis for the old insecticides, and the long-term benefit of an extended lifespan for the new insecticides by adhering to the “two-window” IRM strategy. The next step for VG00055 was to enhance the biological components of the IPM program, and to provide more IPM/IRM tools. Significance for industry Project VG00055 has directed significant resources into the delivery of workshops and field days, print media information and the support of crop monitoring. Grower awareness and interest in crop monitoring and the role of natural enemies has been stimulated. The practice of record-based monitoring, albeit still limited across the industry, is increasing. Growers have a new awareness and interest in ‘softer’ insecticides to help conserve natural enemies. Further, industry awareness of the threat of insecticide resistance has been significantly raised, and the majority of growers are complying with the “two-window” IRM strategy. The findings of the

11
project’s national insecticide resistance-screening program indicate that levels of SP and OP resistance have substantially diminished, and nil evidence of any shifts in susceptibility to the new insecticides. To improve the IPM/IRM package available to the industry, research was focused on a new crop monitoring plan, the extent and direction of DBM and parasitoid dispersal, and assessment and enhancement of natural enemies. Aims The broad objectives of the project were to enhance the competitive advantage of the Australian Brassica vegetable industry by improving the cost-effectiveness of DBM control with sound IRM tactics and increased adoption of IPM based on crop monitoring and conservation of natural enemies.

12
CROP SCOUTING RESEARCH Nancy A. Schellhorn1, Cate Paull1 and Andrew Hamilton2 1South Australian Research and Development Institute, GPO Box 397, Adelaide, SA 5001, Australia. 2Primary Industries Research Victoria—Knoxfield, Private Bag 15, Ferntree Gully Delivery Centre, Victoria 3156, Australia. Background: Crop scouting for diamondback moth (DBM) is a major component of integrated pest management (IPM) and more cost effective than calendar based spray programs. A sequential presence-absence scouting plan was developed by Mo et al. (2000), as part of HAL Project VG97014, to minimise the time it takes to scout yet accurately estimate DBM populations and make decisions about applying insecticides. We evaluated the Mo et al. (2000) plan, tested new thresholds, developed a new more comprehensive plan, and validated the plan. Methods: Evaluation of Scouting Plan
We evaluated the presence-absence scouting plan in cauliflower, broccoli and Brussels sprouts to: a) note if the threshold was appropriate for all three crops and for all growth stages of the crops, b) raise thresholds and monitor DBM and parasitoid populations, where appropriate, c) assess harvested produce, by measuring insect contamination, and d) document the time it took to sample.
We sampled fifty plants every 5-7 days in each of three crops. On several occasions we sampled plants for insects using the presence-absence scouting plan followed by enumerating populations. For the cauliflower crops, two treatments were compared, one conventional with weekly sprays (including Dominex®, Delphin®, Endosulfan, MVP®, and Avatar® for the last two sprays) and one IPM where we chose to spray based on crop health, parasitoid density and development stage (the same chemicals were used as in the conventional crop only less frequent). The DBM populations in the IPM crops were allowed to increase far above thresholds to help us understand the response by the parasitoids and the plants to damage. Therefore insecticides were used sparingly. For broccoli, we sampled the IPM crop throughout the growing season, but we harvested both conventional and IPM crops to compare weight and contamination. The cauliflower crops each measured 100 m x 12 m, the broccoli crop measured 250 m x 12 m, both located on a 10 Ha property with continual brassica vegetable production located in St. Kilda, SA. At harvest fifty broccoli and cauliflower heads from each treatment (200 total) were assessed for contamination in the form of DBM larvae and pupae, frass, and pupae of the DBM parasitoids Diadegma semiclausum and Apanteles ippeus.
For Brussels sprouts, we sampled 40-50 bushes in a 0.25 Ha of a northeast corner of a 6 Ha stand on a property in the Adelaide Hills in Nairne, SA. Because the sprout is more vulnerable to DBM damage, and we rarely saw any parasitoids or predators, we followed the threshold and action chart closely. Harvest data could not be recorded due to error in mixing trial and non-trial sprouts. However, reports by the owner suggested that the crop was clean and sold as high quality.

13
Testing New Thresholds In an effort to refine the original scouting plan developed by Mo et al. (2000), we have tested new threshold guidelines for broccoli to determine if: 1) we could raise the threshold without causing a reduction in plant quality in the form of yield loss, cosmetic damage and insect contamination, 2) vary the threshold according to crop stage, 3) incorporate the information from scouting into a more comprehensive decision making plan.
We sampled 20-25 plants every 7-12 days in broccoli and cauliflower. Three treatments were compared, plant infestation thresholds of 30%, and 60% (followed by 15% when floret is visible) and a no spray treatment. We sampled plants for insects using the presence-absence scouting plan (eg. number of plants infested) followed by enumerating DBM larvae, and pupae, Pieris rapae (cabbage white butterfly) larvae and parasitoid pupae. At the time of sampling we collected DBM larvae that were dissected to assess parasitism (although not discussed here, this information will also contribute to the initial stages to determine how to incorporate parasitism into decision-making). At harvest we dissected 40 broccoli and 20 cauliflower per treatment and measured plant weight, cosmetic damage such as scaring and frass (insect faeces), and contamination from DBM larvae, pupae, P. rapae larvae and pupae, and parasitoid pupae. Development of New Plan Based on the results from the evaluation of the new scouting plan and testing new thresholds we (Drs. Schellhorn and Hamilton) developed a more comprehensive scouting plan to be used as a decision-making tool for DBM control. We developed an expert system, designed as a decision tree. The new sampling plan was a binomial plan where we were only interested whether a plant was infested with grubs or not: we did not care how many ‘grubs’ there were on a plant. However, the plan was unique in that it incorporated the brassica variety, growth stage of the crop, market destination, insecticides used and parasitism rate. This plan has been accepted for publication in the Journal of Economic Entomology and the galley proofs are attached as Appendix A. Validation of New Plan To make sure that the plan was practical and applicable to the numerous brassica-growing regions around the country, it was tested and subsequently revised by collaborators from NSW, SA and WA. In NSW, Mary Canard – University of Western Sydney tested the plan on a cauliflower crop in early March 2002, and Gus Campbell – NSW Agriculture tested the plan on three cauliflower crops on two properties from early December until early May. In WA, Françoise Berlandier tested the plan on three crops, cabbage, cauliflower and broccoli from late October until early January 2003. In SA, John Jeffs tested the plan on three crops, broccoli, cauliflower and cabbage from early December until May 2003. In some instances at harvest plants were evaluated for damage and insect contaminants.

14
Results: Evaluation of Scouting Plan Throughout the growing season DBM populations were almost always above the spray threshold for cauliflower and broccoli even with weekly insecticide sprays. The DBM larval and parasitoid populations were higher on the IPM cauliflower crop compared to the conventional one (Fig 1 and 2). Pupal parasitoid populations were also higher (Fig 3). .
Although the larval DBM densities were higher and insecticide use was different between the conventional and IPM cauliflower, there was no difference in the distribution of total contaminants (X2=1.34, df=1, P>0.246; Fig 4).
In broccoli, DBM larval populations were initially high when we first began enumerating in conjunction with presence-absence sampling (Fig 5). Based on crop appearance, and to monitor parasitoid populations, we last sprayed insecticide on 3 March, five weeks prior to harvesting. This lead to higher mean number of contaminants compared to the conventional broccoli (one-way ANOVA, Tukeys mean comparison; Fig. 6).
Fig. 1. “IPM” cauliflower. Arrows above line denote insecticide sprays. Lines with solid squares denote sampling events above or below threshold based on presence-absence plan, and lines with open circles denote density.
Fig. 2. Conventional cauliflower. Symbols same as fig1.
Fig. 3. Pupal parasitism on cauliflower by D. semiclausum and A. ippeus
Fig. 4. Harvested cauliflower. Total contamination from DBM larvae and pupae, and D. semiclausum and A. ippeus pupae
0
0.5
1
1.5
2
2.5
3
3.5
25-Ja
n-01
1-Feb
-01
8-Feb
-01
15-F
eb-01
22-F
eb-01
1-Mar-
01
8-Mar-
01
15-M
ar-01
22-M
ar-01
29-M
ar-01
Mea
n Pa
rasi
tism
per
Pla
nt
IPMConv
0
1
2
3
4
11-Jan-0
1
17-Ja
n-01
25-Ja
n-01
30-Ja
n-01
2-Feb-0
1
6-Feb
-01
12-F
eb-01
19-Feb-0
1
27-Feb-0
1
5-Mar-0
1
19-Mar-
01
3-Apr-0
1
Thr
esho
ld
0
1
2
3
4
5
6
7
8
9
Mea
n N
um
ber
La
rvae
pe
r P
lan
t
05
101520253035404550
0 1 2 3
Total Contaminants
Num
ber o
f Pla
nts
IPMConv
.
0
1
2
3
4
17-Jan-01
22-Jan-01
25-Jan-01
30-Jan-01
2-Feb-01
6-Feb-01
12-Feb-01
19-Feb-01
27-Feb-01
5-Mar-0
1
14-Mar-0
1
19-Mar-0
1
26-Mar-0
1
3-Apr-0
1
Thr
esho
ld
0
1
2
3
4
5
6
7
8
9
Mea
n N
umbe
r La
rvae
per
Pla
nt

15
For Brussels sprouts, DBM larval populations remained very low for the duration of our sampling. Insecticide [MVP® (encapsulated Bacillus thuringiensis) and dimethoate] was applied on two occasions prior to when we started sampling, but was only applied two times after that. Using the presence-absence scouting plan for cauliflower, broccoli and Brussels sprout crops it takes ca. 40 minutes per 50 plants, ca. 10 minutes less if densities are high, and 10 minutes more when densities are low. Testing New Thresholds-Broccoli By the second time we sampled (6 November), DBM larval density was 3.9 + 2.4 (mean + SD) per plant (Fig. 8), the number of plants infested was above the 30% threshold (Fig. 9), and parasitism rate was 81% (Fig 10).
Fig. 5. IPM broccoli. Symbols same as fig 1.
Fig. 6. Mean number of contaminants on harvested broccoli. *** =P < 0.001, ** = P < 0.01, * = P < 0.05; n=50
Fig. 7. Brussels sprouts sampling using presence-absence scouting
0
1
2
3
4
17-J
an-0
1
31-J
an-0
1
14-F
eb-0
1
28-F
eb-0
1
14-M
ar-0
1
28-M
ar-0
1
11-A
pr-0
1
25-A
pr-0
1
9-M
ay-0
1
Thr
esho
ld
0
1
2
3
4
17-Jan-01
22-Jan-01
25-Jan-01
30-Jan-01
2-Feb-0
1
6-Feb-0
1
12-Feb-01
19-Feb-01
27-Feb-01
5-Mar-0
1
14-Mar-0
1
19-Mar-0
1
26-Mar-0
1
Thr
esho
ld
012345678910
Me
an
Nu
mbe
r L
arva
e pe
r P
lant
00.20.40.60.8
11.21.41.61.8
2
DBM lar DBM pupae Ai pupae Ds pupae
Type of Contaminant
mea
n co
ntam
inan
t per
ha
rves
ted
broc
coli
IPMCON
Overall Mean (+ SD)IPM = 1.74 + 1.6Conv = 0.42 + 0.61
**
** *
***

16
Average larval densities were similar in the 60% threshold treatment, with 89% parasitised, but the number of plants infested was below the threshold required to spray. Although we made every attempt to apply our first spray of MVP® (encapsulated Bacillus thuringiensis) to the 30% treatment because of rain and high winds we did not spray until 12 November. Immediately following our third data collection, both the 30% and 60% treatment were sprayed. DBM larval densities continued to increase in our no-spray-treatment to ca. 19 + 7.5 (mean + SD) and 89% parasitism. The larval densities in 30% and 60% threshold treatment were reduced to ca. 1.3 and 2.1 per plant, respectively. However, the number of plants infested was still greater than allowed for both threshold treatments. Subsequently, on 22 November, we applied another spray of MVP® that reduced larval densities further, and reduced the number of plants infested to acceptable levels for each threshold treatment. At the first appearance of the floret, both threshold treatments were reduced to 15% until harvest. In total, the 30% threshold received three applications of MVP®, and the 60% threshold received two applications. At harvest we assessed 40 broccoli plants for weight, cosmetic damage, and insect contaminants. The 30% threshold treatment did have significantly fewer scars, less frass and fewer plants with insect contaminants (80% were clean) than the 60% threshold or the no-spray-treatment (Fig.
00.10.20.30.40.50.60.70.80.9
1
29 Oct6 Nov
12 Nov
21 Nov
5 Dec12 Dec
20 Dec
Prop
ortio
n pa
rasi
tised
30T60TNo spray
Fig 10. Proportion of parasitised DBM larvae on broccoli
Fig. 8. Mean number of larvae per broccoli plant. Black arrows indicate spray for both 30T and 60T, white arrow for 30T only.
Fig. 9. Sampling events above or below threshold. Arrows same as Fig. 1. 15% indicates date of threshold change.
0
5
10
15
20
25
30
29 O
ct
6 N
ov
12 N
ov
21 N
ov
5 D
ec
14 D
ec
20 D
ec
Mea
n nu
mbe
r of l
arva
e / p
lant 30T
60TNo spray
0
1
2
3
29 O
ct
6 N
ov
12 N
ov
21 N
ov
5 D
ec
14 D
ec
20 D
ec
Thr
esho
ld
15%@

17
11). There was no difference in weight (averaging 289 grams) of the broccoli among any treatment. However, it should be noted that when we include harvest data for broccoli that was sprayed weekly on a calendar basis (nine sprays total, including Bt, endosulfan, SP’s, indoxacarb), the 30% threshold treatment has more clean plants than the calendar spray treatment (Fig. 11). Testing New Thresholds-Cauliflower By the second time we sampled (12 November) DBM larval density was 5.8 + 4 and 4.3 + 2.2 (mean + SD) per plant for the 30% and 60% threshold treatments (Fig. 12). Also, the number of plants infested was above the threshold for both treatments (Fig. 12), while parasitism was between 40% and 62% (Fig. 14). MVP® was applied to both the 30% and 60% treatments, and the DBM densities and the number of plants infested was reduced in these plots. For the remainder of the season, the larval densities remained ca. 1 per plant in the 30% and 60% threshold treatment, and ca. 3.5 per plant in the no-spray treatment. On 7 December we lowered the threshold to 15%, which resulted in another application of MVP®. Overall parasitism rates were significantly lower in the
0%10%20%30%40%50%60%70%80%90%
100%
30T 60T Calenderspray
no spray
Perc
enta
ge o
f pla
nts
3 2 1 0
Fig. 11. Harvest data for percentage of broccoli with zero insects, one, two or three or more.
Fig. 12. Mean number of DBM larvae per cauliflower plant. Arrows indicate spray for 30T and 60T.
Fig. 13. Sampling events above and below threshold. Arrows same as Fig. 12. Dotted line with 15% indicates threshold change.
2 N
ov
12 N
ov
21 N
ov
5 D
ec
14 D
ec
20 D
ec
Thre
shol
d
30T
60T
No spray
15%
@
05
101520253035404550
2 N
ov
12 N
ov
21 N
ov
5 D
ec
14 D
ec
20 D
ec
Mea
n nu
mbe
r of l
arva
e / p
lant

18
cauliflower no-spray-treatment compared to the broccoli no-spray-treatment (Z=13.5, d=2, P < 0.5). There was no difference in the number of scars, frass, or insect contaminants among treatments. All treatments had too many! However, 80% of all insect contaminants were at the base of the plant. There was a slight trend for calendar-based-treatment to have more clean plants followed by the 60% threshold, however, even with weekly sprays (11 in total, including Bt, endosulfan, SP’s, indoxacarb) there were still 48% of harvested cauliflowers with insect contaminants (Fig.15). Development of New Plan Using a computer to run the plan assists with the added complexity, however the plan is also available in a hard copy flip chart. To run the plan on a computer we have written a user-friendly program. To run the program the user needs Excel 97 or a later version. The program leads the user through a series of questions, displayed in dialogue boxes (Fig 16), and once the last question has been answered a sampling plan is produced. The chart can then be printed out and used to monitor a crop (Fig. 17).
Fig. 16. An example question/statement dialogue box.
0%
10%
20%
30%
40%
50%
60%
70%
80%
90%
100%
30T 60T Calender spray no spray
Perc
enta
ge o
f pla
nts
3
2
1
0
Fig. 14. Proportion of parasitised DBM larvae on cauliflower. 30 % threshold is denoted by squares, 60% by diamonds, and control by dashed line and open circle.
Fig. 15. Harvest data for percentage of cauliflower with zero insect contaminants, one two, three or more.
00.10.20.30.40.50.60.70.80.9
1
2 N
ov
12 N
ov
21 N
ov
5 D
ec
14 D
ec
20 D
ec
Prop
ortio
n pa
rasi
tised
19
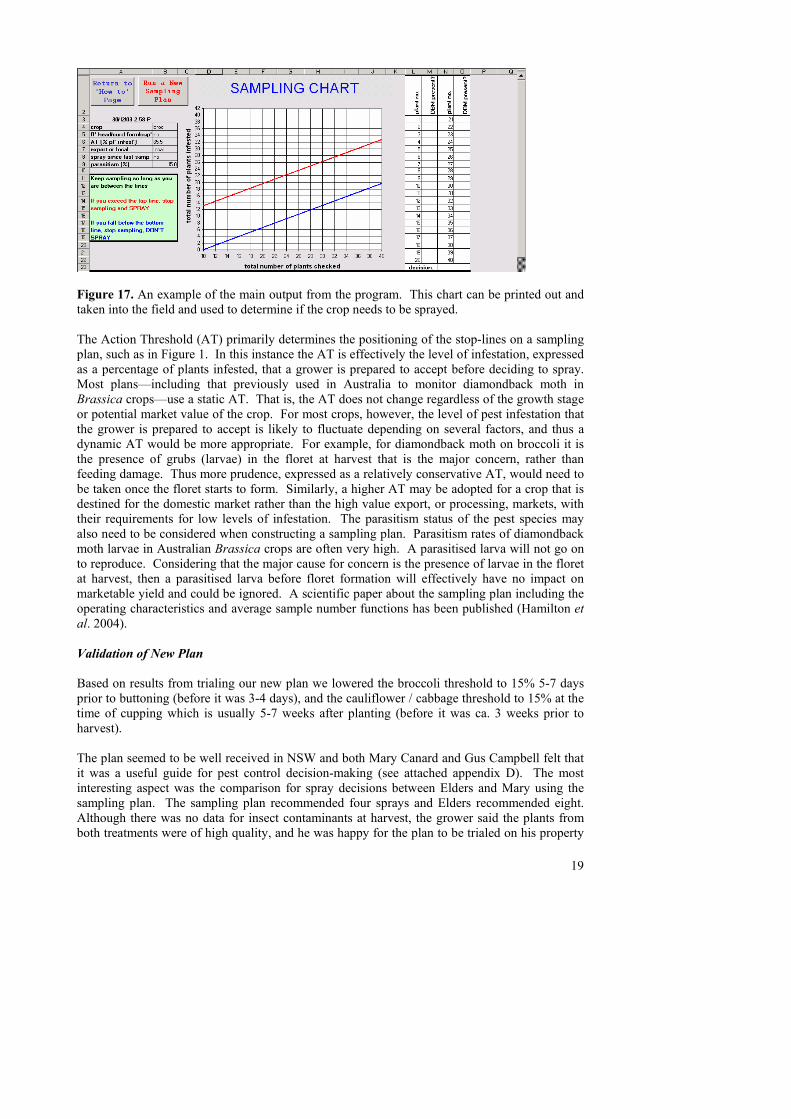
Figure 17. An example of the main output from the program. This chart can be printed out and taken into the field and used to determine if the crop needs to be sprayed. The Action Threshold (AT) primarily determines the positioning of the stop-lines on a sampling plan, such as in Figure 1. In this instance the AT is effectively the level of infestation, expressed as a percentage of plants infested, that a grower is prepared to accept before deciding to spray. Most plans—including that previously used in Australia to monitor diamondback moth in Brassica crops—use a static AT. That is, the AT does not change regardless of the growth stage or potential market value of the crop. For most crops, however, the level of pest infestation that the grower is prepared to accept is likely to fluctuate depending on several factors, and thus a dynamic AT would be more appropriate. For example, for diamondback moth on broccoli it is the presence of grubs (larvae) in the floret at harvest that is the major concern, rather than feeding damage. Thus more prudence, expressed as a relatively conservative AT, would need to be taken once the floret starts to form. Similarly, a higher AT may be adopted for a crop that is destined for the domestic market rather than the high value export, or processing, markets, with their requirements for low levels of infestation. The parasitism status of the pest species may also need to be considered when constructing a sampling plan. Parasitism rates of diamondback moth larvae in Australian Brassica crops are often very high. A parasitised larva will not go on to reproduce. Considering that the major cause for concern is the presence of larvae in the floret at harvest, then a parasitised larva before floret formation will effectively have no impact on marketable yield and could be ignored. A scientific paper about the sampling plan including the operating characteristics and average sample number functions has been published (Hamilton et al. 2004). Validation of New Plan Based on results from trialing our new plan we lowered the broccoli threshold to 15% 5-7 days prior to buttoning (before it was 3-4 days), and the cauliflower / cabbage threshold to 15% at the time of cupping which is usually 5-7 weeks after planting (before it was ca. 3 weeks prior to harvest).
The plan seemed to be well received in NSW and both Mary Canard and Gus Campbell felt that it was a useful guide for pest control decision-making (see attached appendix D). The most interesting aspect was the comparison for spray decisions between Elders and Mary using the sampling plan. The sampling plan recommended four sprays and Elders recommended eight. Although there was no data for insect contaminants at harvest, the grower said the plants from both treatments were of high quality, and he was happy for the plan to be trialed on his property

20
again. For the crops that Gus sampled, the most interesting aspect was that the two growers were right next door to one another, and one grower sprayed 3 times for each crop and the other only once. In SA all growers had a positive response to crop monitoring with the plan. Initially a grower who was used to spraying every 4-7 days was uncomfortable about not spraying when that was the recommendation. However, as he gained confidence this was no longer a problem and felt that scouting plan worked quite well. One of the greatest difficulties was getting growers to spray when the plan recommended a spray. This lack of compliance (usually because of busy schedules or a higher tolerance for grub infestation) made it difficult to truly validate the plan. Feed back from the scout, John Jeffs was quite favourable and stated that the plan helped him gain confidence as a crop monitor, and that he was comfortable with the recommendations that the plan suggested, but found it difficult when growers did not follow through with the recommendation. The main criticism of the plan by John was that because it is a sequential binomial plan, instead of a fixed plan, he would often be required to sample more plants than he had time for to make a decision. In WA, there appeared to be some confusion about how to use the plan, and in one situation lack of spray compliance by a grower. However, in general the idea of the plan was received favourably, but there was significant scepticism about the adoption by growers / crop agronomists. Perhaps clearer instructions on how to use the plan would help remove confusion. Discussion (including implications to industry): Evaluation of Scouting Plan The threshold and action chart by Mo et al. (2000) was found to be too conservative for broccoli and to some extent cauliflower and cabbage. Depending on the growth stage of the plant the threshold could be more flexible. For example, the broccoli plant can tolerate a considerable amount of damage without having any negative effect on yield, but it will need to be monitored closely and DBM populations controlled once the floret is visible. Although there were more contaminants in the IPM broccoli compared to the conventional broccoli, it was not clear whether these additional contaminants would result in a price reduction because they were not visible unless destructively sampled. The threshold and action chart was not too conservative for Brussels sprouts, and it may be prudent to incorporate DBM egg density into the calculation and decision-making. Testing New Thresholds In broccoli parasitism continued to cause extremely high levels of DBM mortality. Overall parasitism is lower in cauliflower compared to broccoli. This may be due to the plant architecture, colour or odour, but should be investigated further, possibly for an honours student. It was clear that for broccoli a 30% threshold delivers a quality product and saves money on unnecessary sprays. For the cauliflower, the 15% threshold should have been initiated earlier to reduce insect contaminants. Insect larvae and pupae work their way to the base of the plant where we are unable to see them, and where spray is most likely unable to cover.
Development and validation of New Plan The new DBM dynamic sampling plan appears to meet the need for a comprehensive tool for pest control decision-making. This plan is the first to formally incorporate parasitism into pest

21
control decision-making. As it stands the plan deals with only DBM; as more data becomes available about other pests of brassica vegetables the information will be incorporated. Although all attempts were made to validate the plan, the lack of access to a research station and replicated field plots means that a critical evaluation is lacking. We hope that we have overcome this problem by having the plan trialed at several locations around Australia. The sampling plan interfaces well with other tools developed by the National DBM project. For example, if the plan recommends a spray, then there is a direct link to the Two-window Insecticide Resistance Management strategy so that only those chemicals available at that time of year are recommended. Next, of the chemicals recommended, there is a link to the Beneficial Insect Toxicity Chart. If the grower is trying to conserve beneficial insects, then he can choose chemicals that will be less disruptive to the types of beneficials that where present during crop monitoring. Over the next year (at the time of writing a new HAL project to further progress Brassica IPM in Australia had been approved) we will continue to promote the plan at workshops and in newsletters. The plan will be made available from the web, plus all levy payers will receive a hard copy and disc, and all non-levy payers will receive promotion materials and information on how to download it from the web. The expectation is that the plan will help to maintain the production of quality brassica vegetables while minimising resistance, and reducing unnecessary sprays. Literature Cited: Mo, J., Baker, G. and M. Keller. 2000. Evaluation of sequential binomial sampling plans for
decision-making in the management of the diamondback moth (Plutella xylostella) (Plutellidae: Lepidoptera). Final Report July 1997-June 2000 Horticulture Research and Development Corporation #VG97014.

22
WA REPORT ON CROP SCOUTING Françoise Berlandier Department of Agriculture, Locked Bag No. 4, Bentley Delivery Centre, WA 6983, Australia. Introduction: Crop scouting was one of the major activities undertaken by Western Australia over the duration of the project. This report outlines the work that was undertaken and the findings. Methods: The crop scouting was done according to the principals of the most recent scouting plan and threshold in a designated section of a commercial crop of broccoli, cabbage or cauliflower. The scouted section (A) was sprayed when pre-determined thresholds for P. xylostella were breached, and the remainder of the crop (B) was sprayed at the grower’s discretion. At harvest samples of the produce from both (A) and (B) were collected and the quality of and numbers of insects in both were compared to evaluate the benefits of scouting. The purpose of the crop scouting was to establish whether growers could produce a crop of the same quality with fewer sprays than normal farmer practice, which tends to be weekly spray applications. Three of the trials compared dynamic vs conventional spraying, and the other three compared thresholds of 15%, 30% and 60%. Summary of crop scouting trials Trial Date Treatments Property Crop 1 Dec 01 – Feb 02 Three thresholds White Cabbage 2 Jan 02 – Mar 02 Three thresholds Trandos Broccoli 3 Apr 02 – Jul 02 Three thresholds Trandos (Bay 54) Broccoli 4 Dec 02 – Jan 03 Dynamic vs Conventional White (Dyn) Cabbage 5 Oct 02 – Jan 03 Dynamic vs Conventional Trandos (Dyn) Cauliflower 6 Oct 02 – Dec 02 Dynamic vs Conventional Trandos (Dyn) Broccoli Variables measured included numbers of insects, presence of frass, weight of produce and a damage rating. A head is considered to be contaminated by insects if one or more insects are present. Results were analysed by ANOVA using Genstat 6.0. Evaluation of damage was adapted from the method described by Leibee et al, (1984). 1. no apparent insect feeding 2. minor insect feeding on wrapper or outer leaves, 0 to 1% leaf area eaten 3. moderate insect feeding on wrapper or outer leaves with no head damage, 2 to 5% leaf area
eaten 4. moderate insect feeding on wrapper or outer leaves, with minor feeding on the head, 6 to
10% of leaf area eaten 5. moderate to heavy insect feeding on wrapper or outer leaves, and a moderate number of
feeding scars on the head, 11 to 30% of leaf area eaten. 6. considerable insect feeding on wrapper and head leaves with head having numerous feeding
scars, over 30% of leaf area eaten.

23
Trial 1 tested 3 different spray thresholds, 15%, 30% and 60%, in cabbage; samples of harvested produce were taken, replicated 20 times. Trial 2 tested 3 different thresholds, 15%, 30% and 60% in broccoli; harvested samples were replicated 20 times. Trial3 tested 3 different thresholds, 15%, 30% and 60% in broccoli; harvest samples were replicated 10 times. Trials 4, 5 and 6 tested the effects of spraying in response to dynamic (scouting) vs. conventional grower practice in commercial cabbage, cauliflower and broccoli crops respectively. Results: Trial 1 Differences in insect numbers in the head were close to significant at 5% (F pr. = 0.065). There were most insects in the 30% threshold (Table 1). There were also significant differences between the damage rank, with the highest level of damage in the 30% threshold treatment. There was no difference in weight of the produce (F pr. = 0.568). Although there was no difference in the weights of the cabbage produced by the three thresholds tested, there was least damage (P < 0.001) and fewest insects in the 15% and 60% thresholds (P = 0.065). The spray records for this trial are unfortunately unavailable. Table 1. Results of Trial 1. Treatment No. insects
(head) Damage rank Weight
(gm) 15% 0.10 1.93 2477 30% 0.75 2.75 2432 60% 0.20 1.50 2353 F pr. 0.065 < 0.001 0.568
Trial 2 There were differences in the weight of broccoli between the three treatments tested, with the lowest weight being the 60% threshold (F pr. = 0.009) (Table 2). Far more insects were found in the 60% threshold, both in the head and outer leaves (F pr. < 0.001). The spray records for this trial are unfortunately unavailable. Table 2. Results of Trial 2. Treatment No. insects/
broccoli (outer leaves)
No. insects/broccoli (head)
Damage rank Weight (gm)
15% 5.0 0.7 1.0 298 30% 7.5 1.8 1.0 309 60% 15.9 5.5 1.74 261.8 F pr. < 0.001 < 0.001 < 0.001 0.009 Trial 3 An insecticide spray was applied on two occasions (1 and 16 May) to the 15% threshold treatment, while the 30 and 60% threshold treatments were left unsprayed. There was no difference in the weight of broccoli between the three treatments tested (F pr. = 0.124). There was no difference in the amount of frass found. More insects were found in the 30% threshold (F pr. = 0.041), and there was greater contamination in the two higher thresholds (F pr. = 0.033). Crops sprayed at the 15% threshold for DBM produced the best, most marketable broccoli; these had the fewest insects per head and the least contamination.

24
Table 3. Results of Trial 3. Treatment Frass No. insects Contamination Weight (gm) 15% 0.1 0.3 0.2 310 30% 0.3 1.6 0.7 282 60% 0.1 0.8 0.7 257 F pr. 0.409 0.041 0.033 0.124 Trial 4 The conventionally treated crop was sprayed weekly (11-12 times), and the section with the dynamic plan was sprayed a total of six times (on 8,15 and 22 November, 13 December, 3 and 10 January). The dynamic plan developed by Nancy Schellhorn (SARDI) was used. Harvest samples were replicated 10 times. The dynamic plan produced heavier broccoli (F pr. = 0.026). There was more damage in the dynamic treatment. There were more insects in the heads collected from the dynamic treatment (F pr. < 0.001). There were more insects in wrapper leaves from the dynamic treatment (F pr. < 0.001). Conclusion: the conventional spraying practice produced a better crop than the one treated according to the dynamic sampling plan in that it had far less insect contamination, but required six more sprays to achieve this. However the heads of the conventional crop weighed significantly less (7.9%) compared to those from the dynamic sampling crop. Table 4. Results of Trial 4. Treatment Damage
rank No. insects /cabbage (head)
No. insects /cabbage (wrapper)
Weight (gm)
Dynamic 3.6 8.2 5.9 1883 Conventional 2.0 3.4 1.7 1734 F pr. < 0.001 < 0.001 < 0.001 0.026 Trial 5 The section of the crop treated with the dynamic plan was sprayed a total of three times (on 22 November, 4 December and 1 January), whereas the conventional section was sprayed a total of four times (on 22 November, 4 and 8 December and 1 January). Harvest samples were replicated 18 or 20 times. There was no difference in the weight of cauliflower between the three treatments tested (F pr. = 0.273). There were no differences between the dynamic and conventional treatments in either the numbers of insects in the curd (F pr. = 0.378) or in the wrapper leaves (F pr. = 0.291). Conclusion: there was no difference in the crops produced by conventional spraying practice to the dynamic sampling plan. Both sets of crops had high numbers of insects, the last four sprays applied were alpha-cypermethrin (Fastac) but it gave poor insect control. Possibly the DBM had developed resistance to this chemical.

25
Table 5. Results of trial 5. Treatment Damage
rank No. DBM /cauli (head)
No. para DBM /cauli (head)
No. insects /cauli (wrapper)
Weight (gm)
Dynamic 65 6.4 10.3 723 Conventional 82 3.2 14.6 658 F pr. 0.378 0.147 0.291 0.273 Trial 6 The section of the crop treated with the dynamic plan was only sprayed once on 6 November, whereas the conventional section was sprayed three times (on 6, 15 and 18 November). Harvest samples were replicated 49 (dynamic) or 43 (conventional) times. There was a difference in the weight of broccoli between the three treatments tested (F pr. = 0.041). There were more insects in the heads of the dynamic sampled plants compared to the conventionally treated plants (F pr. = 0.078), but the damage rank was similar (F pr. = 0.524) for both treatments. There were no parasitoids in any of the harvested material. Table 6. Results of trial 6. Treatment Damage
rank No. DBM /brocc (head)
No. para DBM /brocc (head)
Weight (gm)
Dynamic 1.16 0.245 0 479.8 Conventional 1.11 0.070 0 439.2 F pr. 0.524 0.078 n/a 0.041 Summary: Three thresholds: 15%, 30% & 60% • Cabbage: Most damage and insect contamination in the 30% threshold. • Broccoli: Crop was heaviest from 15% and 30% thresholds. Most insects in 60% threshold. • Broccoli: Most insects in the 30% threshold. There was no differences in the weight of the
produce. Dynamic vs Conventional • Cabbage: Most insects in the Dynamic plan, but this also produced the heaviest cabbages. • Cauliflower: High numbers of insects in both, no differences in curd weight. • Broccoli: Tending toward more insects in the head of the Dynamic plan, but again these were
heavier. Literature Cited: Leibee, G.L., Chalfant, R.B., Schuster, D.J. and Workman, R.B. (1984). Evaluation of visual
damage thresholds for management of cabbage caterpillars in Florida and Georgia. J. Econ. Entomol. 77:1008-1011.

26
NATIONAL INSECTICIDE RESISTANCE TESTING PROGRAM FOR DIAMONDBACK MOTH, PLUTELLA XYLOSTELLA, 2000-2003 Nancy M. Endersby, Peter M. Ridland and Jingye Zhang Department of Primary Industries, Research & Development Division, Knoxfield, Private Bag 15, Ferntree Gully Delivery Centre VIC 3156, Australia. Program overview: The National Insecticide Resistance Testing Program for diamondback moth (DBM), Plutella xylostella (L.) was established in 1999. The program comprised:
• Annual testing of field populations of DBM from each major Brassica vegetable producing state in Australia (Table 2) - testing with ten insecticides, including new chemistries and long-established insecticides (Table 1).
Table 1. Insecticides tested in National Insecticide Resistance Testing Program for diamondback
moth, Plutella xylostella, from Australia, 2000-2003.
Chemical Trade name
Bacillus thuringiensis Delfin WG Chlorfenapyr Secure Emamectin benzoate Proclaim Fipronil Regent Indoxacarb Avatar Novaluron* Rim On Spinosad Success Methamidophos Nitofol
Alpha-cypermethrin Fastac Permethrin Ambush
*not registered for control of DBM in Brassica vegetables – baseline data collected only
• Testing of DBM populations from vegetable crops to confirm resistance in the event of field control failure (Table 2).
• Baseline testing of some insecticides under development for control of DBM.
• Testing of DBM populations from canola and forage brassicas to confirm resistance in
the event of field control failure and to study the distribution of resistance to synthetic pyrethroid insecticides (some recent results presented in Tables 3, 4, 5).
• Providing information to the industry on the progress of the AVCARE DBM Insecticide
Resistance Management strategy.

27
Background to the program: The major pest of Brassica vegetables in Australia is diamondback moth (DBM). This pest has evolved insecticide resistance due to prophylactic use of insecticides over many years, which has caused control failures and economic loss in vegetable crops. Resistance to synthetic pyrethroid insecticides has been identified in DBM populations from vegetable growing areas in all states and resistance to organophosphate insecticides has been identified in some states. Recently, low levels of resistance have also been documented in DBM populations from canola, forage brassicas and brassicaceous weeds (Endersby et al. 2000). Hargreaves (1996) conducted the earliest resistance testing of DBM in Australia, followed by Baker and Kovaliski (1999) and Endersby and Ridland (1997). In 1997, a project funded by the Horticultural Research and Development Corporation “Advancing the integrated management of DBM in crucifer vegetables VG97014” was established. Additional funding from major agrochemical companies supported insecticide resistance bioassays of DBM. Also in 1997, AIRAC (AVCARE's Insecticide Resistance Action Committee), in consultation with researchers, devised a two-window insecticide resistance management strategy for DBM. By late 1998, chlorfenapyr and fipronil had both been registered for control of DBM and so the two-window strategy was launched to growers around Australia. The strategy is reviewed regularly and is updated as new products become registered or new management tactics become available. Five products are currently partitioned into the two-window strategy. In southern Australia, Secure® (chlorfenapyr) and Success® (spinosad) may be used from 1st September to 31st January, whereas Regent®, Proclaim® and Avatar® may be used from 1st February to 31st August. Window strategies have also been published for Western Australia and Queensland. A second project, " Implementing Pest Management of Diamondback Moth (DBM) VG00055", funded by Horticulture Australia Ltd, began in 2000 and was also supported by additional agrochemical company funding which allowed the National DBM Insecticide Resistance Testing Program to continue until 30th June 2003. Methods: Key populations of DBM from around Australia were tested for resistance using a leaf-dip bioassay (after Tabashnik and Cushing 1987). Larvae of DBM collected from Brassica crops were reared on cabbage seedling leaves (Brassica oleracea var. capitata cv. Green Coronet) in the laboratory at 25 °C (16h:8h, L:D). Cabbage leaf discs of 4.5 cm diameter were dipped for 5 s in distilled water solutions of formulated insecticide and hung vertically to dry in a fume hood for 2 h. Control discs were dipped in distilled water. Ten third instar larvae were placed on each disc and four replicates of seven concentrations of insecticide were set up. Mortality was assessed after 48 h or more depending on the type of insecticide being tested. A susceptible laboratory population of DBM, which has been maintained for more than ten years without exposure to insecticides, was used as a reference. For more details on the methods and analysis used please refer to the methods sections of Appendices C-F at the end of this report. Summary of program results: Resistance to synthetic pyrethroids was the main type of resistance identified in Australian populations of DBM from vegetable crops throughout the testing program. Tolerance ratios for ten insecticides for populations of DBM tested in 2000/2001, 2001/2002 and 2002/2003 are

28
shown in Table 2. A tolerance ratio of 1 indicates that a field population is equivalent in susceptibility to the laboratory population. Table 2. Comparison of levels of tolerance to ten insecticides tested on DBM populations from
five states in 2002/2003 and six states in 2001/2002 and 2000/2001 (tolerance ratios of field population compared with laboratory population, Waite).
2000/2001
Insecticide Product h WA SA VIC TAS NSW QLD
Bacillus thuringiensis
Delfin WG
96 0.20 0.30 1.94 1.50 4.44 1.45
Chlorfenapyr Secure 48 0.51 1.43 1.47 0.67 0.47 1.45 emamectin benzoate Proclaim 72 2.27 1.37 1.97 1.61 2.23 3.19 Fipronil Regent 72 1.43 1.38 1.24 1.59 1.17 11.03 Indoxacarb Avatar 72 1.27 1.18 1.29 1.86 0.89 2.40 Novaluron Rim On 72 1.38 0.82 0.85 1.56 1.83 1.17 Spinosad Success 72 3.40 0.98 1.63 3.24 1.17 2.18 Methamidophos Nitofol 48 1.10 1.74 2.06 1.66 2.17 2.70 alpha-cypermethrin Fastac 48 3.45 11.55 9.96 9.01 7.20 13.92 Permethrin Ambush 48 6.48 11.14 7.85 6.47 9.87 10.63

29
2001/2002
Insecticide Product h WA SA VIC TAS NSW QLD
Bacillus thuringiensis
Delfin WG
96 0.42 0.96 0.32 0.37 1.69 1.29
chlorfenapyr Secure 48 0.42 0.80 0.62 0.67 1.03 0.84 emamectin benzoate Proclaim 72 2.74 3.34 1.84 0.72 2.46 4.43 Fipronil Regent 72 0.83 1.02 1.32 1.96 1.36 1.14 Indoxacarb Avatar 72 1.83 1.10 1.86 1.34 0.83 2.34 Novaluron Rim On 72 1.01 3.63 5.06 3.03 0.93 1.21 Spinosad Success 72 0.68 0.96 1.55 0.76 1.31 2.47 methamidophos Nitofol 48 2.45 1.59 1.29 0.83 1.89 2.33 alpha-cypermethrin Fastac 48 2.62 8.20 4.78 4.50 13.19 9.81 Permethrin Ambush 48 5.10 5.11 2.83 8.73 9.16 4.35
2002/2003 *NSW population not provided for testing in 2002/2003
Insecticide Product h WA SA VIC TAS NSW QLD
Bacillus thuringiensis
Delfin WG
96 0.73 2.44 2.42 5.57 * 2.23
chlorfenapyr Secure 48 1.54 1.97† 1.27 2.04 * 1.25 emamectin benzoate Proclaim 72 4.10 1.05 2.54 4.17 * 3.71 Fipronil Regent 72 2.37 0.99 1.70 1.29 * 2.26 Indoxacarb Avatar 72 2.48 1.67 1.43 1.37 * 1.51 Novaluron Rim On 72 0.86 1.76 1.61 1.96 * 1.77 Spinosad Success 72 2.19 1.04 1.62 2.56 * 1.80 methamidophos Nitofol 48 1.92 1.49 2.34 1.41 * 1.86
alpha-cypermethrin Fastac 48 13.21 1.54 6.74 23.19# * 17.99#
Permethrin Ambush 48 20.40 2.04 8.17 10.33 * 3.83
†RR calculated at LC90 as value for Waite population was atypically very low; #atypically low LC50 for Waite
Severe outbreaks of DBM in canola in Western Australia in 2001 and in New South Wales in 2002 have emphasised the need for greater understanding of moth dispersal and insecticide resistance status of Australian populations of DBM. The origin and insecticide resistance status of DBM populations infesting canola, vegetables, forage brassicas and weeds has fundamental implications for management of the pest both in vegetable Brassica crops and across industries in Australia. Tolerance ratios for some populations of DBM collected in Western Australia increased in 2001 compared with ratios estimated in 1999 (Table 3).

30
Table 3. Tolerance to permethrin of diamondback moth populations from canola in Western Australia 1999-2002 (leaf dip bioassays).
Collected DBM population Tolerance ratio 95% confidence intervals
Lower Upper
Oct-1999 Wongan Hills WA canola 5.1* 3.4 7.5 Oct-1999 Burabadji WA canola 6.7 4.8 9.6 Nov-2001 Wongan Hills canola 11.5* 8.2 16.2 Oct-2001 Ballidu WA canola 15.0* 9.9 22.8 Oct-2001 Geraldton WA – sprayed canola 15.1 10.4 23.3 Oct-2001 Geraldton WA– unsprayed canola 17.2 11.8 27.0 Oct-2002 Geraldton – canola 9.9 6.6 16.0 *calculated at LC50 During spring, 2002, there was a serious outbreak of DBM in canola in NSW. Our preliminary analysis suggested that this unusual occurrence was related to the increased temperatures and reduced rainfall experienced in winter and spring. Subsequently, very high populations of moths invaded Victoria in late spring. Vegetable growers have in general had little difficulty in managing the increase in moth numbers. However, forage Brassica growers have had great problems. Tests of 23 populations of DBM from canola, forage brassicas and vegetables (NSW 11, Qld 1, SA 2, Tas 2,Vic 5 and WA 2) (Tables 4 and 5) demonstrated that resistance to synthetic pyrethroid insecticides had increased to a level such that canola growers would see control failures. Table 4. Tolerance ratios to permethrin in populations of DBM collected from canola during
outbreak in NSW, October 2002.
Location Tolerance Ratio
95% confidence intervals
lower upper Young 6.41 4.66 8.81 Calculated at LC50 Forbes- Airport 4.57 3.54 6.00 Greenethorpe #1 3.74 2.94 4.81 Rand 12.31 7.93 21.24 Brocklesby 9.32 6.57 13.22 Calculated at LC50 Greenethorpe #2 6.60 4.37 10.59 West Cowra 12.39 8.15 20.74 Billimari 7.24 5.15 10.17 Calculated at LC50 Marongla 3.96 2.65 6.12 Temora 4.17 2.97 5.87 Calculated at LC50 Grenfell 5.39 3.64 7.99 Calculated at LC50

31
Table 5. Tolerance ratios to permethrin in Australian populations of DBM collected from canola, forage, weed and vegetable crops during spring 2002 – winter 2003.
95% confidence
intervals
Collected Location State Host
Tolerance Ratio
lower upper
Nov-2002 Millicent SA Canola
4.46 3.24 6.13 Calculated at LC50
Jan-2003 Garvoc VIC Forage
9.1 6.26 13.24 Calculated at LC50
Jan-2003 Hamilton VIC Canola
6.63 4.77 9.23 Calculated at LC50
Oct-2002 Geraldton WA Canola 9.85 6.59 15.99
Nov-2002 Woodhouse VIC Canola
3.92 2.20 2.94 Calculated at LC50
May-2003 Werribee Expo VIC Cabbage 8.04 5.64 11.92 Dec-2002 Shoreham VIC Weed 5.46 3.49 9.04 Nov-2002 Penguin TAS Forage 6.05 4.28 8.91 Dec-2002 Mandogalup WA Cabbage 5.98 4.49 8.27
Jan-2003 Montagu TAS Forage
5.59 4.17 7.49 Calculated at LC50
May-2003 Lindenow VIC Cabbage
15.7 10.44 23.6 Calculated at LC50
Jun-2003 Gatton Res Stn QLD Cabbage
10.05 6.18 16.33 Calculated at LC50
Future directions in insecticide resistance monitoring and management: The methods and sample sizes used in the National Insecticide Resistance Testing Program were able to detect substantial changes in susceptibility to insecticides by DBM and confirm resistance in case of a field control failure. If resistance is to be detected at the stage when it occurs at a low frequency in the population, very large numbers of field collected larvae (30, 000+) would have to be screened. In southern Australia, the opportunity to collect large numbers of DBM eggs sometimes occurs in November to December. Estimation of frequency of resistant individuals in one or two large populations of DBM could be an option for future study. Patterns of dispersal and the insecticide resistance status of moth populations will have a direct impact on the choice of insecticides that growers should make. The interaction between the canola and vegetable industries will be of particular importance. The Australian vegetable industry is currently able to use a range of highly effective, but expensive new chemistries that have temporarily solved the problems associated with resistance of DBM to synthetic pyrethroid insecticides. Knowledge about moth movement and insecticide resistance status will help the industries to decide whether use of these chemistries in canola crops would increase the rate of development of resistance and jeopardise the effectiveness of these compounds.

32
A project to identify candidate genes for insecticide resistance in DBM and to develop rapid molecular screening methods for insecticide resistance has been funded by the Grains Research and Development Corporation. The Australian Research Council Strategic Partnership with Industry Research & Training Grants is funding two other projects with direct relevance to management of insecticide resistance in DBM. The first project aims to develop molecular markers (microsatellites) to study dispersal and genetic structure of the populations of DBM and the second aims to identify and map the genes involved in resistance to Bacillus thuringiensis in DBM. Development of non-chemical strategies for management of DBM in vegetable, canola and forage Brassica crops will continue to be of major importance in managing insecticide resistance across industries and needs to be addressed as a high priority.
Acknowledgements: We thank all of the agrochemical companies who were involved in supporting the National Insecticide Resistance Testing Program for DBM: Aventis CropScience, BASF Australia Ltd, CropCare Australasia, Dow AgroSciences Australia Ltd, DuPont (Australia) Ltd, NuFarm Ltd, Sumitomo Chemical and Syngenta Crop Protection Pty Limited. Literature Cited: Baker, G.J. and Kovaliski, J. (1999). Detection of insecticide resistance in Plutella xylostella
(L.) (Lepidoptera: Plutellidae) populations in South Australian crucifer crops. Australian Journal of Entomology 38: 132 – 134.
Endersby, N.M. and Ridland, P.M. (1997). Insecticide resistance in diamondback moth, Plutella
xylostella (L.), in southern Australia. In: (eds. A. Sivapragasam, W.H. Loke, AK Hussan & G.S. Lim) The management of diamondback moth and other crucifer pests. Proceedings of the Third International Workshop, Kuala Lumpur, Malaysia, pp. 290 – 294.
Endersby, N.M., Ridland, P.M. and Zhang, J. (2000). Resistance to permethrin in diamondback
moth populations from vegetable and non-vegetable hosts in southern Australia. Australian Entomological Society 31st AGM & Scientific Conference, Northern Territory University, Darwin 25-30 June.
Hargreaves, J.R. (1996). Insecticide resistance and insecticide resistance management strategies
for three vegetable pests in south east Queensland. Horticultural Research and Development Corporation, Project report reference v/0021/r1.
Tabashnik, B.E. and Cushing, N.L. (1987). Leaf residue vs. topical bioassays for assessing
insecticide resistance in the diamondback moth, Plutella xylostella L. FAO Plant Protection Bulletin 35: 11-14.

33
THE AIRAC “TWO-WINDOW” INSECTICIDE RESISTANCE MANAGEMENT STRATEGY, 2000-2003 Greg Baker South Australian Research and Development Institute, GPO Box 397, Adelaide, SA 5001, Australia. Background: Internationally diamondback moth (DBM) has developed resistance to all classes of insecticide available for its control prior to 1998, and in Australia has developed substantial levels of synthetic pyrethroid and organophosphate resistance. Such resistance has resulted in poor control and economic loss in vegetable crops. In 1997, at the inception of the HRDC funded project VG97014, “Advancing the integrated management of DBM in crucifer vegetables”, it was known that four new insecticides, each with different and novel modes of action, were in the development/registration pipeline for diamondback moth control in Australia. This presented a unique opportunity to devise a national insecticide resistance management (IRM) strategy to help conserve the new chemistry. To this end in 1997-98 a “Two-Window” IRM Strategy was devised and negotiated with the AVCARE Insecticide Resistance Action Committee (AIRAC) by Dr Rick Roush (with assistance from by Greg Baker, Dr Peter Ridland and Nancy Endersby). In 1998 fipronil (Regent) and chlorfenapyr (Secure) were registered for DBM control in Brassica vegetable crops, and the AIRAC two-window strategy was launched to growers around Australia. Spinosad (Success), emamectin benzoate (Proclaim) and indoxacarb (Avatar) have subsequently become registered and added to the AIRAC strategy. Since 1998 the strategy has been reviewed and updated annually, and a glossy two-sided flyer, which publicises the current version of the strategy has been distributed annually to all levy-paying Brassica vegetable growers. In southern Australia, Secure and Success may be used from 1st September to 31st January, whereas Regent, Proclaim and Avatar may be used from 1st February to 31st August. Similar strategies, with window calendar dates that reflect the regional crop and pest phenologies, have been published for Western Australia and Queensland. In addition to the annual updating and distribution of the IRM strategy flyer, a grower survey was conducted in 2002 to determine grower awareness and compliance with the AIRAC IRM strategy, and AIRAC meetings were attended to report on the resistance screening results and to discuss possible changes to improve the IRM strategy. I. The AIRAC DBM IRM flyers, 2000-03 Examples of these flyers are included in Appendix N.

34
II. 2002 AIRAC survey of the Brassica vegetable industry’s IRM practices The survey was organized by AIRAC in conjunction with the HAL National DBM Project team. The survey arose over concerns concerned that the AIRAC IRM “two-window” strategy for DBM control in brassicas may not have been adopted by a sizeable number of growers. The objective of the survey was to determine grower awareness of and compliance with the AIRAC strategy, and to provide leads as to how to better structure it to gain greater compliance. Method: The questionnaire is presented below (Table 1), and was conducted by mail out to Brassica vegetable growers in each State. Table 1: The 2002 AIRAC IRM Brassica Grower Questionnaire Location and state:_________________________________________________ (Please circle your response) Do you have a DBM resistance management strategy that you follow?
Yes/No
If you answered “yes”, how strictly do you follow it? Always/mostly/sometimes Is it the AIRAC (AVCARE) 2-window rotation strategy? Yes/No/Don’t know Does your reseller talk about Resistance management? Yes/No Does your consultant talk about resistance management? Yes/No Do your neighbours have a resistance management strategy they use?
Yes/No/Don’t know
What most influences your decision as to the insecticides that you use? What insecticides do you use for pest control in your Brassica crops (and approximately how many sprays per year) and why? Product 1 Product 2 Product 3 Product 4 Results and Discussion: Survey responses were received from 106 growers nationally. Encouragingly 74% of the respondents stated that they use an IRM strategy (Fig. 1). This percentage ranged between States from 64 to 95%. In turn, 92% of the IRM-practicing growers nationally claim to always (or most of the time) follow the IRM strategy; this ranged between States from 79 to 100% (Fig. 2). These results indicate a major improvement since the mid 1990’s and the commencement of

35
Project VG97014. At this time many growers were still unaware of the concept of insecticide resistance evolving in pest populations in response to repeated prophylactic use of insecticides, and virtually no growers practiced any form of structured IRM strategy. To have three quarters of surveyed growers indicate that they actively employ IRM tactics is a substantial advance in 5-6 years.
Fig 1. The percentage of surveyed Australian Brassica vegetable growers who use an IRM strategy.
Fig. 2. The percentage of IRM-practicing growers that follow their IRM strategy always or most of the time. In response to the question “Is the IRM strategy you use the AIRAC (AVCARE) 2-window rotation strategy”, 59% of growers responded in the affirmative (Fig. 3). Given that most growers associate the 2-window rotation strategy with the HAL project and it’s team members, rather than with AIRAC or AVCARE, this figure could be an under-estimate. In other words, some of the 41% of growers that either responded in the negative or that weren’t certain, may well follow our national AIRAC two-window strategy, and, if they had been provided with a preamble that explained these terms, would have answered in the affirmative.
0
20
40
60
80
100
QLD NSW TAS VIC SA WA ALLSTATES
%
0
20
40
60
80
100
%
QLD NSW TAS VIC SA WA ALL STATES

36
Fig. 3. The percentage of grower respondents that practice IRM who (i) do use the AIRAC IRM strategy (Yes), (ii) do not use the AIRAC IRM strategy (No), or (iii) are uncertain which IRM strategy they practice (Don’t know). The question, “Do your neighbours have a resistance management strategy they use?” revealed that most growers (70% nationally) are unaware of their neighbours IRM practices. Only 17% of growers thought that their neighbours had an IRM strategy, which contrasts with the 74% that claim to practice IRM (Fig. 4). The grower respondents indicated that 66% of resellers and 78% of consultants talk with them about resistance management (Fig. 5). Unfortunately this question doesn’t provide any insight into the quality of the IRM technical advice provided by these service providers. However, on this evidence one-third of chemical resellers do not mention resistance management to Brassica growers. Considering how notoriously difficult DBM is to manage in this respect, this finding is concerning and suggests that reseller IRM education could be worthwhile. An interesting statistic obtained from the answer to this question is that 60 (57%) of the 106 grower respondents employed a crop consultant.
0
20
40
60
80
100
QLD NSW TAS VIC SA WA ALLSTATES
%
Yes No Don't know

37
Fig. 4. The percentage of grower respondents who thought that their neighbour(s) (i) did practice an IRM strategy (Yes), (ii) did not practice an IRM strategy (No), or (iii) were uncertain about their neighbour’s practice (Don’t know).
Fig. 5. The percentage of grower respondents whose (i) reseller and (ii) consultant provide information about insecticide resistance management. The grower response to the question about the insecticides currently used for pest control in Brassica crops is summarized in Table 2. The synthetic pyrethroids are the most frequently used insecticide group. They remain so because of their low cost. The second ranked group are the Bacillus thuringiensis products, the use of which has increased significantly since the mid 1990’s because they have become more cost-effective and offer twin advantages of human safety and softness on beneficials. Of the new DBM insecticides, spinosad (Success) and indoxacarb (Avatar) are the most frequently used. Given that DBM populations in Hawaii and Thailand have evolved field levels of resistance to spinosad, the situation with spinosad susceptibility in Australian DBM populations should be monitored closely.
0
20
40
60
80
100
NSW TAS VIC SA WA ALLSTATES
%YesNoDon't know
0
20
40
60
80
100
NSW TAS VIC SA WA ALLSTATES
%
Reseller Consultant

38
Table 2. The relative frequency of application of nine insecticide groups used in Australian Brassica vegetable crops, 2002 AIRAC grower survey. Insecticide type Relative frequency of use Synthetic Pyrethroids 16.8 Bt products 14.9 Spinosad 14.7 Organophosphates 12.7 Indoxacarb 12.4 Emamectin benzoate 9.0 Fipronil 9.0 Chlorfenapyr 5.3 Carbamates 5.1 100.0 III. Grower Issues with the AIRAC IRM Strategy Some growers in several States have raised concerns about the current positioning of several of the insecticides in the AIRAC “two-window” strategy, and of the transition date from the first to the second window. These issues, outlined below, were canvassed with AIRAC at an August 2002 meeting in Brisbane, but still require resolution. 1. Product Repositioning The issues to take into account are:
o Pest activity spectrum (see below). o Effects on beneficials (eg. Regent hard, Success, Proclaim and
Avatar to varying degrees soft). o Environmental conditions, eg. the performance of Regent is reputed to
decline at low temperatures. (This has been investigated in a laboratory study reported elsewhere in this Final Report.)
The pest activity spectrum issues include:
• Heliothis is a more significant problem in Feb-June in QLD and NSW. o Success considered more effective than Proclaim. o NSW growers have asked for a Regent-Success swap because Regent is
considered less effective on Heliothis. (Some NSW growers have alternatively asked for an Avatar-Success swap.)
o However Dow Agrosciences would like to have the same window for Success across all crops on the eastern seaboard. (Success also has activity on lesser lepidopteran pests, namely Hellula, Crocidolomia and Spodoptera).
• Spodoptera more significant problem in June-Oct in QLD.
o Proclaim is considered more effective than Success. o Bt not sufficiently active on Spodoptera.
Hence there is some QLD/NSW grower interest in swapping the respective positions of Success and Proclaim.
39
• Cabbage cluster caterpillar (Crocidolomia) is more of a problem in the Feb-mid June
window. All 5 new products give good control when applied at DBM rate in leaf disc assays (J
Hargreaves, pers. comm.). (Avatar at 1DAT was less effective.) Bt is not sufficiently active on Crocidolomia.
• Centre grub (Hellula) is more of a problem in the Feb-mid June window. Proclaim, Regent, Secure and Success tested and all give good control (J Hargreaves, pers. comm.).
• Cluster caterpillar (Spodoptera) is more of a problem in the mid June-Oct window. • Onion thrips (Thrips tabaci) is more of a problem in the mid June-Oct window.
The T. tabaci activity of Success and Proclaim needs to be determined.
• Ideally have soft options early in season (ie. Feb to mid May in QLD)
2. Window timing Some growers in the Manjimup district of WA and in northern TAS have at times expressed concerns about timing of summer changeover date between the 2 windows. Their preferred changeover date is respectively 30 October and February 15. These issues will continue to be raised and worked through with AIRAC as part of the new HAL project on Brassica pest management (VG03040).

40
WA REPORT ON THE AIRAC “TWO-WINDOW” INSECTICIDE RESISTANCE MANAGEMENT STRATEGY. Françoise Berlandier Department of Agriculture Locked Bag No. 4, Bentley Delivery Centre, WA 6983, Australia.
An insecticide resistance management (IRM) strategy was developed specifically for WA, following the guiding principals including the two-window system developed for the version produced in the Eastern States. The initial version of the IRM was subsequently updated 5 times over the duration of the project, to incorporate changes or additions to pesticide label registrations and any new ideas on IRM strategies. The layout was also updated each time. The original version was printed on A4 paper, but each subsequent updated version was printed double sided on an A5 card, laminated and posted to all Brassica growers and to associated industry parties (eg. crop scouts, resellers, etc) in WA. The updated IRM’s were also promoted and made available at brassica grower meetings held twice a year in the major brassica growing areas of the State, WA metropolitan and the southwest of WA (Albany and Manjimup).
Five new chemicals were registered in Australia for P. xylostella control in Australia over the period 1999-2001. These were fipronil, chlorfenapyr, spinosad, emamectin and indoxacarb. When RMS No. 1 was produced, only fipronil and chlorfenapyr were registered. The following table shows the major changes to the RMS’s at each update.
RMS No. & date updated
Major change accommodated
2 Oct 1999 Incorporated spinosad
3 Sept 2000 Incorporated emamectin, new warning about longer withholding period for export destinations. Warning about Phosdrin review.
4 Jan 2001 Incorporated indoxacarb
5 Sept 2002 The main brassica growing areas of the State broken into two. Two sets of windows, one for each area.
6 Sept 2003 Reverted to using the one window for all brassica growing areas of the State. Re-structured layout of card, making it clearer to read.
An example of the WA “two-window” IRM strategy handout (Update No. 6, September 2003) is provided in Appendix N.

41
ON-FARM MOVEMENT OF MOTHS AND PARASITOIDS Nancy A. Schellhorn1, Cate Paull1 and Gitta Siekmann2 1South Australian Research and Development Institute, GPO Box 397, Adelaide, SA 5001, Australia. 2Department of Plant Sciences, The University of Adelaide, PMB 1, Glen Osmond, SA 5064, Australia. Background: Understanding the local movement or dispersal of insect pests is important to design IPM / IRM strategies. At the Fourth International Conference on Diamondback Moth in Melbourne in November, diamondback moth (DBM), Plutella xylostella, movement was identified as the most important issue to study. In South Australia, Mo et al. (2003), as part of HAL Project VG97014, found that on-farm populations of DBM dispersed short distances (average 12-35 m, with 95% expected to remain within 200m of release points) within healthy crops. In addition to on-farm dispersal of DBM within healthy crops, understanding their dispersal from harvested brassica vegetables to young vegetables may enhance DBM and beneficial insect management. Objectives: Marking insect populations to monitor their movement is expensive and logistically difficult. Herein we report on experiments to: 1. test the effectiveness of a novel marking technique using non-toxic dyes to mark natural field
populations of DBM and the main parasitoid (Diadegma semiclausum) (These results are attached as Appendix G, Schellhorn et al. (2004), The use of dusts and dyes to mark populations of beneficial insects in the field),
2. determine on-farm movement of DBM and D. semiclausm from mature to young plants, (These results are attached as Appendix H, Schellhorn and Silberbauer (2002), The role of surrounding vegetation and refuges: Increasing the effectiveness of predators and parasitoids in cotton and broccoli systems), and
3. understand if movement is random or directed (below). Materials and Methods: Marking technique The methods are described in detail in attached manuscript of Schellhorn et al (2004) (Appendix G). Movement from mature to young plants The methods are described in detail in attached manuscript Schellhorn and Silberbauer (2002) (Appendix H). Directed Movement and Spatial distribution To determine if moth and parasitoid movement was directed we first sprayed a 210 x 10 m bay of broccoli with green fluorescent dye. Next we placed four yellow sticky buckets traps approximately 35 m apart in the adjacent bay 12 m away, and the bay of broccoli 36 m away. We repeated the yellow sticky bucket trap placement 12 m into bare soil, and 36 m into bare soil, for a total of 16 traps. The traps were left in the field for 5 days, and then they were removed and returned to the laboratory and examined for marked insects.

42
Next we again sprayed the bay of broccoli with green fluorescent dye placed new traps in the same locations and then cultivated the dyed bay of broccoli so that only bare earth and plant stubble remained. The traps were left in the field for 4 days and then they were removed and returned to the laboratory and examined for marked insects. The spatial pattern of moths and parasitoids was determined by using spatial analysis by distance indices (SADIE; Perry and Hewitt 1991). Because the yellow sticky bucket traps were placed as a grid with x and y coordinates, the insects that were trapped could be analysed to distinguish spatial non-randomness. Results: Marking technique The use of resin-based fluorescent dyes to mark field-based populations of DBM and D. semiclausum was extremely effective. The resin-based dye is highly UV stable, effective in rain and irrigation, and a very inexpensive marking method. The benefits of this technique include marking natural field populations of insect pests without having to rear and handle laboratory populations, and marking the most abundant parasitoid of DBM. Movement from mature to young plants We monitored DBM and D. semiclausum movement from harvested, mature broccoli before and after cultivation. Before cultivation, DBM disperses very short distances, 85% of the population within 12 m. After cultivation, where you might expect DBM to disperse widely, 90% of the population moved to the closest bay of broccoli. Before cultivation 81% of marked D. semiclausum where dispersing within 12 m., but after cultivation greater than 50% were dispersing further than the closest bay of broccoli. Within 24 hours, 5% of marked individuals had dispersed 60 m into the young broccoli. After cultivation, 7% of the population had dispersed 108 m into the young broccoli. Directed Movement and Spatial distribution Moth movement is directed towards the host plant (broccoli) before and after cultivation (Fig 1.). Fig. 1. Distance moved from dyed broccoli into adjacent broccoli, 12 m and 36 m, and into bare soil –12 m and –36 m for a) DBM and b) D. semiclausum before and after cultivation.
0
10
20
30
40
50
-36 -12 12 36
Num
ber
mar
ked
0
20
40
60
80
100
- 36 - 12 1 2 36
Dis tance f rom dye d broccoli (m)
Num
ber
mar
ked
= Before= After
a)
b)
0
10
20
30
40
50
-36 -12 12 36
Num
ber
mar
ked
0
20
40
60
80
100
- 36 - 12 1 2 36
Dis tance f rom dye d broccoli (m)
Num
ber
mar
ked
= Before= After
0
10
20
30
40
50
-36 -12 12 36
Num
ber
mar
ked
0
20
40
60
80
100
- 36 - 12 1 2 36
Dis tance f rom dye d broccoli (m)
Num
ber
mar
ked
= Before= After= Before= After
a)
b)

43
In addition, before cultivation D. semiclausum movement is not directed towards broccoli, instead their movement is random, but after cultivation their movement is directed to the nearest broccoli (Fig 1). For moths, before cultivation the spatial distribution of the background population on the property is random (Ia=0.912, Pa=0.579), and the marked individuals are just slightly aggregated (Ia=1.297, Pa=0.090). After cultivation the spatial distribution of the background population is still random (Ia=1.052, Pa=0.344), and the marked individuals are also random (Ia=1.170, Pa=0.196). For D. semiclausum, before cultivation the spatial distribution of the background population and marked individuals on the property is slightly aggregated, respectively (Ia=1.362, Pa=0.064, Ia=1.454, Pa=0.042). After cultivation the spatial distribution of the background population and marked individuals is random, respectively (Ia=1.127, Pa=0.239, Ia=0.971, Pa=0.491). Discussion: Moths move to the nearest host plant before and after cultivation. This suggests that moths do not preferentially move to the young plantings, but they do move next door. Diadegma move from the mature planting to the adjacent planting and after cultivation they move further a field. The combined understanding of how the major beneficial insect and pest move suggest that mature harvested plants can be left in the field to act as a nursery crop for producing Diadegma that will disperse widely on-farm and attack diamondback larvae. The best way to increase the abundance of Diadegma on-farm without increasing DBM larval populations is to use Bt sprays and pay particular attention to the crop adjacent to the on-farm nursery. Regular and specific monitoring of the adjacent bay of brassica should assure that the pest population does not grow out of control. Discussion about Marking Technique and Movement from Mature to Young Plants can be found in the papers listed above in the objective section. Literature Cited: Jianhua, Mo, Greg Baker, Mike Keller and Rick Roush. 2003. Local dispersal of the
diamondback moth (Plutella xylostella L.) (Lepidoptera: Plutellidae). Environmental Entomology 32: 71-79.
Perry, J.N. and M. Hewitt. 1991. A new index of aggregation for animal counts.
Biometrics 47: 1505-1518. Schellhorn, N.A. and L. Silberbauer. 2002. The role of surrounding vegetation and refuges: increasing the effectiveness of predators and parasitoids in cotton and
broccoli systems. Proceedings of the 1st International Symposium on Biological Control of Arthropods. Pp. 235-243.
Schellhorn, N.A., G. Siekmann, C. Paull, G. Furness and G. Baker. 2004. The use of
dusts and dyes to mark beneficial insects in the field. International Journal of Pest Management. In press.

44
PROPERTY-TO-PROPERTY MOVEMENT
Nancy Schellhorn1, Lou Maratos2 and Judy Bellati1 1South Australian Research and Development Institute, GPO Box 397, Adelaide, SA 5001, Australia. 2Department of Plant and Pest Sciences, The University of Adelaide, PMB 1, Glen Osmond, SA 5064, Australia. Background: Understanding diamondback moth and beneficial insect movement is important to design IRM / IPM strategies, but also to managing beneficial insects. Specifically information on moth movement between adjacent properties is important for grower adoption of IRM / IPM strategies. Objectives: We conducted experiments to determine if: 1) diamondback moths and key beneficial insects move between adjacent properties, and 2) whether disturbance increased movement. Material and Methods: Movement between Properties The study was conducted on two properties in Virginia, SA, where the dyed fields on each were ca. 1245 m apart. Three experiments were conducted to determine if moths and beneficial insects move from property A to B when: 1) the crop was rotary hoed on property A, 2) when the crops were rotary hoed on each property, and 3) when property A was completely rotary hoed, and only a small island of brassicas (less than 10 x 50 m) remained on property B. The broccoli on property A measured 230 x 210 m, and the cabbage on property B was divided into two long bays measuring 15 x 520 m and 10 x 300 m each separated by 275 m (Fig. 1). On property A, there were 15 bays of broccoli differing in maturity by 4 weeks. The broccoli increased in maturity from east to west, and the process was to harvest broccoli and then rotary hoe plants. Grids for setting up traps were established on each property. On property A there was a coarse and fine scale grid. The coarse grain grid included the broccoli field, a senescing oat field and bare soil. Each trap was spaced from one another 75 m north to south and 50 m east to west. Yellow-sticky-buckets (34) and pheromone traps (33) alternated east to west so that a particular type of trap was placed at a distance of 75 m north to south and 100 m east to west. Most traps extended 675 m from the broccoli to the river and then stopped at the scrub-gum tree-river boundary. The fine grain grid included only the broccoli field and yellow-sticky-bucket traps and were placed 34 m apart from north to south and 20 m apart from east to west. There were a total of 30, 25, and 24 yellow-sticky-bucket traps for experiment 1, 2, and 3, respectively.

45
Fig. 1. A schematic of the two properties and surrounding landscape, Virginia, SA. Shaded blocks represent broccoli on property A and cabbage on property B. On property B both bays were mature and close to harvest. A coarse grain grid was established that included cabbage and bare soil. Each trap was placed at a distance of 75 m north to south and 50 m east to west. Yellow-sticky-buckets and pheromone traps alternated east to west so that a particular type of trap was placed at a distance of 75 m north to south and 100 m east to west. The traps extended 300 m from the cabbage to the river and then stopped at the scrub-gum tree-river boundary. There were a total of 30 yellow-sticky-bucket traps and 25 pheromone traps. On both properties, suction sampling was conducted in the broccoli and cabbage. Each sample consisted of a 30 row m replicated between 8 and 18 times.
For experiment 1, on 7 November 2002, as soon as each bay of broccoli was harvested, we sampled insects to estimate density, sprayed pink fluorescent dye (Schellhorn et al 2004) on a bay of broccoli measuring 15 x 210 m. The area sprayed with pink represented less than 7% of the brassica area on Property A, and from that area only a proportion of moths were marked. Next, at property A and B we placed yellow-sticky-bucket and pheromone traps at the coarse scale grid and in addition on property A placed yellow-sticky-bucket traps at the fine scale grid. The sprayed bay of broccoli was then rotary hoed, and the traps in the coarse and fine grid were left for seven days and then returned to the laboratory to examine them for marked insects (Schellhorn et al 2004). Two randomly selected quarters of each yellow-sticky-buckets were sampled. At 48 and 96 hrs suction samples were taken throughout the broccoli on property A, and in the 15 x 520 m cabbage on property B. For experiment 2, on 15 November 2002, the process was repeated as for experiment 1 except that the 15 x 520 m bay of cabbages (80% were harvested so only the wrapper leaves remained) was sprayed with green fluorescent dye (Schellhorn et al 2004), and a new 15 x 210 m bay of broccoli was sprayed with pink fluorescent dye. The area sprayed with green represented greater than 75% of the brassica crop remaining. Again, only a proportion of the moths were marked. Next, new traps were placed on the same grid and the 15 x 520 m bay of cabbage and 15 x 210 m
1245 m
BareSoil
BareSoil
BareSoil
OATS
POTATO
520 m
300 m BareSoil
BareSoil
230 m
N
W
wind
wind
RiverProperty A
Property B
1245 m
BareSoil
BareSoil
BareSoil
OATS
POTATO
520 m
300 m BareSoil
BareSoil
230 m
N
W
wind
wind
RiverProperty A
Property B

46
bay of broccoli were rotary hoed. On both properties all traps in the coarse grain grid were left in the field for 14 days, while on property A traps in the fine scale grid were replaced twice seven days apart. Suction samples were taken at 48 and 96 hrs throughout remaining broccoli and from the 10 x 300 m cabbage on property B. For experiment 3, on 28 November 2002, another 15 x 210 m bay of broccoli was sprayed with pink fluorescent dye, new buckets were placed on the coarse grain grid through the senescing oats and bare soil and then the entire broccoli field was rotary hoed. On property B, new traps were placed in the same grid. All traps were left in the field for 14 days. Eight suction samples were taken from the 10 x 300 m cabbage on property B. Spatial Pattern and Species Association The spatial pattern of moths and parasitoids was determined by using spatial analysis by distance indices (SADIE; Perry and Hewitt 1991). Ia represent the index for distance to regularity, with Ia=1 being random, Ia > 1 being aggregated, and Ia < 1 being uniform. If Pa, the associated statistic, is < 0.025 then reject the null in favour of aggregation, or if Pa > 0.975 then reject the null in favour of regularity. The index of species association is Xp, and the associated statistic (with similar probabilities as Pa) is Pxp. Because the yellow sticky bucket traps were placed as a grid with x and y coordinates at a fine grain in the broccoli crop and coarse grain over the landscape, the marked insects that were trapped could be analysed to distinguish spatial non-randomness, and species association. Results: Movement between Properties Diamondback moths move between properties. Pheromone traps, yellow-sticky-bucket traps and suction sampling captured marked moths from source and adjacent properties (Table 1 and 2, respectively). Green dye was not sprayed for the 7 Nov 2002 data collection, so a dash (-) in the table indicates that the dye had not been applied. Table 1. Number of marked moths captured in pheromone traps and yellow-sticky-bucket traps from each property. Number in brackets is the total no. of moths captured. The no. in bold is the no. of moths that moved from an adjacent property.
PHEROMONE TRAPS
Property A (pink)
Property B (green)
Moth colour: 15-28 Nov 28 Nov – 4 Dec
15-28 Nov 28 Nov – 4 Dec
Pink 62 (1056) 20 (120) 1 (1076) 1 (139) Green 12 (1056) 0 (120) 357 (1076) 0 (139)
YELLOW-STICKY-BUCKET TRAPS
Property A (pink)
Property B (green)
Moth colour: 7-15 Nov 15 Nov – 4 Dec
7-15 Nov 28 Nov – 4 Dec
Pink 104 (4613) 62 (3792) 1 (727) 3 (1201) Green - (4613) 0 (3792) - (727) 248 (1201)

47
Table 2. Number of marked moths captured using suction sampling from each property. Number in brackets is the total number of moths captured. The number in bold is the number of moths that moved from an adjacent property.
Property
Moth colour
A (pink) B (green) Pink 7 (494) 0 (329)
Green 2 (494) 10 (329) However, in all cases the frequency of occurrence was low. If the frequency of movement between properties is determined by dividing the number of marked immigrants by the total number of moths at the source, then the frequency of between property movement ranged from 0.1 – 1.1 %. Of the moths that moved from one property to another, they were males (except two individuals that were unidentifiable). If instead the number of marked immigrants were divided by the number of marked source moths, then the frequency of movement ranged from 1-5%. The parasitic wasp, Diadegma semiclausum, the transverse ladybird beetle, Coccinella transversalis, the brown lacewing, Micromus tasmaniae, and the damsel bug, Nabis kinbergii moved between properties, but at a low frequency (Table 3.). However suction sampling gave better results than yellow-sticky-bucket traps (Table 4). The highest frequency was 14 green Diadegma captured on property A out of 132 marked individuals (10.6%). Table 3. Number of marked insects captured using suction sampling from each property. Number in brackets is the total number of moths captured. The number in bold is the number of insects that moved from an adjacent property.
Insect colour
Property
Diadegma: A (pink) B (green) Pink 34 (801) 2 (870)
Green 14 (801) 132 (870) C. transversalis:
Pink 10 (548) 0 (48) Green 2 (548) 1 (48)
M. tasmaniae: Pink 6 (392) 1 (169)
Green 1 (392) 8 (169)
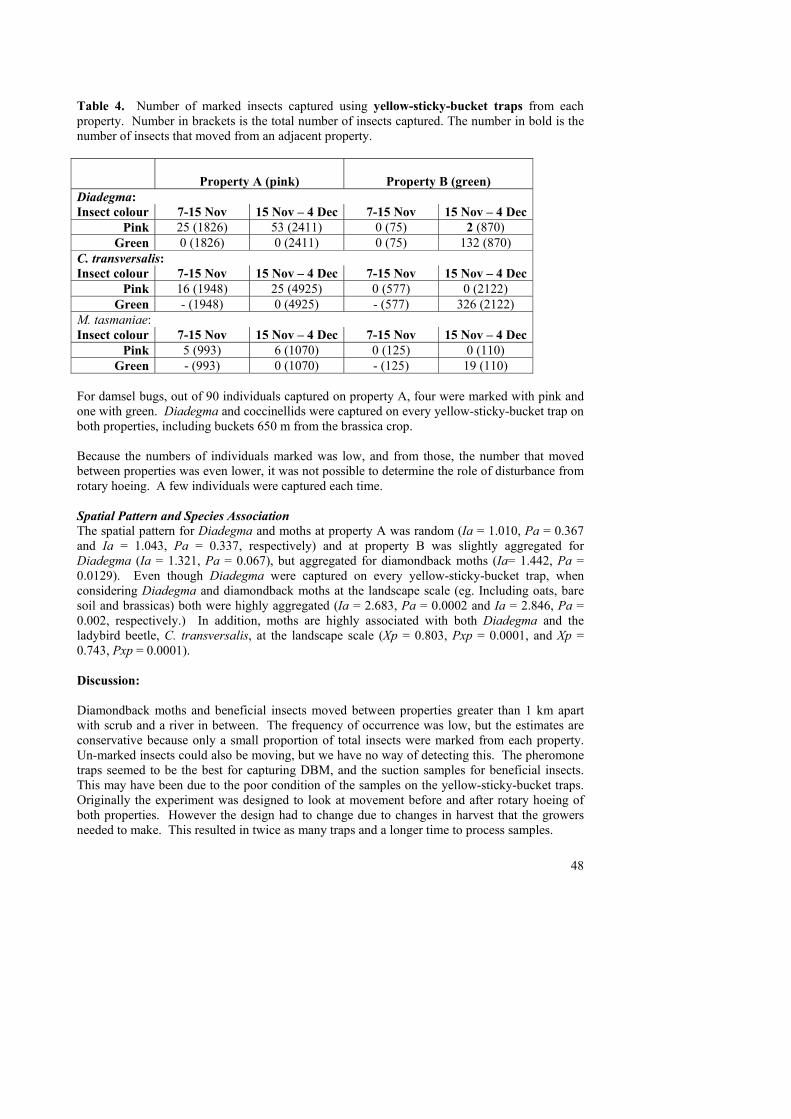
48
Table 4. Number of marked insects captured using yellow-sticky-bucket traps from each property. Number in brackets is the total number of insects captured. The number in bold is the number of insects that moved from an adjacent property.
Property A (pink)
Property B (green) Diadegma: Insect colour 7-15 Nov 15 Nov – 4 Dec 7-15 Nov 15 Nov – 4 Dec
Pink 25 (1826) 53 (2411) 0 (75) 2 (870) Green 0 (1826) 0 (2411) 0 (75) 132 (870)
C. transversalis: Insect colour 7-15 Nov 15 Nov – 4 Dec 7-15 Nov 15 Nov – 4 Dec
Pink 16 (1948) 25 (4925) 0 (577) 0 (2122) Green - (1948) 0 (4925) - (577) 326 (2122)
M. tasmaniae: Insect colour 7-15 Nov 15 Nov – 4 Dec 7-15 Nov 15 Nov – 4 Dec
Pink 5 (993) 6 (1070) 0 (125) 0 (110) Green - (993) 0 (1070) - (125) 19 (110)
For damsel bugs, out of 90 individuals captured on property A, four were marked with pink and one with green. Diadegma and coccinellids were captured on every yellow-sticky-bucket trap on both properties, including buckets 650 m from the brassica crop. Because the numbers of individuals marked was low, and from those, the number that moved between properties was even lower, it was not possible to determine the role of disturbance from rotary hoeing. A few individuals were captured each time. Spatial Pattern and Species Association The spatial pattern for Diadegma and moths at property A was random (Ia = 1.010, Pa = 0.367 and Ia = 1.043, Pa = 0.337, respectively) and at property B was slightly aggregated for Diadegma (Ia = 1.321, Pa = 0.067), but aggregated for diamondback moths (Ia= 1.442, Pa = 0.0129). Even though Diadegma were captured on every yellow-sticky-bucket trap, when considering Diadegma and diamondback moths at the landscape scale (eg. Including oats, bare soil and brassicas) both were highly aggregated (Ia = 2.683, Pa = 0.0002 and Ia = 2.846, Pa = 0.002, respectively.) In addition, moths are highly associated with both Diadegma and the ladybird beetle, C. transversalis, at the landscape scale (Xp = 0.803, Pxp = 0.0001, and Xp = 0.743, Pxp = 0.0001). Discussion: Diamondback moths and beneficial insects moved between properties greater than 1 km apart with scrub and a river in between. The frequency of occurrence was low, but the estimates are conservative because only a small proportion of total insects were marked from each property. Un-marked insects could also be moving, but we have no way of detecting this. The pheromone traps seemed to be the best for capturing DBM, and the suction samples for beneficial insects. This may have been due to the poor condition of the samples on the yellow-sticky-bucket traps. Originally the experiment was designed to look at movement before and after rotary hoeing of both properties. However the design had to change due to changes in harvest that the growers needed to make. This resulted in twice as many traps and a longer time to process samples.

49
We would have expected higher marking rates as well. This may have been due to the fact that we had to drive over the plants to spray the dye, causing exceptional disturbance, hence low marking rates, but more likely was due to the relatively low densities. Moth and parasitoid densities at property A were 0.2 and 0.23 per m2, and at property B were 0.27 and 0.61 per m2. Wind was not the cause of movement between the properties because movement happened in both directions. Predominant wind directions were from the west every afternoon, but North in the morning and mid-day (Fig. 1). Depending on the spatial scale (eg. within crop or landscape), moths and parasitoids were distributed randomly within a crop (see on-farm movement paper) and highly aggregated across a landscape that included bare soil and senescing oats. The moths and beneficial insects were also highly associated. This was not surprising given that they are insects specialising on brassicas and the other choices in the landscape in our study were bare soil and senescing oats. Our results show that a low frequency of moths and beneficials are moving between properties even when host plants are available on the property of origin. Given that moths are moving, the best chance that growers have to delay resistance is by following the two-window strategy. These estimates of moth movement can be used to model development and dilution of resistance in hypothetical populations. Literature Cited: Perry, J.N. and M. Hewitt 1991. A new index of aggregation for animal counts.
Biometrics 47: 1505-1518. Schellhorn, N.A., G. Siekmann, C. Paull, G. Furness and G. Baker. 2004. The use of
dusts and dyes to mark beneficial insects in the field. International Journal of Pest Management. In press
Acknowledgments: We would like to express our sincere thanks to Steve Newman and Rob Marcoionni for allowing us to conduct our experiments on their properties.

50
MANAGING NATURAL ENEMIES
Michael Keller Plant and Pest Science, The University of Adelaide
Introduction: The role of natural enemies in suppressing populations of the diamondback moth (DBM) is widely recognised. Although parasitic wasps and predators do not eliminate the need for control by insecticides, they can substantially reduce the need for sprays. Parasitism levels of 90% or more are not unusual in broccoli crops. Nevertheless, farmers still regularly apply insecticides sprays to suppress larval numbers. The use of “soft” insecticides that do not kill natural enemies and the acceptance of higher action threshold densities ate which spray are applied will help to conserve their populations. Producers may benefit further if the activities of natural enemies were enhanced and more consistent. This portion of the project aimed to investigate ways to make the suppression of larval DBM by parasitic wasps and predators more effective and reliable. The research combined laboratory experiments, field cage experiments and on-farm experiments. Floral nectar and parasitoids: The first experiment aimed at investigating the effects of floral nectar on the longevity of parasitoids. Research on other species had indicated that sugar sources could increase the longevity of parasitic wasps. Diadegma semiclausum (Hymenoptera: Ichneumonidae) is the most abundant parasitoid of larval DBM in Australia, so it was selected as the experimental subject. This experiment involved placing newly emerged solitary females into cages made from 2 l plastic bottles. The bottles had holes covered by screen for aeration. They were placed over flowering stems of selected plants and sealed around the stems with a plug of foam rubber. Two plants were investigated, alyssum (Lobulairia maritima cv. “Creamery” n=8) and “Carpet of Snow” (n=6), Brassicaceae) and buckwheat (Fagopyrum esculentum, Polygonaceae) (N=14). Both have been reported to provide nectar that prolongs the life of parasitic wasps. In two treatments, the cages only had water provided on a wick (N=13), or water and honey drops on the side of the cages (N=13). These provided positive and negative controls. The experiments were conducted in a room at 25oC and a photoperiod of 14L:10D. The experiment demonstrated the beneficial effects of sugar sources on parasitoid longevity (Figure 1). Honey gave the greatest benefit, possibly because it was always available in excess of demand. Buckwheat prolonged the life of female wasps nearly ten times longer than water alone. Neither variety of alyssum prolonged life significantly longer than water alone. The lack of a significant response to the presence of alyssum flowers may have been due to the environmental conditions of the experiment. Low light levels may have reduced the production of nectar. This experiment demonstrated potential benefits of providing floral nectar to parasitic wasps. Wasps that live longer should have a greater capacity to parasitise larval DBM. Also, the experiment indicated that some flowers may provide greater benefits than others. Foraging behaviour of Diadegma semiclausum: The foraging behaviour of D. semiclausum was investigated by Lucinda Thompson in an Honours thesis project associated with the national DBM project and supervised by M. Keller and N. Schellhorn. Two main experiments were conducted. The first concerned the effects of sugar on foraging activities and the second focused on movement patterns in the field.

51
0
0.5
1
0 20 40 60 80
Longevity (days)
Fraction alive
WaterAlyssumBuckwheatHoney
Figure 1. Effects of selected sugar sources on the longevity of Diadegma semiclausum. The
alyssum variety shown was “Carpet of Snow;” results for the “Creamery” variety were virtually the same and are not shown. Mean longevities (std. dev.) were: water 2.3 (0.1) days; alyssum 3.5 (0.3) days, buckwheat 13.7 (1.6) days; honey 38.0 (4.7) days.
The effects of sugar feeding, temperature, wasp experience and density of larval DBM on wasp foraging behaviour were studied in an experiment that was conducted in a field cage. Thiry two wasps were observed, eight per treatment. Wasps that had access to honey and water were more active and parasitised more larvae than wasps that only had access to water for one day prior to the experiment. Five factors were shown to influence the foraging activities of wasps on plants (Table 1). Wasps left plants more quickly when they were infested with 1 larval DBM compared to plants bearing six larvae, irrespective of their level of hunger. Oviposition experience was shown to have a complex influence on foraging behaviour. Wasp foraging activity was higher when the temperature exceeded 27oC, than at lower temperatures. Wasps that had never oviposited had a lower tendency to leave a plant than when wasps oviposited for the first time. Thereafter, wasps that had oviposited at least once left plants more slowly following subsequent oviposition events. The most important practical implication of these results is that providing nectar sources for wasps should enhance their foraging activities. The second experiment concerned the patterns of movement by wild foraging D. semiclausum in a broccoli crop at Cudlee Creek, South Australia between 12th and 26th February 2002. Wild females were located and tracked by two or more observers. The plants the females visited were marked and movements were recorded. The time spent on each plant, movement distances between plants and turning angles were measured. The effects of plant height, temperature, humidity and presence of larval DBM on the tendency to leave plants was analysed using Cox’s Proportional Hazards Model. The presence of DBM was the only factor that was shown to influence foraging behaviour. Wasps searched longer on plants that were infested with host larvae. Based on measured patterns of movement, distances travelled by wasps each day were estimated with Monte Carlo simulation. Wasps were projected to search a mean 73 plants per hour or 818 plants per 12 hour day. In one hour, they would be expected to travel a mean distance of 37 m with a net displacement of 6 m. These distances increased to 409 m travelled in a 12 hour day with a net displacement of 55 m. These movements would be influenced by
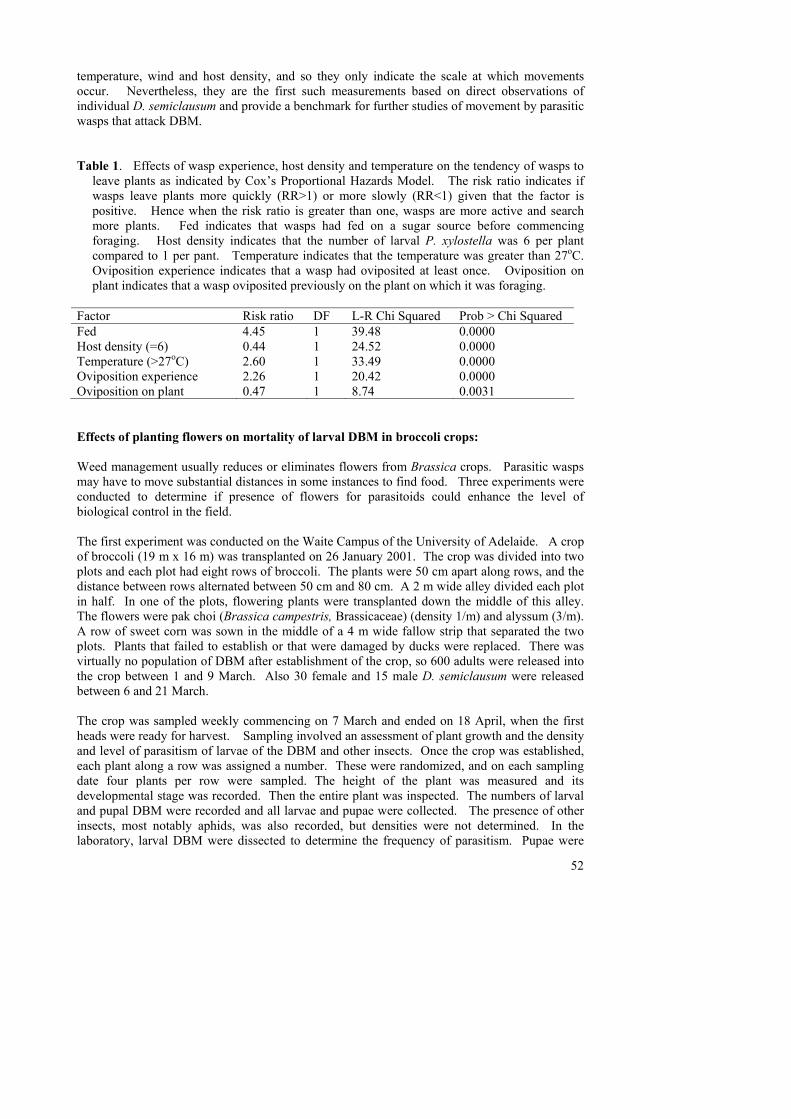
52
temperature, wind and host density, and so they only indicate the scale at which movements occur. Nevertheless, they are the first such measurements based on direct observations of individual D. semiclausum and provide a benchmark for further studies of movement by parasitic wasps that attack DBM. Table 1. Effects of wasp experience, host density and temperature on the tendency of wasps to
leave plants as indicated by Cox’s Proportional Hazards Model. The risk ratio indicates if wasps leave plants more quickly (RR>1) or more slowly (RR<1) given that the factor is positive. Hence when the risk ratio is greater than one, wasps are more active and search more plants. Fed indicates that wasps had fed on a sugar source before commencing foraging. Host density indicates that the number of larval P. xylostella was 6 per plant compared to 1 per pant. Temperature indicates that the temperature was greater than 27oC. Oviposition experience indicates that a wasp had oviposited at least once. Oviposition on plant indicates that a wasp oviposited previously on the plant on which it was foraging.
Factor Risk ratio DF L-R Chi Squared Prob > Chi Squared Fed 4.45 1 39.48 0.0000 Host density (=6) 0.44 1 24.52 0.0000 Temperature (>27oC) 2.60 1 33.49 0.0000 Oviposition experience 2.26 1 20.42 0.0000 Oviposition on plant 0.47 1 8.74 0.0031 Effects of planting flowers on mortality of larval DBM in broccoli crops: Weed management usually reduces or eliminates flowers from Brassica crops. Parasitic wasps may have to move substantial distances in some instances to find food. Three experiments were conducted to determine if presence of flowers for parasitoids could enhance the level of biological control in the field. The first experiment was conducted on the Waite Campus of the University of Adelaide. A crop of broccoli (19 m x 16 m) was transplanted on 26 January 2001. The crop was divided into two plots and each plot had eight rows of broccoli. The plants were 50 cm apart along rows, and the distance between rows alternated between 50 cm and 80 cm. A 2 m wide alley divided each plot in half. In one of the plots, flowering plants were transplanted down the middle of this alley. The flowers were pak choi (Brassica campestris, Brassicaceae) (density 1/m) and alyssum (3/m). A row of sweet corn was sown in the middle of a 4 m wide fallow strip that separated the two plots. Plants that failed to establish or that were damaged by ducks were replaced. There was virtually no population of DBM after establishment of the crop, so 600 adults were released into the crop between 1 and 9 March. Also 30 female and 15 male D. semiclausum were released between 6 and 21 March. The crop was sampled weekly commencing on 7 March and ended on 18 April, when the first heads were ready for harvest. Sampling involved an assessment of plant growth and the density and level of parasitism of larvae of the DBM and other insects. Once the crop was established, each plant along a row was assigned a number. These were randomized, and on each sampling date four plants per row were sampled. The height of the plant was measured and its developmental stage was recorded. Then the entire plant was inspected. The numbers of larval and pupal DBM were recorded and all larvae and pupae were collected. The presence of other insects, most notably aphids, was also recorded, but densities were not determined. In the laboratory, larval DBM were dissected to determine the frequency of parasitism. Pupae were

53
held in vials closed with a cotton wool plug to determine viability and the frequency of parasitism. In the first experiment, flowers did not reduce populations of DBM (Fig. 2). There were no consistent differences in rates of parasitism between the treatments (Fig. 3). Although the species of parasitoids was not determined by dissections, visual censuses indicated that D. semiclausum was the dominant parasitoid and Apanteles ippeus Nixon (Hymenoptera: Braconidae) was also abundant. An outbreak of cabbage aphids on flowers of pak choi spread to the broccoli, so this species would not be a suitable nectar source to complement Brassica crops. Figure 2. Densities of fourth instar DBM on broccoli in the Small Plot Experiment at Urrbrae, South Australia (values are mean + 95% confidence interval). Figure 3. Parasitism of fourth instar DBM on broccoli in the Small Plot Experiment at Urrbrae,
South Australia (values are mean + 95% confidence interval). The second experiment was conducted in a commercial broccoli crop at Virginia, South Australia. In this experiment, flowers were grown within the crop alleys. Broccoli was transplanted weekly in 21 row strips (10.4 m wide), and each strip was separated by a 2.8 m alley. Flowering plants were transplanted for a distance of 30 m from one boundary along the centers of two alleys flanking a broccoli strip that was transplanted 28 March 2001. One pak choi, six alyssum, and one dill (Anethum graveolens L., Apiaceae) were transplanted per metre on 12 April. The alyssum was flowering at the time of transplanting, pak choi began flowering
0
1
2
3
4
5
28-Feb 15-Mar 30-Mar 14-Apr 29-Apr
Den
sity
(no.
/pla
nt)
No FlowersFlowers
0
25
50
75
100
28-Feb 15-Mar 30-Mar 14-Apr 29-Apr
% P
aras
itism
No Flowers Flowers

54
approximately one week later, and the dill never flowered. A gap of 30 m separated the flowers from a second plot within the crop that was sampled but had no flowers. All larval and pupal DBM were collected from 25 randomly selected plants from each plot on each sampling date between 19 April and 15 June, when plants were nearly ready to harvest. Larvae were dissected to determine the level of parasitism, and pupae were held in vials closed with a cotton wool plug to determine viability and the level of parasitism. The species of parasitoids that were attacking larval DBM was determined by rearing additional larvae collected on two dates (10 and 24 May). The height and developmental stage of each plant were also recorded. The farmer applied one spray of Bacillus thuringiensis (Berliner) (Dipel) on 23 April and one spray of trace elements on 4 June. No suppression of DBM was observed in the second experiment in the commercial broccoli crop (Fig. 4). The population of DBM declined at the end of the experiment due to an epizootic of Zoophthora radicans (Brefeld) Batko (Zygomycetes: Entomophthorales). There were no consistent differences in rates of parasitism between the treatments (Fig. 5). Larval parasitism (n = 47) was predominantly caused by D. semiclausum (72%) and to a lesser extent by A. ippeus (28%). Diadegma semiclausum and A. ippeus were observed feeding from flowers of Chinese cabbage and alyssum. Both species flowered throughout the experiments. Figure 4. Densities of fourth-instar DBM on broccoli in a commercial broccoli crop at Virginia,
South Australia (values are mean + 95% confidence interval).
0.0
1.0
2.0
3.0
15-Apr 13-May 10-Jun
Larv
ae/p
lant
Flowers
No Flowers
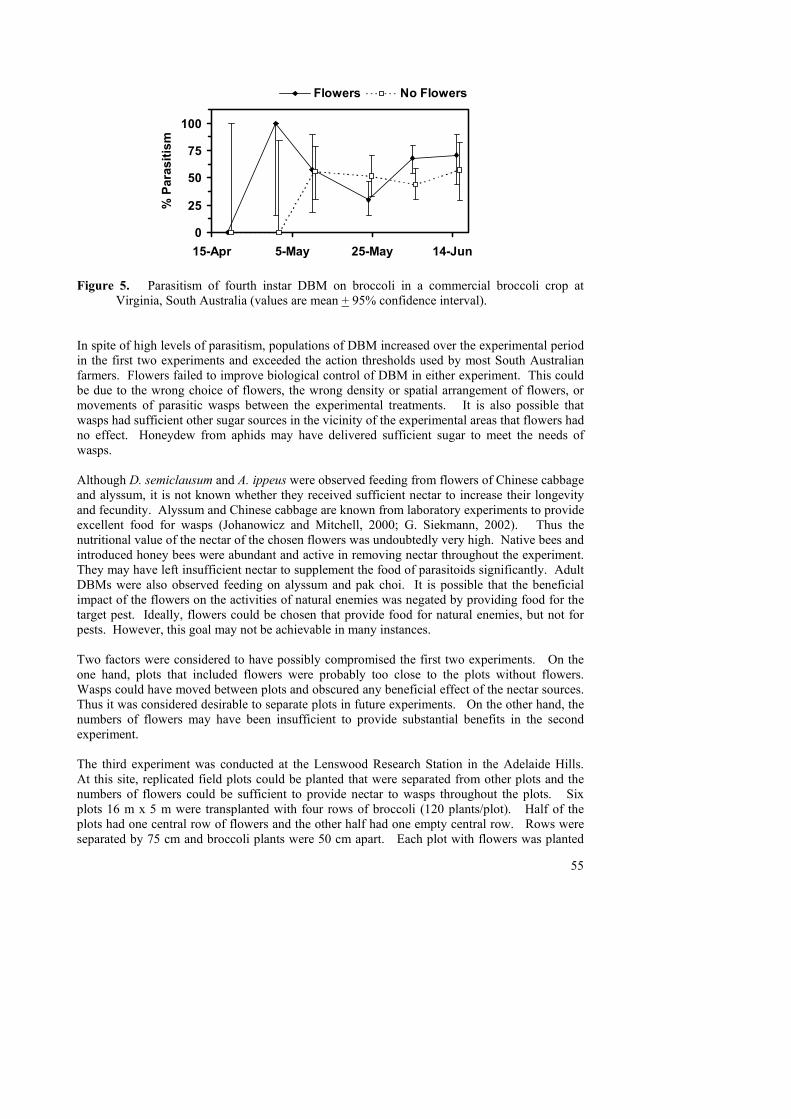
55
Figure 5. Parasitism of fourth instar DBM on broccoli in a commercial broccoli crop at
Virginia, South Australia (values are mean + 95% confidence interval). In spite of high levels of parasitism, populations of DBM increased over the experimental period in the first two experiments and exceeded the action thresholds used by most South Australian farmers. Flowers failed to improve biological control of DBM in either experiment. This could be due to the wrong choice of flowers, the wrong density or spatial arrangement of flowers, or movements of parasitic wasps between the experimental treatments. It is also possible that wasps had sufficient other sugar sources in the vicinity of the experimental areas that flowers had no effect. Honeydew from aphids may have delivered sufficient sugar to meet the needs of wasps. Although D. semiclausum and A. ippeus were observed feeding from flowers of Chinese cabbage and alyssum, it is not known whether they received sufficient nectar to increase their longevity and fecundity. Alyssum and Chinese cabbage are known from laboratory experiments to provide excellent food for wasps (Johanowicz and Mitchell, 2000; G. Siekmann, 2002). Thus the nutritional value of the nectar of the chosen flowers was undoubtedly very high. Native bees and introduced honey bees were abundant and active in removing nectar throughout the experiment. They may have left insufficient nectar to supplement the food of parasitoids significantly. Adult DBMs were also observed feeding on alyssum and pak choi. It is possible that the beneficial impact of the flowers on the activities of natural enemies was negated by providing food for the target pest. Ideally, flowers could be chosen that provide food for natural enemies, but not for pests. However, this goal may not be achievable in many instances. Two factors were considered to have possibly compromised the first two experiments. On the one hand, plots that included flowers were probably too close to the plots without flowers. Wasps could have moved between plots and obscured any beneficial effect of the nectar sources. Thus it was considered desirable to separate plots in future experiments. On the other hand, the numbers of flowers may have been insufficient to provide substantial benefits in the second experiment. The third experiment was conducted at the Lenswood Research Station in the Adelaide Hills. At this site, replicated field plots could be planted that were separated from other plots and the numbers of flowers could be sufficient to provide nectar to wasps throughout the plots. Six plots 16 m x 5 m were transplanted with four rows of broccoli (120 plants/plot). Half of the plots had one central row of flowers and the other half had one empty central row. Rows were separated by 75 cm and broccoli plants were 50 cm apart. Each plot with flowers was planted
0
25
50
75
100
15-Apr 5-May 25-May 14-Jun
% P
aras
itism
Flowers No Flowers
56
with a mixture of 32 alyssum, 32 buckwheat and 12 Queen Anne’s lace (Ammi majus, Apiaceae) that were evenly spaced along the central row. Plots were treated with Stomp herbicide 24 hr prior to transplanting, which was then watered in. Plots were planted 6th February 2002. Each plant received a teaspoon of slow release fertiliser and was watered immediately after transplanting. Plot 2 was defoliated by rabbits by Friday 8th February. Chicken wire fences were erected around all plots that day, and the plot was re-planted on 11th February. Plot 5 was invaded by snails (Helix aspersa, Pulmonata: Helicidae) and plot 4 was infested by Portugese millipedes (Ommatoiulus moreleti, Diplopoda: Julidae), so both were treated with metaldehyde snail bait on 8th February. Plants were sampled weekly between 19th February and 16th April when virtually all plants had large heads and were ready for harvest. All plants flowered throughout the period of sampling, but Queen Anne’s lace and alyssum provided the largest number of flowers. Parasitism was determined by dissecting fourth instar larvae. This stage as chosen as an indicator since larvae parasitised in earlier stages are not killed until the fourth instar or the pupal stage. The results of the third experiment were equivocal. Densities of larval DBM were typically lower in two of the plots with flowers (Plots 2 and 3) than in those without flowers (Figure 6). However, Plot 5 had exceptionally high densities of DBM and was heavily infested with aphids. This plot appeared to be more susceptible to pest invasion than any of the others. This plot was bordered on the East one by tall eucalyptus trees. Perhaps the air circulation in the lee of these trees led to more aphids and DBM concentrating and settling on the broccoli plants. High levels of parasitism were observed by early March in five of the six plots. No parasitism was recorded in Plot 2 until mid-March, but levels climbed to 100% in this plot by the end of the experiment. Adult D. semiclausum, A. ippeus and other parasitic wasps were observed feeding on all species of flowers, but were most common on Queen Anne’s lace, which was the least abundant of the species planted. Like the two previous experiments, this one failed to demonstrate a benefit of planting flowers for suppression of larval DBM by parasitic wasps. Differential colonisation of the plots affected the results. On the one hand, high levels of colonisation by P. xylostella in Plot 5 led to high larval densities and unacceptable levels of damage there. On the other hand, late colonisation of Plot 2 by parasitoids prevented the detection of any benefit of flowers in that plot. Both of these exceptional plots had flowers, so it is not surprising that the results did not show a beneficial effect of providing floral nectar to parasitic wasps. This experiment did demonstrate that populations of larval DBM can decline in the absence of any intervention to suppress populations. High levels of parasitism, and possibly predation, were associated with the observed declines in densities of DBM.

57
0
10
20
16-Feb 9-Mar 30-Mar 20-Apr
4th instars/ plant
Plot 1Plot 4Plot 6
0
10
20
16-Feb 9-Mar 30-Mar 20-Apr
4th instars/ plant
Plot 2Plot 3Plot 5
Figure 6. Densities of fourth instar P. xylostella in plots of broccoli at Lenswood. A. Plots
without flowers. B. Plots with flowering alyssum, buckwheat and Queen Anne’s lace.
B. With flowers
A. Without flowers

58
0
50
100
16-Feb-02 9-Mar-02 30-Mar-02 20-Apr-02
% parasitised
Plot 1Plot 4Plot 6
0
50
100
16-Feb-02 9-Mar-02 30-Mar-02 20-Apr-02
% parasitised
Plot 2Plot 3Plot 5
Figure 7. Parasitism of fourth instar P. xylostella in plots of broccoli at Lenswood. A. Plots
without flowers. B. Plots with flowering alyssum, buckwheat and Queen Anne’s lace. Rare earth elements as indicators of flower feeding: Field experiments failed to demonstrate a beneficial effect of providing floral nectar to enhance biological control by parasitic wasps. The experimental approach was re-evaluated to see if another approach might yield clearer results. One possibility is to evaluate directly the benefits of flowers on parasitic wasps. Rare earth elements could be locally enriched in soil to label the nectar of plants growing in it. Then any wasps that feed on the labelled nectar will contain elevated levels of the rare earth. In collaboration with R. Van Steenwyk (University of California, Berkeley) and N. Schellhorn, a pilot experiment was conducted in a commercial crop of broccoli in 2003 at Virginia to test this method. Pak choi, alyssum and Queen Anne’s lace we transplanted into a 3 m x 3 m field cage. When flowering commenced, each plant was watered with 50 ml of 4000 ppm rubidium, in the form of rubidium chloride salt. The field cage was removed and one day later parasitic wasps were collected from the plants and surrounding broccoli crop. The levels of rubidium in each insect were measured using methods similar to Van Steenwyk et al. (1992). A wider evaluation of the effects of flowers on parasitic wasps was planned, but the broccoli crop had flowered by the time the experimental plants were in flower. Hence, floral nectar was readily available in the field. The results demonstrated that rubidium could be used to label floral nectar. This method could be used in future to show which wasps have fed on labelled flowers, what fraction of wasps in a field have fed on labelled floral nectar and patterns of movement of wasps that feed on flowers.
A. Without flowers
B. With flowers

59
Detecting sugar in the bodies of wasps: One possible way to evaluate the benefits of flowers for parasitic wasps could be to measure the amounts of sugar in their bodies. Van Handel (1985a,b) developed a method to simultaneously measure levels of sugar, glycogen and lipid in the bodies of insects. This method uses an anthrone reaction to produce a colour change in the extract of an insect’s body. The intensity of colour is measured with s spectrophotometer. The amount of sugar, glycogen and carbohydrate can then be estimated by comparing the level of absorbance to a standard curve. Diadegma semiclausum was reared in the laboratory on larval P. xylostella. Newly emerged adults were held in vials either with or without a drop of honey. After one day, wasps were frozen and held until the level of sugar in their bodies could be estimated. The results showed that wasps that had access to honey had significantly larger amounts of sugar in their bodies (Table 2). Females had higher levels of sugar in their bodies than males. Critical values based on the 99% confidence intervals for the amounts of sugar in the bodies of unfed wasps were calculated (Table 2). Diadegma semiclausum were collected from a commercial crop of broccoli at Virginia on 11th and 12th April 2002. Based on the calculated critical values, 74% of females (mean sugar level 35.5 µg, n=19) and 100% of males (mean sugar level 31.4 µg, n=23) had fed on a sugar source. Caution must be exercised when interpreting these figures, since results obtained with the Van Handel’s (1985a) method vary with each batch of chemicals and critical values were based only on one-day-old adults. Nevertheless, the results suggest that most wasps were obtaining sugar from flowering weeds, aphid honeydew or another source in this very weedy field. Table 2. Amounts of sugar in the bodies of 1-day-old Diadegma semiclausum as estimated by
Van Handel’s (1985a) method. The critical value for unfed males is 1.7 µg and the critical value for females is 17.0 µg; 99% of unfed individuals have sugar levels lower than these critical values.
Amount of sugar in body (µg) Sex Treatment n Mean Min Max Std.
Deviation Female Unfed 9 7.2 3.1 12.7 2.94
Fed honey 10 47.7 23.5 72.7 16.25
Male Unfed 20 -2.7 -6.0 0.9 1.57
Fed honey 20 19.4 3.8 54.2 15.53 Detection of the DNA of Plutella xylostella in the guts of predators: Observations made during the third field experiment at Lenswood suggested that predators may kill large numbers of larval DBM. Substantial numbers of larval DBM and cabbage white butterfly, Pieris rapae (Lepidoptera: Pieridae), seemed to disappear between samples during this experiment. Ma Jun (Hunan Agricultural University, China) developed primers from the ITS region of the 18S ribosomal RNA gene of DBM. These were shown to indicate the presence of DBM in the guts of wolf spiders (Aranaea: Lycosidae) and damsel bugs, Nabis kinbergii (Hemiptera: Nabidae), for up to one day or more. One primer pair in particular (DBMITSF3 and DBMITSR3) showed the greatest sensitivity (Figure 8).

60
Field samples of predators were collected from commercial broccoli and cauliflower crops at Virginia and the presence of DNA from DBM was detected using primers DBMITSF3 and DBMITSR3. These samples were collected from cauliflower and broccoli crops with over 10 larval DBM per plant. The detection rate of DBM-specific bands was 68.2% in N. kinbergii (15 out of 22 positive). This result may reflect the relative high density of DBM occurring in this field. In addition, two Lycosa sp. samples were tested using the same DBM-specific primers. The first sample was collected from the same field as N. kinbergii. The detection rate from this field was 87.5%. The second sample was collected from a broccoli field with less than 1 larval DBM per plant. Detection rate from this field was 33.3%, which was significantly lower than in the crops with high DBM densities. These results showed that the detection rate corresponded to the population levels of DBM in the field, suggestive that these DNA markers can be applied in the field to estimate the predation rate ofDBM. The use of DNA markers has shown promise for the evaluation of predation on larval DBM. This method will be used in future research to study predation in Brassica crops. 1 (F2)CCGTCGCTAC TACCGATTGA ATGATTTAGT GAGGTCTTCG GACCGACACG
51 CGATGGCTTC ACGGCCGTCG GCGTTGTTGG GAAGTTGACC AAACTTGATC
101 ATTTAGAGGA AGTAAAAGTC GTAACAAGGT TTCCGTAGGG GAAC(F3)CTGCGG
151 AAGGATCATT AACGTATATA TTGTCTCTCT CTAGTAGATG ACGACAACAT
201 ATTATACATT AATAAGACAT CCAAAAATTT CTTGCGCGCG CGCACTGAAT
251 GCCGCACTGT ACATGTACAT GTACATGTGC GTTGCGTTTT GTTGTGCGCG
301 TTCGAGAACG TCGCGCCGTA TCCACGTCAG CGTTGACAGG GTTGAAATCC
351 GCACCCTCGA GCTGTCCGAT TGGCGCGCGA CGTAAAATAA AAACCACAAA
401 (R3)ATGCGGTGGA TGAGTGACGC GCGCGCGAAC GCTATGTCGA CGACGCACAA
451 TGTACGTACA CGTATACAAC TCTGTTTGTA TCATCGTTTT GTGTGTTATC
501 GCTTGTGTGT GAGTGCGCGT GTCCGTATCA TTCGATATAT ATAAATTTAT
551 TTTTATATTT ACCTTTGTCA AAAAAATAAC GAATAATGCC AAAA(R1)CCATTA
601 CCCTGGACGG TGG Figure 8. DBM 18S ribosomal RNA gene (GenBankTM accession number AY371192), partial
18S sequence (bp1-153); internal transcribed spacer1 (ITS-1), complete sequence (bp154-580); and 5.8S ribosomal RNA gene, partial sequence (bp581-613). Sequences that were used as primers are underlined. One of the conservative primer sets is Lp18F2 (F2)/Lp58R1 (R1); and the DBM-specific primer set is DBMITSF3 (F3)/ DBMITSR3 (R3).
61
Major findings: • Parasitoids are more active and live longer when they have access to nectar sources. These
can be scarce in Brassica crops. • Experiments to demonstrate the benefits of planting flowers that provide nectar to natural
enemies have been equivocal. No statistically significant benefit of planting flowers has been demonstrated.
• Levels of sugar in the bodies of the parasitic wasp D. semiclausum were evaluated using Van Handel’s method. Further research is necessary to make this a practical method for evaluating the feeding behaviour of wild wasps.
• A pilot experiment was conducted to show that rare earth elements can be used to trace insects that feed on flowers. This will be employed in future to investigate how natural enemies use floral sources in the field.
• DNA markers are a useful tool for evaluating the activity of predators that feed on DBM in the field.
Recommendation: • Benefits from the presence of planting nectar sources still need to be demonstrated.
Although this can’t be recommended with confidence, some benefits may be gained from the planting species that provide nectar to natural enemies. Any benefits of planting flowers to provide nectar will be diminished in the presence of flowering weeds or flowering Brassica crops.
Acknowledgments: The collaboration of R. Van Steenwyk, Ma Jun, N. Schellhorn and G. Baker, and the ongoing technical assistance of C. Paull and L. Maratos, and the assistance of S. Scarratt, L. Thompson and G. Siekmann contributed to this research. The Newman family generously gave access to their Brassica crops at Virginia and Cudlee Creek. The assistance of these people was greatly appreciated. References: Johanowicz, D. and E. R. Mitchell. 2000. Effects of sweet alyssum flowers on the longevity of
the parasitoid wasps Cotesia marginiventris (Hymenoptera: Braconidae) and Diadegma insulare (Hymenoptera: Ichneumonidae). Florida Entomologist 83: 41-47.
Siekmann, G. 2002. Food foraging in adult parasitoid Cotesia rubecula: how sugar sources contribute to survival and reproduction. Ph.D. thesis, University of Adelaide, Australia.
Van Handel, E. 1985a. Rapid-determination of glycogen and sugars in mosquitos. Journal of the American Mosquito Control Association 1: 299-301
Van Handel, E. 1985b. Rapid-determination of total lipids in mosquitos. Journal of the American Mosquito Control Association 1: 302-304
Van Steenwyk, R. A., K. Y. Kaneshiro, N. V. Hue and T. S. Whittier. 1992. Rubidium as an internal physiological marker for Mediterranean fruit-fly (Diptera, Tephritidae). Journal of Economic Entomology 85 (6): 2357-2364.

62
THE IMPACT OF PARASITOID WASPS ON PLUTELLA XYLOSTELLA IN PERTH, WESTERN AUSTRALIA. Françoise Berlandier and David Cousins Department of Agriculture, Western Australia, Locked Bag No. 4, Bentley Delivery Centre, WA 6983, Australia. Rationale: This research is relevant to the outcome “Quantified contribution of natural enemies to pest control in a 'best bet' IPM program” and to Milestone 5.3 “Growers aware of practices that promote the performance of natural enemies and can choose to implement one or more of these practices” of the national HAL project. The natural enemies of Plutella xylostella include a range of parasitoid wasp species. Female wasps lay their eggs into P. xylostella; the life stages attacked depends on the wasp species. Although these beneficial insects are often mentioned in the context of IPM, few studies have quantified their impact on DBM populations. This report describes five trials conducted in the Perth Metropolitan area to measure the impact of natural enemies on P. xylostella populations. Diadegma semiclausum and Apanteles ippeus were the most common parasitoid wasps in a survey conducted in the Perth Metropolitan area in 1997-99. Materials and Methods: Plants and insects We used the same seedlings as those used at each farm where each of the five trials were located (Table 1). For each trial, four-week old commercially obtained seedlings in a 10 x 10 cavity seedling tray were exposed to egg-lay by laboratory-raised P. xylostella adults for a 48 hr period in a large laying cage in the laboratory. The exception was trial 1, which was conducted on a commercial organic farm; here seedlings were obtained from the farm’s nursery. Each plant was then carefully inspected and surplus P. xylostella eggs were removed to leave 9-28 (Trial 1), 20 (Trial 2), 30 (Trial 3), 20 (Trial 4) and 8 – 15 eggs (Trial 5) per seedling. Pots (10 per treatment) were planted amongst cabbage rows at the farmer's property, spaced 2.8m apart within a row in 3.1 m spaced rows. Each inoculated plant was then caged as described below to provide natural enemies with four different levels of access to the P. xylostella on the test plants. Seedlings were then transplanted into 12.5 cm diameter pots and the potted seedlings were planted within crop rows by sinking the pots so that the rims were level with the ground.

63
Table 1. Summary of trials. Trial 1 Trial 2 Trial 3 Trial 4 Trial 5
Crop type Cabbage (Savoy King)
Cabbage Cabbage Cabbage Broccoli
Date planted 15 Dec 00 April 01 Jan 01 4 Dec 01 6 June 02 Date
terminated 1 Jan 01 23 Dec 01 23 Dec 01 15 July 02
Grower Dunn White Berlengeri White Trandos Exclusion cages All cages consisted of a central cylindrical frame (45cm high x 45cm diameter) made from green plastic trellis (mesh size 45mm x 50 mm). Modifications to the fine nylon netting sleeve covering the central frame allowed construction of cages effecting the following treatments:
A) Fully enclosed: Total natural enemy exclusion. The nylon mesh sleeve totally covered the central trellis frame and the edge of the fabric was buried in the soil to seal the unit. B) Fully exposed: Total natural enemy access. The cage consisted of only the central trellis frame. C) Partially exposed: Partial natural enemy access with sticky barrier. Nylon mesh was used to partially cover the central trellis frame, and the rim of the pot was treated with a sticky barrier (Tac-gel). D) Partially exposed: Partial natural enemy access, no sticky barrier. As in C) above but pot rims without a sticky barrier.
The treatments were arranged in a randomised block design replicated 4 to 10 times and allowed the natural enemies either nil, partial or close to total access to the P. xylostella (either eggs or caterpillars) on the test seedlings. The treatment of the nylon netting partially covering the trellis C) and D) was designed to allow natural enemy access to the cage while creating ambient environmental conditions similar to that within the completely sealed cages. The sticky barrier prevented ground-dwelling natural enemies from accessing the plants. The crop surrounding the test plants was treated for pests at the farmer’s discretion. All cages were covered with plastic bags immediately before spray application to protect test plants and insects from insecticide sprays. Bags were removed by the next morning. Experiments were terminated when the majority of insects on test plants had reached the pupal stage, usually in three weeks time. Test plants were transferred to the laboratory and all P. xylostella larvae and pupae were reared separately on cabbage at 21°C for a further four weeks until either an adult insect (wasp or moth) had emerged or it was clear the insect was dead In addition, at the end of trials 2 and 5 the test plants were ranked as follows : 1 = no damage; then depending of per cent of leaf area skeletonised, 2 = 1 - 10%; 3 = 11 - 30%; 4 = 31 - 60%; 5 = 61 - 90%; or 6 = 91 - 100%. Results and Discussion: Trial 1 This trial was situated in a commercial organic cabbage crop located at Balcatta, ~10 km north of the Perth CBD. Crops were only sprayed with Bacillus thuringiensis (Bt), which is not harmful to wasps. In this first trial the wasp species were regrettably not identified. In the full cage treatment, only 11% of the original DBM were recovered (Table 2). None of these recovered grubs were

64
parasitised. We assume that numbers of grubs were reduced by natural elements, in particular the heat, as the daily maximum temperature exceeded 35°C on four days in late December 2000.
Table 2. Number of P. xylostella (DBM) established and recovered from the experimental plants and the number and species of parasitoid wasps recovered from and % parasitism of surviving P. xylostella (DBM) recovered at the end of Trial 1.
DBM Wasps Treatment Mean # eggs
established/plant Mean #
larvae+pupae recovered/plant
% of DBM recovered
# collect
ed
# collected as a % of the
recovered DBM grubs
A 19.6 2.2 11 0 0 B 9.8 1.2 13 3 60 C 12.6 0.8 6 1 25 D 15.5 1 6 2 50
Wasp parasitoids were found in all of the other three treatments that gave varying levels of natural enemy access. In treatment B, which gave natural enemies the greatest access to both plants and DBM, 13% of the DBM were recovered, and of these, 60% were parasitised.
In the half cage with Tac-Gel, 6% of the original grubs were recovered and of these, 25% were parasitised. In the half cage with no Tac-Gel, 6% of the original grubs were recovered and of these, 50% were parasitised.
These results show that natural enemies can kill up to 60% of DBM.
Trial 2 The trial was conducted in a commercial cabbage crop in Mandogalup, located some 50 km south of the Perth CBD, Western Australia. Table 3. Insecticidal sprays applied to cabbage plants in plots of Trial 2.
Date Chemical Rate 30 Mar 01 Delfin* + Dominex† Label 6 Apr 01 Proclaim* Label 12 Apr 01 Regent† + Electra† Label 19 Apr 01 Delfin + Dominex Label
†Considered disruptive to natural enemies * Considered low impact on natural enemies
Comment: Considered destructive to natural enemies
Comment: Low impact on natural enemies
Comment: Considered disruptive to natural enemies

65
The survival rate of P. xylostella was highest in the treatment where natural enemies were excluded (A), with 44% of individuals growing into large caterpillars or pupae three weeks after egg lay (Table 4). Of these, only 1% were parasitised. Lower levels of survival (17-19%) were noted amongst P. xylostella from treatments where ground-dwelling and aerial natural enemies had access: frame only (B) or partial access without sticky barrier (D) treatments. More P. xylostella (31%) survived in the sticky barrier of treatment (C) which prevented the ground-dwelling invertebrate fauna from accessing the eggs or grubs. Of these, 40.9% and 13.1% respectively were parasitised by Diadegma rapi and Diadegma semiclausum. Table 4. Number and % P. xylostella recovered 3 weeks after Trial 2 commenced and damage to plants caused by P. xylostella.
Treatment No. surviving
% survival of initial egg infestation
Damage rank
A: Full cage 83 42 4.8 B: Frame only 34 17 3.3
C: Partial cage + sticky barrier 61 31 4.0 D: Partial cage only 37 19 3.4
Diadegma semiclausum and D. rapi were the dominant parasitoid species found and both occurred in similar portions (Table 5). A few Apanteles ippeus and Diadromus collaris were also recovered. Table 5. Number and species of parasitoid wasps recovered and % parasitism of surviving P. xylostella by the end of Trial 2.
A: Full cage
B: Frame C: Partial cage + Tac-
gel
D: Partial cage
Total
Total # of DBM recovered 83 35 61 37 216 # DBM moths reared from recovered insects
82 0 22 8 111
# parasitoids reared from recovered DBM: Diadegma rapi
1
13
25
10
49 Diadegma semiclausum 0 20 8 13 41 Apanteles ippeus 0 0 1 0 1 Diadromus collaris 0 0 1 1 2 Unidentified 0 2 4 5 11 Total # of parasitoids 1 35 39 29 104 Parasitoids as a % of recovered DBM
1.2 100 64 78
High rates of parasitism by wasps, particularly by D. semiclausum and D. rapi, occurred despite regular applications of insecticide sprays to the crop. Although the full cage treatment (A) protected P. xylostella from parasitoids, mortality due to other factors was quite high at 58%. Only 17% of the P. xylostella in the frame treatment (B) had survived for three weeks, and of these, approximately half (47%) turned into moths.
Plants which had the most exposure (rank of 3.3) to wasps suffered significantly less damage (p = 0.005, ANOVA) compared to the fully enclosed plants (rank of 4.8). Nonetheless, the damage was greater than that accepted by the market. It is encouraging that wasps had a positive, quantifiable impact on the P. xylostella, thereby reducing the level of damage to plants.

66
Trial 3 The trial was situated in a commercial cabbage crop located in Wanneroo, ~30 km north of the Perth CBD, Western Australia.
All plants in the fully caged treatment were completely defoliated by the end of the experiment, indicating that the load of 30 P. xylostella per plant was too high. Diadegma rapi was the most abundant parasitoid, followed by Oomyzus sokolowskii, with low numbers of Apanteles ippeus and Diadromus collaris. Oomyzus sokolowskii lays multiple eggs into the host; between 8-10 individuals were recovered per individual P. xylostella in this study. Table 6. The percentage of P. xylostella recovered 16 days after Trial 3 commenced and damage to cabbage leaves caused by P. xylostella in 4 different exclusion treatments. Each plant carried 30 P. xylostella eggs at the start of Trial 3. n = 10.
Treatment No. surviving P. xylostella (of 200/trt)
% survival (of initial egg infestation)
A: Full cage 43 14 B: Frame only 73 24 C: Partial cage + sticky barrier 70 23 D: Partial cage only 47 16 Table 7. Number and species of parasitoid wasps recovered from and % parasitism of surviving P. xylostella recovered at the end of Trial 3. A: Full
cage B: Frame C: Partial
cage + Tac-gel
D: Partial cage
Total
Total # of DBM recovered 43 73 70 47 233 # DBM moths reared from recovered insects
22 43 46 27 138
# parasitoids reared from recovered DBM: Diadegma rapi
9
0
11
4
24 Apanteles ippeus 0 0 0 2 2 Diadromus collaris 0 1 0 1 2 Oomyzus sokolowskii* 1 9 0 0 10 Wasp spp not identified 1 0 4 0 5 Total # of parasitoids 11 10 15 7 43 Parasitoids as a % of recovered DBM
25 14 21 15
*Multiple wasps emerged from a single P. xylostella; a wasp count of one was assigned when a single P. xylostella was collectively parasitised by multiple wasps.

67
Low numbers of grubs were recovered from the full cage, indicating that there were too many grubs and too little food to sustain the numbers of insects on the plants, and that some of the missing grubs had starved. Furthermore, of the grubs recovered from this treatment, 25% were parasitised. This was unexpected, as the treatment was designed to exclude natural enemies. It could be that wasps entered the cages of this treatment during the times the plants were checked by opening the mesh covering. There were also high levels of parasitism of grubs in the open treatments of C & D. Trial 4 The trial site was situated in a commercial cabbage crop on a property located some 50kms south of the Perth CBD in Mandogalup. A similar trial design was used as for Trial 3, except the # of eggs per plant was reduced from 30 to 20.
Table 8. Insecticidal sprays applied to cabbage plants surround the trial plots during Trial 4.
Date Chemical Rate 5 Dec01 Delfin (label rate)* + Dominex (400 ml)† label
10 Dec01 Delfin (label rate) + Dominex (400 ml) label 14 Dec01 Regent† label 20 Dec01 Dominex + Xentari* label
†Considered disruptive to natural enemies * Considered low impact on natural enemies
The survival rate of P. xylostella was highest in the treatment where natural enemies were totally excluded (A), with 24% of individuals growing into large caterpillars or pupae three weeks after egg lay (Table 7). Of the survivors, only 4% were parasitised. There was nothing evident to explain the fate of the 76% of the P. xylostella that were missing. Lower rates of survival were noted amongst P. xylostella that were exposed to ground-dwelling and aerial natural enemies: frame only (B) (7% survival) or partial access, no sticky barrier (D) (14% survival). The sticky barrier of treatment (C), which prevented any ground-dwelling predators from accessing the eggs or grubs, increased survival of P. xylostella, with 20% of the P. xylostella surviving the three weeks of the experiment. Of these, 10% and 13% respectively were parasitised by Diadegma rapi and Diadegma semiclausum. Table 9. The percentage of P. xylostella recovered 3 weeks after the trial commenced and damage to cabbage leaves caused by P. xylostella in 4 different exclusion treatments. Each plant carried 20 eggs at the start of Trial 4. n = 10.
Treatment % survival (of initial egg infestation)
A: Full cage 24 B: Frame only 7
C: Partial cage + sticky barrier 20 D: Partial cage only 14
As in an earlier experiment done in April 2001 at this site, Diadegma semiclausum, followed by D. rapi, were again the dominant species (Table 10). Other species recovered were Apanteles ippeus, Diadromus collaris and Oomyzus sokolowskii, as recently confirmed introduction to Perth.
Comment: Considered destructive to natural enemies
Comment: Low impact on natural enemies
Comment: Considered disruptive to natural enemies

68
Table 10. Number and species of parasitoid wasps recovered from and % parasitism of surviving P. xylostella recovered at the end of Trial 4 (23 December 2001). A:
Frame B: Full cage
C: Partial cage
D: Partial cage + Tac-gel
Total
Total recovered 14 48 27 40 129 Moths 7 46 16 25 94 Diadegma rapi 0 0 4 4 8 Diadegma semiclausum 3 2 7 5 17 Apanteles ippeus 3 0 0 3 6 Diadromus collaris 0 0 1 0 1 Oomyzus sokolowskii* 1 0 0 3 4 Total parasitoids 7 2 12 15 36 Parasitoids as a % of recovered DBM
50 4 44 37.5
*Multiple wasps emerged from one P. xylostella; wasp count of one was assigned when a single P. xylostella was collectively parasitised by multiple wasps. High rates of parasitism by wasps, particularly by D. semiclausum and D. rapi, were recorded despite two applications of the insecticides alpha-cypermethrin (Dominex) and one application of fipronil (Regent) to the crop. Although the barrier cage (full cage treatment “A”) protected P. xylostella from parasitoids, mortality due to other factors (not determined in this study) was quite high at 76%. Only 7% of the P. xylostella in the frame treatment (B) had survived by the end of three weeks, and of these, half (50%) were parasitised.
Trial 5 The trial was situated in a commercial broccoli crop located in Wanneroo, ~30 km north of the Perth CBD, Western Australia. More insects were recovered from fully enclosed cages (50%) than exposed cages (1.5%). Only one (2%) of the recovered insects was parasitised by Diadegma semiclausum. This low rate indicates that parasitic wasps are far less active in the area, and perhaps this was also because of the cooler winter temperatures. Very few insects were recovered from plants enclosed by the frame only treatment where both ground-dwelling and aerial natural enemies had greatest access to test plants. The plants in the cages where the parasitic wasps could freely access the P. xylostella (treatment B) suffered significantly less damage compared to plants in the fully enclosed cages (Table 11). Table 11. Numbers of P. xylostella recovered 3 weeks after Trial 5 commenced, % survival of original infestation and P. xylostella damage to leaves of broccoli from different exclusion treatments using field cages in trial 4. n = 10.
Treatment No. eggs/surviving (% surviving)
Damage rank
A: Full cage covered 117/59 (50%) 4.0 B: Frame only 102/6 (1.5%) 1.5

69
Table 12. Species and numbers of parasitoid wasps found over all trials (wasps were not identified in Trial 1). Parasitoid species Trial 2 Trial 3 Trial 4 Trial 5 Total Diadegma rapi 49 24 8 0 81 Diadegma semiclausum 41 0 17 1 59 Apanteles ippeus 1 2 6 0 9 Diadromus collaris 2 2 1 0 5 Oomyzus sokolowskii* 0 9 4 0 13 Unidentified 11 0 0 0 11 Total 104 37 36 1 178 *Multiple wasps emerged from a single P. xylostella; wasp count of one was assigned when a single P. xylostella was collectively parasitised by multiple wasps. Summary: The highest level of parasitism was 100% at White’s (Trial 2) followed by 60% at Dunn’s (Trial 1). In WA numbers and activity of P. xylostella are greatest over the warmer months of the year, being September to April. The trial where the most P. xylostella were parasitised was conducted in April, indicating that wasp numbers had increased over the preceding months and were sufficiently abundant to have a major impact on P. xylostella. In the middle of the season (December and January), wasp activity was lower, and percent parasitism was up to 25% and 50% respectively for trials 3 and 4 done during this time. In contrast, there were hardly any parasitoids in trial 5 done in the colder months of winter. It is likely that numbers of wasps are low at the beginning of the P. xylostella season in WA. Growers that need to spray P. xylostella at this time but concurrently hope to preserve or encourage parasitoids would need to use “soft” chemicals that do not harm these beneficial insects, to enable them to become established locally. Oomyzus sokolowskii was recorded for the first time in WA by this study. The most abundant wasp species was Diadegma rapi, followed by Diadegma semiclausum (Table 12). In most other regions of Australia D. rapi is a very minor parasitoid of DBM (G. Baker and M. Keller, pers. comm.); the reason why this species is so prevalent in the Perth region relative to other Brassica vegetable production regions of Australia is unclear. Acknowledgment: The co-operation of growers A & R Dunn, J. White, Berlengeri family and Trandos Farms and their helpful staff is a gratefully acknowledged.

70
DISSEMINATION OF THE BIOLOGICAL CONTROL AGENT, TRICHOGRAMMA, ON BRASSICA VEGETABLE SEEDLINGS Peter Ridland and Swarna Hewa-Kapuge Department of Primary Industries, Knoxfield, Private Bag 15, Ferntree Gully Delivery Centre VIC 3156, Australia. Concept: Infest seedling trays just prior to transplant with Trichogramma pupae to ensure widespread distribution of wasps at time of transplanting. Trichogrammatid wasps are egg parasitoids, and have been used successfully for the biological control of lepidopteran pests, such as heliothis. In Western Australia and Victoria, diamondback moth (Plutella xylostella) eggs parasitized by either Trichogrammatoidea bactrae (mainly) or Trichogramma funiculatum, were found in a number of locations in spring 1999 on brassicaceous weeds. In Australia, Richard Llewellyn (BioResources) pioneered the distribution of loose Sitotroga eggs parasitised by Trichogramma in a range of horticultural crops (but not Brassica). The system he used of mixing loose eggs in water with a polyacrylate thickener and then spraying onto foliage proved unsuccessful on Brassica. This study was initiated to assess the feasibility of inoculating Brassica seedlings with commercially–reared Trichogramma pretiosum as a means of disseminating these parasitoids into vegetable fields. However we could not get the delivery system to work on Brassica seedlings - the liquid just kept running off the leaves. We added a range of commercial stickers to the solution, but all trials were unsuccessful. The only way we could get the eggs to stick was to use a very dilute solution of a water-soluble glue (Aquadhere®) (used in some rearing systems for Sitotroga egg cards). We felt that this system was inappropriate for commercial use. Without a reliable method of attaching the wasp pupae to the seedlings, further trial work was abandoned. Instead, a field release of T. pretiosum was made in a commercial broccoli crop and sentinel egg cards used to measure the rate of spread of the wasps. The purpose of this study of T. pretiosum dispersal in a field situation was to determine "seeding" rates for Trichogramma pupae in seedling trays for future use in dissemination of the biological control agent. Materials and methods (for the study of T. pretiosum dispersal in a commercial broccoli crop): Crop The crop chosen for the release was a six-week-old broccoli crop at Somerville, Vic that had continuous foliage along the beds due to its advanced age. The average distance between the leaves across the beds was around 10 cm. Background parasitism was tested on 6 February 2002 in the area using 88 diamondback moth egg cards and found to be zero and therefore considered suitable for the release. Preparation of egg cards The diamondback moth colony was initiated from infested seedlings bought from a commercial nursery in Berwick, Victoria. The colony was reared on 4-5 week old Savoy cabbage plants grown in trays placed in large cages. Moths were collected as they emerged, placed in oviposition cages and fed with diluted honey solution. Egg cards were prepared by allowing female moths to lay eggs on the inside of corrugated coffee cups (Café Bar®) that had been

71
treated with cabbage juice (method adapted from Sieglaff et al. 1998) and frozen at -20°C until use. Female moths (12-15) were placed inside cups with honey solution soaked in cotton wool, secured with lids with holes made in them and left at 25°C. Females, 2-3 days post-emergence were used for egglaying in cups. Eggs were laid mostly in the corrugations of the cups. Cups were changed every day for four days. The number of eggs laid on the first day was always less than on other days. After four days, moths were discarded. Egg cards were prepared by cutting the cups into strips so that each card contained 20-40 eggs. Release Around 5,500 female wasps were released on 4 March 2002 at point R (Figure 1) and their movement was studied by monitoring their presence on egg cards along four transects (A, B, C and D). Transects A and C ran along beds and were 40 metres in length. Transects B and D ran across the beds and were 37 metres in length.
Fig. 1. Diagram of transects at release site for Trichogramma pretiosum in a commercial broccoli crop at Somerville, Victoria.
The number of wasps released was estimated using their sex ratio and rate of emergence. Wasps used in the experiment were reared on the factitious host Sitotroga cerealella eggs bought from Bugs for Bugs Pty Ltd. (Munduberra, Qld) and were maintained at 25°C. Movement was assessed by monitoring the wasps' presence over the subsequent week by allowing them to parasitise diamondback moth eggs using a total of 872 sentinel egg cards. The sentinel cards were put out at 0, +2 and +4 days after the release of wasps by stapling them to broccoli leaves at known distances radiating from the release point along and across the beds in four transects. The cards were subsequently retrieved three times during the seven-day period in which the experiment was carried out, to prevent eggs from hatching in the crop and also to ensure that wasps would have fresh eggs for oviposition. On the day of the release (04/03/02), a total of 132 egg cards was stapled in the four transects; three each were stapled one metre apart in transects A and C along 15 metres and also on each bed across eight beds (width of each bed is 1.8 m) in transects B and D. These cards were collected on 05/03/02 (one day after release). Another 390 cards were stapled on 06/03/02; three and five cards were stapled alternatively starting from one metre away from the release point

72
along 30 metres in transects A and C. Five cards were stapled in each bed up to bed 15, in transects B and D. They were collected on 08/03/02 (four days after release). A total of 350 egg cards was also stapled on 08/03/02; five cards were stapled two metres apart along 40 metres in transects A and C, and five cards in each bed on 15 beds. These final cards were collected on 11/03/02 (seven days after release). On the day of release, more egg cards were stapled in the four transects (30 metres away from the release point: 15 cards at each point) to see if there was any background parasitism. Results and discussion: Background parasitism on the day of release was found to be 0%, confirming the absence of wasps in the crop. One day after being released, wasps had dispersed at least six metres along a bed (Table 1). The egg cards used on the first day were found to have contained ~50% cards on which the majority of the eggs were sterile and would have contributed to lower parasitism. This was not evident on the other two occasions. Although no cards were parasitised in transects B and D one day after release, it may be possible that if eggs on cards had been mostly fertile and/or more cards had been stapled, parasitised cards would have been found. By the fourth day after the release, wasps had moved at least 19 metres along the bed and to a lesser distance of 11 metres across beds (Table 2). A lower dispersal distance would be expected across beds, as wasps would have to fly from one bed to the other in transects B and D rather than walking on contiguous foliage. By the seventh day, wasps had moved at least 26 metres along a bed and 14 metres across the beds (Table 3). The results indicate the minimum distance that the wasps were able to disperse rather than their potential. The percentage of egg cards that were parasitised was 2.3%, 3.8% and 2.8% for first, fourth and seventh day after the release. By the seventh day, the wasp numbers were probably diminishing due to lack of nectar sources in the crop to help sustain them.
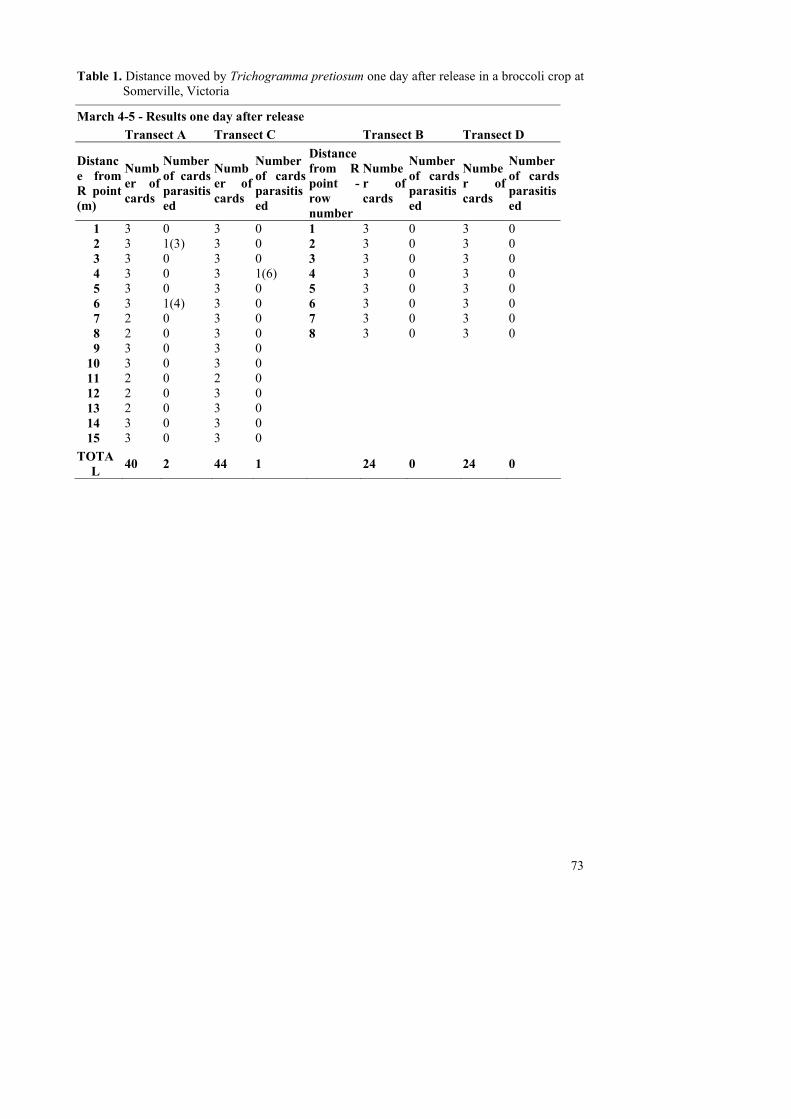
73
Table 1. Distance moved by Trichogramma pretiosum one day after release in a broccoli crop at Somerville, Victoria
March 4-5 - Results one day after release Transect A Transect C Transect B Transect D
Distance from R point (m)
Number of cards
Number of cards parasitised
Number of cards
Number of cards parasitised
Distance from R point -row number
Number of cards
Number of cards parasitised
Number of cards
Number of cards parasitised
1 3 0 3 0 1 3 0 3 0 2 3 1(3) 3 0 2 3 0 3 0 3 3 0 3 0 3 3 0 3 0 4 3 0 3 1(6) 4 3 0 3 0 5 3 0 3 0 5 3 0 3 0 6 3 1(4) 3 0 6 3 0 3 0 7 2 0 3 0 7 3 0 3 0 8 2 0 3 0 8 3 0 3 0 9 3 0 3 0
10 3 0 3 0 11 2 0 2 0 12 2 0 3 0 13 2 0 3 0 14 3 0 3 0 15 3 0 3 0
TOTAL 40 2 44 1 24 0 24 0

74
Table 2. Distance moved by Trichogramma pretiosum four days after release in a broccoli crop at Somerville, Victoria
March 6-8 - Results four days after release
Transect A Transect C Transect B Transect D
Distance from R point (m)
Number of cards
Number of cards parasitised
Number of cards
Number of cards parasitised
Distance from R point -row number
Number of cards
Number of cards parasitised
Number of cards
Number of cards parasitised
1 3 1(6), 1(8) 3 1(5) 1 5 0 5 0 2 5 1(3) 5 0 2 5 1(7) 5 0 3 3 0 3 0 3 5 0 5 1(6) 4 5 0 5 1(7) 4 5 0 5 0 5 3 1(4) 3 0 5 5 1(3) 5 0 6 5 0 5 0 6 5 0 5 1(18) 7 3 0 3 0 7 5 0 5 0 8 5 0 5 1(7) 8 5 0 5 0 9 3 0 3 0 9 5 0 5 0
10 5 0 5 0 10 5 0 5 0 11 3 1(11) 3 0 11 5 0 5 0 12 5 0 5 0 12 5 0 5 0 13 3 0 3 0 13 5 0 5 0 14 5 1(9) 5 0 14 5 0 5 0 15 3 0 3 1(19) 15 5 0 5 0 16 5 0 5 0 17 3 0 3 1(2) 18 5 0 5 0 19 3 1(7) 3 0 20 5 0 5 0 21 3 0 3 0 22 5 0 5 0 23 3 0 3 0 24 5 0 5 0 25 3 0 3 0 26 5 0 5 0 27 3 0 3 0 28 5 0 5 0 29 3 0 3 0 30 5 0 5 0
TOTAL 120 7 120 5 75 2 75 2

75
Table 3. Distance moved by Trichogramma pretiosum seven days after release in a broccoli crop
at Somerville, Victoria
March 8-11 - Results seven days after release Transect A Transect C Transect B Transect D
Distance from R point (m)
Number of cards
Number of cards parasitised
Number of cards
Number of cards parasitised
Distance from R point -row number
Number of cards
Number of cards parasitised
Number of cards
Number of cards parasitised
2 5 1(8) 5 0 1 5 0 5 1(1) 4 5 1(12) 5 0 2 5 1(5) 5 0 6 5 0 5 1(6) 3 5 0 5 0 8 5 0 5 0 4 5 0 5 0
10 5 0 5 0 5 5 0 5 0 12 5 0 5 0 6 5 0 5 0 14 5 0 5 1(3) 7 5 0 5 0 16 5 1(6) 5 0 8 5 1(18) 5 0 18 5 0 5 0 9 5 0 5 0 20 5 0 5 0 10 5 0 5 0 22 5 0 5 0 11 5 0 5 0 24 5 1(4) 5 0 12 5 0 5 0 26 5 0 5 1(9) 13 5 0 5 0 28 5 0 5 0 14 5 0 5 0 30 5 0 5 0 15 5 0 5 0 32 5 0 5 0 34 5 0 5 0 36 5 0 5 0 38 5 0 5 0 40 5 0 5 0
TOTAL 100 4 100 3 75 2 75 1
The total number of egg cards parasitised was very low; only 28 cards out of a total of 874 cards were parasitised (3%). The fact that the crop was at an advanced stage in age may have caused a reduction in the likelihood of wasps reaching egg cards and parasitising them. If a larger number of wasps had been used in the release, it would have increased the chances of egg cards being found and parasitized by the wasps. Alternatively, releasing wasps in a younger crop with less foliage or using more egg cards (may not be practical) per point would have been more productive in increasing the wasp’s ability to find eggs by reducing the search area. If an efficient method of sticking Trichogramma pupae to seedlings can be devised, the dispersal distances and parasitism rates of egg cards described this study can be used to calculate the density of pupae required per tray of seedlings and the proportion of trays that should be treated to ensure uniform dispersal of Trichogramma throughout a Brassica vegetable crop. Literature Cited: Sieglaff DH, Mitchell ER & Hu GY. 1998. Evaluation of rearing methods for Diadegma insulare
(Hymenoptera: Ichneumonidae), an endoparasitoid of the diamondback moth (Lepidoptera: Plutellidae). Florida Entomologist 81, 578-582.

76
ADULTICIDAL ACTIVITY OF INSECTICIDES Nancy A. Schellhorn1, Cate Paull1 and Lou Maratos2 1South Australian Research and Development Institute, GPO Box 397, Adelaide, SA 5001, Australia. 2Department of Plant Sciences, The University of Adelaide, PMB 1, Glen Osmond, SA 5064, Australia. Background: Many growers currently spray for moths either in the spring when pressure is particularly heavy or as part of their regular spray program. A project was proposed to identify insecticides that are good at killing adults, while soft on beneficials. Objectives: Here we report on a literature search and experiment to: 1) identify insecticides that have adulticidal activity against DBM, yet are soft on beneficials, 2) highlight the importance of the behavioural response of an insect to an insecticide, and 3) determine if the timing of a spray results in greater numbers of moths being “hit”. Results: Literature Summary-adulticidal activity Studies by Hill and Foster (2000), Haseeb et al. (2000), Idrus and Grafius (1993) and Xu et al. (2001) evaluated the effects of several types of insecticides on DBM larvae, adults, pupae and Diadegma spp. Using leaf-dip bioassays Hill and Foster (2000) found that permethrin killed 100% of moths in 4 hrs. Carbaryl, and spinosad (Success®) caused 80% mortality in 48 hours. In addition to moth mortality, they found that carbaryl, imidacloprid (Confidor® – aphids), permethrin and spinosad caused 98% mortality in 24 hours to the parasitoid, Diadegma insulare. This is most likely explained by the dual mode of action of spinosyns, contact and ingestion (Crouse 2001). Using glass-bioassays, Haseeb et al. (2000) found that cartap, chlorfenapyr (Secure®), emamectin benzoate (Proclaim®), and permethrin caused 100% mortality to adult D. semiclausum in 72 hours. Chlorfluazuron, teflubenzuron and flufenoxuron caused very little mortality to pupae and adult D. semiclausum, 0-11%. Idrus and Grafius (1993) used a hand-held CO2 sprayer over pupal cocoons of DBM and D. insulare, and found that permethrin only caused 5% mortality to DBM, but 65% mortality to D. insulare. Azinphosmethyl (Gusathion®) and methomyl (Lannate ®) caused 10% mortality to DBM, and 25% and 45%, respectively to D. insulare. What is clear from the literature is that the insecticides that cause the greatest moth mortality, permethrin, carbaryl, and spinosad, are the most toxic to the main parasitoid. Chlorfenapyr (Secure®) and emamectin benzoate (Proclaim®) also cause the greatest mortality to Diadegma adults, the mortality to adult DBM was not tested. For cotton boll worn, Helicoverpa armigera, Forrester et al. (1993) showed that adults were capable of expressing pyrethroid resistance in the laboratory and that the result could be manifested as selection of resistant moths in the field. In addition, resistance could be exacerbated when pyrethroids were used to kill moths before they mated.

77
Literature summary-behavioural response The examples above provide a good indication of toxicity of different chemicals for different insects. However, the behavioral response of an insect to an insecticide may not result in the same mortality in the field. This can happen for a variety of reasons, including aspects about the behaviour of the insect to the chemical (eg. whether they are repelled), the stage of the insect (eg. highly mobile insects are more difficult to target), uneven coverage on a plant (eg. insect only acquires a low-dose). There are several examples in the literature for a variety of insect species that show synthetic pyrethroids (eg. Ambush®, Decis®, Fastac®) and carbamates (carbaryl) act as a repellent and insects move away from the spray and escape being killed. These examples include German cockroaches (Rust and Reirson 1978), two-spotted mites (Penman and Chapman 1983), boll weevil ((Moore 1980), black flies (Shemanchuk 1981), mosquitoes (Taylor et al 1981) Helicoverpa spp adults (Gould 1984; Moore 1980), and diamondback moth (Kumar and Chapman 1984). Given this repellence, it is easy to imagine that the moth would then recolonise the field that is virtually absent of beneficial insects. Furthermore, adult moths are highly mobile, they do not alight on plants for long periods of time, and only a small proportion of their body comes into contact with the residue of the active ingredient (Cottrell 1987). Also, for products like Avatar® (indoxacarb), which are taken into the plant by translaminar movement, the chance of the active ingredient coming into contact with the adult moth is extremely rare. Conducting an experiment to accurately determine moth mortality in the field is extremely difficult and expensive. Therefore, we have conducted preliminary experiments to determine the amount of chemical that comes into contact with a moth in the field, and whether this is affected by the time of day that spraying occurs. Experiment Using non-toxic resin-based fluorescent dyes we sprayed field populations of moths and assessed the proportion marked. For the first experiment, we sprayed on two occasions only in the morning (9:30am), and for the second experiment we sprayed in the morning (9:30am) and evening (1 hour after dusk, ca. 6:45pm). Pink and green resin-based fluorescent dye were sprayed in the morning, and evening, respectively. Immediately after spraying 20 yellow-sticky-bucket traps were placed 10 m apart for the length of the field, and 15 pheromone traps were placed 20 m apart. All traps were left in the field for 24 hours. They were removed and assessed under a UV light for the number of DBM and D. semiclausum captured and the number marked with the dye.

78
Table 1. Proportion of moths and wasps that were hit by the fluorescent spray. Number in parenthesis represents the number captured. Proportion marked Diamondback Moth
12 Dec 2001 17 Dec2001 11 April 2002
Morning 0.40 (106) 0.24 (63) 0.41 (157) Evening - - 0.20 (41)
D. semiclausum Morning 0.68 (321) 0.50 (207) 0.26 (1090) Evening - - 0.20 (299)
The results from our experiments showed that the highest percentage of moths that were either hit by or came into contact with the dye was 40%. For parasitoids, it was 68%, which occurred in the morning. The results for the evening spray showed that the spray hit only 20% of moths and parasitoids. However, these results should be interpreted lightly because the moth pressure was light in the “evening-field” that we sprayed, and it rained for part of the time. However, the fluorescent dye is rain-fast, but moths and parasitoids may be moving less during inclement weather. Discussion: The behavioural response of insects in the field to insecticides is quite complex. Although broad-spectrum insecticides cause moth mortality when confined to a container, it is highly unlikely that a similar result will happen in the field. Instead, spraying to kill moths may exacerbate resistance because there are many circumstances where a low-dose of insecticide will be delivered to the moth; an extremely favourable condition for the development of resistance. A similar result has been found for Helicoverpa punctigera and H. armigera in cotton. In addition, killing off the beneficial insects locks a grower into a heavy spray program, and one that uses insecticides with a known level of resistance. Instead of spraying to kill moths we have encouraged growers to target sprays to kill grubs. We have delivered the results of this study to target grubs not adults by conducting workshops, writing articles for various publications such as the National DBM newsletter and the Grower. Literature Cited: Cottrell, H.J. 1987. Society of Chemical Industry (Great Britain). Pesticides on plant
surfaces. Published on behalf of the Society of Chemical Insuctry by Wiley, Chichester, New York.
Crouse, G.D., Sparks, T.C., Shoonover, J., Gifford, J., Dripps, J. and T. Burce. 2001.
Recent advances in the chemistry of spinosyns. Pest Management Science, 57:177-185. Forrester, N.W., Cahill, M., Bird, L.J. and J.K Layland. 1993. Management of
pyrethroid and endosulfan resistance in Helicoverpa armigera (Lepidoptera: Noctuidae) in Australia. Bulletin of Entomological Research Supplement Series 1. pp 132.
Gould, F. 1984. Role of behaviour in the evolution of insect adaptation to insecticides
and resistant host plants. Bulletin of the Entomological Society of America 30:34-41.

79
Haseeb, M., H. Amano, and H. Nemoto. 2000. Pesticidal effects on mortality and parasitism rates of Diadegma semiclausum, a parasitoid of the diamondback moth. BioControl 45:165-178.
Hill, T.A. and R.E. Foster 2000. Effect of insecticides on the diamondback moth
(Lepidoptera: Plutellidae) and its parasitoid Diadegma insulare (Hymenoptera: Ichneumonidae). Journal of Economic Entomology 93:763-768.
Idrus, A.B. and E. Grafius. 1993. Pesticides affect immature stages of Diadegma
insulare (Hymenoptera: Ichneumonidae) and its host, the diamondback moth (Lepidoptera: Plutellidae). Journal Economic Entomology 86:1203-1212.
Kumar, K. and Chapman, R.B. 1984. Sublethal effects of insecticides on the
diamondback moth Plutella xylostella (L.). Pesticide Science 15:344-352. Moore, R.F. 1980. Behavioural and biologic effects of NRDC-161 as factors in
control of the boll weevil. Journal of Economic Entomology 73:265-267. Penman D.R. and R.B. Chapman. 1983. Fenvalerate-induced distributional
imbalances of two-spotted spider mite on bean plants. Entomologia Experimentalis et Applicata 33:71-78.
Rust, M.K. and D.A. Reirson. 1978. Comparison of the laboratory and field efficacy
of insecticides used for German cockroach control. Journal of Economic Entomology 71:704-708.
Shemanchuk, J.A. 1981. Repellent action of permethrin, cypermethrin and resmethrin
against black flies (Simulium spp.) attacking cattle. Pesticide Science 12:412-416. Taylor, R.N., Hill, M.N., Stewart, D.C., Slatter, R. and Gichanga, M. 1981. A field evaluation of permethrin and NRDC 161 for residual control of mosquitoes.
Mosquito News 41:423-434. Xu, Jianxiagn, Shelton, A.M. and X. Cheng. 2001. Comparison of Diadegma
insulare (Hymenoptera: Ichneumonidae) and Microplitis plutellae (Hymenoptera: Braconidae) as biological control agents of Plutella xylostella (Lepidoptera: Plutellidae): Field parasitism, insecticide susceptibility and host-searching. Journal of Economic Entomology 94:14-20.

80
THE INFLUENCE OF TEMPERATURE ON THE PERFORMANCE OF FIVE NEW INSECTICIDES FOR DIAMONDBACK MOTH CONTROL Greg Baker and Kevin Powis South Australian Research and Development Institute, GPO Box 397, Adelaide, SA 5001, Australia. Background: Five new insecticides have been registered since 1998 for diamondback moth (Plutella xylostella) control in Australian Brassica vegetable crops. These are chlorfenapyr (Secure), emamectin benzoate (Proclaim), fipronil (Regent), indoxacarb (Avatar) and spinosad (Success). There have been reports that at least one of these does not perform well at low field temperatures of around 15OC, and that this concern can influence some growers’ choice of insecticide during the cool season. Temperature is known to influence the toxicity of older chemistry, such as DDT and some cyclodienes, synthetic pyrethroids, and organophosphates (Scott 1995; Edelson et al. 1997; Jaglan and Sircar 1996; Arthur 1999). This study was undertaken to determine whether temperature influenced the performance of any of the five new insecticides when tested against 3rd instar larval diamondback moth larvae in the laboratory. Methods: A uniformly-sized cohort of third instar larvae were selected from a laboratory culture which was maintained on Brassica oleracea var. capitata cv. Green Coronet at 25°C (16h:8hr, L:D). Ninety six leaf discs of ~88 mm diameter were cut from eight week old B. oleracea potted plants. Each disc was washed, dried and embedded with the bottom surface upward in a 2-3 mm thick layer of setting agar in a 90 mm diameter Petri dish. Once the agar had set, 10 larvae were transferred onto each cabbage leaf disc, and each Petri dish then placed under the calibrated Potter tower and a 4ml aliquot of test solution applied. The test solutions were five insecticides (Secure, Proclaim, Regent, Avatar and Success), each applied at their registered rate, and a water control. The dishes were then removed and covered with plastic film secured with a rubber band. Each plastic film cover was perforated with ~ 300 holes made using a micro needle. The potter spray tower was triple rinsed with AR Acetone and RO water between each change in treatment solution. Four replicate dishes per insecticide treatment were placed in each of four ‘constant’ environment cabinets rooms set at 15, 20, 25 and 30°C respectively and each with a 16L: 8D photoperiod. At 24 hours after the application of the treatment solutions the numbers of alive and dead larvae in each dish were recorded, and the dishes were imaged with a photocopier. The photocopy images were later used to estimate the leaf area consumed by superimposing with a transparency of 1 mm2 graph paper. For those dishes in which there were surviving larvae at 24 hours, the numbers of alive and dead larvae were again assessed at 48 hours. Results: After 24 hours, irrespective of the temperature, all of the diamondback moth larvae exposed to the Proclaim and Success treatments were killed (Fig. 1). All of the larvae exposed to the Secure and Regent treatments at 20, 25 and 30°C were dead after 24 hours, however 13.3 and 22.5% respectively of the larvae exposed to these insecticide treatments at 15°C were still

81
surviving after 24 hours. At 48 hours all of the Secure and Regent treated larvae were dead. All the Avatar treatments were slower to act compared to the other four insecticides, irrespective of the temperature (Fig.1). Further the data indicate that the response was slower at the cooler temperatures tested compared to the higher temperatures; the mortality at 24 hours was significantly less at 15°C compared to 30°C (ANOVA, F=4.48, P=0.03). After 48 hours all of the Avatar treated larvae were dead.
0
20
40
60
80
100
1 2 3 4
Temperature ( oC)
% la
rval
mor
talit
y
RegentSuccessSecureAvatarProclaim
15 20 25 30
Fig. 1. The mean percentage mortality (standard errors indicated) of 3rd instar diamondback moth larvae after 24 hours exposure at four different temperatures to label rates of five new insecticides. As was expected the leaf area consumed by the untreated (control) larvae increased with increasing temperature (y=-371.9+31.6x, r2=0.69, df=19, F=40.1). Although the relationship between temperature and leaf area consumed differed between the control and all the insecticide treatments, the trend-line of increasing consumption as the temperature increased was observed with both Regent and Avatar (Fig.2). By contrast, the area consumed by the Success-treated larvae was similar at all four temperatures, and in even greater contrast the Proclaim and Secure treated larvae consumed the greatest leaf area at the lowest temperature (15°C). When these data are presented as the mean area of leaf consumed expressed as a percentage of the area consumed by the untreated (control) larvae (Fig. 3), a similar effect is demonstrated, with the highest percentage consumption occurring with the Proclaim and Secure treatments at 15°C.

82
0
10
20
30
40
50
1 2 3 4
Temperature ( oC)
Leaf
are
a (m
m2 ) Regent
SuccessSecureAvatarProclaim
15 20 25 30
Fig. 2. The mean area (mm2) of leaf consumed (standard errors indicated) by 3rd instar diamondback moth larvae after 24 hours exposure at four different temperatures.
0
10
20
30
40
50
1 2 3 4
Temperature ( oC)
Per
cent
con
sum
ed
RegentSuccessSecureAvatarProclaim
15 20 25 30
Fig. 3. The mean area of leaf consumed by 3rd instar diamondback moth larvae after 24 hours exposure of five new insecticides, expressed as a percentage of the area consumed by the untreated (control) larvae. Discussion: The results of this laboratory experiment indicate that a modest effect on the time taken to kill 3rd instar diamondback moth larvae can occur in the first 24 hours after exposure at 15°C to each of Regent, Secure and Avatar. However, after 48 hours all larvae in all treatments were

83
dead. In the case of the Regent and Avatar the delayed mortality at 15°C did not appear to result in an increase in leaf consumption. By contrast, an increase in leaf consumption of the Secure-treated larvae at 15°C is evident. Oddly an increase in leaf consumption of the Proclaim-treated larvae at 15°C was also evident, despite the fact that all of the larvae were dead when examined after 24 hours. How representative are these results of the influence of temperature on insecticidal activity in the field? If comparable spray coverage to the Potter tower is achieved in the field, it appears that the field temperature, within the 15-30°C range, is unlikely to substantially influence the performance of these five new diamondback moth insecticides. However, the spray deposition achieved by field spray equipment may in some instances be less than that applied by Potter tower, which may conceivably accentuate the modest effect that lower temperatures had on several of the insecticides in this laboratory study. A similar study using lower rates, in which some larval survival occurs with the higher temperature treatments, may further elucidate the potential impact of temperature on the performance of these insecticides. Literature Cited: Arthur FH. 1999. Effect of temperature on residual toxicity of cyfluthrin wettable powder. J.
Economic Entomology 92: 695-699. Edelson JV, Magaro JJ and Plapp FW. 1997. Mortality of diamondback moth, Plutella
xylostella (L.), larvae treated with insecticides as a function of temperature. J. Agricultural Entomology 14: 435-440.
Jaglan RS and Sircar P. 1996. Influence of post-treatment temperature, solvents and emulsifiers
on the toxicity of cypermethrin to larvae of Spodoptera litura (Fab.). Annals of Applied Biology 129:507-511.
Scott JG. 1995. Effects of temperature on insecticide toxicity. Rev. Pesticide Toxicology 3:
111-135.
84
PEST CONTROL USING IMIDACLOPRID AS AN INSECTICIDAL DIP FOR BRASSICA VEGETABLE SEEDLINGS Bronwyn Walsh and Mike Furlong Queensland Department of Primary Industries, Gatton, QLD 4343, Australia. Aim: To protect natural enemies early in the brassica crop’s life while providing early season pest control. Background: Integrated pest management in Brassica crops in southeast Queensland relies on integrating early season pest control with management of mid season pests such as diamondback moth. Research and grower experience has shown that diamondback moth (DBM), Plutella xylostella, can be effectively managed with natural enemies and pesticide applications based on monitoring. This strategy relies on pesticides with a low impact on natural enemies be used, such as Bt or some of the new chemistries, and that through their use, natural enemy populations can become established. A threat to the establishment of the natural enemy population in this Brassica pest management system is the use of broad-spectrum pesticides used early in the season. There are minimal pesticides available that will manage the early season pests such as centre grub, Hellula undalis and cabbage cluster caterpillar, Crocidolomia pavonana and aphids, Brevicoryne brassicae, as well as have low impact on the natural enemy population. Similarly, mid-season, when natural enemy populations are becoming well established, thrips, Thrips tabaci, has become an issue. This is most common on cabbage farms where broad-spectrum pesticides are not used, to avoid impact on natural enemies. In both these situations, a systemic seedling drench could provide an effective pest management tool while still protecting the natural enemy population. This assumes the drench is effective against the pests nominated. Imidacloprid has been used as a drench for Brassica seedlings to provide protection against aphids (Japan, pers comm; NZ pers comm). A drench offers a pest control strategy that does not directly impact on natural enemies, compared to foliar application of pesticides. This makes it an attractive tool for using in an Integrated Pest Management System. An additional issue is the willingness of the chemical company that owns the product to invest in registration. Therefore identifying a market is a significant factor. This means either identifying a large enough host crop or a major pest. In the Brassica system, demonstrating the efficacy of the product against diamondback moth and heliothis may provide some influence. Towards these goals two trials were conducted in 2002. The field experiment showed some promising results in the efficacy of an imidacloprid drench against centre grub and thrips. A lab trial showed that a higher rate of drench was required to be effective against DBM but that there may be phytotoxic effects at higher rates. Based on these results a trial was designed in 2003 to look at the efficacy of different rates of imidacloprid drench against centre grub, DBM, aphids, thrips and heliothis. During the trial

85
silverleaf whitefly also appeared in the crop. This is a significant pest in many crops and its impact on cabbages was unknown. Managing silverleaf whitefly can also impact on natural enemies so the efficacy of the drench against this pest was also measured in the trial. This report outlines the methods employed and the findings of this two-year study. Method: 2002 A cabbage planting of the ‘Warrior’ variety was established on 28th February 2002 at Gatton, Queensland. The planting was 50m x 35m and divided into 15 plots, each 5 beds by 10m, with a total of 140 plants per plot. Plants were in two rows per bed. The treatments in the experiment were: I) 0% seedlings dipped in imidacloprid at 0.035% ai ingredient II) a mixed plot of 50% dipped in imidacloprid at 0.035% and 50% not dipped III) 100% seedlings dipped in imidacloprid at 0.035% ai ingredient. The seedlings were dipped 24hrs prior to planting in a bath filled with the imidacloprid solution. Treated plants were sprayed with coloured dye for distinguishing them during planting. The mixed plot was planted by alternating 2 dipped plants with 2 non-dipped plants in each row. A complete randomised plot design was used, with 5 replicates The number, age and identity of pests on 30 selected plants per plot were recorded weekly for 4 weeks from planting. An assessment of damage was done at harvest. 2003 A cabbage planting (Warrior variety) was established February 19th, 2003 at the DPI Research Station, Gatton Queensland. Seedlings in trays were left 24hrs from their last watering and then immersed in the relevant pesticide solution or water for 1 minute, by which time plugs had become saturated. Seedlings were planted 24hrs after dipping. A complete randomised block design was used, with four replicates and the following treatments: 1) dipped in water 2) dipped in imidacloprid – Rate 1: 0.035% (175ml/100L), Field rate 3) dipped in imidacloprid – Rate 2: 0.07% (350ml/100L), x2 field rate 4) dipped in imidacloprid – Rate 3: 0.14% (525ml/100L), x3 field rate Plots were 10m long and 2 beds wide, there were 2 rows of plants per bed. One bed of plants was used as a buffer on the sides of the experimental area and 7m of plants formed the buffer at each end of the experimental area. Commencing at 5 weeks after planting, one bed per plot was treated weekly with Xentari™, Bacillus thuringiensis var. aizawai. The beds that were sprayed with Xentari™ were randomly selected from each plot. The number, age and identity of pests on 20 plants from each plot were recorded weekly for 5 weeks. For SLWF monitoring, initially adults on a lower leaf were counted however due to their

86
high mobility weekly collections of 5 leaves per plot were used instead. The number of eggs, larvae and pupae on the leaves were recorded. Monitoring for SLWF continued for an extra week than monitoring for other pests. An assessment of damage was done at the end of the monitoring period, 21st March and at harvest, 22nd May. Cabbage heads were assessed by weight, level of damage and size. Data to date is shown below. An analysis still needs to be conducted to clarify significant differences between treatments. Results: 2002 The harvest assessment showed there was no significant difference between the treatments in the proportion of plants that had the growing tip damaged (Figure 1). However looking at the proportion of plants that had centre grub present during monitoring, there were significantly less plants with centre grub present in plants when they had been dipped than in untreated plants (Fig.
1). Fig. 1. The total number of plants that had centre grub present and the total number of plants that were damaged for each treatment. This suggests that the imidacloprid dip affected the number of centre grub present, whether 50% of the plants or all of the plants were treated, but was not sufficient to prevent damage to the plants. The level of damage recorded showed that without sufficient control practices, there is the potential to lose 40% of the crop to these early season pests. Pest presence There were significantly less centre grub present in plants from the treatment that had 100% of plants dipped than from the treatment where no plants had been dipped (Fig. 2).
0
0.2
0.4
0.6
0.8
Damage Centre grub
Prop
ortio
n of
pla
nts/
treat
men
t
0%50%100%
a
bb
a
aa

87
Fig. 2. The mean number of centre grub per 30 plants in each treatment for the 4 week sampling period (8th –28th March, 2002). Aphids on the cabbages were also affected by dipping the plants. There were significantly more aphids present on the plants that hadn’t been dipped or where only 50% of the treatment had been dipped, than on plants where 100% of the plants had been dipped (Fig. 3). A similar trend was seen for thrips.
Fig. 3. Mean number of aphids per 30 plants in each treatment over 4 week sampling period, from (8th –28th March, 2002). Other caterpillar pests were present in the crop. DBM and heliothis were found from the start of monitoring, while cabbage cluster caterpillar and cluster caterpillars were present in the last two weeks of monitoring. There was no significant difference in the number of other caterpillars present between the treatments. These pests, particularly the cluster caterpillar species, are also responsible for growing tip damage.
0
2
4
6
8
10
0% 50% 100%
Mea
n no
. aph
ids/
30 p
lant
s
b
a
a
0
2
4
6
8
10
0% 50% 100%
Mea
n no
. Cen
tre
Gru
b/30
pla
nts
lsd = 3.07
a
b
ab

88
2003 Harvest An early assessment of the damage showed that there were at least 20% less marketable heads from plants that had not been dipped in imidacloprid (Fig. 4).
Fig. 4. The proportion of marketable heads from the different rates of imidacloprid dip after 4 weeks from planting 21st March. This pattern was also expressed at harvest. However by harvest there was a greater difference between the different rates of imidacloprid dip used (Fig. 5).
Fig. 5. The proportion of marketable and semi-marketable heads at harvest from the different rates of imidacloprid dip and weekly applications of Bt.
0
0.1
0.2
0.3
0.4
0.5
0.6
0.7
0.8
0.9
Unt
reat
ed
175m
l
350m
l
550m
l
Unt
reat
ed
175m
l
350m
l
550m
l
bt no btTreatments
Ave
rage
pro
porti
on o
f hea
ds/p
lot Semi marketable
Marketable
0
0.1
0.2
0.3
0.4
0.5
0.6
Untreated 175ml 350ml 550ml
Treatment
Ave
rage
pro
porti
on m
arke
tabl
e he
ads/
plot

89
By harvest, the plants that had been sprayed weekly with Bt had a higher proportion of marketable heads, regardless of whether they had been dipped or not than those that hadn’t been treated. Of the plants that had been sprayed with Bt, those that had been dipped in 550ml/100L had the highest proportion of marketable and semi-marketable heads. This is also the only treatment that reached close to an acceptable level of pest management for the farmer, usually 95% control. The dipping technique achieved a 15-50% increase in semi-marketable and marketable heads. However in a low demand market, the increase is only 2-14% for marketable heads alone. To increase the proportions, additional pest management practices would need to be implemented. These may provide a similar or higher level of pest control. If it was a bio-pesticide application the practice could be justified. However if the product selected impacts on the natural enemy population, there may be a higher cost for the whole season. Pests To clarify why the pesticide dip was increasing the proportion of marketable heads, the section below presents data from our monitoring. It reflects which pests seemed to be affected by the pesticide dip. This data will be further clarified with statistical analysis. • Centre grub In the first week of monitoring there were less centre grub eggs on plants that had been dipped in the medium and high concentrations of dip (Fig. 6). By the second week in monitoring there were less centre grub larvae in all the treatments that had been dipped than in plants that were not treated. For the two subsequent weeks there appears to be little difference. In the last week however, there appears to be a difference in the level of centre grub on treated and untreated plants. This could represent an influence of imidacloprid on the size of the subsequent generation of centre grub coming through. This would assume that the generation has come through in 4 weeks.
Fig. 6. The average number of centre grub larvae on 20 cabbage plants that had been dipped at three rates or untreated for the period Feb 26th-Mar 27th, 2003, at Gatton Research Station, Queensland.
0.0
2.0
4.0
6.0
8.0
10.0
Unt
reat
ed17
5ml
350m
l55
0ml
Unt
reat
ed17
5ml
350m
l55
0ml
Unt
reat
ed17
5ml
350m
l55
0ml
Unt
reat
ed17
5ml
350m
l55
0ml
Unt
reat
ed17
5ml
350m
l55
0ml
26-Feb 5-Mar 14-Mar 20-Mar 27-Mar
Ave
no.
/20
plan
ts
Cente grub eggsCentre grub larvae

90
• Diamondback moth (DBM) No DBM were identified in the first week (Fig. 7). By the second week they had appeared and were in the highest number in the untreated plants, followed by the lowest rate. By the third week there were more DBM in plants that had been dipped, regardless of the concentration of insecticide. In the fourth week the levels were comparable between treatments and in the last week of monitoring there were considerably higher level of DBM larvae in the treated plants than in untreated plants.
Fig. 7. The average number of DBM larvae per 20 plants that had been dipped in different concentrations of insecticide or left untreated, for the period Feb 26th-Mar 27th, 2003 at Gatton Research Station, Queensland. • Silverleaf whitefly (SLWF) Throughout the monitoring period there was a higher level of silverleaf whitefly eggs or adults on untreated plants than on plants that had been dipped (Fig. 8). There was not much difference seen in the level of silverleaf whitefly on plants between the different concentrations of dip at any time during monitoring.
0.0
1.0
2.0
3.0
4.0
Unt
reat
ed17
5ml
350m
l55
0ml
Unt
reat
ed17
5ml
350m
l55
0ml
Unt
reat
ed17
5ml
350m
l55
0ml
Unt
reat
ed17
5ml
350m
l55
0ml
Unt
reat
ed17
5ml
350m
l55
0ml
26-Feb 5-Mar 14-Mar 20-Mar 27-Mar
Ave
no.
DB
M la
rvae
/20
plan
ts

91
Fig. 8. The average number of silverleaf whitefly eggs on leaves or adults on plants from cabbage plants that had not been dipped or dipped in different concentrations of insecticide, from Feb 26th-Apr 2nd, 2003 at Gatton Research Station, Queensland. • Thrips There was a relatively low level of thrips compared to the same time last year. However, similar to last year, there was a higher number of thrips on plants that had not been treated that on plants that had been dipped (Fig. 9). The considerable increase in thrips from Mar 14th to Mar 20th is interesting. The low numbers relative to last year may be a result of interaction with SLWF.
Fig. 9. The average number of thrips on cabbage plants that had not been dipped or dipped in different concentrations of insecticide, from Feb 26th-Mar 27th, 2003 at Gatton Research Station, Queensland.
0
200
400
600
800
Unt
reat
ed17
5ml
350m
l55
0ml
Unt
reat
ed17
5ml
350m
l55
0ml
Unt
reat
ed17
5ml
350m
l55
0ml
Unt
reat
ed17
5ml
350m
l55
0ml
Unt
reat
ed17
5ml
350m
l55
0ml
Unt
reat
ed17
5ml
350m
l55
0ml
26-Feb 5-Mar 14-Mar 20-Mar 27-Mar 2-Apr
Ave
no.
/5 le
aves
Whitefly eggswhitefly adults
0.0
20.0
40.0
60.0
80.0
Unt
reat
ed
175m
l
350m
l
550m
l
Unt
reat
ed
175m
l
350m
l
550m
l
Unt
reat
ed
175m
l35
0ml
550m
l
Unt
reat
ed
175m
l
350m
l
550m
l
Unt
reat
ed
175m
l
350m
l
550m
l
26-Feb 5-Mar 14-Mar 20-Mar 27-Mar
Ave
no.
thrip
s/20
pla
nts

92
Discussion: 2002 Although there were some promising results in using imidacloprid against centre grub is was not sufficient to prevent damage to the crop. The cluster caterpillar species present later in the crop affected the harvest assessment, as it was difficult to distinguish between the species responsible for the damage. An assessment at the end of the monitoring period would assist in determining when the growing tip damage occurs and the species responsible. It is also evident that supplementary control measures would be required for managing the other caterpillar pests. Efficacy against these other caterpillar pests, including DBM and heliothis is also desirable. Higher rates of imidacloprid could be investigated. Efficacy against aphids and thrips is of interest to growers as both can cause damage to cabbage plants. Thrips in particular have become more prevalent as growers use more specific pesticides against the caterpillar pests. Thrips damage tends to occur mid season and at cupping so the period of efficacy needs to be investigated further in relation to thrips control. 2003 The imidacloprid dip seemed to be effective against thrips and provide a potential short-term management option against centre grub, SLWF and DBM at rates of 350ml/ha or higher. The statistical analysis will clarify efficacy results. The apparent lower pest numbers in the last week of treatment is a common factor for centre grub and SLWF and is worth further analysis. Farm staff safety is an issue with the dipping technique. This has been overcome by alternative ‘soil applications’ such as trickle and in-furrow application being investigated by the pesticide company. These alternative application methods have also proven to be more effective in managing pests than dipping. Maximum residue levels need to be considered with any of the new application techniques and will play a role in whether the registrations become available for Brassica crops. A soil application of a systemic pesticide that is effective against sucking pests still remains a valuable tool for the Brassica pest management system and will continue to be pursued with this product or new products under development. Acknowledgments: S. Dennien, B. Nolan, K. Kruger, L. Jackson and Gatton research Station farm staff. Literature Cited: Natwick, E. T.; Palumbo, J. C.; Engle, C. E. (1996) Effects of imidacloprid on colonization of
aphids and silverleaf whitefly and growth, yield and phytotoxicity in cauliflower. Southwestern Entomologist 21 (3):283-292
93
CULTIVAR EFFECTS ON OVIPOSITION PREFERENCE, LARVAL FEEDING AND DEVELOPMENT TIME OF DIAMONDBACK MOTH, PLUTELLA XYLOSTELLA (L.) (LEPIDOPTERA: PLUTELLIDAE) Andrew J. Hamilton1, Nancy M. Endersby1, Peter M. Ridland1 and Melissa Neal2 1Primary Industries Research Victoria—Knoxfield, Private Bag 15, Ferntree Gully Delivery Centre, Victoria 3156, Australia. 2Department of Agricultural Science, The University of Melbourne, Parkville, Victoria, Australia. Abstract: We studied oviposition preference for different cultivars of broccoli, cabbage and cauliflower. Two trials were conducted, about one year apart. In the first trial, a significant cultivar effect was detected for cabbage, but not for broccoli or cauliflower. Significantly more eggs were laid on Savoy King cabbage than the other three cultivars tested. In the second trial, where only cabbage and cauliflower were studied, a significant cultivar effect was again found for cabbage but not for cauliflower. While more eggs were laid on Savoy King than any other cultivar, the difference was not significant when compared to Grand Slam. In general, cauliflower and broccoli were more susceptible to oviposition than cabbage. We also studied the development time of and feeding damage caused by larvae reared on two cultivars of cauliflower, namely Savoy King and Green Coronet. Larvae fed for significantly longer, and developed significantly faster, on Green Coronet compared to Savoy King. Thus, while Savoy King is more susceptible to oviposition in the field, impacts on the crop may be lessened to some degree through lower feeding proficiency of the larvae on this cultivar. Introduction: Host plant resistance is an important component of Integrated Pest Management (IPM). Its potential for use against diamondback moth on Brassica oleracea vegetables has been widely studied. Most of this research, however, has focussed on glossy-leaved varieties (Gupta and Thornsteinson 1960, Dickson et al. 1990, Eigenbrode and Shelton 1990, Eigenbrode et al. 1990, Verkerk and Wright 1996). Wax plates on the cuticle of such varieties appear to provide significant protection from larval feeding (Eigenbrode and Shelton 1990). In Australia, only normal-bloom varieties are commercially available. Normal-bloom varieties do not have such a defence. Resistance mechanisms have not been as well studied in normal-bloom varieties. Verkerk and Wright (1996) suggested that, based on existing knowledge, physically or nutritionally-mediated resistance mechanisms may be more important than chemically-mediated defences against diamondback moth. While a good understanding of resistance mechanisms in normal-bloom varieties will enable the development of resistant lines, a more immediate and pragmatic challenge is to identify which of the cultivars that are currently available to growers are the most resistant. Here we describe two separate experiments directed towards this issue. Firstly, we studied the susceptibility of different broccoli, cabbage and cauliflower cultivars to oviposition by diamondback moth. For one of these crop types, cabbage, we then conducted a laboratory study to test if the oviposition susceptible cultivar was also more susceptible to feeding damage, vice versa.

94
Materials and methods: Oviposition preference study Two main trials were conducted. For the first trial, seedlings were transplanted on 21 December 2001 and harvested on 27 December 2001. In the second trial transplanting and harvest were conducted on 7 and 13 January 2003. The numbers of eggs on the harvested plants were counted in the laboratory. The experimental design was the same for each of these trials, and for each crop type. A balanced incomplete block design was employed. The crops were not sprayed with insecticides. Feeding and development time study The laboratory population has been maintained at the Institute for Horticultural Development (Knoxfield, Victoria) since it was obtained from the University of Adelaide, Department of Crop Protection (Waite Campus, South Australia) in 1994. The colony has always been raised on B. oleracea var. capitata cv. Green Coronet at 25°C (16h:8hr, L:D). Two leaves were placed in a cage containing male and female moths. The leaves were left in each cage for 12 hours, allowing the females to lay eggs on them. The two cabbage cultivars tested were Green Coronet and Savoy King. These two cultivars were chosen because (i) the oviposition study indicated that Savoy King was the most susceptible cultivar to egg lays in the field, and (ii) of the remaining three less-susceptible cultivars, Green Coronet is the most commonly used by the industry. Seedlings of both cultivars were potted in an industry standard potting mixture and left in a glasshouse. No insecticides were applied to the plants. About ten leaves of similar size were collected haphazardly from the plants. From these leaves, fifty leaf disks, each of 45mm diameter, were cut with a steel punch. Each disk was placed, top surface upward, on setting agar in a 47mm internal diameter Petri dish. After allowing for the agar to set, an individual egg was removed from one of the leaves with a paint-brush and placed in the centre of the leaf disk, and a lid was then put on the dish. Fifty such dishes were prepared for each cultivar. From these, 25 of each cultivar were placed in one of the two ‘constant’ environment rooms (set at 24°C; 16L: 8D) The developmental status, i.e. egg, larva or pupa, was recorded for all replicates at 12 hr intervals (1000 hrs and 2200 hrs). Once the last larva pupated, all the leaf disks were transferred to a -12°C freezer for storage. Leaf disks were defrosted at room temperature, and excess moisture was removed with a tissue. Electronic images of each leaf disk against a white background were taken from a standard distance with a tripod-mounted digital camera (Fig. 1). The absolute area not fed upon (i.e. green leaf surface remaining) was determined using SigmaScan image analysis program (Jandel Corporation, San Rafael, CA, USA). This unfed area was converted to a percentage of the total leaf area. The leaf disks had shrunk slightly after the freezing and defrosting process, so the diameter used to estimate the total leaf area needed to be re-estimated. This was done for each cultivar by haphazardly choosing 10 leaf disks and measuring their diameter. The diameter could not be measured for each disk individually, as many had been chewed around their perimeter. Different diameters were used for the two cultivars (44.0mm and 44.7mm for Green Coronet and Savoy King respectively) because analysis of variance (ANOVA) demonstrated significant differences in their diameters (P = 0.007); that is, the freezing and thawing process affected the two cultivars differently. The area fed was simply assumed to be the estimated total

95
area of the leaf minus the area unfed. No distinction could be made between ‘window feeding’, where the thin epidermis of the leaf remains, and complete feeding through the leaf.
Fig. 1. Example of feeding damage on Green Coronet leaf disk. The image analysis program distinguished between the white and green/brown patches, allowing the area fed to be calculated. The arrow denotes the only region where ‘window-feeding’ has occurred; the translucent epidermis has been left behind. Temperature was monitored in the two rooms with Hobo® temperature loggers (Onset Instruments Corporation, Pocasset, MA, USA). Unfortunately, the heating system failed in one of the two rooms, so the temperature in this room regularly fell below 24°C at night (Fig. 2) and was on average cooler (room 1 = 22.6 ± 1.9 SD; room 2 = 23.6, ± 0.6 SD). However, because the treatments were blocked across rooms, it was still appropriate to analyse the treatment (i.e. cultivar) effects on area fed and development time.
220
mm

96
15
17
19
21
23
25
27
0 50 100 150 200 250 300 350
hours since start
15
17
19
21
23
25
27
0 50 100 150 200 250 300 350
tem
pera
ture
(°C
)
room 1
room 2
Fig. 2. Temperature profiles for the two rooms used for the development time/area fed experiment.

97
Statistical analysis The effect of cultivar type on oviposition preference, measured as the number of eggs laid, was analysed using ANOVA. A nested block structure (column/row/plant) was used. Square root of (x +0.5) transformation (Bartlett 1936) was applied to the data to improve homoscedasticity; the transformation also improved normality of data for each crop type. The effects of cultivar type on the amount of leaf area fed and development time were analysed using restricted maximum likelihood (REML) (Patterson and Thompson 1971) in the statistical package GenStat (Lawes Agricultural Trust, IACR-Rothamsted). REML is a more general procedure than ANOVA, and reduces to ANOVA in simple balanced cases. This design was unbalanced because the number of leaf disks upon which larvae did not escape or die—i.e. the number for which area fed could be estimated—varied between treatments and between rooms. Differences between the cultivars were compared using a Wald statistic, which is analogous to the F statistic used to compare treatments in ANOVA. ‘Room’ was modelled as a random effect, which is analogous to block effect in ANOVA. The relationship between area fed and ‘larval’ development time was analysed using ordinary least squares regression on GenStat. Larval development time was defined as the time elapsed from when the first instar larva appeared to when the larva became a pupa. Considering that the moths were observed at twelve-hour intervals, this estimate is limited in its accuracy, but it is a consistent measure that is appropriate for investigating cultivar effects. Results: Oviposition preference The effect of cultivar on the number of eggs per plant was statistically insignificant for both broccoli and cauliflower (Tables 1 and 2 respectively). Table 1. Number of eggs (per plant) on different broccoli cultivars. Back-transformed means are presented in italics. Green Belt Mascot Shilo Viper P 2.067 3.772
2.166 4.192
1.988 3.452
2.036 3.645
0.967
Table 2. Number of eggs (per plant) on four different cauliflower cultivars. Back-transformed means are presented in italics. Aviso Nautilus Prestige White
Rock P
Trial 1 1.966 3.365
2.603 6.276
1.845 2.904
1.894 3.087
0.110
Trial 2 2.885 7.823
2.507 5.785
2.824 7.475
2.810 7.396
0.806
For cabbage, there was a significant effect of cultivar on oviposition preference in both trials (Table 3). In Trial 1, significantly more eggs were laid on Savoy King than any other cultivar. Grand Slam was significantly more susceptible than Green Coronet as well, but not Warrior. In the second trial, the highest numbers of eggs were again observed on Savoy King, but these numbers were not significantly different than those found on Green Coronet and Warrior.

98
Table 3. Number of eggs (per plant) on four different cabbage cultivars. Back-transformed means are presented in italics. LSDs are for comparisons between cultivars within each trial. Cultivars with the same letter are not significantly different from each other (P > 0.05). Grand
Slam Green Coronet
Savoy King Warrior P LSD
Trial 1 1.053a
1.759 1.363b
1.358 2.114b
3.969 1.267b
1.105 0.003 0.504
Trial 2 0.984ab
0.468 1.382a
1.410 1.583a
2.006 1.217ab
0.981 0.026 0.372
In addition to recording the number of eggs per plant, we also counted the number of larvae. Cultivar type did not have a significant effect on the number of larvae for any of the crop types in either trial (P > 0.05 for all). Area fed and development time The mean percentage area fed upon for Green Coronet (18.2%) was significantly greater than for Savoy King (13.9%) (df = 48, P = 0.042). The mean development time (i.e. from egg to pupa) was significantly greater for Savoy King (340.5 hrs) than for Green Coronet (308.0 hrs) (df = 48, P = 0.017). The relationship between area fed and development time was not significant for Savoy King (df = 28, P = 0.203) (Fig. 3). In contrast, this relationship was highly significant for Green Coronet (df = 19, P = 0.004), but only 34.8% of the variance was accounted for (Fig. 4).
y = -0.0609x + 35.803 r 2 = 0.025
0
5
10
15
20
25
30
35
250 300 350 400 450length of larval period (hours)
% le
af a
rea
fed
Fig. 3. Relation between area of leaf fed upon and length of larval period for larvae reared on Savoy King.

99
y = -0.0769x + 44.04r 2 = 0.348
0
5
10
15
20
25
30
35
250 300 350 400 450 500length of larval period (hours)
% le
af a
rea
fed
Fig. 4. Relation between area of leaf fed upon and length of larval period for larvae reared on Green Coronet. Discussion: Knowledge of diamondback moth susceptibility of Brassica crops will enable growers to employ the most appropriate control tactics for a particular cultivar. Here we found that there was no oviposition preference by diamondback moth for seedlings of any of the broccoli or cauliflower varieties tested. This implies that, from the perspective of susceptibility to egglaying, there is no clear advantage in choosing one of these cultivars over another. It is possible, however, that certain varieties may be more resistant to feeding by larvae than others, but that was not tested here for broccoli or cauliflower. Lower numbers of eggs were generally found on cabbages (trial 1 = 1.6/plant, trial 2 = 1.2/plant) compared to broccoli (3.8/plant) and cauliflower (trial 1 = 3.8/plant, trial 2 = 7.1/plant). Furthermore, certain cabbage cultivars were found to be more susceptible than others to egglaying. It could be hypothesised that the generally high numbers of eggs found on Savoy King, the only crinkly-surface cultivar tested, reflect a general preference of diamondback moths to lay eggs on rough or grooved surfaces (Gupta and Thorsteinson 1960). However, while the mean number of eggs was highest on Savoy King in both trials, this mean was not significantly greater than that for some of the non-crinkly cultivars. It is also possible that the architecture of the plant surface affects oviposition in an indirect manner, i.e. by encouraging or discouraging predators or parasitoids. Oviposition-deterrence is just one potential means of host plant resistance. Resistance to larval feeding is another tactic. Here we showed that Green Coronet was significantly more susceptible to feeding damage by larvae than Savoy King, and that the development time of larvae on Green Coronet was shorter. This could mean that Green Coronet is more nutritious, but without data on larval/pupal weights this can only be tentatively suggested. Also, the fact that the length of the larval period was inversely related to the amount of feeding on Green Coronet tends to support the converse argument, that the larvae were nutritionally limited on this cultivar. In contrast, this relationship did not exist for Savoy King.

100
An aspect of plant-pest interaction that has not been studied in detail here is mortality and movement of the pest at various life stages. We found that larvae did not show a cultivar preference for any of the varieties. Considering that significant oviposition preferences were observed on cabbage, it could be argued that for this variety the fact more eggs are laid on particular cultivars is of little significance, since the larvae, which cause the damage, do not show cultivar preferences. This finding clearly infers that larvae are reasonably mobile. However, substantially fewer larvae than eggs were observed and consequently there was much less statistical power. Thus, the possibility that failure to find a significant cultivar effect for larvae reflects a lack of statistical power should not be discounted. Furthermore, we only considered total larvae here. The seedlings were only in the ground for a week, so larvae older than first instar would have come on the seedlings from the nursery and not from eggs laid during a trial. Acknowledgements: We thank Pam Rogers for helping with the development time study. Literature Cited: Bartlett MS. 1936. The square root transformation in analysis of variance. Journal of the Royal
Statistical Society Supplement 3, 68–78. Dickson MH, Shelton AM, Eigenbrode SD, Vamosy ML, Mora M. 1990. Breeding for resistance
to diamondback moth, Plutella xylostella, in cabbage. HortScience 25, 1643–1646. Eigenbrode SD & Shelton AM. 1990. Behaviour of neonate diamondback moth larave on glossy-
leaved resistant Brassica oleracea L. Environmental Entomology 19, 1566–1571. Eigenbrode SD, Shelton AM & Dickson MH. 1990. Two types of resistance to the diamondback
moth (Lepidoptera: Plutellidae) in cabbage. Environmental Entomology 19, 1086–1090. Gupta PD & Thornsteinson AJ. 1960. Food plant relationships of the diamondback moth
(Plutella maculipennis (Curt.)). Sensory relationships of oviposition of the adult female. Entomologia Experimentalis et Applicata 3, 305–314.
Patterson HD & Thompson, R. 1971. Recovery of inter-block information when block sizes are unequal. Biometrika 58, 545–554.
Verkerk RHJ & Wright DJ. 1996. Common cabbage resistance mechanisms against the diamondback moth: still an open book? Annals of Applied Biology 128, 571–577.

101
TECHNOLOGY TRANSFER REPORT Dijana Jevremov (IPM Adoption Coordinator) South Australian Research and Development Institute, GPO Box 397, Adelaide, SA 5001.
Summary: There are seven highlights of the extension efforts of the project. A variety of communication outputs have occurred to extend research information to Brassica growers and their consultants and resellers nationally, but also some outreach to the general public via an IPM brochure, community survey and general media releases, as well some targeted information to produce buyers.
• Thorough audience consultation has occurred to discover what specific IPM information growers would like to hear about, as well as how they would like to receive the information. The result has been a focussing of extension effort in a way that is most likely to reach and resonate with the target audience.
• As a result of consultation, the ‘Brassica IPM National Newsletter’ was developed to
inform growers, consultants and resellers about research, tools, ideas and other information to do with an integrated approach to Brassica pest and disease control. There have been 3 issues produced.
• No less than 45 workshops and presentations by the team have been a prime method of
technology transfer to growers and their consultants. Novel ways of promotion have been used to great success, such as publicity posters and ringing growers to remind them prior to an event. Evaluations of each workshop have been done.
• Media outputs have been consistent and numerous. The project has produced 22 press
releases, at least 67 articles published, 13 radio interviews, 11 fact sheets and one television appearance. The print media articles have targeted local newspapers and grower publications, the national Good Fruit and Vegetables publication, industry journals, local department newsletters, State IDO newsletters, and general media press releases. Each State was involved in assisting the video filming of their State segment for the Victorian based ‘IPM for Brassicas Project’ video in April 2002. The DBM websites of Victoria and SA have been maintained and updated.
• A colour DL folded IPM Brochure has been produced in consultation with the Brassica R&D committee growers to provide community information about vegetable growing using IPM. 25,000 copies of the brochure have been printed and distributed via department outlets, the IDO network, libraries, council offices, expos, field days, agricultural shows etc.
• Numerous free handouts and mailouts to the target audience have occurred via the
workshops and presentations, as well utilising the extensive mailing lists of the IDO network. Products have included laminated copies of the IRM strategy, summary sheets of the key points made at workshops, an A3 laminated DBM lifecycle chart with IPM strategy information, insecticide toxicity chart and new modules to insert into the Project Handbook ‘Integrated Management of Diamondback Moth in Crucifers.’
102
• In recognition that a major obstacle to reducing insecticide reliance by growers is the buyer/consumer expectation for undamaged and uncontaminated produce, current public opinion and understanding on this issue was surveyed at The Royal Adelaide Show. Of the 747 people surveyed at least 90% of people aged 26 and over were prepared to accept finding an occasional insect if it meant less chemicals were used in the growing.
The IPM Adoption Coordinator role: This position began on 8/8/2000 as 2 days per week based at the SARDI Entomology Unit. On July 1 2002 the position became 3 days per week. These changes have been proportional to tasks undertaken in the role. Introduction: A variety of communication outputs have been produced to extend research information to Brassica growers and their consultants nationally, and in addition some outreach to the general public has occurred via an IPM brochure, community survey and general media releases as well some targeted information to produce buyers. Throughout the project, there has been consultation with the Ausveg Brassica R&D committee members, the project team, growers, consultants and IDO’s to gain approval of the communication methods, and also to ensure the effectiveness of the activities. Where minutes were taken of these consultation / meeting sessions, they have been included in Appendix L. Below are the individual activities of each State for the project period. In addition, each State had at least one team member attend the 4th International Workshop on DBM Management in Melbourne in November 2001. It is not possible to record all IPM for DBM information and communication delivered. For example, the distribution of the DBM Handbook and inserts to new growers, answering grower’s telephone queries, farm visits, etc were common practice throughout the Project. Differences noted between the States in terms of output are a reflection of the percentage of time that personnel were allocated to the project in that particular State. This report follows an order that matches how the Appendices also appear. The activities of each State are discussed under the particular topic heading. The Communication Plan: A Communication Plan (Appendix I) was developed early in the term of this project and formed the basis for determining the methods to be used to deliver the information transfer of the project. Research was conducted by the Coordinator prior to developing the Plan as outlined below: In order to determine the best vehicles to use to communicate the IPM information of the project, the following methods were used:
• Project scientists, collaborators and IDO’s in each State were asked by phone what were the particular publications that growers read in their State, how well did workshops go over, and about the value of field days. A gauge of how many growers had computers and Internet access was also taken.

103
• While attending workshops for the Brassica growers and their consultants in each State, some time was taken to further refine the information gathered from the phone research. A list of options for ways the audience could receive their information was presented orally to them to decide which were the preferred options according to them. A show-of-hands was asked for each option. The options list included electronic, paper, and face-to-face ways of communication. This was repeated in each State.
• A six question anonymous paper survey distributed at workshops.
• Asking growers one-on-one at the end of each workshop.
These multiple approaches to gathering information worked well. It gave the opportunity for the target audience to express their opinions either anonymously or openly, so there was confidence that genuine comments were being expressed. In terms of the preferred methods of communication, the following was expressed in order of frequency:
• Newsletters and mailouts • Field days • Workshops • CD Rom • Emails/Internet
It needs to be borne in mind that this survey was conducted at workshops, so it is possible that the audience responded without including the workshop forum as a preferred method. Workshops: These have been a prime method of technology transfer to growers and their consultants. Various subjects have been addressed according to the milestones of the project as recorded below. Visiting speakers from America and New Zealand, as well as interstate have been garnered to address the grower and consultant audience whenever possible. The workshops in the first year consisted of mostly indoor presenting, but evolved to blend outdoor demonstrations in the field, with indoor presentations where actual plants and insects were shown. Generally the workshops have run for 2-3 hours. Purpose of the Workshops: The workshops have been used to visually explain the results of research and IPM more generally using Powerpoint, butchers paper and whiteboards. They have provided the opportunity for questions to be asked by the audience and also for officers of the project to in turn ask questions about field situations and audience experiences. A genuine sharing of information has occurred as is evidenced by comments made in evaluation sheets at workshops and this is discussed further in this section. The workshops have also served as vehicles to hand-deliver tools such as the ‘DBM Lifecycle chart’ shed poster produced by the ‘IPM for Brassicas Project’ based in Victoria. New modules of the Project’s Handbook have also been handed out at these workshops as well as copies of the national Brassica IPM newsletter of the project, the IPM Brochure, insecticide toxicity chart, summary handout sheets, IRM Strategies, and other items from guest speakers and the project. These workshops have proven to be an excellent vehicle to display purpose-designed posters and actual pests and natural enemies for identification. Samples of handout items and posters are contained in Appendix J.
104
In New South Wales where there is a large Chinese Brassica grower audience, the workshops have been held with an interpreter. Not all items of the project have been translated so these workshops are valuable for conveying a better understanding of IPM practice. A contacts list of attendance was created and has been used at each workshop to update names and addresses in databases and to gather email addresses for those newly connected to the internet. This list is for use by the IDO’s and team members. Subjects Covered: In 2001 the focus of information relayed was to reinforce an understanding of Brassica IPM practices and the benefits of an integrated approach. The natural enemies of DBM were discussed along with the history of DBM to readily develop resistance to insecticides, and hence the use of the IRM strategy of the project was highlighted. The presence/absence sampling chart of the project was explained. In 2002 the information delivered was about making the best use of sprays by monitoring for pest pressure and lifecycle stage, to determine the need for spraying and the place that Bt has in a spray program. Audiences were made aware that spraying for grubs rather than adults is the effective aim. The IRM Strategy information was repeated with the changed products in the windows discussed, but this time the information was put in the context of DBM movement and the difference that neighbouring properties with different practices can have. The DBM lifecycle and that of other Brassica pests and natural enemies was shown with live plants and samples, often using microscopes. In 2003 research findings on DBM dispersal and natural enemy management were relayed. New initiatives of the project, such as the insecticide toxicity chart for minimising impact on natural enemies, and the decision tree format of the newly devised monitoring guide, were introduced. Future possible research items of the project were also outlined. In some states other content was included that covered their own Brassica research or pest problems. Promotion: All workshops have been promoted slightly differently in each State according to relevance. Some have used coloured flyers and posters located in reseller stores, irrigation suppliers, district horticulture offices and shopping centres. Others have used faxing of the flyer as a dominant form of publicity. In each case the State vegetable IDO’s have been instrumental in supplying the database for postings, or writing about the workshops in their newsletters. A sample flyer is in Appendix J. When the opportunity has existed to write about a workshop in grower publications or locally produced newsletters, these have been taken advantage of. A trial was conducted in South Australia in 2002 where all Brassica growers who had not RSVP’d for a forthcoming workshop were rung a few days before the arranged workshop to remind them of the event and ask if they could come. This prompting resulted in a record number of participants, and therefore became a recommended strategy in each State. Evaluations: Early in the project, an evaluation sheet was developed to evaluate the effectiveness of the workshops in information transfer, the organisation of the workshop, as well as finding out the methods of communication preferred and the topics to be covered in future. This short evaluation sheet has been well utilised in the project and a copy is supplied in Appendix O. Over

105
300 of these sheets have been completed during the project. After each workshop the team member has sent the sheets to the Coordinator for analysis, and the results are then emailed back to the officer and the State IDO. A summary of 169 evaluation sheet responses was compiled in May 2002 to determine the most requested topics to guide future extension. A copy of the results is supplied in Appendix O. The information was relayed to the Brassica Ausveg committee at the August 2002 project team meeting, and the results have been used to guide planning for extension content in the new project VG03040. Overall the workshops have been well received and remain a favourite form of communication. We have not always pleased all audience members in terms of length of time taken and organisation, nor with the level of information given. The comments have been taken seriously and guided the changes to subsequent workshops. A randomly selected sample of the results gathered from several workshops, is included in Appendix O. State Workshops / Field Tours / Meetings: Tasmania 2000 – 2001 • 2 in-field workshops were held down south at Coal River Valley for agronomists and
growers re pest ID, scouting and thresholds (8 attended). • 1 presentation to a grower group at Black River about beneficial insect ID, scouting etc.
(20 attended) • A large display poster was created for use at these sessions. • Longford and Devonport Project workshops conducted with Greg Baker and Dijana
Jevremov (29 in attendance). • 8 end-of-season workshops for 35 agronomists was conducted covering live pests and
beneficials where the results of scouting were compared. • 13 field tours with agronomists, 1 factory tour and 1 processing growers workshop
information evening was conducted. 2002 – 2003 • 2 workshops held at Longford and Forth where approximately 75 growers and
consultants attended. Dr Nancy Schellhorn presented the new Monitoring guide of the project and the draft ‘Insecticide Toxicity Chart’ was introduced.
South Australia 2000 – 2001 • 2 presentations given to growers and resellers by Greg Baker and Dijana Jevremov. • 1 major DBM workshop held with most Brassica growers attending and some
consultants. Covered pest and beneficial ID, resistance management, scouting protocol, etc. Nancy Endersby & Dr Peter Ridland from Victoria presented their work. A follow-up field day was held to demonstrate the scouting protocol.
2002 – 2003 • Dr Tony Shelton, a Brassica IPM Specialist on sabbatical from Cornell University, along
with SA team members, presented at a Brassica Forum that was organized with Veg IDO Craig Feutrill and held at Virginia. Other invited speakers were Dr Elizabeth Minchinton (White Blister) and Dr Ian Porter (Clubroot), and Mr Kevin Niemeyer (IPM Grower, Queensland).

106
Western Australia 2000 – 2001 • A 2 hour grower workshop series was held in September 2000 & April 2001. Each was
held at 4 locations – Albany, Manjimup, Perth Metro areas North & South. Covered the current WA research, crop scouting methods and national charts, along with explanation of the Resistance Management Strategy for WA.
• A ‘Take home messages’ summary sheet was distributed at the workshops and post workshops publicity was organised.
2002 – 2003 • 4 grower workshops held at the same 4 locations as above with (40 attending). At two of
these Dr Tony Shelton and Greg Baker presented. • Released an updated IRM strategy (Sept 2002), and held 4 grower meetings in April
2003. The meetings were held in Wanneroo, Medina, Albany and Manjimup. Topics covered were:
– natural enemies of DBM (including displays) – the two versions of the toxicity to natural enemies charts – update/summary of the national project – results of moth spray trials (Nancy S) and WA bait crop trials. New South Wales 2000 – 2001 • Leigh James and Greg Baker presented IPM for DBM at the Sydney Basin Field Grown
Vegetables Conference July 2000. Circulated DBM Handbook chapters + IRM Strategy at this event where 100 people were present.
• Presentation at Aust. Chinese Growers Assoc. Field Day (200 present), handouts available.
• Arranged for Greg Baker to present repeat DBM sessions at Sydney Vegetable Exhibition, Uni of West Sydney. Attended by 100.
• A large number of DBM related farm visits and phone calls were attended. 2002 – 2003 • 3 DBM regional workshops were held in Camden, Bathurst and Richmond with invited
SA team researchers presenting (60 attended) bringing lifecycle & IRM displays with them.
Queensland 2000 – 2001 • A Brassica grower group presentation of the project results was delivered by Greg Baker
(15 participants). • Project objectives and results presented at Queensland Fruit and Vegetable Growers
“Growing for Profit” forum. • Project objectives and results presented at Brassica Field Day including a refresher
session on the Resistance Management Strategy, pest and beneficial identification in conjunction with presenting the ACIAR project (30 industry participants).
2002 – 2003 • Informed growers of the national DBM project objectives and activities at ACIAR
project meetings. • Attended the annual project workshop and reported items of interest to growers in a
mailout: including adulticidal pesticides, resistance management, research priorities, IPM CD/video. (Copy included in Appendix K)

107
Victoria 2000 – 2001 • 2 Workshops held in Oct – Nov 2000. One on DBM management to Elders, Packenham
and the other was a Crop Scouting Training Day for E.E Muir and Sons. • Presented project work at Natural Resources & Environment Conference. • Virginia SA, DBM workshop. • Organised and convened 4th International DBM workshop held in Melbourne Nov 2001. 2002 – 2003 • 5 Grower and Industry presentations delivered as follows: – Horticulture training for NuFarm – TAFE Vegetable apprentices – Avatar launch at TAFE – Land Connect Australia workshop with Brassica Growers in attendance. • DBM project display @ Werribee Vegetable Expo. • 1 scouts training workshop (4 attended)
• DBM information presented at a workshop for large grower ‘Costa’s’ in July 02. • A workshop was held Tuesday 8th October 02, hosted by E. E. Muir and Sons. Growers
and chemical industry representatives were in attendance. The focus of the day was IPM. Information was presented on the DBM lifecycle and temperature development, beneficial insects, insecticide resistance results, resistance management, disadvantages of targeting moths and moth movement studies. Some other Institute for Hort Development researchers, Elizabeth Minchinton and Robert Faggian spoke about White Blister. Peter Ridland gave an update on the new lettuce aphid pest that is present in NZ (Nasonovia ribisnigri) and likely to arrive in Australia. (Many Victorian Brassica growers also grow lettuce.) • Participated in DBM Control Meeting for the dairy industry. The relevance pertains to
Brassica growing as a forage crop. Held at Department of Primary Industries, Warrnambool, 13 January 2003 where two presentations were given by N. Endersby.
Media Outputs: There have been many articles written by the team members for publications around the country during the three years of the project. They have included local newspapers and grower publications, the national Good Fruit and Vegetables publication, industry journals, local department newsletters, State IDO newsletters, and general press releases. Many of the articles written have been published, and those that are known have been summarised in list form in Appendix K. Originals are available for viewing either from the Adoption Coordinator or the relevant State team member. Photos have been encouraged at all workshops and field events, and used to attract attention and add interest in media articles. In addition to print media, there have been a number of radio interviews and television appearances. Again these are listed in Appendix K for the relevant State. Each State was involved in assisting the video filming of their State segment for the Victorian based ‘IPM for Brassicas Project’ video in April 2002. The recently released Vegenote for DBM control was written by the Adoption Coordinator with SA team editing.

108
The DBM websites of Victoria and SA have been maintained and updated. A complete review of the Primary Industries and Resources SA website has meant that a thorough analysis and update of the SARDI - DBM site was opportune and this is occurring. This reviewed site will link to the future National Vegetable Industry site once it is operational. Media Items Summary: The full listing of items per State appears in Appendix K. Here is a summary of what has been achieved in total by the team: Press Releases: 22 Known Published Articles: 67 Radio Interviews: 13 Television appearances: 1 Fact Sheets: 11
Newsletters / IPM Brochure: Brassica IPM National Newsletter: The first national newsletter of the project was mailed out in September 2002. Titled ‘Brassica IPM National Newsletter’, there have been three issues posted – the inaugural one, and then in February and July 2003. The Adoption Coordinator compiles and edits each issue. There are 2,200 copies of each issue printed. The newsletters are mailed out as a hard copy or emailed out in PDF format to consultants and growers on the mail lists of each StateVegetable Industry Development Officer as well as ancillary requests to the Coordinator. All three issues have been translated into Chinese and printed and mailed to the 350 Chinese growers in NSW. The newsletters are hole punched to fit into the Handbook of the project for future reference. The primary aim of this newsletter is to inform growers, consultants and resellers about research, tools, ideas and other information to do with an integrated approach to Brassica pest and disease control. Input into editions is invited from practitioners outside the team. This allows for the newsletter to serve to circulate the information from other Brassica related HAL projects. The production of the newsletter responds to the requests made on the workshop evaluation sheets for mailout information. Each newsletter has been loaded on to the SA DBM Project website. Copies of the title pages of the 3 newsletters have been reproduced in Appendix M of the printed version of this report. Local Newsletters: • SA 2001 - 2 local brassica grower DBM newsletters produced and circulated before the National newsletter replaced these. • Plutella Updates was a fact-sheet style update on research and local observations that States contribute items too. It was produced in Victoria by Nancy Endersby, and there were four issues produced until the national newsletter became available. A copy of one of these updates is supplied in Appendix M. The Plutella Updates had a mailing list of around 100 via email and hardcopy. • Vegetable IDO State Newsletters come out roughly each 2-3 months and generally contain some update information about the DBM project or pest problem. Team members have readily contributed items or promoted workshops or meetings via these. • Western Australia began their local newsletter ‘Better Brassica’ in August 2002. There are 2 issues per year and it goes to all cauliflower growers on the Dept of Agriculture mailing list.

109
IPM Brochure: This colour DL folded brochure was borne out of discussions early in 2001 when the project communication plan was devised, and later discussed and analysed with the Brassica R&D committee growers. It was agreed that informing the general community about IPM growing was an important step to take and that the brochure could serve that role. The brochure was drafted by the Adoption Coordinator and approval and input was sought from the R&D Committee, team members and IDO’s before a final version was produced. In 2003 25,000 copies of the brochure were printed. Distribution so far has been achieved by team members distributing to department outlets, libraries, council offices, expos, field days, agricultural shows etc. The IDO’s have also been sent large quantities to mail to their databases and to distribute elsewhere as appropriate. A Pdf version of the brochure is available on request and a copy of the first page is included in Appendix M of this report. A very favourable review of the brochure occurred in the international email newsletter IPM Net and has resulted in numerous requests from overseas for a copy. Handbook Modules: The modules referred to here are hole-punched for insertion into the existing Handbook of the project titled ‘Integrated Management of Diamondback Moth in Crucifers – The Handbook’. Distribution has been via the team members or IDO’s direct mailing, or by pickup at workshops. The coordination, printing and distribution of the modules has occurred primarily via team member Leigh James in New South Wales. The entire handbook including the new modules have all been translated into Chinese and bound and distributed to the 350 Chinese Brassica growers in NSW. Again, this was coordinated by Leigh James. The following modules have been produced during the course of this project: IRM “Two-Window” Strategy: This module comes as a colour sheet showing the two windows for use of the new DBM insecticides in a given time frame. A laminated version has been handed out at some workshops to be displayed in growers’ chemical sheds. It has been posted out to the regular lists for the handbook but also sent to reseller stores and consultants as extras for mounting on counters etc. This component of the modules has been updated around each 12 –18 months. One version of the strategy exists for NSW, VIC, SA, and TAS, while separate versions have been created for QLD and WA by those states, to take into account their growing seasons and conditions. Qld organised printing of a wall-chart version of their window strategy. The window strategy requires a change in products twice in a calendar year. To remind growers of this, a fax-out sheet was designed for forwarding by IDO’s or team members from their database of grower and consultant numbers. The Adoption Coordinator prompts for this to happen. A copy of the fax sheet is included in Appendix N. Scouting Chart & Recording Sheets 2001: This item went to all States as laminated A4 versions for handing out at workshops, but also was posted as an insert into the handbook with several recording sheets. Updated Monitoring/Scouting Module: This module has been released as an electronic format at the time of reporting on the following website: http://www.dpi.vic.gov.au/web/root/domino/cm_da/nrenfa.nsf/frameset/NRE+Farm

110
This module will be printed in a field use version rather than a Handbook insert once the accompanying Insecticide Toxicity Chart, which ranks the impact of each Brassica insecticide on key beneficials, is completed. Handbook Updates: These updates consisted of ‘Sources of information about Brassica crops: pests, diseases, disorders and agronomy’, ‘Brassica information on the internet’, and ‘Ensuring good spray comverage’, together with a new covering page and acknowledgements sheet as well as new contents page list. These were circulated early in this project. DBM lifecycle charts: While not a module as such, the A3 chart was laminated and handed out at field days and workshops. It is an output of the ‘IPM for Brassicas Project’ based in Victoria. The information complements the lifecycle of DBM colour sheet in the Handbook. Sample modules are available in Appendix N. Surveys: Tasmania • 2001 - Monitored 2 sites & sent results via 11 faxes regularly to 30+ agronomists. • Surveyed agronomists, 90% grower coverage, about who scouts for DBM, how and what help is needed. • Survey titled ‘Who scouts Brassica crops for DBM, How do you do it? What extra guidance would you like?’ was conducted very early in the project. All States • 01 - 2002 conducted the AIRACS DBM IRM Survey of growers reported under IRM research section elsewhere in this report. South Australia • IPM Adoption Coordinator conducted a community survey at The Royal Adelaide Horticultural Show regarding consumer attitudes to finding insect pests/damage in brassicas. 747 people filled in the 6 question survey form with pleasing results as reported below. 2001-02 local promotion of Royal Show Survey via mass media release, and other national articles and radio interviews were conducted. Royal Adelaide Show Community Survey Report: In recognition that a major obstacle to reducing insecticide reliance by growers is the buyer/consumer expectation for undamaged and uncontaminated produce, current public opinion and understanding on the issue was sought. The Royal Adelaide Show was chosen as an ideal place to capture a broad section of the mainstream buying public. 747 people ranging in age from under 15 to over 65 filled in survey forms over nine days at a stand in the Agricultural Hall. Fresh contaminated broccoli was on display as well as large photographs of damaged and contaminated Brassica produce. Six short questions were asked (see Appendix O) and here are some of the results. • The majority of respondents were in the 26-64 age group • 56% of people have found an insect in their brassica produce • 74% are effected either a little or not at all by finding them

111
• At least 90% of people 26 and over are prepared to accept finding an occasional insect if it means less chemicals are used in the growing.
This is valuable and empowering information for growers and buyers/wholesalers alike. The findings are likely to be very similar across the country. With an integrated approach to pest management, such as the timing of planting, crop scouting, and using insecticides that target only the pest while conserving beneficial insects, it is possible to reduce the number of sprays needed to give good control of Brassica pests. The problem is that growers are unwilling to risk changing current practices because of fear it may mean some damage and contamination until IPM is established. The research of the National Diamondback moth team is aiming to encourage adoption of IPM practices that don't compromise the yield or saleability of produce. There is historical evidence of pests becoming resistant to insecticides. IPM offers an alternative to the reliance on insecticides as a sole measure for control, and it provides the opportunity to deliver on the increasing community expectation for 'Clean and Green' food. This survey shows that the community is willing to support the grower for 'greener' produce and not simply expect it. A copy of the survey sheet and more expansive report is contained in Appendix O. Acknowledgements: The project team wishes to acknowledge and thank the following people for their assistance with extension and/or extension research work in the project: The National Brassica R&D Committee members of Ausveg who have been instructive with on-the-ground information and guidance at the annual team meetings and at State workshop events of the project. They are Michael Badcock, Jeff McSpedden, John Cranwell, Kon Koroneos, Dan Hood, David East, Brad Ipsen, Marco Groote, and Derek Bade. State Vegetable Industry Development Officers (IDO’s) both past and present that have been invaluable in promoting the project via their own networks and publications, and also with distribution of material. Particular thanks must go to Craig Feutrill the Brassica IDO for extra advice, guidance and support. Western Australia Growers: Trandos Farms, R & A Dunn, Vince & George Berlengeri, White and Sons. Consultants: Lloyd Williams Technical support: David Cousins (Dept Agric) South Australia Growers: John and Steven Newman, John and Robert Cranwell, John and Graham Pitchford, Leigh and Scott Samwell, John Mundy, Derek Bade, Ian Fowles, Frank Musolino, George Panuccio, Rob Marcoionni. Consultants: Domenic Cavallaro, John Jeffs, Paul Pezzaniti and staff of Di Manno Grower Supplies all stores. Technical support : Cate Paull, Judy Bellati, Chris Krawec.

112
Tasmania Growers: Mr Mike Badcock of Forth, Mr Stewart Greenhill of Wesley Vale, Mr David and Mr Colin Chaplin of Wesley Vale, Mr Tony Loane of Wesley Vale, Mr Athol Gillam of Forth, Mr Hardstaff of Kindred, Mr Mark Kable of Harvest Moon, Forth. New South Wales Growers: Rod Sherriff (grower cooperator, Castlereagh), John Micallef & Sons (grower cooperator, Richmond), Jeff McSpedden (grower cooperator, Bathurst), Others: Gus Campbell (NSW Agriculture, Bathurst), Prof. Robert Spooner-Hart & Mary Canard (University of Western Sydney-Hawkesbury, Richmond), Greg Kocanda (Elders, Canowindra), Matthew Stevens (ScienceScape Editing, Thornleigh). Victoria Growers: Kon Koroneos, Paul Gazzolla. Resellers: EE Muir & Sons. Queensland Growers: Kevin Niemeyer – grower and presenter at workshops of the project, Fellow Researcher: Mike Furlong – scientist, co-collaborator and presenter.

113
APPENDIX A Manuscript: Hamilton AJ, Schellhorn NA, Endersby NM, Ridland PM and Ward SA 2004. A dynamic binomial sequential sampling plan for Plutella xylostella (Lepidoptera: Plutellidae) on broccoli and cauliflower in Australia. Journal of Economic Entomology 97: 127-135.

SAMPLING AND BIOSTATISTICS
A Dynamic Binomial Sequential Sampling Plan for Plutella xylostella(Lepidoptera: Plutellidae) on Broccoli and Cauliflower in Australia
A. J. HAMILTON,1 N. A. SCHELLHORN,2 N. M. ENDERSBY, P. M. RIDLAND, AND S. A. WARD3
Department of Primary Industries (KnoxÞeld), Private Bag 15, Ferntree Gully Delivery Centre, Victoria 3156, Australia
J. Econ. Entomol. 97(1): 127Ð135 (2004)
ABSTRACT Binomial sequential sampling plans have been used widely for monitoring invertebratepest populations. Such plans are typically based upon a single action threshold (AT), which representsthe level of infestation that the grower is prepared to accept before using a control measure. For manycropping systems this acceptable infestation level is likely to vary, being dependent on factors suchas the growth stage of the crop and the value or demands of the destination market (e.g., local orhigh-quality export). We developed and validated a computer-assisted plan that uses a dynamic AT.The plan has been developed for monitoring diamondback moth, Plutella xylostella (L.) on broccoli(Brassica oleracea variety botrytis L.) and caulißower (Brassica oleracea variety botrytis L.), but theconcepts and methodologies could be readily applied to other systems.
KEY WORDS Plutella xylostella, action threshold, binomial sampling, parasitism, sequential sam-pling
DIAMONDBACK MOTH, Plutella xylostella (L.), is a majorpest of Brassica crops worldwide. For broccoli andcaulißower, the presence of P. xylostella larvae orpupae in ßower heads at harvest can reduce cropmarketability. Currently, many growers in southernAustralia use a calendar spraying protocol: the crop issprayed at a particular time regardless of the abun-dance of the pest. The development of an effectivesampling plan should ultimately reduce the frequencyof spraying, while still maintaining control of the pestpopulation. There are three reasons why it is in agrowerÕs interest to keep the number of sprays to aminimum: cost, consumer concern/export demands inrelation to pesticide residues, and development ofinsecticide resistance, which is a particularly impor-tant issue for P. xylostella (Talekar and Shelton 1993,Baker and Kovaliski 1999, Zhao et al. 2002). The sit-uation in southern Australia and New Zealand isunique, becauseP. xylostella is typically the only majorlepidopteran pest in Brassica crops (Beck and Cam-eron 1990; Baker and Kovaliski 1999). Many samplingplans have been developed for North American Bras-sica crops, but action thresholds (ATs) for these plansare usually for lepidopteran pest complexes, such as P.xylostella; cabbage looper, Trichoplusia ni (Hubner);and imported cabbageworm, Pieris rapae (L.), andhave historically been based on cabbage looper equiv-alents (Kirby and Slosser 1981, Shelton and Andaloro
1982, Shelton et al. 1982, Hoy et al. 1986, Doran et al.1995, Maltais et al. 1998).
A binomial sequential sampling plan developed forP. xylostella in Australia by Mo et al. (2003) was basedon an AT of 0.15 proportion of plants infested. The 0.15AT is primarily based on growersÕ perceptions of ac-ceptable levels and New Zealand work on lepidop-teran pests on cabbage (Brassica oleracea variety capi-tata L.) (Beck and Cameron 1990). The 0.15 ATsampling plan was tested in broccoli (Brassica oleraceavariety botrytis L.) and caulißower (Brassica oleraceavariety botrytis L.) Þelds, and these studies suggestedthat it was generally too conservative, especially forbroccoli (N.A.S., unpublished data).
Typically, only one static AT is used for a samplingplan, but for many crops it would probably be moreappropriate to have an AT that changes to suit con-ditions (e.g., Walgenbach and Wyman 1984). For ex-ample, if there is a stage in the cropÕs life cycle whereit is particularly vulnerable to pest damage, then arelatively conservative AT may be used. Here, wepresent a plan where three factors inßuence the AT:crop stage, parasitism status of the pest, and marketdestination of the crop.
A potential limitation of using the 0.15 AT planproposed by Mo et al. (2003) is that it assumes that allstages of the crop need equal protection. For broccoliand caulißower, this is clearly not the case. It is eitherthe presence of larvae in the ßoret or curd at harvest,or feeding damage on the leaves that tightly wraparound the caulißower curd that causes most prob-lems.
1 E-mail: [email protected] Entomology Unit, South Australian Research and Development
Institute, Waite Road, Urrbrae, South Australia 5064.3 School of Life Sciences, La Trobe University, Bundoora, Victoria
3086, Australia.
0022-0493/04/0127Ð0135$04.00/0 � 2004 Entomological Society of America

Preliminary studies on broccoli and caulißowercrops by N.A.S. in South Australia suggest that the 0.15AT is too conservative. In these studies, two cauli-ßower crops (from different properties) were moni-tored at weekly intervals for 8 wk, and insecticide wasapplied once each week. On no occasion was theproportion of infested plants below 0.15. Similarly, onebroccoli crop was monitored at weekly intervals for 11wk (but only sprayed on Þve occasions), and at alltimes the proportion of plants infested was �0.15. Infurther preliminary studies on broccoli and cauli-ßower, ATs of 0.3 and 0.6 (followed by 0.15 when theßoret or curd was visible) were trialed. For broccoli,the proportions of plants not infested for the 0.3 AT,0.60 AT, calendar spray, and no spray were 0.80, 0.50,0.63, and 0.55, respectively. However, a similar studyfor caulißower suggested that it was more sensitive toelevated ATs. For the same treatments as for broccoli,the proportions of plants not infested were 0.25, 0.40,0.52, and 0.05, respectively.
In Australia, high levels of parasitism of P. xylostellalarvae by parasitoid wasps often occur. Parasitism byDiadegma semiclausum Hellen (Ichneumonidae) isthe most common and widespread, but three otherspecies, Diadromus collaris Gravenhorst (Ichneu-monidae), Apanteles ippeus Nixon (Braconidae) andDiadegma rapi Cameron (Ichneumonidae), are alsocommonly present (Goodwin 1979, Hamilton 1979).In North America, parasitism of P. xylostella by D.insulare sometimes exceeds 80% for fourth instars and50% for third instars (Hutchison et al. 2003). Parasit-ism levels of 95% of second to fourth instars have beenobserved consistently for periods of several weeks inbroccoli, where Bacillus thuringiensis (Bt) productswere the primary insecticides used (Appendix). Ofcourse, if a P. xylostella larva is parasitized, a wasp willbe recruited into the next generation, not a moth.Therefore, parasitism of P. xylostella is a fairly impor-tant control measure and can be integrated into anintegrated pest management (IPM) program, espe-cially when the pest complex is simple and P. xylostellais the dominant species. If we assume that the majorcause for concern is the presence of larvae in the ßoretat harvest, and possibly feeding damage just beforeharvest, then a parasitized larva before ßoret forma-tion will effectively have no impact on marketableyield.
Another factor that needs to be taken into accountwhen choosing an AT is the destination market of thecrop. For broccoli and caulißower, the fresh domesticmarket may accept slightly higher levels of infestationthan produce destined for export or processing. Thisis due to quarantine restrictions and to consumer de-mand for processed food to be completely free ofinsect contaminants.
Most sampling plans for lepidopteran pests on Bras-sica vegetable crops use a static AT, but some re-searchers have found a dynamic AT to more appro-priate (Hoy et al. 1983, Shelton et al. 1994, Eastman etal. 1995, Hines and Hutchison 2001). Here, we incor-porate crop stage, parasitism, and destination marketinto sampling plans for P. xylostella on broccoli and
caulißower. The plan is a sequential binomial plan andis run using a Microsoft Excel program. It is principallyintended for use by crop consultants and growers. Acopy of the plan be obtained, free of charge, by con-tacting the corresponding author, or it can bedownloaded for free from one of the followingWeb sites: www.dpi.vic.gov.au or www.sardi.sa.gov.au/entomology/index.html.
Materials and Methods
Data Sets. Two data sets were combined and usedÞrst to describe the relationship between the meannumber of larvae per plant and the proportion ofplants infested (p), which was necessary when incor-porating parasitism into the plan; and second to vali-date the plan (see below). Both of these exerciseswere conducted independently for broccoli and cau-lißower. Neither data set was speciÞcally collected forthe purposes of this plan; both were intended to ad-dress hypotheses from other research programs. Con-sequently, the sampling protocols were different be-tween the two data sets, and there was some variationin the number of sampling units used on differentoccasions (see below).
One data set was collected from a 10-ha property inSt. Kilda, �45 km north of Adelaide, South Australia(38� 40� S, 138� 33� E), and the other came from variousfarms in the Werribee South (37� 56� S, 144� 44� E) andCranbourne (38� 06� S, 145� 16� E) growing regions onthe outskirts of Melbourne, Victoria. In South Austra-lia, sampling was conducted from January to April2001 and from October to January 2002. Samplingcommenced ineachcropat �1wkafter transplant andwas carried through at 7Ð12-d intervals to harvest. Onebroccoli crop, measuring 250 by 12 m, and two cau-lißower crops, each measuring �100 by 12 m, weresurveyed. In total, the broccoli and caulißower cropswere surveyed on 36 and 41 occasions, respectively.On each sampling occasion, between 10 and 50 plantswere surveyed (mean � 19.5 and 28.9 for broccoli andcaulißower, respectively). Broccoli and caulißowercrops were surveyed in a zigzag manner (i.e., acrossthe 12-m width, along the length). After a randomnumber of steps along the zigzag (number restrictedto between 8 and 25 inclusive), the nearest plant waschosen and the number of larvae (all instars) on itrecorded. Surveying startedatoneendof theÞeld, andif the other end was reached, it continued back downthe crop with inverse zigzags to those used on the wayup.
In Victoria, surveys for both crops were conductedover the 1998/1999 summer. Broccoli surveys weremade at three properties, one located at Cranbourneand the other two at Werribee. Two separate “plant-ings” (i.e., a distinct crop where all plants were trans-planted on the same date) were surveyed at each ofthe Werribee properties, but only one was sampled atthe Cranbourne property. Thus, Þve plantings werecovered in total, and each was surveyed at approxi-mately weekly intervals from 1 wk after transplantthrough to harvest. Data for caulißower were col-
128 JOURNAL OF ECONOMIC ENTOMOLOGY Vol. 97, no. 1

lected fromtwoplantingsatoneproperty inWerribee,and as with broccoli, these crops were surveyed atapproximately weekly intervals from 1 wk after trans-plant through to harvest. All Þelds were surveyedaccording to the following procedure. Ten samplingpoints were chosen by walking along transects that ranfrom one corner of the Þeld to the mid-point of theopposite side and back to the adjacent corner (com-monly referred to as a V-shaped sampling plan; Torresand Hoy 2002). These sampling points were equidis-tantly spaced, and thus the distance between adjacentsampling points was dependent on the size of the Þeld,but was always �15 m. Due to logistical constraints, ona few occasions only Þve sampling points were used(i.e., along one arm of the “V” only). At each samplingpoint, four plants were sampled. All crops wereplanted in beds that consisted of two staggered rows.The four plants were sampled from one bed, with twoplants from each row being examined. The number oflarvae (second to fourth instars) on each of theseplants was recorded.
The Victorian data were obtained from propertieswhere the growers were encouraged to maintain theirnormal spray practices throughout the survey period.This meant that in most cases, but not all, the pest wasunder reasonable control and only a low-to-interme-diate proportion of plants was infested. Conversely,the South Australian research team could Þnanciallycompensate their growers for loss and thus was able torequest them to abstain from spraying. This meant thatmany of these observations represented high propor-tions of plants infested. Thus, between the two datasets, abroad spectrumofproportionsofplants infestedwas represented. This was important when using re-sampling to validate the plan (see below). In partic-ular, a range of proportions infested was required to Þtmeaningful nonlinear regression models to the oper-ating characteristic (OC) functions, especially whenvalidating for a wide range of ATs. Although it is notideal to use two different data sets for validating theplan, it should be noted that even though one data setmainly represented high proportions infested, and theother low, they both had some low, intermediate, andhigh proportion infested observations. Data sets werepooled when modeling the mean-incidence relation-ship (see below).
Construction of the Plan. The basis of this plan wasthat the AT changes in response to certain conditions.Once the AT has been decided upon, WaldÕs sequen-tial probability ratio test (Wald 1947) is used to con-struct decision lines for a binomial-sampling chart. Asimple decision tree is then used to alter the AT. Thissystem asks the user questions about crop stage anddestination market. Both of these factors are consid-ered important in determining the level of infestationthat is tolerable (i.e., the AT). Factors that are likelyto have a direct inßuence on pest population abun-dance, such as temperature or predation, are not in-cluded in the decision tree. This is because changes inpest population abundance do not alter the level ofinfestation that is considered tolerable. These factorswill be taken into account implicitly, because the pop-
ulation will be surveyed regularly, and inclusion ofthem in the decision tree would have confoundedtheir inßuence. Parasitism was the other factor thatwas considered in the decision tree. Parasitism wasincluded as a correction factor and in this sense itfulÞlled a different function to the crop stage andmarket questions. Because a parasitized larva will notgo on to reproduce, and the presence of larvae on theplant before ßoret or curd formation does not causemajor damage, a parasitized larva found on the plantbefore this time could effectively be ignored.
The effect of parasitism was incorporated into theplan by multiplying the AT by a correction factor.However, the sampling unit for a parasitism estimatewas a larva, whereas that for an AT was a plant. Weused a three-step procedure to overcome this. First,the AT was converted from a proportion of plantsinfested toameannumberof larvaeperplantusing theempirical model of Gerrard and Chiang (1970) andNachman (1981):
ln x� � a � b ln(� ln(q)) [1]
where x� is mean number of larvae per plant, a is they-intercept, b is the slope, and q is the proportion ofplants not infested. We pooled both data sets de-scribed above, and plotted this relationship separatelyfor broccoli and caulißower. Now that the AT hadbeen converted into a mean number of larvae perplant, it could be multiplied by a correction factor thattook parasitism into account (1/proportion of larvaenot parasitized). The Þnal step was to convert thisadjusted AT back to a proportion of plants infestedusing the inverse of the empirical equation 1. Thisparasitism correction procedure was only employedbefore ßoret or curd formation. Because there waserror associated with estimating both variables, andbecause both variables were used as predictors, a re-duced major axis regression (RMA) model was used todetermine a and b (computed using RMA program,Bohonak 2002).
For caulißower, a ceiling was put on the AT at 0.7and 0.5 for the domestic and export/processing mar-kets, respectively. This ceiling was based on discussionwith wholesalers, who were concerned about damageon the leaves immediately wrapping the curd.
All aspects of the plan, including the decision tree,were programmed using Microsoft Excel 4.0 Macrolanguage
Validation of Plan. The sampling plan was validatedusing a resampling approach. An advantage of usingthis resampling approach, as opposed to empiricalequations, is that it does not assume any underlyingtheoretical distribution for the population. The pro-gram RVSP (Naranjo and Hutchison 1997) was usedto construct OC and average sample number (ASN)curves. The OC is deÞned as the probability that theplan will suggest that control is not required. Thesteepness of the OC curve can be used to describe therelative precision of the plan; the steeper the curve,the more precise the plan, as the certainty of goingfrom a no spray decision to a spray decision improves.The ASN curve depicts how many samples, on aver-
February 2004 HAMILTON ET AL.: COMPUTERIZED SAMPLING PLAN FOR Plutella xylostella 129

age, the plan would demand be collected for a par-ticular proportion of plants infested, and it gives anindication of the efÞciency of the plan. With resam-pling, the OC is more speciÞcally deÞned as the pro-portion of resampling iterations for which the propor-tion of plants infested did not exceed the lower of thetwo sequential stop lines. Similarly, the ASN repre-sents the average number of samples that would needto be collected over all the iterations to satisfy thesequential decision rule. Five hundred iterations wererun for each observation. A minimum sample size often plants was used for all validations. In South Aus-tralia, researchers encourage growers to always sam-ple at least this number of plants.
OC and ASN curves were calculated for speciÞcATs. However, the inclusion of parasitism meant thatthe plan could be based on any one of an effectivelyinÞnite number of ATs. Thus, for each crop, the planwas validated at the lowest and highest ATs it wouldrecommend, and at an intermediate AT of 0.3. Thisapproach gave an indication of the performance of theplan for a range of ATs. At present, an upper limit hasnot been set for the broccoli plan, but it is unlikely thatpractitioners would accept an AT much above 0.8, sothis was chosen as the arbitrary “maximum” AT forvalidation purposes. For the OC function, the follow-ing four-parameter sigmoid model was used to de-scribe (using SigmaPlot 4.01) the relationship of pro-portion of plants infested and the OC, as estimatedthrough resampling:
OC �a � d
1 � e�� p�c
h �� d [2]
where a and d are the asymptotic maximum and min-imum values, respectively;p is the proportion of plantsinfested; c is the value for p at the point of inßection;and b is the slope parameter. For the ASN function,several nonlinear peak type models were Þtted, butnone of them adequately described the relationshipfor any of the cultivars or ATs, and thus they are notpresented.
To illustrate the amount of error arising from thesmall sample sizes that had to be used sometimes,standard errors, based on the 500 resample iterations,were presented for each OC and ASN estimate.
As will be discussed herein, this plan includes anautomatic validation procedure based on the algo-rithms of Wald (1947). These OC and ASN functionswere calculated according to the “dummy value” pro-cedure of Fowler and Lynch (1987).
Plan Description, Validation, and Discussion. De-cision Tree. For broccoli (Fig. 1), if the ßoret hasstarted to form,orwill have formedwithin thenext 5Ð7days, then a conservative plan based on the 0.15 AT isproduced. If the ßoret has not started to form, then thesystem directs the user to a question about the desti-nation market of the crop. At this point, the conceptof the “base AT” needs to be described. Leading intoeach question there is a speciÞc AT, the base AT(denoted in parentheses in Figs. 1 and 2). This is theAT upon which the question is dependent, and itreßects the decision-tree history: a low base AT resultsfrom taking a conservative path. The base AT resultingfrom a “no” answer to the Þrst question is 0.6. Con-versely, if the crop is destined for export or processing,which are high value markets, then the subsequentbase AT remains at a relatively conservative 0.3. As-suming this path is taken, the user is then asked a seriesof questions relating to parasitism, starting with theuse of insecticides, other than biological ones, becausethe last time the plan was used. Parasitism estimateswill be based on data collected on the last samplingoccasion (see below). If the crop has been sprayedwith a chemical insecticide since then, it is likely thatthe parasitoid population itself will have been af-fected, and thus the information on the level of par-asitism from the last sampling occasion would nolonger be applicable. Therefore, if chemical insecti-cides have been used, the decision tree will ask nomore questions and a 0.3 AT plan will be generated. If,however, chemical insecticides have not been used,the program will ask the user if there is information onthe level of parasitism. If no information is available,the same conservative approach described above willbe used, i.e., a 0.3 AT plan generated. Otherwise, theuser will be asked to enter the level of parasitism. Atthis stage the program will implement the parasitismcorrection procedure described above. The decisiontree has then reached its end, and a sampling chart isproduced.
Fig. 1. Decision tree used to set the AT for broccoli plan.
130 JOURNAL OF ECONOMIC ENTOMOLOGY Vol. 97, no. 1

If the crop is destined for the domestic market, thesame decision tree structure described above applies,with the exception that the base AT for this arm of thetree is 0.6 rather 0.3.
The caulißower plan (Fig. 2) is similar to that forbroccoli, but is generally more conservative. Whereasthepresenceof larvaeorpupaeatharvest is effectivelythe only concern with broccoli crops, for caulißower,potential feeding damage to the wrapper leaves thatform around the curd needs to be considered. Tightcupping of the inner leaves which can easily be iden-tiÞed by growers, is used to deÞne the economically
important stage.Also,ATceiling thresholds, describedabove, were used.
The program is user-friendly. Once the macro isactivated with a particular keystroke, the user is ledthrough the series of questions. The user can thenview the sampling chart by selecting a sheet labeled“chart” (Fig. 3). This sheet also contains the answersto all of the questions in the decision tree, and itautomatically reports the time and date that the planwas run. The plan does not require the use of lap-topcomputers in the Þeld; once the program has been run,a hard-copy of the sampling chart can be printed.
Fig. 2. Decision tree used to set the AT for caulißower plan.
Fig. 3. Example of sampling chart output in program. In addition to the sampling chart, the information the user suppliedabout crop type, growth stage, destination market, spray history, and parasitism are presented. The AT generated is displayed,as is the time and date that the plan was created.
February 2004 HAMILTON ET AL.: COMPUTERIZED SAMPLING PLAN FOR Plutella xylostella 131

Parasitism Estimation. It would not be practical forthe user to conduct a separate survey for parasitism onthe day the plan is used. This plan relies on usingparasitism information collected during the previoussampling occasion (most likely 7 d prior). The para-sitism status of a larva can be identiÞed readily bydissection. The larva is placed on a watch glass with aslightly soapy solution, grasped at both ends with for-ceps, and pulled apart. If it is parasitized, the wasp eggor larva will be clearly visible. In-Þeld parasitism de-tection kits could also be developed for immediatedetection. The number of larvae required to obtain anestimate of parasitism of particular precision will de-pend on the proportion of larvae that are parasitizedand, in theory, a separate sequential sampling plancould be developed solely to estimate parasitism lev-els.Thiswouldclearly involve substantiallymoreworkand time and is unlikely to be adopted by industry.Nevertheless, as outlined above, levels of parasitismare often very high with low variation when Bt prod-ucts are used, and some effort should be made toincorporate them into the decision-making process.Thus, we recommend that at least 20 larvae be dis-sected to gain an estimate of parasitism.
The mean number of larvae per plant versus theproportion of plants infested relationships, used tocorrect for parasitism for broccoli (Fig. 4) and cauli-ßower (Fig. 5) crops, were strong for both crops. Thisparasitism correction procedure makes the assump-tion that parasitism is distributed randomly.
Advanced Functions. Users can choose to alter type1 (�) and type 2 (�) error rates. The probability thata plan will suggest spraying when in fact no spray isrequired (i.e., P � AT) is represented by �, and � isthe probability that no control is recommended whenit is actually needed (i.e., P � AT). Most growerswould probably consider the latter the more serious ofthe two errors, and thus the default � value used in theplan is conservative, 0.05, whereas the � value is 0.1.There may be instances, such as when market pricesare low, when a grower may be prepared to take agreater riskwithacrop, andmayconsiderusingamoreliberal � value. Similarly, if a grower is concerned
about the price of insecticides, then it may be worthconsidering using a lower � value.
The nominal upper and lower bounds around theAT can also be set by the user. These bounds deter-mine the “region of indifference” (Lynn and Mead1994). Within this arbitrary region whether or not thecrop is treated is of little importance. As this region iswidened, the plan will correspondingly demand moresamples be collected. These bounds are typically setsymmetrically about the AT and, when this is the case,the widening of this region has a similar effect on theplan as decreasing � and � simultaneously. Changingthe error rates is probably a more intuitive and mean-ingful approach to adopt because the probability ofmaking an error can be easily conceptualized. In theprogram, the default region of indifference is set at0.05 proportion of plants infested above and below theAT. This approach was used previously for a P. xylos-tella sequential binomial plan in Australia (Mo et al.2003).
Although we used a resampling approach to for-mally validate the plan (see below), an automaticvalidation functionhasalsobeen incorporated into theprogram. Algorithms were used to construct OC andASN curves (Wald 1947) speciÞc to the set parametersof the plan (i.e., AT, �, �, �1, and �2). Although thereare limitations associated with this approach, such asno consideration of a minimum sample size (Fowlerand Lynch 1987, Naranjo and Hutchison 1997), thefunction does nonetheless provide the user with animmediate validation of the plan. At its simplest, itenables the user to instantly assess the performance ofthe computer-generated sampling plan that is basedon default settings.
The user also can investigate how changing errorrates and the region of indifference affect the validityof the plan. The inclusion of parasitism into the planresults in an effectively inÞnite number of possibleATs. Using resampling to construct OC and ASNcurves for every plan that is generated is not practi-cable, but the automatic empirical validation functionrequires no input from the user other than that neededto merely run the plan. For the OC curve, the value of
Fig. 4. Relation of proportion of plants not infested (q)to mean for P. xylostella from broccoli crops. Triangles rep-resent South Australian crops, and circles, Victorian crops.
Fig. 5. Relation of proportion of plants not infested (q)to mean for P. xylostella from caulißower crops. Trianglesrepresent South Australian crops, and circles, Victoriancrops.
132 JOURNAL OF ECONOMIC ENTOMOLOGY Vol. 97, no. 1
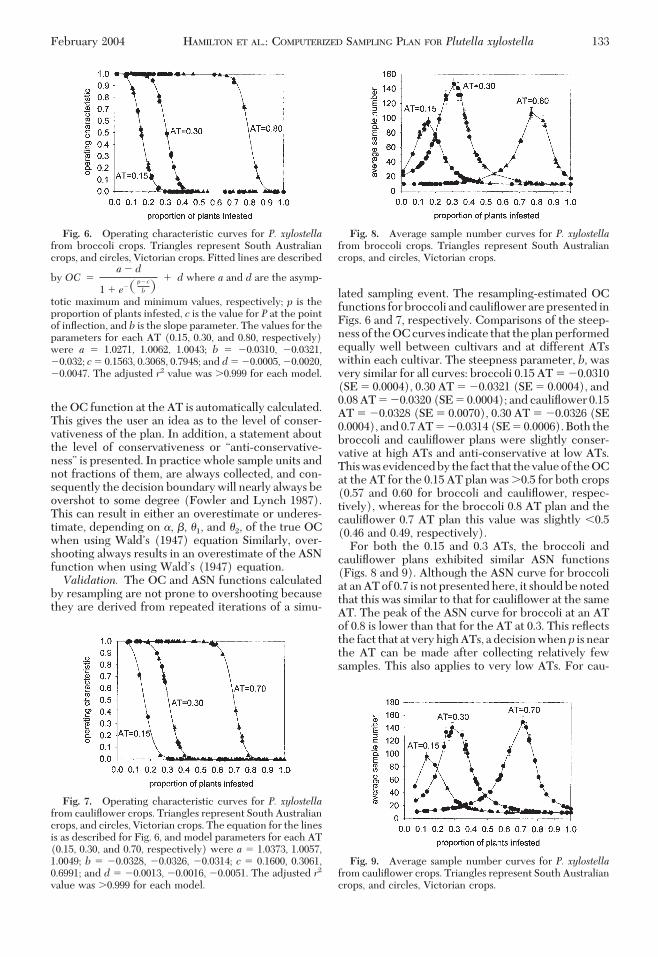
the OC function at the AT is automatically calculated.This gives the user an idea as to the level of conser-vativeness of the plan. In addition, a statement aboutthe level of conservativeness or “anti-conservative-ness” is presented. In practice whole sample units andnot fractions of them, are always collected, and con-sequently the decision boundary will nearly always beovershot to some degree (Fowler and Lynch 1987).This can result in either an overestimate or underes-timate, depending on �, �, �1, and �2, of the true OCwhen using WaldÕs (1947) equation Similarly, over-shooting always results in an overestimate of the ASNfunction when using WaldÕs (1947) equation.
Validation. The OC and ASN functions calculatedby resampling are not prone to overshooting becausethey are derived from repeated iterations of a simu-
lated sampling event. The resampling-estimated OCfunctions for broccoli and caulißower are presented inFigs. 6 and 7, respectively. Comparisons of the steep-ness of the OC curves indicate that the plan performedequally well between cultivars and at different ATswithin each cultivar. The steepness parameter, b, wasvery similar for all curves: broccoli 0.15 AT � �0.0310(SE � 0.0004), 0.30 AT � �0.0321 (SE � 0.0004), and0.08 AT � �0.0320 (SE � 0.0004); and caulißower 0.15AT � �0.0328 (SE � 0.0070), 0.30 AT � �0.0326 (SE0.0004), and 0.7 AT � �0.0314 (SE � 0.0006). Both thebroccoli and caulißower plans were slightly conser-vative at high ATs and anti-conservative at low ATs.Thiswasevidencedby the fact that thevalueof theOCat the AT for the 0.15 AT plan was �0.5 for both crops(0.57 and 0.60 for broccoli and caulißower, respec-tively), whereas for the broccoli 0.8 AT plan and thecaulißower 0.7 AT plan this value was slightly �0.5(0.46 and 0.49, respectively).
For both the 0.15 and 0.3 ATs, the broccoli andcaulißower plans exhibited similar ASN functions(Figs. 8 and 9). Although the ASN curve for broccoliat an AT of 0.7 is not presented here, it should be notedthat this was similar to that for caulißower at the sameAT. The peak of the ASN curve for broccoli at an ATof 0.8 is lower than that for the AT at 0.3. This reßectsthe fact that at very high ATs, a decision whenp is nearthe AT can be made after collecting relatively fewsamples. This also applies to very low ATs. For cau-
Fig. 6. Operating characteristic curves for P. xylostellafrom broccoli crops. Triangles represent South Australiancrops, and circles, Victorian crops. Fitted lines are described
by OC �a � d
1 � e�� p�c
b �� d where a and d are the asymp-
totic maximum and minimum values, respectively; p is theproportion of plants infested, c is the value for P at the pointof inßection, and b is the slope parameter. The values for theparameters for each AT (0.15, 0.30, and 0.80, respectively)were a � 1.0271, 1.0062, 1.0043; b � �0.0310, �0.0321,�0.032; c � 0.1563, 0.3068, 0.7948; and d � �0.0005, �0.0020,�0.0047. The adjusted r2 value was �0.999 for each model.
Fig. 7. Operating characteristic curves for P. xylostellafrom caulißower crops. Triangles represent South Australiancrops, and circles, Victorian crops. The equation for the linesis as described for Fig. 6, and model parameters for each AT(0.15, 0.30, and 0.70, respectively) were a � 1.0373, 1.0057,1.0049; b � �0.0328, �0.0326, �0.0314; c � 0.1600, 0.3061,0.6991; and d � �0.0013, �0.0016, �0.0051. The adjusted r2
value was �0.999 for each model.
Fig. 8. Average sample number curves for P. xylostellafrom broccoli crops. Triangles represent South Australiancrops, and circles, Victorian crops.
Fig. 9. Average sample number curves for P. xylostellafrom caulißower crops. Triangles represent South Australiancrops, and circles, Victorian crops.
February 2004 HAMILTON ET AL.: COMPUTERIZED SAMPLING PLAN FOR Plutella xylostella 133

lißower, ASNs were not estimated for ATs higher than0.7 because the plan did not permit higher ATs.
In conclusion, the sampling plan presented incor-porates important factors such as crop growth stage,destination market, and parasitism, which have beenomitted from earlier plans. The efÞcacy associatedwith the various insecticide groups is another factorthat could be considered when setting an AT, and thisneeds to be investigated further. The program is runthrough a series of simple steps, but testing of its easeof use needs to be conducted on real users. The ßex-ibility andnonprescriptivenatureof theplan is amajoradvantage for practitioners and should facilitate itsup-take. The plan has the advantage of being runthrough Excel, a widely used and familiar computerprogram.ManyAustraliangrowersusecomputers to runtheir operations and often use computer-literate con-sultants to monitor their crops for pests. A survey ofVictorian Brassica vegetable growers found that 19 of 21growers surveyedusedconsultants forpestmanagementissues, although the national average is around 57%(A.J.H., Endersby, N.E. and Baker, G., unpublisheddata).Thisdynamiccomputerplanshouldproveausefultool for some growers and many crop consultants. It iscurrently being tested on several properties in SouthAustralia, Western Australia, and Tasmania.
Acknowledgments
We thank Steve Naranjo for helpful advice on samplingplan validation. We also thank Greg Baker and Mike Kellerfor comments on the decision-tree, and Fiona Thompson andNam Ky Nguyen for general discussion of the plan.
References Cited
Baker, G. J., and J. Kovaliski. 1999. Detection of insecticideresistance in Plutella xylostella (L.) (Lepidoptera: Plute-llidae) populations in South Australian crucifer crops.Aust. J. Entomol. 38: 132Ð134.
Beck, N. G., and P. J. Cameron. 1990. Developing an actionthreshold for lepidopterous pests of cabbage. Proc. N.Z.Weed Pest Control Conf. 43: 26Ð30.
Bohonak, A. J. 2002. RMA: software for reduced major axisregression. http://www.bio.sdsu.edu/pub/andy/rma.html.
Doran,A. P.,M.K. Sears, and J.G. Stewart. 1995. Evaluationof a binomial model for insecticide application to controllepidopterous pests in cabbage. J. Econ. Entomol. 88:302Ð306.
Eastman, C., S. Mahr, J. Wyman, C. Hoy, and H. Oloumi-Sadeghi. 1995. Cabbage, broccoli, and caulißower, pp.99Ð100. In R. Foresterand and B. Flood [eds.], Vegetableinsect management with emphasis on the Midwest. Meis-ter Publishing Co., Willoughby, OH.
Fowler, G. W., and A. M. Lynch. 1987. Sampling plans ininsectpestmanagementbasedonWaldÕs sequential prob-ability ratio test. Environ. Entomol. 16: 345Ð354.
Gerrard, D. J., and H. C. Chiang. 1970. Density estimationof corn rootworm egg populations based upon frequencyof occurrence. Ecology 51: 235Ð245.
Goodwin, S. 1979. Changes in numbers of the parasitoidcomplex associated with the diamond-back moth,Plutella
xylostella (L.) (Lepidoptera), in Victoria. Aust. J. Zool.27: 981Ð989.
Hamilton, J. T. 1979. Seasonal abundance of Pieris rapae(L.), Plutella xylostella (L.) and their diseases and para-sites. Gen. Appl. Entomol. 2: 59Ð66.
Hines, R. L., and W. D. Hutchison. 2001. Evaluation of ac-tion thresholds and spinosad for lepidopteran pest man-agement in Minnesota cabbage. J. Econ. Entomol. 94:190Ð196.
Hoy, C. W., C. Jennison, A. M. Shelton, and J. T. Andaloro.1983. Variable intensity sampling: a new technique fordecision making in cabbage pest management. J. Econ.Entomol. 76: 139Ð143.
Hoy, C. W., Shelton, A. M., and J. T. Andaloro. 1986. Actionthresholds for processing Cabbage, a short-term solution toa long-term problem. Agric. Ecosyst. Environ. 16: 45Ð54.
Hutchison, W. D., E. C. Burkness, G. Pahl, and T. M. Hurley.2003. Integrating novel technologies for cabbage IPM inthe USA: value of on-farm research. In Proceedings of the4th International Workshop on the Management of Di-amondback Moth and other Crucifer Pests, 26Ð15 No-vember 2001, Melbourne, Australia. Department ofNatural Resources and Environment, Melbourne, Aus-tralia.
Kirby, R. D., and J. E. Slosser. 1981. A sequential samplingplan for three lepidopterous pests of Cabbage. Southwest.Entomol. 6: 195Ð200.
Lynn, J., and A. Mead. 1994. Use of the Wald sequentialprobability ratio test (SPRT) in supervised pest control.Aspects Appl. Biol. 37: 15Ð24.
Maltais, P. M., J. R. Nuckle, and P. V. Leblank. 1998. Eco-nomic threshold for three lepidopterous larval pests offresh-market cabbage in south-eastern New Brunswick. J.Econ. Entomol. 91: 699Ð707.
Mo, J., G. Baker, and M. Keller. 2003. Evaluation of sequen-tial binomial sampling plans for decision-making in themanagement of diamondback moth (Plutella xylostella)(Plutellidae: Lepidoptera). In Proceedings of the 4th In-ternational Workshop on the Management of Diamond-back Moth and other Crucifer Pests, 15Ð26 NovemberMelbourne, Australia. Department of Natural Resourcesand Environment, Melbourne, Australia.
Nachman, G. 1981. A mathematical model of the functionalrelationship between density and spatial distribution of apopulation. J. Anim. Ecol. 50: 453Ð460.
Naranjo, S. E., and W. D. Hutchison. 1997. Validation ofarthropod sampling plans using a resampling approach:software and analysis. Am. Entomol. 43: 48Ð57.
Shelton, A. M., and J. T. Andaloro. 1982. Effect of lepidopt-erous larval populations on processed cabbage grades. J.Econ. Entomol. 75: 141Ð143.
Shelton, A. M., J. T. Andaloro, and J. Barnard. 1982. Effectsof cabbage looper, imported cabbageworm, and dia-mondback moth on fresh market and processing cabbage.J. Econ. Entomol. 75: 742Ð745.
Shelton, A. M., J. Theunissen, and C. W. Hoy. 1994. EfÞ-ciency of variable-intensity and sequential sampling forinsect control decisions in cole crops in The Netherlands.Entomol. Exp. Appl. 70: 209Ð215.
Talekar,N. S., andA.M. Shelton. 1993. Biology, ecology andmanagement of diamondback moth. Annu. Rev. Entomol.38: 275Ð301.
Torres, A. N., and C. W. Hoy. 2002. Sampling scheme forcarrot weevil (Coleoptera: Curculionidae) in parsley. J.Econ. Entomol. 31: 1251Ð1258.
Wald, A. 1947. Sequential analysis. Wiley, Dover, NY.
134 JOURNAL OF ECONOMIC ENTOMOLOGY Vol. 97, no. 1

Walgenbach, J. F., and J. A. Wyman. 1984. Dynamic actionthreshold levels for the potato leafhopper (Homoptera:Cicadellidae)onpotatoes inWisconsin. J.Econ.Entomol.77: 1335Ð1340.
Zhao, J.-Z.., Y.-X. Li, H. L. Collins, L. Gusukuma-Minuto,R.F.L. Mau, G. D. Thompson, and A. M. Shelton. 2002.
Monitoring and characterization of diamondback moth(Lepidoptera:Plutellidae) resistance to spinosad. J.Econ.Entomol. 95: 430Ð436.
Received for publication 23 June 2003; accepted 5 September2003.
Appendix
Table 1. Proportion of P. xylostella larvae parasitised (n � 75–100 for each estimate) on a broccoli crop and a cauliflower crop inSouth Australia in 2003
Broccoli Caulißower
0.03 AT 0.60 AT No spray 0.30 AT 0.60 AT No spray
29 Oct 0.81 0.41 0.64 2 Nov 0.60 0.62 0.586 Nov 0.81 0.87 0.79 12 Nov 0.63 0.40 0.53
12 Nov 0.97 0.82 0.86 21 Nov 0.50 0.73 0.6721 Nov 0.70 0.86 0.90 5 Dec 0.80 0.77 0.815 Dec 0.00 0.66 0.88 14 Dec 0.70 0.75 0.50
12 Dec 1.00 0.00 1.00 20 Dec 1.00 0.90 0.6620 Dec 1.00 1.00 0.88
These data are from a trial where two different ATs, and a no spray option, were employed.
Table 2. Proportion of P. xylostella larvae parasitised (n � 75–100 for each estimate) at two South Australian properties that employedtheir own management strategies in 2003
Broccoli Caulißower
Property A Property B Property A Property B
6 Feb 0.90 14 Feb 0.90 30 Jan 0.60 14 Feb 0.7012 Feb 0.90 20 Feb 0.80 6 Feb 0.60 20 Feb 0.6019 Feb 0.90 26 Feb 0.85 12 Feb 0.75 26 Feb 0.7526 Feb 0.80 5 Mar 0.75 19 Feb 0.60 5 Mar 0.505 Mar 0.85 12 Mar 0.85 26 Feb 0.75 12 Mar 0.70
19 Mar 0.85 5 Mar 0.75 19 Mar 0.7026 Mar 0.90 26 Mar 0.75
Because these data were collected and collated as part of a grower program, they have been rounded to the nearest 0.05.
February 2004 HAMILTON ET AL.: COMPUTERIZED SAMPLING PLAN FOR Plutella xylostella 135

123
APPENDIX B DBM Scouting Project – Mary Cannard, University of Western Sydney (Ph: 0403 680954, Email: [email protected]), Richmond, NSW. Crop: Cauliflower var. Charlotte Planting Date: Late February Site Description: Sandy/loam alluvial soil situated on the banks of the Hawkesbury River. This area has a long history of vegetable production. The growing area is bordered on one side by a stand of citrus trees. Initial Visit: Grower advised the crop had been in the ground for two weeks and two application of Avatar® (at the recommended rate) had been applied. The cauliflower bay was divided into two halves, with one half being monitored by me using Dynamic Plan D and the other half to be monitored by Elders Agricultural. Plants were at the 6-8 leaf stage. Dynamic Plan D Scouting: Week 1 – 10 March 2003 - 1st scouting, so no information re parasitism. Scouting summary: 20 % plants (ie. 9/45) infested, Nil parasitism, therefore the recommended action was do not spray. DBM eggs were present in moderate numbers . Small numbers of aphids were present on the lower leaves of most checked plants. Small numbers of coccinellid adults and larvae were also present. Week 2 – 18 March 2003 Scouting summary: 80% plants (ie. 20/25) infested, 32 % parasitism rate, therefore the recommended action was to spray with Bt. Bt (Dipel® supplied by Elders) was applied twice, five days apart at the recommended rate. A few cabbage loopers were present on three plants. Week 3 – 26 March 2003 Scouting summary: 78% plants (ie. 33/42) infested, 46% parasitism rate, therefore the recommended action was to spray. After discussions with grower re the poor kill attributed to Dipel, it was decided to use methomyl (Lannate® ) as he didn’t have Proclaim® or Avatar® on hand and had already used the latter product twice in the season. We discussed using Regent® but the grower was very unhappy with the kill from chemical last time he used it. We therefore purchased Avatar® and Proclaim® for the grower to use for the rest of the season. Week 4 – 2 April 2003 Scouting summary: 37% plants (ie 17/45) infested, 25 % parasitism rate, reached 45 plants, therefore, the recommended action was do not spray. DBM eggs present in moderate numbers. Low numbers of aphids present on the lower leaves of some plants checked as well as some cabbage looper present on a few plants.

124
Week 5 – 9 April 2003 78% plants (ie. 28/36) infested, 37% parasitism rate, therefore, the recommended action was to spray with Proclaim® at the recommended rate. A few aphids were present on lower leaves of plants checked as well as some cabbage looper present. Week 6 – 15 April 2003 Scouting summary: 20% plants (ie. 9/45) infested, 31% parasitism rate, reached 45 plants, therefore, the recommended action was do not spray. Heads were just starting to show, with the average diameter 4 – 5 cm. Week 7 – 23 April 2003 Scouting summary: 17% plants (ie. 8/45) infested, 33% parasitism rate, reached 45 plants, therefore, the recommended action was do not spray. Aphids were present in low numbers on the lower leaves. Week 8 – 30 April 2003 Scouting summary: 20% plants (ie. 9/45) infested, 39% parasitism rate, reached 45 plants, therefore, the recommended action was do not spray. Week 9 – 1st week in May – Harvest Leaking irrigation at the lower end of the field lead to a high incidence of black rot, Xanthomonas campestris. Elders recommended application of copper spray, but despite this, approximately one third of the crop was lost to this disease. I did not harvest any of the crop, The grower had completed harvested (there were two harvests one week apart) by the time you had got back in contact with me after your return from overseas. He estimates that approximately 5% of the heads were rejected, primarily because of malformation. Insect damage to heads was minimal and a high market price was obtained for the first harvest . The price was lower for the second harvest due to increased numbers of cauliflowers in the markets at the time. These results were similar to that obtained in the Elders-monitored block (see below) There were a total number of 6 spray applications. The first two, Avatar®, were applied prior to commencement of scouting. Sprays applied during the scouting period were Dipel® (2), Lannate® (1) and Proclaim® (1). Elders Scouting Plan: Yellow sticky traps were placed throughout the crop, these were monitored by Elders and spray decisions were made from the number of adults present on the sticky traps. Eight sprays were applied throughout the growing season, weekly for the first eight weeks. No sprays were applied after that time. Weeks 1,2,5 and 7 – Avatar®

125
Weeks 3 and 6 – Lanate® Weeks 4 and 8 – Proclaim® The grower advised that there was no difference in the quantity or quality of the heads harvested from either my side of the bay or the Elders side of the bay. However I am unable to quantify this for you. Boron was applied twice during the season, initially at the 6-8 leaf stage and then at the head-forming stage. Feedback from Grower Feedback from the grower, suggests he was happy with the outcomes of this project. Fewer sprays were applied using Dynamic Plan D than using the Elders monitoring system. He is willing participate in any future trials of other trials. They will be planting cabbages in two weeks time and brassica plantings are usually undertaken throughout the season. My Feedback I felt confident using Dynamic Plan D for scouting. I have undertaken quite a lot of scouting in various crops, and this is by far the easiest and simplest method I have used to date. I felt very confident in making recommendations to spray or not to spray, as I had the plan in front of me backing up my decision.

126
APPENDIX C
BIOASSAY RESULTS 1999/2000 FOR NATIONAL INSECTICIDE RESISTANCE TESTING PROGRAM
Nancy M. Endersby, Peter M. Ridland, Jingye Zhang Institute for Horticultural Development, Knoxfield, Private Bag 15, Scoresby Business Centre VIC 3176 BACKGROUND The major pest of Brassica vegetables in Australia is diamondback moth (DBM), Plutella xylostella (L.). This pest has developed insecticide resistance due to prophylactic use of insecticides over many years. Insecticide resistance has caused control failures and economic loss in vegetable crops. Resistance to synthetic pyrethroid insecticides has been identified in DBM populations from vegetable growing areas in all states and resistance to organophosphate insecticides has been identified in some states. Earliest resistance testing of DBM in Australia was conducted by Hargreaves (1996), followed by Baker and Kovaliski (1999) and Endersby and Ridland (1997). In 1997, a project funded by the Horticultural Research and Development Corporation “Advancing the integrated management of DBM in crucifer vegetables” was established with additional funding from major agrochemical companies. Also in 1997, AIRAC, in consultation with researchers, devised a two-window insecticide resistance management strategy for DBM. By late 1998, chlorfenapyr and fipronil had both been registered for control of DBM and so the two-window strategy was launched to growers around Australia. The strategy is reviewed regularly and is updated as new products become registered. Four products are currently partitioned into the two-window strategy. In southern Australia, Secure® (chlorfenapyr) and Success® (spinosad) may be used from 1st September to 31st January, whereas Regent® and Proclaim® may be used from 1st February to 31st August. The national resistance monitoring program was established in 1999. The program involves testing of field populations of DBM from each major Brassica producing state with a variety of new and long-established insecticides. The data collected will provide valuable insights to all facets of the industry on the progress of the resistance management strategy. This is the first report of the program and gives details of results from 1999/2000. METHODS Larvae of diamondback moth were collected from Brassica crops in New South Wales, South Australia, Tasmania, Western Australia and Victoria (Table 1) and were reared on cabbage seedling leaves (Brassica oleracea var. capitata cv. Green Coronet) in the laboratory at 25 °C (16h:8h, L:D) for one to three generations. A susceptible laboratory population of diamondback moth, maintained at IHD Knoxfield since it was obtained from the University of Adelaide, Department of Crop Protection Waite Campus, SA, in 1994, was used as a reference. Table 1. Origin and generation of Australian diamondback moth populations tested for susceptibility to insecticides, 1999/2000
Population Origin Generation tested Waite Laboratory population * Manjimup WA Cauliflower crop F1 – F3 Nairne SA Brussels sprouts crop F1 – F3 Werribee South VIC Broccoli crop F1 – F2 Woolnorth TAS Forage Brassica crop F1 – F2 Castlereagh NSW Savoy cabbage crop F1 – F5

127
Grantham QLD Cabbage crop F1 – F3 Glenore Grove QLD Cabbage crop F1
A leaf dip bioassay after Tabashnik and Cushing (1987) was adopted for testing susceptibility to each insecticide. Variations in method for some insecticides were determined by company preferences or were those used in previous monitoring programs for the particular insecticide. For example, fipronil was tested worldwide at 22ºC and indoxacarb was tested at 25ºC. The remaining insecticides were all tested at 28ºC (Table 2). Cabbage leaf discs of 4.5 cm diameter were dipped for 5 s in distilled water solutions of formulated insecticide and hung vertically to dry in a fume hood for 2 h. Control discs were dipped in distilled water. No wetting agents were used except for Bond Spraymate with emamectin benzoate and X-77 with indoxacarb. Discs were placed into Gelman 50 mm diameter x 9 mm plastic Petri dishes. For fipronil, five third instar diamondback moth larvae were placed on each disc and eight replicates of each concentration were set up. For each of the other insecticides, ten larvae were placed on each disc and four replicates of each concentration were set up. Mortality was assessed at different times for different insecticides (Table 2). Larvae were considered dead if they did not move when touched with a paintbrush. Table 2. Insecticides tested, assessment times and temperatures used in bioassays of diamondback
moth, Plutella xylostella from Australia, 1999/2000
Insecticide Product name Assessment times Temperature alpha-cypermethrin Fastac 48 h 28ºC Bacillus thuringiensis Delfin WG 72 h, 96 h 28ºC chlorfenapyr Secure 48 h, 72 h 28ºC emamectin benzoate Proclaim 48 h, 72 h 28ºC fipronil Regent 48 h, 72 h 22ºC indoxacarb Avatar 48 h, 72 h 25ºC methamidophos Nitofol 48 h 28ºC novaluron Rim On 48 h, 72 h 28ºC permethrin Ambush 48 h 28ºC spinosad Success 72 h 28ºC
Analysis Concentration-mortality data for each population were analysed using the probit analysis program, POLO-PC (Russell et al. 1977) (LeOra Software). We used the program to estimate the lethal concentration expected to cause 50% mortality (LC50) of each insecticide for each diamondback moth population and the 95% confidence intervals for these concentrations. The slope (+ standard error) of the probit line was also estimated. The program also performed χ2 tests for goodness-of-fit of the data to the probit model. If the model fits, the calculated value of χ2 is less than the χ2 table value for the appropriate degrees of freedom. If the model does not fit (i.e. the χ2 value exceeds the table value), the LC50 value for the particular population may not be reliably estimated and is adjusted with the heterogeneity factor (χ2/df). The index of significance for potency estimation (g) was used to calculate 95% confidence intervals for potency (relative potency is equivalent to tolerance ratio) (Robertson and Preisler 1992, p.29). Parallelism of the probit regression lines implies a constant relative potency at all levels of response (Finney 1971). Equality and parallelism of the slopes of the probit lines for the field population and the laboratory susceptible population were also tested for by POLO-PC. If the slopes are parallel, then overlap of the 95% confidence intervals for the two populations indicates that no significant difference exists between the LC50 values. RESULTS A summary of the results comparing the levels of tolerance to the test insecticides for the populations tested for 1999/2000 is presented in Table 3. The summary is based on comprehensive listings of tolerance ratios for the ten insecticides tested on diamondback moth populations from WA, SA, VIC,
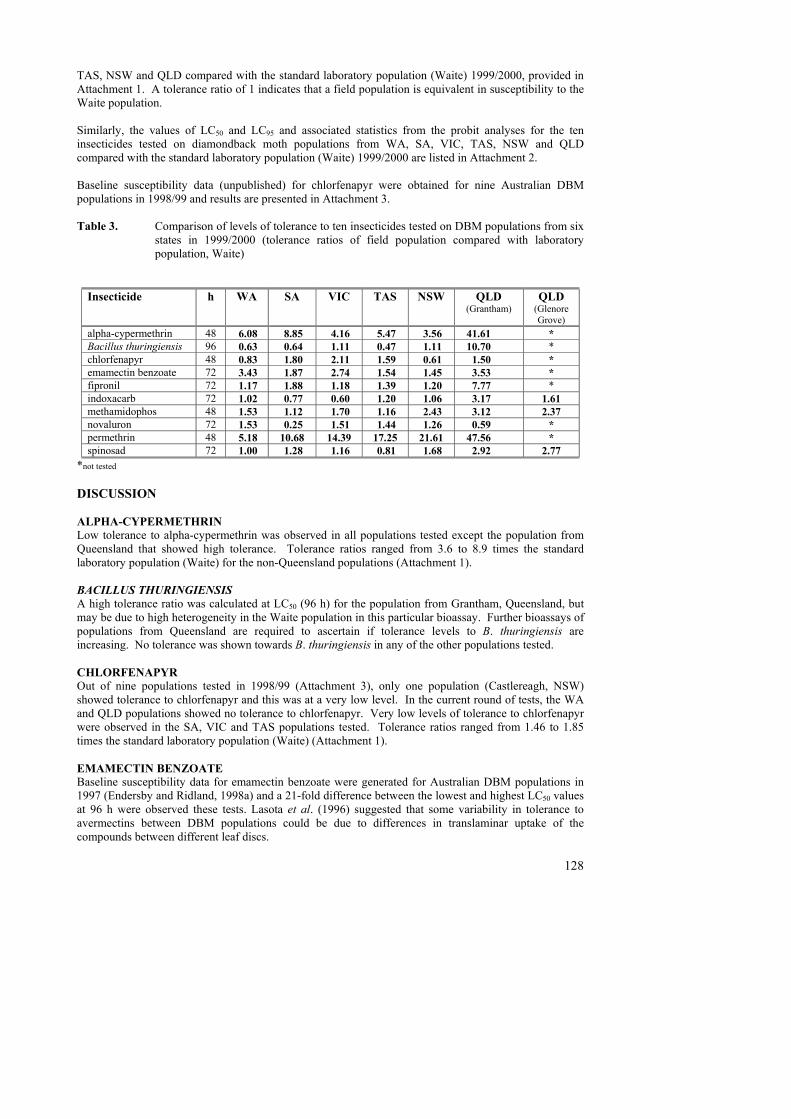
128
TAS, NSW and QLD compared with the standard laboratory population (Waite) 1999/2000, provided in Attachment 1. A tolerance ratio of 1 indicates that a field population is equivalent in susceptibility to the Waite population. Similarly, the values of LC50 and LC95 and associated statistics from the probit analyses for the ten insecticides tested on diamondback moth populations from WA, SA, VIC, TAS, NSW and QLD compared with the standard laboratory population (Waite) 1999/2000 are listed in Attachment 2. Baseline susceptibility data (unpublished) for chlorfenapyr were obtained for nine Australian DBM populations in 1998/99 and results are presented in Attachment 3. Table 3. Comparison of levels of tolerance to ten insecticides tested on DBM populations from six
states in 1999/2000 (tolerance ratios of field population compared with laboratory population, Waite)
Insecticide h WA SA VIC TAS NSW QLD (Grantham)
QLD (Glenore Grove)
alpha-cypermethrin 48 6.08 8.85 4.16 5.47 3.56 41.61 * Bacillus thuringiensis 96 0.63 0.64 1.11 0.47 1.11 10.70 * chlorfenapyr 48 0.83 1.80 2.11 1.59 0.61 1.50 * emamectin benzoate 72 3.43 1.87 2.74 1.54 1.45 3.53 * fipronil 72 1.17 1.88 1.18 1.39 1.20 7.77 * indoxacarb 72 1.02 0.77 0.60 1.20 1.06 3.17 1.61 methamidophos 48 1.53 1.12 1.70 1.16 2.43 3.12 2.37 novaluron 72 1.53 0.25 1.51 1.44 1.26 0.59 * permethrin 48 5.18 10.68 14.39 17.25 21.61 47.56 * spinosad 72 1.00 1.28 1.16 0.81 1.68 2.92 2.77
*not tested DISCUSSION ALPHA-CYPERMETHRIN Low tolerance to alpha-cypermethrin was observed in all populations tested except the population from Queensland that showed high tolerance. Tolerance ratios ranged from 3.6 to 8.9 times the standard laboratory population (Waite) for the non-Queensland populations (Attachment 1). BACILLUS THURINGIENSIS A high tolerance ratio was calculated at LC50 (96 h) for the population from Grantham, Queensland, but may be due to high heterogeneity in the Waite population in this particular bioassay. Further bioassays of populations from Queensland are required to ascertain if tolerance levels to B. thuringiensis are increasing. No tolerance was shown towards B. thuringiensis in any of the other populations tested. CHLORFENAPYR Out of nine populations tested in 1998/99 (Attachment 3), only one population (Castlereagh, NSW) showed tolerance to chlorfenapyr and this was at a very low level. In the current round of tests, the WA and QLD populations showed no tolerance to chlorfenapyr. Very low levels of tolerance to chlorfenapyr were observed in the SA, VIC and TAS populations tested. Tolerance ratios ranged from 1.46 to 1.85 times the standard laboratory population (Waite) (Attachment 1). EMAMECTIN BENZOATE Baseline susceptibility data for emamectin benzoate were generated for Australian DBM populations in 1997 (Endersby and Ridland, 1998a) and a 21-fold difference between the lowest and highest LC50 values at 96 h were observed these tests. Lasota et al. (1996) suggested that some variability in tolerance to avermectins between DBM populations could be due to differences in translaminar uptake of the compounds between different leaf discs.

129
In the current round of bioassays, the NSW population showed no tolerance to emamectin benzoate. The NSW population tested in 1997 (Endersby and Ridland, 1998a) showed a low level of tolerance [72 h ratio of 2.38 (1.33 – 4.63)]. The QLD, WA and VIC populations showed low tolerance to the insecticide in the current round of tests. The WA tolerance ratio in 1997 (72 h) was 6.05 (3.09 – 12.94) compared with the 1999/00 ratio of 3.43 (2.31 – 5.35). The VIC tolerance ratio in 1997 (72 h) was 1.62 (0.90 – 2.92) compared with 2.74 (1.96 – 3.85) in the current round of tests. SA and TAS populations showed a very low level of tolerance to this compound. SA had one susceptible and one tolerant population in 1997 (#1 1.59 [0.86 – 2.97], #2 13.27 [5.20 – 69.37]). The TAS 1997 72 h ratio was1.57 (0.82 – 3.13) compared with 1.54 (1.17 – 2.03) in 1999/00. FIPRONIL WA, VIC and TAS populations showed no tolerance to this insecticide. The SA population showed very low tolerance to fipronil. The SA 72 h tolerance ratio of 1.88 (1.37 – 2.58) fits within the 95% confidence intervals of SA populations tested in 1996/97 [2.83 (1.85 – 4.39), 1.40 (0.89 – 2.11)], (Endersby and Ridland, 1998b) and in 1998/99 [1.4 (1.0 – 2.0)] (Endersby et al. 2000). The QLD population showed low tolerance to fipronil in the current round of tests. INDOXACARB No tolerance was shown towards indoxacarb in the populations tested. METHAMIDOPHOS SA and TAS populations showed no tolerance to methamidophos. NSW, WA and VIC populations showed very low levels of tolerance to this organophosphate. Tolerance ratios ranged from 1.53 to 2.43 times the standard laboratory population (Waite) (Attachment 1). NOVALURON No tolerance was shown towards novaluron in the populations tested. PERMETHRIN Highest levels of tolerance to permethrin were found in the NSW population. At this observed level of tolerance of permethrin, field control failures are often observed. At the upper 95% confidence intervals of the SA and VIC ratios, control failures could also be possible. The WA population showed a lower level of tolerance to permethrin than that of SA and VIC. SPINOSAD Baseline susceptibility data collected in 1997 (Endersby and Ridland 1998c) showed low levels of tolerance in a population from Tasmania and one from Western Australia. No tolerance was detected towards spinosad in any of the populations tested in the current study.

130
REFERENCES Baker, G.J. and Kovaliski, J. (1999). Detection of insecticide resistance in Plutella xylostella (L.)
(Lepidoptera: Plutellidae) populations in South Australian crucifer crops. Australian Journal of Entomology 38: 132 – 134.
Endersby, N.M. and Ridland, P.M. (1997). Insecticide resistance in diamondback moth, Plutella
xylostella (L.), in southern Australia. In: (eds. A. Sivapragasam, W.H. Loke, AK Hussan & G.S. Lim) The management of diamondback moth and other crucifer pests. Proceedings of the Third International Workshop, Kuala Lumpur, Malaysia, pp. 290 – 294.
Endersby, N.M. and Ridland, P.M. (1998a). Survey of baseline levels of susceptibility to emamectin
benzoate in Australian populations of Plutella xylostella (L.). Report to Novartis Crop Protection Australasia Limited, 27 pp.
Endersby, N.M. and Ridland, P.M. (1998b). Survey of baseline levels of susceptibility to fipronil in
Australian populations of Plutella xylostella (L.). Report to Rhône-Poulenc Rural Australia Pty Ltd, 41 pp.
Endersby, N.M. and Ridland, P.M. (1998c). Survey of baseline levels of susceptibility to spinosad in
Australian populations of Plutella xylostella (L.). Report to DowAgroSciences, 29 pp. Endersby, N.M., Ridland, P.M. and Zhang, J. (2000). Assessment of susceptibility to fipronil and
endosulfan in Australian populations of diamondback moth, Plutella xylostella (L.) 1998/99. Report to Aventis CropScience, 18 pp.
Finney, D.J. (1971). Probit analysis. 3rd edition, Cambridge University Press, Great Britain. Hargreaves, J.R. (1996). Insecticide resistance and insecticide resistance management strategies for three
vegetable pests in south east Queensland. Horticultural Research and Development Corporation, Project report reference v/0021/r1.
Lasota, J.A., Shelton, A.M., Bolognese, J.A. and Dybas, R.A. (1996). Toxicity of avermectins to
diamondback moth (Lepidoptera: Plutellidae) populations: Implications for susceptibility monitoring. Journal of Economic Entomology 89, 33-38.
Robertson, J.L. and Preisler, H.K. (1992). Pesticide bioassays with arthropods. CRC Press, Inc., Boca
Raton, Florida, USA. Russell, R.M., Robertson, J.L. and Savin, N.E. (1977). POLO: a new computer program for probit
analysis. Bulletin of the Entomological Society of America 23: 209-213. Tabashnik, B.E. and Cushing, N.L. (1987). Leaf residue vs. topical bioassays for assessing insecticide
resistance in the diamondback moth, Plutella xylostella L. FAO Plant Protection Bulletin 35: 11-14.
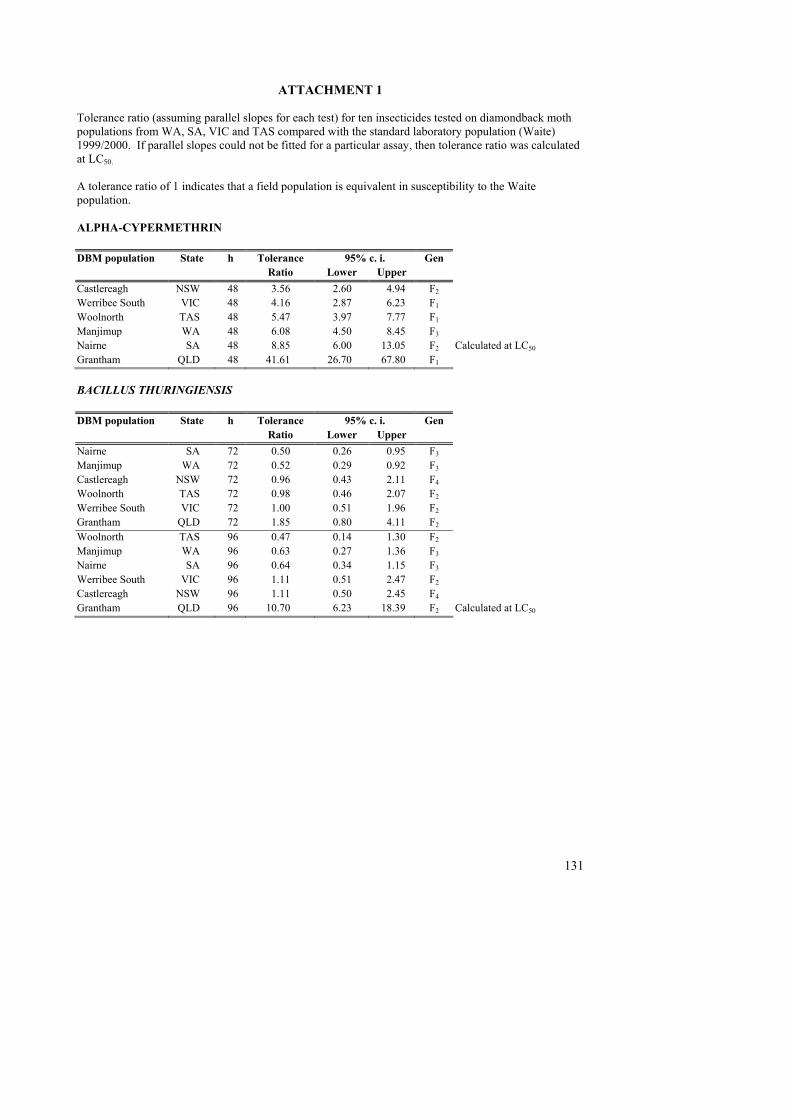
131
ATTACHMENT 1
Tolerance ratio (assuming parallel slopes for each test) for ten insecticides tested on diamondback moth populations from WA, SA, VIC and TAS compared with the standard laboratory population (Waite) 1999/2000. If parallel slopes could not be fitted for a particular assay, then tolerance ratio was calculated at LC50. A tolerance ratio of 1 indicates that a field population is equivalent in susceptibility to the Waite population. ALPHA-CYPERMETHRIN DBM population State h Tolerance 95% c. i. Gen Ratio Lower Upper Castlereagh NSW 48 3.56 2.60 4.94 F2 Werribee South VIC 48 4.16 2.87 6.23 F1 Woolnorth TAS 48 5.47 3.97 7.77 F1 Manjimup WA 48 6.08 4.50 8.45 F3 Nairne SA 48 8.85 6.00 13.05 F2 Calculated at LC50 Grantham QLD 48 41.61 26.70 67.80 F1 BACILLUS THURINGIENSIS DBM population State h Tolerance 95% c. i. Gen Ratio Lower Upper Nairne SA 72 0.50 0.26 0.95 F3 Manjimup WA 72 0.52 0.29 0.92 F3 Castlereagh NSW 72 0.96 0.43 2.11 F4 Woolnorth TAS 72 0.98 0.46 2.07 F2 Werribee South VIC 72 1.00 0.51 1.96 F2 Grantham QLD 72 1.85 0.80 4.11 F2 Woolnorth TAS 96 0.47 0.14 1.30 F2 Manjimup WA 96 0.63 0.27 1.36 F3 Nairne SA 96 0.64 0.34 1.15 F3 Werribee South VIC 96 1.11 0.51 2.47 F2 Castlereagh NSW 96 1.11 0.50 2.45 F4 Grantham QLD 96 10.70 6.23 18.39 F2 Calculated at LC50

132
ATTACHMENT 1 (continued) CHLORFENAPYR DBM population State h Tolerance 95% c. i. Gen Ratio Lower Upper Castlereagh NSW 48 0.61 0.40 0.92 F2 Manjimup WA 48 0.83 0.60 1.16 F2 Grantham QLD 48 1.50 1.05 2.14 F2 Calculated at LC50 Woolnorth TAS 48 1.59 1.20 2.11 F1 Nairne SA 48 1.80 1.27 2.60 F2 Werribee South VIC 48 2.11 1.49 3.02 F1 Castlereagh NSW 72 0.37 0.22 0.64 F2 Calculated at LC50 Grantham QLD 72 1.41 0.88 2.29 F2 Calculated at LC50 Nairne SA 72 1.46 1.01 2.12 F2 Calculated at LC50 Woolnorth TAS 72 1.59 1.16 2.20 F1 Werribee South VIC 72 1.85 1.23 2.89 F1
EMAMECTIN BENZOATE DBM population State h Tolerance 95% c. i. Gen Ratio Lower Upper Woolnorth TAS 48 1.39 0.85 2.30 F2 Castlereagh NSW 48 1.48 1.06 2.08 F2 Nairne SA 48 2.02 1.33 3.05 F3 Grantham QLD 48 2.68 1.63 4.70 F2 Manjimup WA 48 3.01 1.92 4.94 F3 Werribee South VIC 48 3.51 2.15 6.16 F2 Castlereagh NSW 72 1.45 0.88 2.44 F2 Woolnorth TAS 72 1.54 1.17 2.03 F2 Nairne SA 72 1.87 1.42 2.46 F3 Werribee South VIC 72 2.74 1.96 3.85 F2 Calculated at LC50 Manjimup WA 72 3.43 2.31 5.35 F3 Grantham QLD 72 3.53 2.33 5.16 F2 FIPRONIL DBM population State h Tolerance 95% c. i. Gen Ratio Lower Upper Manjimup WA 48 0.96 0.67 1.34 F3 Woolnorth TAS 48 1.50 1.02 2.17 F1 Castlereagh NSW 48 1.52 1.07 2.16 F3 Calculated at LC50 Werribee South VIC 48 1.67 1.15 2.40 F1 Nairne SA 48 1.87 1.33 2.67 F2 Glenore Grove QLD 48 3.62 2.50 5.25 F1 Calculated at LC50 Grantham QLD 48 6.83 4.01 12.41 F2 Manjimup WA 72 1.17 0.91 1.50 F3 Werribee South VIC 72 1.18 0.80 1.75 F1 Castlereagh NSW 72 1.20 0.84 1.71 F3 Calculated at LC50 Woolnorth TAS 72 1.39 1.03 1.87 F1 Nairne SA 72 1.88 1.37 2.58 F2 Calculated at LC50 Glenore Grove QLD 72 2.95 2.12 4.12 F1 Calculated at LC50 Grantham QLD 72 7.77 4.59 14.41 F2

133
ATTACHMENT 1 (continued) INDOXACARB DBM population State h Tolerance 95% c. i. Gen Ratio Lower Upper Werribee South VIC 48 0.56 0.33 0.91 F2 Castlereagh NSW 48 0.69 0.38 1.24 F3 Glenore Grove QLD 48 0.80 0.41 1.60 F1 Woolnorth TAS 48 1.36 0.81 2.30 F3 Nairne SA 48 1.39 0.87 2.24 F3 Manjimup WA 48 1.43 0.76 2.74 F3 Grantham QLD 48 2.39 1.24 4.63 F2 Werribee South VIC 72 0.60 0.36 1.00 F2 Nairne SA 72 0.77 0.41 1.43 F3 Manjimup WA 72 1.02 0.56 1.85 F3 Castlereagh NSW 72 1.06 0.52 2.20 F3 Woolnorth TAS 72 1.20 0.55 2.70 F3 Glenore Grove QLD 72 1.61 0.73 3.70 F1 Grantham QLD 72 3.17 1.82 5.61 F2
METHAMIDOPHOS DBM population State h Tolerance 95% c. i. Gen Ratio Lower Upper Nairne SA 48 1.12 0.91 1.39 F2 Calculated at LC50 Woolnorth TAS 48 1.16 0.93 1.46 F1 Manjimup WA 48 1.53 1.16 2.05 F3 Werribee South VIC 48 1.70 1.34 2.14 F1 Glenore Grove QLD 48 2.37 1.90 2.94 F1 Calculated at LC50 Castlereagh NSW 48 2.43 1.90 3.16 F2 Grantham QLD 48 3.12 2.50 3.88 F3 Calculated at LC50
NOVALURON DBM population State h Tolerance 95% c. i. Gen Ratio Lower Upper Woolnorth TAS 48 0.65 0.24 1.65 F6 Castlereagh NSW 48 0.65 0.24 1.63 F5 Grantham QLD 48 0.92 0.48 1.74 F2 Nairne SA 48 0.93 0.51 1.72 F3 Woolnorth TAS 48 1.14 0.58 2.21 F4 Werribee South VIC 48 1.21 0.76 1.94 F2 Manjimup WA 48 1.41 0.75 2.69 F3 Castlereagh NSW 48 1.98 1.08 3.76 F3 Nairne SA 72 0.25 0.12 0.49 F3 Woolnorth TAS 72 0.55 0.27 1.08 F6 Grantham QLD 72 0.59 0.28 1.21 F2 Castlereagh NSW 72 0.69 0.32 1.44 F5 Castlereagh NSW 72 1.26 0.75 2.11 F3 Woolnorth TAS 72 1.44 0.85 2.43 F4 Werribee South VIC 72 1.51 0.74 3.15 F2 Manjimup WA 72 1.53 0.68 3.53 F3

134
ATTACHMENT 1 (continued) PERMETHRIN DBM population State h Tolerance 95% c. i. Gen Ratio Lower Upper Manjimup WA 48 5.18 3.35 8.00 F1 Calculated at LC50 Nairne SA 48 10.68 6.61 17.25 F1 Calculated at LC50 Werribee South VIC 48 14.39 9.03 25.21 F1 Woolnorth TAS 48 17.25 11.90 26.50 F2 Castlereagh NSW 48 21.61 14.21 32.88 F1 Calculated at LC50 Grantham QLD 48 47.56 34.53 65.50 F1 Calculated at LC50
SPINOSAD
DBM population State h Tolerance 95% c. i. Gen Ratio Lower Upper Woolnorth TAS 72 0.81 0.41 1.55 F1 Manjimup WA 72 1.00 0.75 1.32 F1 Werribee South VIC 72 1.16 0.59 2.29 F1 Nairne SA 72 1.28 0.63 2.87 F2 Castlereagh NSW 72 1.68 1.07 2.71 F3 Glenore Grove QLD 72 2.77 1.70 4.70 F1 Grantham QLD 72 2.92 2.03 4.29 F2

135
ATTACHMENT 2
LC50 and LC95 for ten insecticides tested on diamondback moth populations from WA, SA, VIC, NSW, TAS and QLlaboratory population (Waite) 1999/2000. ALPHA-CYPERMETHRIN
Date tested
Population h n Control Slope ± s.e. Het. g χ2 df LC50 (ppm)
95% confidinterva
08/03/00 Waite 48 280 40 3.35 ± 0.45 0.95 0.07 24.3 26 11.95 9.78 08/03/00 Nairne SA 48 280 40 1.33 ± 0.16 1.49 0.09 38.7 26 105.75 66.15 29/03/00 Waite 48 280 40 2.10 ± 0.28 1.10 0.08 28.6 26 9.17 6.34 29/03/00 Manjimup WA 48 280 40 2.57 ± 0.32 0.99 0.06 25.8 26 58.86 48.48 03/05/00 Waite 48 280 41 2.08 ± 0.28 0.94 0.07 24.5 26 16.01 11.29 03/05/00 Werribee South VIC 48 280 40 2.26 ± 0.26 2.29 0.13 59.6 26 67.72 47.69 03/05/00 Woolnorth TAS 48 279 40 2.53 ± 0.33 1.32 0.10 34.4 26 89.26 70.18 19/07/00 Waite 48 280 41 2.20 ± 0.23 0.89 0.04 23.1 26 18.94 15.44 19/07/00 Castlereagh NSW 48 280 40 1.96 ± 0.23 1.32 0.08 34.2 26 66.76 50.28 04/10/00 Waite 48 280 40 1.91 ± 0.24 0.73 0.06 19.1 26 10.60 7.86 04/10/00 Grantham QLD 48 280 39 1.71 ± 0.27 1.67 0.17 43.5 26 428.27 225.80 7
n=number of subjects, Het.=heterogeneity, s.e.=standard error, df=degrees of freedom
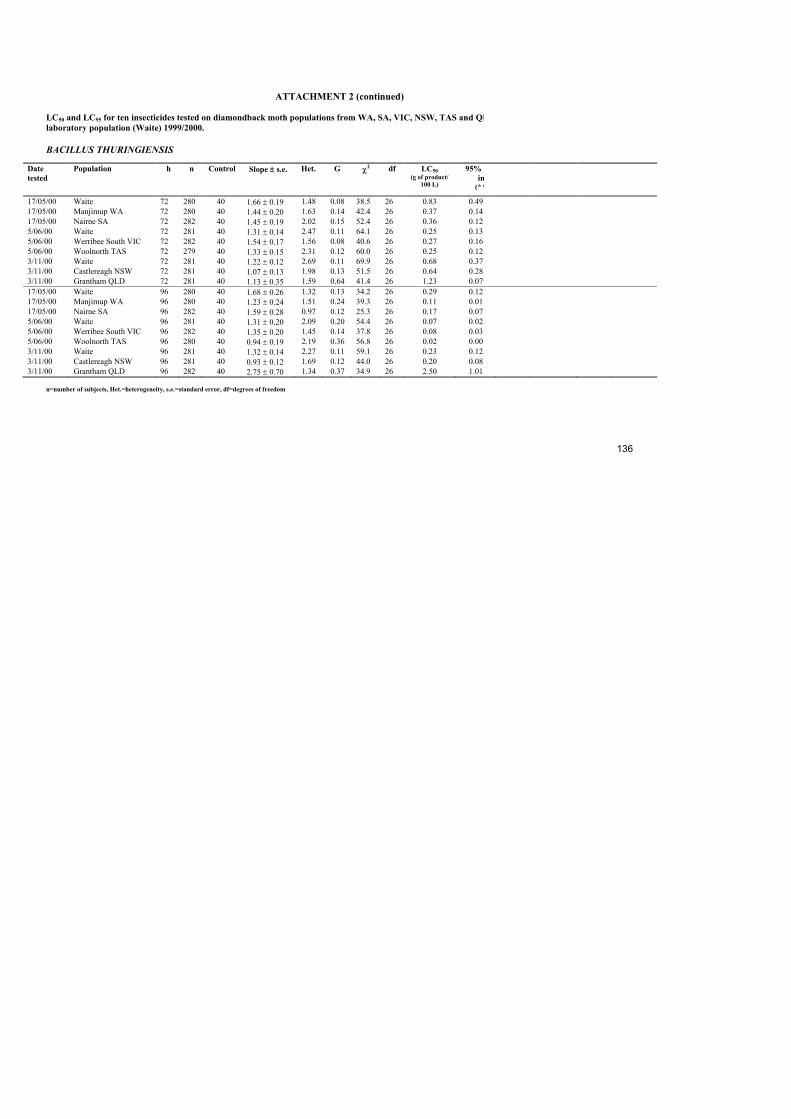
136
ATTACHMENT 2 (continued) LC50 and LC95 for ten insecticides tested on diamondback moth populations from WA, SA, VIC, NSW, TAS and QLlaboratory population (Waite) 1999/2000. BACILLUS THURINGIENSIS
Date tested
Population h n Control Slope ± s.e. Het. G χ2 df LC50 (g of product/
100 L)
95% cin
(* 9
17/05/00 Waite 72 280 40 1.66 ± 0.19 1.48 0.08 38.5 26 0.83 0.4917/05/00 Manjimup WA 72 280 40 1.44 ± 0.20 1.63 0.14 42.4 26 0.37 0.1417/05/00 Nairne SA 72 282 40 1.45 ± 0.19 2.02 0.15 52.4 26 0.36 0.125/06/00 Waite 72 281 40 1.31 ± 0.14 2.47 0.11 64.1 26 0.25 0.135/06/00 Werribee South VIC 72 282 40 1.54 ± 0.17 1.56 0.08 40.6 26 0.27 0.165/06/00 Woolnorth TAS 72 279 40 1.33 ± 0.15 2.31 0.12 60.0 26 0.25 0.123/11/00 Waite 72 281 40 1.22 ± 0.12 2.69 0.11 69.9 26 0.68 0.373/11/00 Castlereagh NSW 72 281 40 1.07 ± 0.13 1.98 0.13 51.5 26 0.64 0.283/11/00 Grantham QLD 72 281 40 1.13 ± 0.35 1.59 0.64 41.4 26 1.23 0.07*17/05/00 Waite 96 280 40 1.68 ± 0.26 1.32 0.13 34.2 26 0.29 0.1217/05/00 Manjimup WA 96 280 40 1.23 ± 0.24 1.51 0.24 39.3 26 0.11 0.0117/05/00 Nairne SA 96 282 40 1.59 ± 0.28 0.97 0.12 25.3 26 0.17 0.075/06/00 Waite 96 281 40 1.31 ± 0.20 2.09 0.20 54.4 26 0.07 0.025/06/00 Werribee South VIC 96 282 40 1.35 ± 0.20 1.45 0.14 37.8 26 0.08 0.035/06/00 Woolnorth TAS 96 280 40 0.94 ± 0.19 2.19 0.36 56.8 26 0.02 0.003/11/00 Waite 96 281 40 1.32 ± 0.14 2.27 0.11 59.1 26 0.23 0.123/11/00 Castlereagh NSW 96 281 40 0.93 ± 0.12 1.69 0.12 44.0 26 0.20 0.083/11/00 Grantham QLD 96 282 40 2.75 ± 0.70 1.34 0.37 34.9 26 2.50 1.01
n=number of subjects, Het.=heterogeneity, s.e.=standard error, df=degrees of freedom

137
ATTACHMENT 2 (continued) LC50 and LC95 for ten insecticides tested on diamondback moth populations from WA, SA, VIC, NSW, TAS and QLlaboratory population (Waite) 1999/2000. CHLORFENAPYR Date tested
Population h n Control Slope ± s.e. Het. g χ2 df LC50 (ppm)
95%i
01/02/00 Waite 48 280 40 2.70 ± 0.35 1.62 0.11 42.2 26 32.16 21.501/02/00 Manjimup WA 48 280 40 2.47 ± 0.33 0.89 0.07 23.1 26 25.85 18.623/02/00 Waite 48 280 40 2.55 ± 0.33 1.17 0.08 30.4 26 17.67 12.523/02/00 Nairne SA 48 280 40 2.02 ± 0.23 1.34 0.08 35.0 26 28.20 19.602/05/00 Waite 48 280 40 2.57 ± 0.27 1.25 0.06 32.4 26 43.69 34.302/05/00 Werribee South VIC 48 280 40 2.20 ± 0.22 1.76 0.08 45.8 26 89.65 67.402/05/00 Woolnorth TAS 48 281 40 2.22 ± 0.23 0.95 0.04 24.6 26 67.19 54.411/07/00 Waite 48 280 40 2.65 ± 0.29 1.46 0.07 38.0 26 39.74 30.211/07/00 Castlereagh NSW 48 280 40 2.22 ± 0.29 1.67 0.12 43.5 26 22.60 13.314/11/00 Waite 48 280 40 1.76 ± 0.22 1.53 0.10 39.8 26 41.84 26.114/11/00 Grantham QLD 48 280 40 2.42 ± 0.25 1.20 0.05 31.2 26 62.65 49.823/02/00 Waite 72 280 40 3.67 ± 0.57 0.57 0.09 14.8 26 14.05 10.823/02/00 Nairne SA 72 280 40 2.20 ± 0.29 1.81 0.13 47.0 26 20.52 11.802/05/00 Waite 72 280 40 2.66 ± 0.50 1.12 0.17 29.2 26 29.65 16.002/05/00 Werribee South VIC 72 280 40 2.85 ± 0.29 3.68 0.16 95.6 26 56.38 37.002/05/00 Woolnorth TAS 72 282 40 3.27 ± 0.69 1.26 0.24 32.8 26 51.26 30.211/07/00 Waite 72 280 40 3.65 ± 0.58 0.85 0.10 22.0 26 24.77 18.511/07/00 Castlereagh NSW 72 280 40 2.20 ± 0.41 1.42 0.21 37.0 26 9.20 3.414/11/00 Waite 72 280 40 1.69 ± 0.24 1.85 0.16 48.1 26 18.46 7.514/11/00 Grantham QLD 72 280 40 2.83 ± 0.34 0.64 0.05 16.7 26 26.12 20.9 n=number of subjects, Het.=heterogeneity, s.e.=standard error, df=degrees of freedom

138
ATTACHMENT 2 (continued) LC50 and LC95 for ten insecticides tested on diamondback moth populations from WA, SA, VIC, NSW, TAS and QLlaboratory population (Waite) 1999/2000. EMAMECTIN BENZOATE
Date tested
Population h n Control Slope ± s.e. Het. G χ2 df LC50 (ng/ ml)
95% cointe
28/03/00 Waite 48 280 40 1.63 ± 0.19 2.41 0.14 62.6 26 27.64 17.25 28/03/00 Manjimup WA 48 280 40 1.90 ± 0.21 1.04 0.05 27.1 26 80.77 63.35 28/03/00 Waite 48 274 38 2.60 ± 0.26 3.06 0.13 79.5 26 38.80 27.86 28/03/00 Nairne SA 48 272 39 2.33 ± 0.36 1.41 0.14 36.7 26 79.20 56.94 19/06/00 Waite 48 280 40 1.26 ± 0.17 1.02 0.08 26.7 26 158.49 106.99 19/06/00 Werribee South VIC 48 280 40 1.59 ± 0.27 0.48 0.11 12.5 26 403.73 255.47 19/06/00 Woolnorth TAS 48 281 40 1.38 ± 0.20 1.19 0.11 30.9 26 198.54 128.54 19/07/00 Waite 48 281 40 2.24 ± 0.27 0.67 0.06 17.4 26 135.33 107.81 19/07/00 Castlereagh NSW 48 280 40 2.21 ± 0.31 0.86 0.08 22.5 26 202.21 154.38 02/10/00 Waite 48 278 40 1.53 ± 0.20 1.09 0.08 28.4 26 150.16 106.80 02/10/00 Grantham QLD 48 280 41 1.37 ± 0.24 1.14 0.15 29.7 26 465.80 259.36 28/03/00 Waite 72 280 40 2.52 ± 0.34 1.86 0.15 48.4 26 10.04 6.28 28/03/00 Manjimup WA 72 280 40 2.13 ± 0.23 1.88 0.09 48.8 26 32.89 23.98 28/03/00 Waite 72 272 38 3.08 ± 0.35 1.46 0.08 37.9 26 16.40 13.25 28/03/00 Nairne SA 72 270 39 3.71 ± 0.83 1.30 0.27 33.9 26 31.28 19.20 19/06/00 Waite 72 281 40 2.65 ± 0.27 1.19 0.05 31.0 26 27.71 22.79 19/06/00 Werribee South VIC 72 279 40 1.50 ± 0.17 1.39 0.08 36.1 26 76.04 54.76 19/06/00 Woolnorth TAS 72 278 40 2.65 ± 0.29 1.22 0.06 31.6 26 42.66 34.12 19/07/00 Waite 72 281 40 2.25 ± 0.31 3.85 0.30 100.2 26 49.66 25.82 19/07/00 Castlereagh NSW 72 280 40 2.58 ± 0.37 1.24 0.11 32.2 26 71.44 54.39 02/10/00 Waite 72 278 40 1.68 ± 0.18 0.95 0.05 24.6 26 46.48 36.75 02/10/00 Grantham QLD 72 279 41 1.59 ± 0.21 1.56 0.11 40.6 26 169.02 113.10
n=number of subjects, Het.=heterogeneity, s.e.=standard error, df=degrees of freedom

139
ATTACHMENT 2 (continued) LC50 and LC95 for ten insecticides tested on diamondback moth populations from WA, SA, VIC, NSW, TAS and QLlaboratory population (Waite) 1999/2000. FIPRONIL
Date tested
Population h n Control Slope ± s.e. Het. G χ2 df LC50 (ppm
)
95confiinter
15/03/00 Waite 48 242 40 2.49 ± 0.30 1.48 0.09 68.2 46 0.47 0.3615/03/00 Nairne SA 48 280 40 2.02 ± 0.24 1.35 0.08 73.0 54 0.85 0.6321/03/00 Waite 48 240 40 2.02 ± 0.26 1.20 0.08 55.1 46 0.73 0.58213/03/00 Manjimup WA 48 280 40 2.17 ± 0.27 1.62 0.10 87.4 54 0.70 0.5209/05/00 Waite 48 240 40 1.91 ± 0.25 1.11 0.08 50.9 46 0.74 0.5809/05/00 Werribee South VIC 48 281 40 1.51 ± 0.16 1.03 0.05 55.7 54 1.25 0.9509/05/00 Woolnorth TAS 48 280 40 1.59 ± 0.18 1.24 0.06 66.9 54 1.11 0.8305/09/00 Waite 48 240 40 2.31 ± 0.29 1.34 0.09 61.5 46 0.99 0.7905/09/00 Glenore Grove QLD 48 280 40 1.38 ± 0.15 1.32 0.06 71.4 54 3.58 2.5605/09/00 Castlereagh NSW 48 286 40 1.51 ± 0.16 1.02 0.05 55.2 54 1.51 1.1204/12/00 Waite 48 240 40 1.58 ± 0.23 1.97 0.16 90.8 46 0.67 0.4504/12/00 Grantham QLD 48 278 40 1.41 ± 0.16 1.69 0.08 91.0 54 4.69 3.1715/03/00 Waite 72 242 40 3.04 ± 0.36 1.18 0.07 54.4 46 0.29 0.2315/03/00 Nairne SA 72 280 40 2.00 ± 0.29 1.62 0.14 87.7 54 0.54 0.3621/03/00 Waite 72 240 40 2.64 ± 0.33 0.98 0.06 45.0 46 0.39 0.3221/03/00 Manjimup WA 72 280 40 2.90 ± 0.45 1.21 0.12 65.6 54 0.47 0.3709/05/00 Waite 72 240 40 2.28 ± 0.28 0.81 0.06 37.2 46 0.45 0.3709/05/00 Werribee South VIC 72 281 40 1.34 ± 0.19 1.39 0.11 74.9 54 0.53 0.3209/05/00 Woolnorth TAS 72 280 40 1.97 ± 0.27 1.19 0.09 64.4 54 0.61 0.4505/09/00 Waite 72 240 40 2.80 ± 0.35 1.12 0.07 51.3 46 0.59 0.4905/09/00 Glenore Grove QLD 72 280 40 1.36 ± 0.15 1.03 0.05 55.9 54 1.74 1.3005/09/00 Castlereagh NSW 72 286 40 1.54 ± 0.19 1.45 0.09 78.5 54 0.71 0.4504/12/00 Waite 72 240 40 1.92 ± 0.25 2.41 0.17 110.6 46 0.35 0.2104/12/00 Grantham QLD 72 278 40 1.38 ± 0.15 1.62 0.08 87.5 54 2.55 1.76n=number of subjects, Het.=heterogeneity, s.e.=standard error, df=degrees of freedom

140
ATTACHMENT 2 (continued) LC50 and LC95 for ten insecticides tested on diamondback moth populations from WA, SA, VIC, NSW, TAS and QLlaboratory population (Waite) 1999/2000. INDOXACARB
Date tested
Population h n Control Slope ± s.e. Het. G χ2 df LC50 (ppm)
95% confiinterv
11/04/00 Waite 48 282 40 1.40 ± 0.15 0.89 0.05 23.3 26 23.57 16.92 11/04/00 Nairne SA 48 279 39 1.52 ± 0.17 1.16 0.06 30.1 26 31.18 21.68 11/04/00 Manjimup WA 48 280 40 1.48 ± 0.17 3.04 0.16 79.0 26 32.42 17.85 06/06/00 Waite 48 281 40 1.64 ± 0.24 0.75 0.08 19.5 26 66.05 46.22 06/06/00 Werribee South VIC 48 279 40 1.37 ± 0.17 1.03 0.07 26.7 26 42.75 28.88 15/08/00 Waite 48 280 40 1.06 ± 0.12 0.89 0.05 23.1 26 14.66 10.01 15/08/00 Woolnorth TAS 48 281 40 1.33 ± 0.14 1.26 0.06 32.8 26 17.12 11.64 12/09/00 Waite 48 280 40 1.31 ± 0.25 1.11 0.17 28.8 26 52.75 32.20 12/09/00 Castlereagh NSW 48 282 40 1.17 ± 0.19 0.65 0.10 16.9 26 39.93 25.38 12/09/00 Glenore Grove QLD 48 280 40 1.14 ± 0.15 1.28 0.09 33.2 26 48.45 28.86 06/11/00 Waite 48 280 40 1.39 ± 0.17 1.66 0.11 43.1 26 47.00 28.56 06/11/00 Grantham QLD 48 279 40 2.11 ± 0.74 0.73 0.47 19.1 26 85.89 59.63 11/04/00 Waite 72 282 40 1.34 ± 0.14 1.86 0.09 48.3 26 3.29 2.09 11/04/00 Nairne SA 72 279 39 1.37 ± 0.15 2.09 0.10 54.3 26 2.55 1.49 11/04/00 Manjimup WA 72 280 40 1.38 ± 0.15 1.77 0.09 46.0 26 3.36 2.11 06/06/00 Waite 72 281 40 1.24 ± 0.13 0.95 0.04 24.6 26 7.06 5.12 06/06/00 Werribee South VIC 72 279 40 1.15 ± 0.13 1.30 0.07 33.7 26 4.30 2.82 15/08/00 Waite 72 280 40 1.05 ± 0.14 1.65 0.12 42.8 26 0.82 0.35 15/08/00 Woolnorth TAS 72 281 39 1.37 ± 0.16 4.55 0.26 118.4 26 1.21 0.38 12/09/00 Waite 72 280 40 1.36 ± 0.15 3.88 0.21 100.9 26 2.03 0.86 12/09/00 Castlereagh NSW 72 282 40 1.43 ± 0.16 1.16 0.06 30.1 26 2.19 1.49 12/09/00 Glenore Grove QLD 72 280 40 1.30 ± 0.14 2.34 0.11 60.9 26 3.22 1.87 06/11/00 Waite 72 280 40 1.18 ± 0.13 1.09 0.06 28.3 26 3.71 2.54 06/11/00 Grantham QLD 72 281 41 1.03 ± 0.16 0.85 0.09 22.2 26 11.95 6.43
n=number of subjects, Het.=heterogeneity, s.e.=standard error, df=degrees of freedom

141
ATTACHMENT 2 (continued) LC50 and LC95 for ten insecticides tested on diamondback moth populations from WA, SA, VIC, NSW, TAS and QLlaboratory population (Waite) 1999/2000. METHAMIDOPHOS
Date tested
Population h n Control Slope ± s.e. Het. g χ2 df LC50 (ppm)
95% confiinterv
08/03/00 Waite 48 280 40 3.86 ± 0.41 3.02 0.14 78.5 26 175.40 134.66 208/03/00 Nairne SA 48 280 40 2.73 ± 0.28 0.95 0.04 24.7 26 197.09 166.45 223/03/00 Waite 48 281 40 3.65 ± 0.47 2.02 0.14 52.6 26 124.31 93.94 23/03/00 Manjimup WA 48 281 39 2.85 ± 0.32 1.13 0.06 29.5 26 184.26 148.76 210/05/00 Waite 48 280 40 4.09 ± 0.46 0.94 0.05 24.4 26 220.65 191.59 210/05/00 Werribee South VIC 48 280 40 3.29 ± 0.34 1.58 0.07 41.1 26 371.97 300.07 410/05/00 Woolnorth TAS 48 280 40 3.53 ± 0.35 1.47 0.06 38.3 26 257.76 215.47 313/07/00 Waite 48 280 40 3.52 ± 0.57 1.52 0.17 39.6 26 100.93 73.05 13/07/00 Castlereagh NSW 48 280 40 3.60 ± 0.35 1.25 0.05 32.6 26 245.60 208.49 230/08/00 Waite 48 279 40 4.09 ± 0.47 0.58 0.05 15.0 26 160.04 140.69 30/08/00 QLD 48 279 40 2.45 ± 0.24 1.66 0.07 43.2 26 378.65 298.76 417/01/01 Waite 48 280 40 4.40 ± 0.57 1.02 0.07 26.5 26 141.68 120.80 17/01/01 Grantham QLD 48 279 40 3.17 ± 0.33 1.15 0.05 29.9 26 441.43 364.45 5
n=number of subjects, Het.=heterogeneity, s.e.=standard error, df=degrees of freedom

142
ATTACHMENT 2 (continued) LC50 and LC95 for ten insecticides tested on DBM popns from WA, SA, VIC, TAS and QLD compared with the standard labor
NOVALURON
Date tested
Population h n Control Slope ± s.e. Het. g χ2 df LC50 (ppm)
95% confinterva
10/04/00 Waite 48 280 40 1.10 ± 0.15 1.32 0.11 34.4 26 10.93 5.11 10/04/00 Manjimup WA 48 280 40 1.05 ± 0.12 1.17 0.06 30.5 26 15.11 9.56 10/04/00 Nairne SA 48 280 40 1.10 ± 0.11 1.09 0.05 28.3 26 10.14 6.49 31/05/00 Waite 48 280 40 1.39 ± 0.14 1.37 0.06 35.6 26 13.15 8.62 31/05/00 Werribee South VIC 48 280 40 1.48 ± 0.15 0.62 0.04 16.0 26 16.25 11.82 4/09/00 Waite 48 281 40 1.05 ± 0.14 1.16 0.08 30.2 26 53.56 34.64 4/09/00 Castlereagh NSW 48 282 40 1.26 ± 0.12 1.41 0.12 36.6 26 94.78 61.28 13/09/00 Waite 48 280 40 1.08 ± 0.14 1.75 0.12 45.4 26 61.09 36.14 13/09/00 Woolnorth TAS 48 281 40 1.23 ± 0.17 0.70 0.07 18.2 26 65.22 45.76 20/11/00 Waite 48 282 40 0.88 ± 0.11 1.14 0.08 29.8 26 47.13 28.76 20/11/00 Grantham QLD 48 281 40 0.88 ± 0.13 0.74 0.08 19.4 26 43.26 26.51 11/12/00 Waite 48 280 40 0.82 ± 0.13 2.05 0.20 53.2 26 151.1 67.3 11/12/00 Castlereagh NSW 48 280 40 1.13 ± 0.18 0.94 0.10 24.4 26 73.2 48.01 11/12/00 Woolnorth TAS 48 283 41 1.02 ± 0.14 1.86 0.14 48.3 26 76.79 43.20 10/04/00 Waite 72 280 40 1.20 ± 0.14 2.97 0.16 77.3 26 2.22 0.69 10/04/00 Manjimup WA 72 280 40 1.26 ± 0.13 1.33 0.06 34.5 26 3.52 2.09 10/04/00 Nairne SA 72 280 40 1.19 ± 0.14 1.73 0.09 44.9 26 2.85 1.27 31/05/00 Waite 72 280 40 1.31 ± 0.18 0.78 0.08 20.3 26 3.90 2.05 31/05/00 Werribee South VIC 72 280 39 1.25 ± 0.12 2.74 0.11 71.2 26 5.69 2.75 1/08/00 Waite 72 281 40 1.35 ± 0.14 1.45 0.06 37.6 26 14.34 9.23 1/08/00 Castlereagh NSW 72 282 40 0.98 ± 0.13 2.02 0.15 52.5 26 24.40 11.42 13/09/00 Waite 72 280 40 1.14 ± 0.12 1.38 0.07 36.0 26 15.48 9.68 13/09/00 Woolnorth TAS 72 281 40 1.45 ± 0.19 0.49 0.07 12.7 26 23.72 15.69 20/11/00 Waite 72 281 40 1.10 ± 0.12 2.62 0.12 68.2 26 13.25 6.44 20/11/00 Grantham QLD 72 282 40 1.21 ± 0.15 0.96 0.06 24.9 26 8.20 4.99 11/12/00 Waite 72 280 40 0.90 ± 0.11 1.54 0.09 40.2 26 27.48 15.62 11/12/00 Castlereagh NSW 72 281 40 1.05 ± 0.16 1.28 0.12 33.2 26 19.36 9.41 11/12/00 Woolnorth TAS 72 283 41 0.98 ± 0.11 1.08 0.06 28.1 26 14.97 9.44
n=number of subjects, Het.=heterogeneity, s.e.=standard error, df=degrees of freedom

143
ATTACHMENT 2 (continued) LC50 and LC95 for ten insecticides tested on diamondback moth populations from WA, SA, VIC, NSW, TAS and QLlaboratory population (Waite) 1999/2000. PERMETHRIN
Date tested
Population h n Control Slope ± s.e. Het. G χ2 df LC50 (ppm)
95% confidinterval
29/11/99 Waite 48 280 40 2.26 ± 0.28 1.49 0.10 38.8 26 20.96 14.26 229/11/99 Manjimup WA 48 280 40 1.25 ± 0.19 1.31 0.12 34.0 26 108.52 72.70 1705/01/00 Waite 48 279 40 3.51 ± 1.03 0.73 0.33 19.1 26 11.64 5.26 105/01/00 Nairne SA 48 280 40 1.30 ± 0.17 1.45 0.11 37.8 26 124.32 82.11 1726/04/00 Waite 48 279 40 2.10 ± 0.35 0.39 0.11 10.2 26 3.15 1.84 26/04/00 Werribee South VIC 48 280 40 1.50 ± 0.18 1.80 0.11 46.8 26 34.10 22.24 428/06/00 Waite 48 280 40 2.41 ± 0.35 0.93 0.08 24.1 26 4.39 2.99 28/06/00 Woolnorth TAS 48 280 40 1.91 ± 0.24 1.39 0.09 36.0 26 67.73 48.45 920/06/00 Waite 48 279 40 2.83 ± 0.39 1.12 0.09 29.2 26 6.70 4.77 20/06/00 Castlereagh NSW 48 281 40 1.39 ± 0.19 1.85 0.14 48.2 26 144.83 96.55 26
n=number of subjects, Het.=heterogeneity, s.e.=standard error, df=degrees of freedom
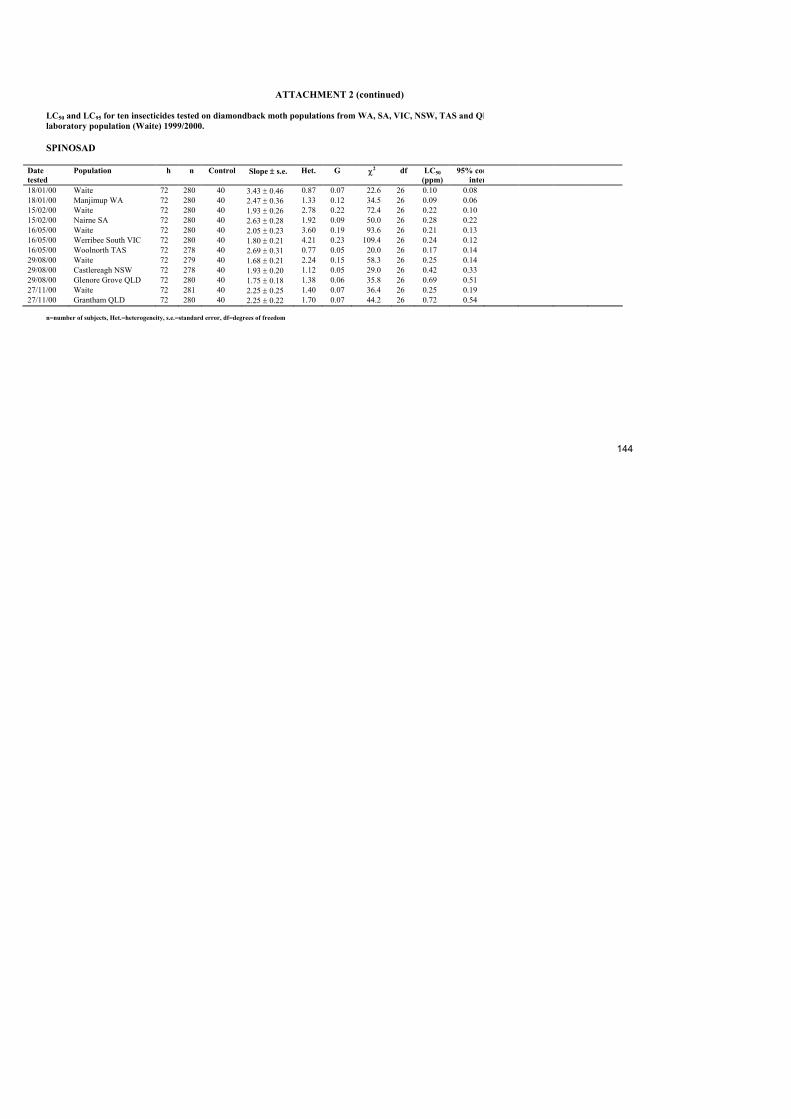
144
ATTACHMENT 2 (continued) LC50 and LC95 for ten insecticides tested on diamondback moth populations from WA, SA, VIC, NSW, TAS and QLlaboratory population (Waite) 1999/2000. SPINOSAD
Date tested
Population h n Control Slope ± s.e. Het. G χ2 df LC50 (ppm)
95% coninter
18/01/00 Waite 72 280 40 3.43 ± 0.46 0.87 0.07 22.6 26 0.10 0.08 18/01/00 Manjimup WA 72 280 40 2.47 ± 0.36 1.33 0.12 34.5 26 0.09 0.06 15/02/00 Waite 72 280 40 1.93 ± 0.26 2.78 0.22 72.4 26 0.22 0.10 15/02/00 Nairne SA 72 280 40 2.63 ± 0.28 1.92 0.09 50.0 26 0.28 0.22 16/05/00 Waite 72 280 40 2.05 ± 0.23 3.60 0.19 93.6 26 0.21 0.13 16/05/00 Werribee South VIC 72 280 40 1.80 ± 0.21 4.21 0.23 109.4 26 0.24 0.12 16/05/00 Woolnorth TAS 72 278 40 2.69 ± 0.31 0.77 0.05 20.0 26 0.17 0.14 29/08/00 Waite 72 279 40 1.68 ± 0.21 2.24 0.15 58.3 26 0.25 0.14 29/08/00 Castlereagh NSW 72 278 40 1.93 ± 0.20 1.12 0.05 29.0 26 0.42 0.33 29/08/00 Glenore Grove QLD 72 280 40 1.75 ± 0.18 1.38 0.06 35.8 26 0.69 0.51 27/11/00 Waite 72 281 40 2.25 ± 0.25 1.40 0.07 36.4 26 0.25 0.19 27/11/00 Grantham QLD 72 280 40 2.25 ± 0.22 1.70 0.07 44.2 26 0.72 0.54
n=number of subjects, Het.=heterogeneity, s.e.=standard error, df=degrees of freedom

145
ATTACHMENT 3 a) Tolerance ratios (assuming parallel slopes for each test) with 95% confidence intervals for chlorfenapyr (48 h)
DBM in 1998/99. If parallel slopes could not be fitted for a particular assay, then tolerance ratio was calculaindicates that a field population is equivalent in susceptibility to the Waite population.
DBM population State Tolerance 95% c. i. Generatio Ratio lower upper tested Glenore Grove QLD 1.16 0.64 2.16 F4 Ebenezer NSW 0.81 0.49 1.31 F1 Mt Sylvia QLD 0.60 0.41 0.85 F2 Helidon QLD 0.23 0.10 0.49 F2 Castlereagh NSW 1.58 1.13 2.23 F1 Werribee VIC 1.22 0.72 2.04 F2 South Australia SA 0.93 0.60 1.46 F1 Devonport TAS 0.68 0.37 1.21 F2 Western Australia WA 0.93 0.57 1.50 F2

146
ATTACHMENT 3 (continued)
b) Baseline data for chlorfenapyr for Australian populations of DBM, 1998/99 Date tested Population State h n Control Slope ± s.e. Het. g χ2 df LC50
(ppm) 95% c
in25/02/98 Glenore Grove QLD 48 162 40 2.03 ± 0.32 1.90 0.21 26.6 14 23.75 13.5825/02/98 Waite lab 48 161 41 1.83 ± 0.36 2.04 0.37 28.5 14 19.58 5.4317/11/98 Ebenezer NSW 48 240 40 1.50 ± 0.21 1.52 0.13 33.5 22 51.09 27.60 17/11/98 Waite lab 48 241 40 1.81 ± 0.22 1.39 0.09 30.6 22 70.48 47.88 8/12/98 Mt Sylvia QLD 48 280 40 2.33 ± 0.32 1.73 0.14 44.9 26 18.33 11.228/12/98 Helidon QLD 48 282 40 1.11 ± 0.19 1.11 0.13 28.8 26 7.48 2.25 8/12/98 Waite lab 48 281 40 2.86 ± 0.37 0.83 0.06 21.5 26 33.10 26.6429/12/98 Castlereagh NSW 48 280 40 1.60 ± 0.17 2.21 0.10 57.6 26 69.46 44.3229/12/98 Waite lab 48 280 40 2.30 ± 0.27 1.00 0.06 26.1 26 43.85 34.64 23/02/99 Werribee VIC 48 280 40 1.54 ± 0.20 1.60 0.11 41.7 26 41.24 22.2423/02/99 South Australia SA 48 281 41 2.31 ± 0.28 1.42 0.09 36.8 26 36.79 26.91 23/02/99 Waite lab 48 282 40 1.68 ± 0.19 1.72 0.10 44.7 26 35.44 22.68 2/03/99 Devonport TAS 48 280 40 1.42 ± 0.16 2.21 0.12 57.4 26 47.12 26.59 2/03/99 Western Australia WA 48 279 40 1.58 ± 0.17 1.20 0.06 31.1 26 66.31 47.862/03/99 Waite lab 48 280 40 1.45 ± 0.17 1.77 0.10 46.0 26 70.01 41.75 n=number of subjects, Het.=heterogeneity, s.e.=standard error, df=degrees of freedom

147
APPENDIX D
BIOASSAY RESULTS 2000/2001 FOR NATIONAL INSECTICIDE RESISTANCE TESTING PROGRAM Nancy M. Endersby, Peter M. Ridland, Jingye Zhang Institute for Horticultural Development, Knoxfield, Private Bag 15, Ferntree Gully Delivery Centre VIC 3156 BACKGROUND The major pest of Brassica vegetables in Australia is diamondback moth (DBM), Plutella xylostella (L.). This pest has developed insecticide resistance due to prophylactic use of insecticides over many years. Insecticide resistance has caused control failures and economic loss in vegetable crops. Resistance to synthetic pyrethroid insecticides has been identified in DBM populations from vegetable growing areas in all states and resistance to organophosphate insecticides has been identified in some states. Recently, low levels of resistance have also been documented in DBM populations from canola, forage brassicas and brassicaceous weeds (Endersby et al. 2000b). Earliest resistance testing of DBM in Australia was conducted by Hargreaves (1996), followed by Baker and Kovaliski (1999) and Endersby and Ridland (1997). In 1997, a project funded by the Horticultural Research and Development Corporation “Advancing the integrated management of DBM in crucifer vegetables” was established with additional funding from major agrochemical companies. Also in 1997, AIRAC (AVCARE's Insecticide Resistance Action Committee), in consultation with researchers, devised a two-window insecticide resistance management strategy for DBM. By late 1998, chlorfenapyr and fipronil had both been registered for control of DBM and so the two-window strategy was launched to growers around Australia. The strategy is reviewed regularly and is updated as new products become registered. Five products are currently partitioned into the two-window strategy. In southern Australia, Secure® (chlorfenapyr) and Success® (spinosad) may be used from 1st September to 31st January, whereas Regent®, Proclaim® and Avatar® may be used from 1st February to 31st August. Window strategies have also been published for WA and Qld. The national resistance monitoring program was established in 1999. The program involves testing of field populations of DBM from each major Brassica producing state with a variety of new and long-established insecticides. The data collected will provide valuable insights to all facets of the industry on the progress of the resistance management strategy. This report gives details of results for 2000/2001. METHODS Larvae of diamondback moth were collected from Brassica crops in New South Wales, South Australia, Tasmania, Western Australia and Victoria (Table 1) and were reared on cabbage seedling leaves (Brassica oleracea var. capitata cv. Green Coronet) in the laboratory at 25 °C (16h:8h, L:D) for one to six generations. A susceptible laboratory population of diamondback moth, maintained at IHD Knoxfield since it was obtained from the University of Adelaide, Department of Crop Protection Waite Campus, SA, in 1994, was used as a reference. Table 1. Origin and generation of Australian diamondback moth populations tested for susceptibility to insecticides, 2000/2001
Population Origin Generation tested
Waite Laboratory population * Albany WA Cauliflower F2 – F5 St Kilda SA Broccoli F1 – F3 Werribee South VIC Broccoli F1 – F2

148
Gawler TAS Broccoli (processing) F1 – F6 Castlereagh NSW Cabbage F1 – F4 Gatton QLD Gatton Research Station F1 – F4
A leaf dip bioassay after Tabashnik and Cushing (1987) was adopted for testing susceptibility to each insecticide. Variations in method for some insecticides were determined by company preferences or were those used in previous monitoring programs for the particular insecticide. For example, fipronil is tested worldwide at 22°C and indoxacarb was tested at 25°C. The remaining insecticides were all tested at 28°C (Table 2). Cabbage leaf discs of 4.5 cm diameter were dipped for 5 s in distilled water solutions of formulated insecticide and hung vertically to dry in a fume hood for 2 h. Control discs were dipped in distilled water. No wetting agents were used except for Bond Spraymate with emamectin benzoate and X-77 with indoxacarb. Discs were placed into Gelman 50 mm diameter x 9 mm plastic Petri dishes. For bioassays of Regentand those running to 96 h, five third instar DBM larvae were placed on each disc and eight replicates of each concentration were set up. For each of the shorter bioassays, ten larvae were placed on each disc and four replicates of each concentration were set up. Mortality was assessed at different times for different insecticides (Table 2). Larvae were considered dead if they did not move when touched with a paintbrush. Table 2. Insecticides tested, assessment times and temperatures used in bioassays of diamondback moth,
Plutella xylostella from Australia, 2000/2001
Insecticide Product name Assessment times Temperature
alpha-cypermethrin Fastac 48 h 28°C Bacillus thuringiensis Delfin WG 72 h, 96 h 28°C chlorfenapyr Secure 48 h, 72 h 28°C emamectin benzoate Proclaim 48 h, 72 h 28°C fipronil Regent 48 h, 72 h 22°C indoxacarb Avatar 48 h, 72 h 25°C methamidophos Nitofol 48 h 28°C novaluron Rim On 48 h, 72 h 28°C permethrin Ambush 48 h 28°C spinosad Success 72 h 28°C
Analysis Concentration-mortality data for each population were analysed using the probit analysis program, POLO-PC (Russell et al. 1977) (LeOra Software). We used the program to estimate the lethal concentration expected to cause 50% mortality (LC50) of each insecticide for each diamondback moth population and the 95% confidence intervals for these concentrations. The slope (+ standard error) of the probit line was also estimated. The program also performed χ2 tests for goodness-of-fit of the data to the probit model. If the model fits, the calculated value of χ2 is less than the χ2 table value for the appropriate degrees of freedom. If the model does not fit (i.e. the χ2 value exceeds the table value), the LC50 value for the particular population may not be reliably estimated and is adjusted with the heterogeneity factor (χ2/df). The index of significance for potency estimation (g) was used to calculate 95% confidence intervals for potency (relative potency is equivalent to tolerance ratio) (Robertson and Preisler 1992, p.29). Parallelism of the probit regression lines implies a constant relative potency at all levels of response (Finney 1971). Equality and parallelism of the slopes of the probit lines for the field population and the laboratory susceptible population were also tested for by POLO-PC. If the slopes are parallel, then overlap of the 95% confidence intervals for the two populations indicates that no significant difference exists between the LC50 values.

149
RESULTS A summary of the results comparing the levels of tolerance to the test insecticides for the six populations tested in 2000/2001 is presented in Table 3. The summary is based on comprehensive listings of tolerance ratios for the ten insecticides tested on diamondback moth populations from WA, SA, VIC, TAS, NSW and QLD compared with the standard laboratory population (Waite) 2000/2001, provided in Attachment 1. A tolerance ratio of 1 indicates that a field population is equivalent in susceptibility to the Waite population. Similarly, the values of LC50 and LC95 and associated statistics from the probit analyses for the ten insecticides tested on diamondback moth populations from WA, SA, VIC, TAS, NSW and QLD compared with the standard laboratory population (Waite) 2000/2001 are listed in Attachment 2. Table 3. Comparison of levels of tolerance to ten insecticides tested on DBM populations from six
states in 2000/2001 (tolerance ratios of field population compared with laboratory population, Waite)
Insecticide h WA SA VIC TAS NSW QLD
alpha-cypermethrin 48 3.45 11.55 9.96 9.01 7.20 13.92 Bacillus thuringiensis 96 0.20 0.30 1.94 1.50 4.44 1.45 chlorfenapyr 48 0.51 1.43 1.47 0.67 0.47 1.45 emamectin benzoate 72 2.27 1.37 1.97 1.61 2.23 3.19 fipronil 72 1.43 1.38 1.24 1.59 1.17 11.03 indoxacarb 72 1.27 1.18 1.29 1.86 0.89 2.40 methamidophos 48 1.10 1.74 2.06 1.66 2.17 2.70 novaluron 72 1.38 0.82 0.85 1.56 1.83 1.17 permethrin 48 6.48 11.14 7.85 6.47 9.87 10.63 spinosad 72 3.40 0.98 1.63 3.24 1.17 2.18
DISCUSSION ALPHA-CYPERMETHRIN Tolerance to alpha-cypermethrin was observed in all populations, but was lowest in the WA population. BACILLUS THURINGIENSIS No tolerance was shown towards Bacillus thuringiensis in the populations tested in 1999/2000. The population from NSW showed a low level of tolerance in the current tests (2000/2001) and this population warrants further investigation. CHLORFENAPYR In the current round of tests (2000/01), none of the six populations tested showed any tolerance to chlorfenapyr. EMAMECTIN BENZOATE The SA population showed no tolerance to emamectin benzoate. Other populations showed very low tolerance, but levels were not higher than those observed in the baseline study (Endersby & Ridland, 1998a). Lasota et al. (1996) suggested that some variability in tolerance to avermectins between DBM populations could be due to differences in translaminar uptake of the compounds between different leaf discs.

150
FIPRONIL Tolerance to fipronil in QLD populations has been detected in previous years of the monitoring program and in the baseline study (Endersby & Ridland, 1998b; Endersby et al. 2000a). This year, the tolerance ratio of the QLD population to fipronil remains elevated (2001: 11.03, 7.32 – 17.37, 95% confidence intervals; 2000: 7.77, 4.59 – 14.41, 95% confidence intervals). INDOXACARB No tolerance was shown towards indoxacarb in the populations tested from WA, SA, VIC, TAS or NSW in 2000/2001 (after its first season of use). The QLD population showed a very low tolerance ratio, but the level was not higher than that observed in the baseline study. METHAMIDOPHOS The population from WA showed no tolerance to methamidophos (2000/01). All other populations showed a very low level of tolerance to this insecticide. NOVALURON No tolerance was shown towards novaluron in the populations tested in 1999/00 or 2000/01. PERMETHRIN Tolerance to permethrin was detected in each population tested. The upper 95% confidence intervals for the populations from SA and QLD are approaching the level at which field control failures have been observed with permethrin. SPINOSAD SA, NSW and VIC populations were susceptible to spinosad. Very low levels of tolerance to spinosad were observed in the WA, TAS and QLD populations. Levels were very similar to those observed in populations from these states in the baseline susceptibility studies made in 1997 (Endersby & Ridland 1998c).

151
REFERENCES Baker, G.J. and Kovaliski, J. (1999). Detection of insecticide resistance in Plutella xylostella (L.)
(Lepidoptera: Plutellidae) populations in South Australian crucifer crops. Australian Journal of Entomology 38: 132 – 134.
Endersby, N.M. and Ridland, P.M. (1997). Insecticide resistance in diamondback moth, Plutella xylostella
(L.), in southern Australia. In: (eds. A. Sivapragasam, W.H. Loke, AK Hussan & G.S. Lim) The management of diamondback moth and other crucifer pests. Proceedings of the Third International Workshop, Kuala Lumpur, Malaysia, pp. 290 – 294.
Endersby, N.M. and Ridland, P.M. (1998a). Survey of baseline levels of susceptibility to emamectin
benzoate in Australian populations of Plutella xylostella (L.). Report to Novartis Crop Protection Australasia Limited, 27 pp.
Endersby, N.M. and Ridland, P.M. (1998b). Survey of baseline levels of susceptibility to fipronil in
Australian populations of Plutella xylostella (L.). Report to Rhône-Poulenc Rural Australia Pty Ltd, 41 pp.
Endersby, N.M. and Ridland, P.M. (1998c). Survey of baseline levels of susceptibility to spinosad in
Australian populations of Plutella xylostella (L.). Report to DowAgroSciences, 29 pp. Endersby, N.M., Ridland, P.M. and Zhang, J. (2000a). Assessment of susceptibility to fipronil and
endosulfan in Australian populations of diamondback moth, Plutella xylostella (L.) 1998/99. Report to Aventis CropScience, 18 pp.
Endersby, N.M., Ridland, P.M. and Zhang, J. (2000b). Resistance to permethrin in diamondback moth
populations from vegetable and non-vegetable hosts in southern Australia. Australian Entomological Society 31st AGM & Scientific Conference, Northern Territory University, Darwin 25-30 June.
Finney, D.J. (1971). Probit analysis. 3rd edition, Cambridge University Press, Great Britain. Hargreaves, J.R. (1996). Insecticide resistance and insecticide resistance management strategies for three
vegetable pests in south east Queensland. Horticultural Research and Development Corporation, Project report reference v/0021/r1.
Lasota, J.A., Shelton, A.M., Bolognese, J.A. and Dybas, R.A. (1996). Toxicity of avermectins to diamondback
moth (Lepidoptera: Plutellidae) populations: Implications for susceptibility monitoring. Journal of Economic Entomology 89, 33-38.
Robertson, J.L. and Preisler, H.K. (1992). Pesticide bioassays with arthropods. CRC Press, Inc., Boca
Raton, Florida, USA. Russell, R.M., Robertson, J.L. and Savin, N.E. (1977). POLO: a new computer program for probit analysis.
Bulletin of the Entomological Society of America 23: 209-213. Tabashnik, B.E. and Cushing, N.L. (1987). Leaf residue vs. topical bioassays for assessing insecticide resistance
in the diamondback moth, Plutella xylostella L. FAO Plant Protection Bulletin 35: 11-14.

152
ATTACHMENT 1
Tolerance ratio (assuming parallel slopes for each test) for ten insecticides tested on diamondback moth populations from WA, SA, VIC, NSW, QLD and TAS compared with the standard laboratory population (Waite) 2000/2001. If parallel slopes could not be fitted for a particular assay, then tolerance ratio was calculated at LC50. A tolerance ratio of 1 indicates that a field population is equivalent in susceptibility to the Waite population. ALPHA-CYPERMETHRIN
DBM population State h Tolerance 95% c. i. Gen Ratio Lower Upper Albany WA 48 3.45 2.48 4.86 F3 Castlereagh NSW 48 7.20 5.17 10.33 F2 Gawler TAS 48 9.01 5.52 15.92 F3 Werribee South VIC 48 9.96 6.44 15.41 F1 calculated at LC50 St Kilda SA 48 11.55 6.48 20.59 F2 calculated at LC50 Gatton QLD 48 13.92 8.41 25.26 F1 BACILLUS THURINGIENSIS
DBM population State h Tolerance 95% c. i. Gen Ratio Lower Upper Albany WA 72 0.90 0.50 1.62 F5 calculated at LC50 Gawler TAS 72 1.20 0.67 2.14 F1 St Kilda SA 72 1.79 0.85 3.94 F4 Werribee South VIC 72 1.84 1.12 3.05 F1 Gatton QLD 72 2.81 1.48 5.31 F1 calculated at LC50 Castlereagh NSW 72 2.97 1.71 5.42 F4 Albany WA 96 0.20 0.06 0.72 F5 calculated at LC50 St Kilda SA 96 0.30 0.08 1.17 F4 calculated at LC50 Gatton QLD 96 1.45 0.84 2.51 F1 calculated at LC50 Gawler TAS 96 1.50 0.94 2.40 F1 calculated at LC50 Werribee South VIC 96 1.94 1.21 3.10 F1 calculated at LC50 Castlereagh NSW 96 4.44 2.44 8.33 F4

153
ATTACHMENT 1 (continued) CHLORFENAPYR
DBM population State h Tolerance 95% c. i. Gen Ratio Lower Upper Castlereagh NSW 48 0.47 0.34 0.66 F2 calculated at LC50 Albany WA 48 0.51 0.32 0.77 F2 Gawler TAS 48 0.67 0.44 1.00 F2 St Kilda SA 48 1.43 0.92 2.26 F1 Gatton QLD 48 1.45 0.88 2.41 F1 Werribee South VIC 48 1.47 0.95 2.26 F1 calculated at LC50 Gawler TAS 72 0.35 0.13 0.95 F2 calculated at LC50 Albany WA 72 0.56 0.38 0.83 F2 Castlereagh NSW 72 0.61 0.39 0.96 F2 calculated at LC50 St Kilda SA 72 0.96 0.64 1.46 F1 Gatton QLD 72 1.06 0.68 1.73 F1 Werribee South VIC 72 1.37 0.85 2.23 F1
EMAMECTIN BENZOATE
DBM population State h Tolerance 95% c. i. Gen Ratio Lower Upper Albany WA 48 1.23 0.81 1.88 F3 Gawler TAS 48 1.32 0.82 2.16 F3 Werribee South VIC 48 1.48 0.89 2.57 F2 St Kilda SA 48 1.61 0.98 2.77 F1 Castlereagh NSW 48 1.96 1.05 3.92 F2 Gatton QLD 48 3.50 1.97 7.46 F3 St Kilda SA 72 1.37 0.97 1.93 F1 calculated at LC50 Gawler TAS 72 1.61 1.17 2.24 F3 Werribee South VIC 72 1.97 1.46 2.68 F2 Castlereagh NSW 72 2.23 1.37 3.70 F2 Albany WA 72 2.27 1.64 3.20 F3 Gatton QLD 72 3.19 2.21 4.80 F3 FIPRONIL
DBM population State h Tolerance 95% c. i. Gen Ratio Lower Upper Werribee South VIC 48 1.12 0.78 1.57 F1 Castlereagh NSW 48 1.39 1.01 1.90 F3 calculated at LC50 Albany WA 48 1.72 1.10 2.59 F3 St Kilda SA 48 1.84 1.22 2.72 F2 Gawler TAS 48 1.88 1.44 2.46 F1 calculated at LC50 Gatton QLD 48 10.38 6.73 16.62 F1 Castlereagh NSW 72 1.17 0.89 1.55 F3 Werribee South VIC 72 1.24 0.82 1.87 F1 St Kilda SA 72 1.38 0.88 2.10 F2 Albany WA 72 1.43 0.98 2.07 F3 Gawler TAS 72 1.59 1.21 2.09 F1 calculated at LC50 Gatton QLD 72 11.03 7.32 17.37 F1
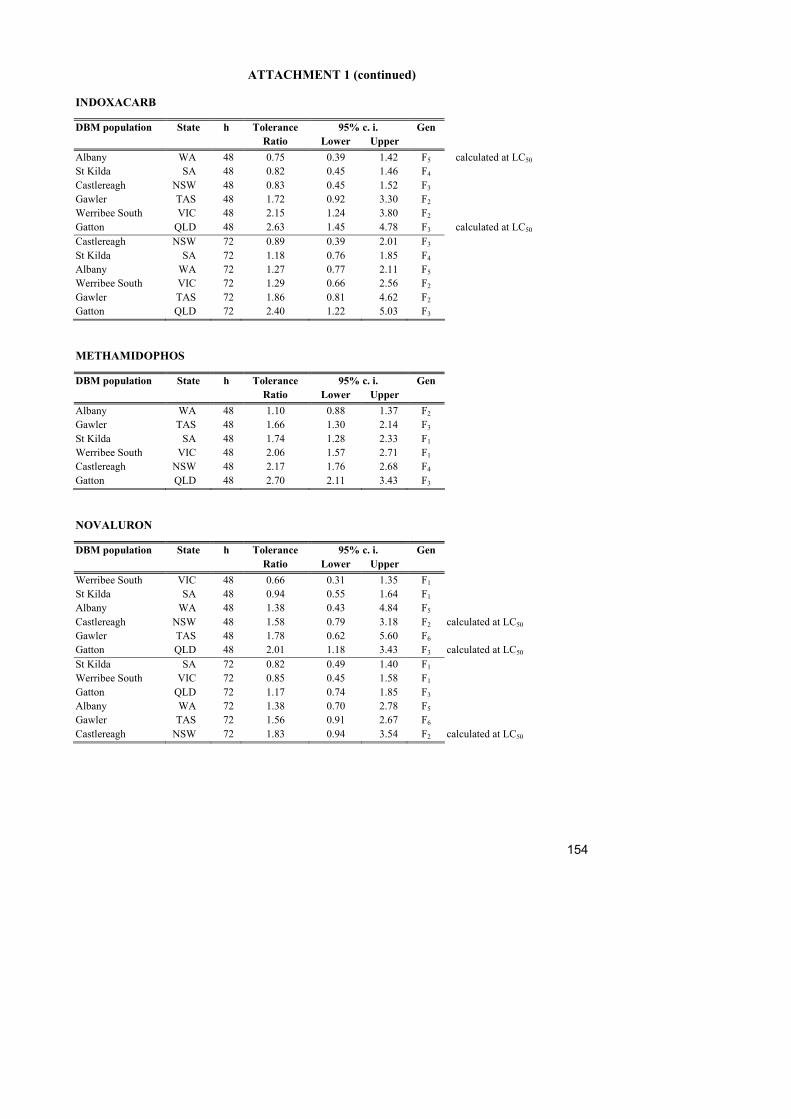
154
ATTACHMENT 1 (continued) INDOXACARB
DBM population State h Tolerance 95% c. i. Gen Ratio Lower Upper Albany WA 48 0.75 0.39 1.42 F5 calculated at LC50 St Kilda SA 48 0.82 0.45 1.46 F4 Castlereagh NSW 48 0.83 0.45 1.52 F3 Gawler TAS 48 1.72 0.92 3.30 F2 Werribee South VIC 48 2.15 1.24 3.80 F2 Gatton QLD 48 2.63 1.45 4.78 F3 calculated at LC50 Castlereagh NSW 72 0.89 0.39 2.01 F3 St Kilda SA 72 1.18 0.76 1.85 F4 Albany WA 72 1.27 0.77 2.11 F5 Werribee South VIC 72 1.29 0.66 2.56 F2 Gawler TAS 72 1.86 0.81 4.62 F2 Gatton QLD 72 2.40 1.22 5.03 F3
METHAMIDOPHOS
DBM population State h Tolerance 95% c. i. Gen Ratio Lower Upper Albany WA 48 1.10 0.88 1.37 F2 Gawler TAS 48 1.66 1.30 2.14 F3 St Kilda SA 48 1.74 1.28 2.33 F1 Werribee South VIC 48 2.06 1.57 2.71 F1 Castlereagh NSW 48 2.17 1.76 2.68 F4 Gatton QLD 48 2.70 2.11 3.43 F3
NOVALURON
DBM population State h Tolerance 95% c. i. Gen Ratio Lower Upper Werribee South VIC 48 0.66 0.31 1.35 F1 St Kilda SA 48 0.94 0.55 1.64 F1 Albany WA 48 1.38 0.43 4.84 F5 Castlereagh NSW 48 1.58 0.79 3.18 F2 calculated at LC50 Gawler TAS 48 1.78 0.62 5.60 F6 Gatton QLD 48 2.01 1.18 3.43 F3 calculated at LC50 St Kilda SA 72 0.82 0.49 1.40 F1 Werribee South VIC 72 0.85 0.45 1.58 F1 Gatton QLD 72 1.17 0.74 1.85 F3 Albany WA 72 1.38 0.70 2.78 F5 Gawler TAS 72 1.56 0.91 2.67 F6 Castlereagh NSW 72 1.83 0.94 3.54 F2 calculated at LC50

155
ATTACHMENT 1 (continued) PERMETHRIN
DBM population State h Tolerance 95% c. i. Gen Ratio Lower Upper Near Gawler TAS 48 4.77 3.50 6.61 F1 Gawler TAS 48 6.47 4.33 10.15 F2 Albany WA 48 6.48 4.24 12.52 F4 Werribee South VIC 48 7.85 5.27 11.68 F1 calculated at LC50 Berwick VIC 48 8.00 5.68 11.75 F1 Lillico TAS 48 8.31 5.36 13.77 F2 Castlereagh NSW 48 9.87 7.31 13.79 F2 Gatton QLD 48 10.63 7.05 16.54 F4 St Kilda SA 48 11.14 7.55 17.28 F1
SPINOSAD
DBM population State h Tolerance 95% c. i. Gen Ratio Lower Upper St Kilda SA 72 0.98 0.60 1.62 F2 Castlereagh NSW 72 1.17 0.91 1.50 F2 Werribee South VIC 72 1.63 1.04 2.61 F1 Gatton QLD 72 2.18 1.34 3.73 F1 Gawler TAS 72 3.24 1.85 6.31 F2 Albany WA 72 3.40 1.59 7.26 F2 calculated at LC50

156
ATTACHMENT 2
LC50 and LC95 for ten insecticides tested on diamondback moth populatiand QLD compared with the standard laboratory population (Waite) 20 ALPHA-CYPERMETHRIN
Date tested Population h n Control Slope ± s.e. Het. g χ2 df LC50 (ppm)
95% confinterv
22-Jun-01 Waite 48 280 40 2.06 ± 0.24 1.47 0.09 38.2 26 18.54 12.95 22-Jun-01 Albany WA 48 283 40 2.51 ± 0.33 0.91 0.07 23.7 26 65.42 52.80 22-Jun-01 St Kilda SA 48 281 40 1.43 ± 0.25 1.84 0.23 47.7 26 214.15 74.72 17-May-01 Waite 48 280 41 1.33 ± 0.19 1.17 0.10 30.3 26 11.34 6.53 17-May-01 Werribee South VIC 48 280 40 2.60 ± 0.33 0.65 0.06 17.0 26 112.99 93.52 31-Jan-01 Waite 48 281 40 2.23 ± 0.25 0.79 0.05 20.6 26 13.36 10.68 31-Jan-01 Castlereagh NSW 48 280 39 1.76 ± 0.19 0.98 0.04 25.6 26 92.98 72.74 07-Jun-01 Waite 48 280 41 1.77 ± 0.22 2.58 0.18 67.1 26 11.53 5.81 07-Jun-01 Gawler TAS 48 280 40 1.89 ± 0.20 1.60 0.08 41.6 26 105.40 77.23 07-Jun-01 Gatton QLD 48 280 40 2.18 ± 0.23 2.05 0.10 53.2 26 165.09 118.93
n=number of subjects, Het.=heterogeneity, s.e.=standard error, df=degrees of freedom

157
ATTACHMENT 2 (continued) LC50 and LC95 for ten insecticides tested on diamondback moth populatiand QLD compared with the standard laboratory population (Waite) 20 BACILLUS THURINGIENSIS
Date tested Population h n Control Slope ± s.e. Het. g χ2 df LC50 (g of product/
100 L)
26-Mar-01 Waite 72 280 40 1.23 ± 0.13 1.19 0.05 64.4 54 0.54 26-Mar-01 Werribee South VIC 72 280 39 1.44 ± 0.14 1.33 0.05 71.6 54 1.01 05-Mar-01 Waite 72 280 40 1.38 ± 0.14 2.17 0.09 117.1 54 1.95 05-Mar-01 Gawler TAS 72 280 40 1.66 ± 0.18 1.07 0.05 57.7 54 2.25 22-May-01 Waite 72 280 40 1.21 ± 0.15 1.11 0.07 59.8 54 1.27 22-May-01 Castlereagh NSW 72 280 40 1.04 ± 0.13 1.05 0.06 56.5 54 4.01 04-Jun-01 Waite 72 280 40 2.08 ± 0.53 1.70 0.44 91.9 54 2.34 04-Jun-01 Gatton QLD 72 280 40 1.09 ± 0.15 1.75 0.13 94.4 54 6.58 12-Sep-01 Waite 72 280 40 1.67 ± 0.31 2.75 0.39 148.6 54 1.20 12-Sep-01 Albany WA 72 281 40 1.13 ± 0.12 2.37 0.10 127.9 54 1.08 12-Sep-01 St Kilda SA 72 280 40 1.31 ± 0.34 1.83 0.50 98.6 54 1.96 26-Mar-01 Waite 96 280 40 1.18 ± 0.13 1.40 0.07 75.5 54 0.26 26-Mar-01 Werribee South VIC 96 280 39 1.57 ± 0.15 1.06 0.04 57.1 54 0.49 05-Mar-01 Waite 96 280 40 1.12 ± 0.12 2.07 0.09 111.6 54 0.86 05-Mar-01 Gawler TAS 96 280 40 1.68 ± 0.19 1.25 0.06 67.5 54 1.29 22-May-01 Waite 96 280 40 1.30 ± 0.15 1.50 0.08 81.1 54 0.55 22-May-01 Castlereagh NSW 96 280 40 1.25 ± 0.29 1.34 0.30 72.6 54 2.41 04-Jun-01 Waite 96 280 40 3.04 ± 0.68 1.95 0.39 105.6 54 1.72 04-Jun-01 Gatton QLD 96 281 40 0.96 ± 0.12 1.93 0.11 104.1 54 2.49 12-Sep-01 Waite 96 280 40 1.08 ± 0.18 1.70 0.20 91.9 54 0.29 12-Sep-01 Albany WA 96 281 40 0.69 ± 0.12 2.39 0.30 129.1 54 0.06 12-Sep-01 St Kilda SA 96 280 40 0.53 ± 0.11 2.27 0.37 122.6 54 0.09
n=number of subjects, Het.=heterogeneity, s.e.=standard error, df=degrees of freedom

158
ATTACHMENT 2 (continued) LC50 and LC95 for ten insecticides tested on diamondback moth populatiand QLD compared with the standard laboratory population (Waite) 20 CHLORFENAPYR
Date tested Population h n Control Slope ± s.e. Het. g χ2 df LC50 (ppm)
95% in
08-May-01 Waite 48 281 40 1.72 ± 0.19 1.66 0.09 43.3 26 44.32 29.9208-May-01 Albany WA 48 280 40 1.95 ± 0.24 1.22 0.08 31.6 26 23.98 15.6108-May-01 St Kilda SA 48 280 40 1.93 ± 0.20 2.24 0.10 58.1 26 65.73 44.7804-Apr-01 Waite 48 279 40 1.82 ± 0.23 1.40 0.09 36.3 26 47.54 30.3504-Apr-01 Werribee South VIC 48 281 40 3.29 ± 0.73 1.65 0.35 42.9 26 69.82 30.3917-Apr-01 Waite 48 280 40 1.71 ± 0.20 0.85 0.05 22.0 26 29.05 20.7917-Apr-01 Gawler TAS 48 279 40 1.29 ± 0.19 0.95 0.08 24.8 26 14.98 8.0006-Feb-01 Waite 48 280 40 3.01 ± 0.32 1.57 0.07 40.9 26 112.37 90.8906-Feb-01 Castlereagh NSW 48 280 40 1.42 ± 0.17 1.51 0.09 39.2 26 53.30 35.1206-Jun-01 Waite 48 281 40 2.24 ± 0.23 4.05 0.17 105.2 26 85.34 54.4006-Jun-01 Gatton QLD 48 280 40 2.60 ± 0.27 2.23 0.10 58.1 26 124.09 93.8608-May-01 Waite 72 281 40 2.77 ± 0.72 1.34 0.38 34.8 26 37.33 9.7008-May-01 Albany WA 72 280 40 2.24 ± 0.31 1.11 0.09 29.0 26 18.58 12.0608-May-01 St Kilda SA 72 280 40 2.30 ± 0.29 1.60 0.11 41.7 26 32.49 20.9704-Apr-01 Waite 72 280 40 2.10 ± 0.28 1.64 0.12 42.6 26 19.60 11.4304-Apr-01 Werribee South VIC 72 282 40 2.04 ± 0.32 1.85 0.19 48.1 26 26.44 10.8717-Apr-01 Waite 72 280 40 2.16 ± 0.30 1.25 0.10 32.4 26 14.96 9.3917-Apr-01 Gawler TAS 72 279 40 1.21 ± 0.24 1.14 0.19 29.6 26 5.24 0.9206-Feb-01 Waite 72 280 40 3.31 ± 0.37 3.42 0.18 89.0 26 55.28 38.5906-Feb-01 Castlereagh NSW 72 280 40 1.58 ± 0.23 1.37 0.12 35.6 26 33.77 17.0506-Jun-01 Waite 72 282 40 2.99 ± 0.51 3.26 0.40 84.7 26 64.24 24.9506-Jun-01 Gatton QLD 72 280 40 2.75 ± 0.29 2.72 0.13 70.6 26 66.96 47.83
n=number of subjects, Het.=heterogeneity, s.e.=standard error, df=degrees of freedom

159
ATTACHMENT 2 (continued) LC50 and LC95 for ten insecticides tested on diamondback moth populatiand QLD compared with the standard laboratory population (Waite) 20 EMAMECTIN BENZOATE
Date tested Population h n Control Slope ± s.e. Het. g χ2 df LC50 (ng/ ml)
95%
18-Jun-01 Waite 48 280 40 1.34 ± 0.18 0.93 0.07 50.0 54 134.85 96.218-Jun-01 Albany WA 48 280 40 1.68 ± 0.26 0.86 0.09 46.4 54 139.42 102.301-May-01 Waite 48 280 40 1.30 ± 0.21 1.17 0.12 63.2 54 116.05 75.601-May-01 St Kilda SA 48 280 40 1.40 ± 0.19 1.35 0.10 72.8 54 175.08 115.902-Apr-01 Waite 48 280 40 1.21 ± 0.21 0.84 0.11 45.2 54 267.53 165.102-Apr-01 Werribee South VIC 48 280 40 1.37 ± 0.22 1.16 0.12 62.5 54 333.08 201.528-May-01 Waite 48 280 40 1.34 ± 0.19 0.70 0.08 37.6 54 218.43 146.128-May-01 Gawler TAS 48 285 40 1.33 ± 0.20 0.99 0.09 53.5 54 293.41 186.912-Feb-01 Waite 48 280 40 1.57 ± 0.22 1.36 0.10 73.4 54 226.09 148.712-Feb-01 Castlereagh NSW 48 279 40 1.21 ± 0.23 1.30 0.19 70.1 54 670.94 312.724-Sep-01 Waite 48 280 40 1.47 ± 0.35 1.07 0.24 58.0 54 205.56 128.424-Sep-01 Gatton QLD 48 280 40 1.67 ± 0.47 0.95 0.30 51.2 54 618.52 345.818-Jun-01 Waite 72 280 40 2.18 ± 0.25 1.21 0.07 65.4 54 27.86 21.018-Jun-01 Albany WA 72 281 40 1.83 ± 0.25 0.97 0.07 52.3 54 63.86 47.601-May-01 Waite 72 280 40 4.06 ± 1.22 1.41 0.51 76.2 54 45.44 26.401-May-01 St Kilda SA 72 280 40 2.24 ± 0.23 1.79 0.08 96.5 54 62.32 47.502-Apr-01 Waite 72 280 40 2.28 ± 0.30 1.20 0.09 65.0 54 36.86 27.202-Apr-01 Werribee South VIC 72 280 40 2.38 ± 0.29 0.96 0.06 51.8 54 72.21 58.528-May-01 Waite 72 280 40 1.93 ± 0.20 0.83 0.04 44.6 54 55.31 44.628-May-01 Gawler TAS 72 285 40 1.81 ± 0.20 1.13 0.06 61.2 54 91.51 70.312-Feb-01 Waite 72 280 40 1.57 ± 0.19 0.96 0.06 51.8 54 121.64 90.912-Feb-01 Castlereagh NSW 72 279 40 1.91 ± 0.42 1.73 0.34 93.3 54 233.79 147.824-Sep-01 Waite 72 280 40 2.05 ± 0.31 0.90 0.09 48.5 54 59.28 42.624-Sep-01 Gatton QLD 72 280 40 2.75 ± 0.47 1.15 0.13 61.9 54 178.00 133.3
n=number of subjects, Het.=heterogeneity, s.e.=standard error, df=degrees of freedom, Waite 1-Ma

160
ATTACHMENT 2 (continued) LC50 and LC95 for ten insecticides tested on diamondback moth populatiand QLD compared with the standard laboratory population (Waite) 20 FIPRONIL
Date tested Population h n Control Slope ± s.e. Het. g χ2 df LC50 (ppm) co
i19-Jun-01 Waite 48 240 40 1.72 ± 0.28 1.15 0.12 53.0 46 1.78 1.219-Jun-01 St Kilda SA 48 280 40 1.50 ± 0.16 0.81 0.04 44.0 54 3.59 2.715-Jun-01 Waite 48 241 39 1.56 ± 0.27 1.17 0.14 53.7 46 2.30 1.515-Jun-01 Albany WA 48 281 40 1.74 ± 0.20 1.15 0.06 62.2 54 3.65 2.627-Mar-01 Waite 48 241 40 2.06 ± 0.29 1.34 0.10 61.5 46 1.34 1.027-Mar-01 Werribee South VIC 48 280 40 1.94 ± 0.19 1.03 0.04 55.6 54 1.53 1.206-Mar-01 Waite 48 240 40 3.42 ± 0.51 1.38 0.13 63.5 46 0.70 0.506-Mar-01 Gawler TAS 48 280 40 2.07 ± 0.21 1.24 0.05 66.8 54 1.31 1.014-Mar-01 Waite 48 239 40 2.78 ± 0.35 1.56 0.10 71.8 46 1.00 0.814-Mar-01 Castlereagh NSW 48 280 40 1.54 ± 0.17 1.02 0.05 55.0 54 1.38 1.005-Jun-01 Waite 48 240 40 1.79 ± 0.25 1.46 0.11 67.2 46 1.06 0.705-Jun-01 Gatton QLD 48 280 40 1.56 ± 0.20 1.02 0.07 55.3 54 12.00 8.419-Jun-01 Waite 72 240 40 1.95 ± 0.27 1.33 0.10 61.0 46 0.77 0.519-Jun-01 St Kilda SA 72 281 40 1.42 ± 0.16 1.19 0.06 64.1 54 1.08 0.715-Jun-01 Waite 72 241 39 2.10 ± 0.28 1.50 0.10 68.8 46 0.92 0.715-Jun-01 Albany WA 72 281 40 1.88 ± 0.20 1.22 0.06 66.1 54 1.34 1.027-Mar-01 Waite 72 241 40 2.31 ± 0.29 1.49 0.09 68.7 46 0.72 0.527-Mar-01 Werribee South VIC 72 280 40 2.25 ± 0.26 2.61 0.14 140.7 54 0.90 0.606-Mar-01 Waite 72 240 40 3.45 ± 0.56 2.83 0.30 130.3 46 0.47 0.306-Mar-01 Gawler TAS 72 280 40 2.05 ± 0.25 2.15 0.13 116.0 54 0.75 0.514-Mar-01 Waite 72 240 40 3.10 ± 0.43 1.53 0.12 70.4 46 0.67 0.514-Mar-01 Castlereagh NSW 72 280 40 2.63 ± 0.37 1.05 0.08 56.5 54 0.79 0.605-Jun-01 Waite 72 240 40 1.87 ± 0.24 1.51 0.10 69.5 46 0.57 0.405-Jun-01 Gatton QLD 72 280 40 1.68 ± 0.18 1.21 0.06 65.5 54 6.41 4.7
n=number of subjects, Het.=heterogeneity, s.e.=standard error, df=degrees of freedom

161
ATTACHMENT 2 (continued) LC50 and LC95 for ten insecticides tested on diamondback moth populatiand QLD compared with the standard laboratory population (Waite) 20 INDOXACARB
Date tested Population h n Control Slope ± s.e. Het. g χ2 df LC50 (ppm)
95% coninterv
15-May-01 Waite 48 279 40 1.43 ± 0.15 1.71 0.08 92.2 54 19.81 12.98 15-May-01 Werribee South VIC 48 281 40 1.03 ± 0.14 0.90 0.07 48.4 54 59.86 35.95 23-Apr-01 Waite 48 280 40 0.93 ± 0.13 0.89 0.07 48.1 54 24.22 14.79 23-Apr-01 Gawler TAS 48 280 40 0.95 ± 0.13 0.57 0.07 31.0 54 40.55 24.70 13-Mar-01 Waite 48 280 40 0.95 ± 0.14 0.65 0.08 34.8 54 73.33 41.34 13-Mar-01 Castlereagh NSW 48 281 40 1.24 ± 0.18 1.22 0.10 66.0 54 43.23 27.03 18-Sep-01 Waite 48 280 40 1.17 ± 0.16 1.01 0.07 54.4 54 65.95 40.56 18-Sep-01 Albany WA 48 280 40 2.04 ± 0.28 0.85 0.07 46.0 54 49.20 36.93 18-Sep-01 St Kilda SA 48 280 40 1.31 ± 0.16 1.17 0.07 63.0 54 47.11 30.38 01-Oct-01 Waite 48 279 41 1.66 ± 0.17 1.01 0.04 54.4 54 17.22 12.80 01-Oct-01 Gatton QLD 48 280 40 1.14 ± 0.14 1.40 0.09 75.4 54 45.26 26.79 15-May-01 Waite 72 279 40 1.05 ± 0.13 1.09 0.06 58.8 54 3.84 2.47 15-May-01 Werribee South VIC 72 281 40 0.84 ± 0.11 1.49 0.10 80.5 54 4.89 2.63 23-Apr-01 Waite 72 280 40 0.66 ± 0.12 1.35 0.19 72.9 54 0.23 0.03 23-Apr-01 Gawler TAS 72 280 40 0.94 ± 0.13 1.19 0.09 64.0 54 0.84 0.39 13-Mar-01 Waite 72 280 40 0.69 ± 0.11 1.32 0.12 71.2 54 2.29 1.05 13-Mar-01 Castlereagh NSW 72 281 40 0.85 ± 0.11 1.39 0.10 75.0 54 2.30 1.17 18-Sep-01 Waite 72 280 40 1.21 ± 0.14 0.77 0.05 41.4 54 5.02 3.49 18-Sep-01 Albany WA 72 280 40 1.03 ± 0.12 1.13 0.06 61.1 54 6.55 4.37 18-Sep-01 St Kilda SA 72 280 40 1.45 ± 0.15 1.17 0.05 62.9 54 5.79 4.21 01-Oct-01 Waite 72 280 40 1.28 ± 0.16 3.24 0.21 175.0 54 0.76 0.25 01-Oct-01 Gatton QLD 72 280 41 1.27 ± 0.15 0.94 0.05 50.7 54 1.81 1.26
n=number of subjects, Het.=heterogeneity, s.e.=standard error, df=degrees of freedom

162
ATTACHMENT 2 (continued) LC50 and LC95 for ten insecticides tested on diamondback moth populatiand QLD compared with the standard laboratory population (Waite) 20 METHAMIDOPHOS
Date tested Population h n Control Slope ± s.e. Het. g χ2 df LC50 (ppm)
95% cointe
02-May-01 Waite 48 280 40 4.31 ± 0.63 1.01 0.09 26.3 26 248.51 204.96 02-May-01 St Kilda SA 48 280 40 3.16 ± 0.36 1.94 0.11 50.4 26 420.57 316.12 02-May-01 Albany WA 48 280 40 3.38 ± 0.60 0.92 0.12 24.0 26 268.26 193.90 19-Mar-01 Waite 48 280 40 3.71 ± 0.45 2.08 0.13 54.2 26 170.99 128.95 19-Mar-01 Werribee South VIC 48 280 40 2.91 ± 0.32 0.93 0.05 24.3 26 347.54 287.53 31-May-01 Waite 48 282 40 4.97 ± 0.85 1.08 0.13 28.1 26 188.58 151.32 31-May-01 Gawler TAS 48 282 40 3.91 ± 0.40 1.72 0.07 44.8 26 312.43 259.61 23-May-01 Waite 48 280 40 4.55 ± 0.50 1.00 0.05 25.9 26 184.32 163.34 23-May-01 Castlereagh NSW 48 280 40 4.09 ± 0.44 1.42 0.07 36.9 26 401.98 339.84 20-Sep-01 Waite 48 281 40 3.77 ± 0.41 1.40 0.07 36.4 26 171.91 145.44 20-Sep-01 Gatton QLD 48 280 40 4.45 ± 0.65 1.41 0.13 36.6 26 467.82 374.63
n=number of subjects, Het.=heterogeneity, s.e.=standard error, df=degrees of freedom

163
ATTACHMENT 2 (continued) LC50 and LC95 for ten insecticides tested on diamondback moth populatiand QLD compared with the standard laboratory population (Waite) 20 NOVALURON
Date tested Population h n Control Slope ± s.e. Het. g χ2 df LC50 (ppm)
95%
07-May-01 Waite 48 278 40 1.07 ± 0.23 0.95 0.17 51.4 54 114.05 7107-May-01 St Kilda SA 48 280 40 1.28 ± 0.18 0.66 0.07 35.7 54 94.83 6609-Apr-01 Waite 48 280 40 0.83 ± 0.15 0.75 0.13 40.3 54 105.45 5809-Apr-01 Werribee South VIC 48 281 40 0.80 ± 0.11 0.96 0.08 51.9 54 72.04 4319-Feb-01 Waite 48 279 40 1.49 ± 0.22 0.95 0.09 51.0 54 59.28 4219-Feb-01 Castlereagh NSW 48 278 39 0.85 ± 0.18 1.19 0.23 64.1 54 93.82 5010-Sep-01 Waite 48 280 40 1.29 ± 0.15 5.00 0.27 270.0 54 49.33 2210-Sep-01 Gawler TAS 48 280 40 1.53 ± 0.21 0.49 0.07 26.2 54 82.18 6117-Sep-01 Waite 48 280 40 1.55 ± 0.17 1.13 0.06 60.9 54 39.59 2817-Sep-01 Albany WA 48 280 40 1.21 ± 0.15 3.67 0.22 198.0 54 57.82 2917-Sep-01 Gatton QLD 48 280 40 1.07 ± 0.14 2.09 0.14 112.7 54 79.64 447-May-01 Waite 72 278 40 1.22 ± 0.22 1.22 0.16 65.8 54 34.56 177-May-01 St Kilda SA 72 280 40 1.20 ± 0.14 0.80 0.05 43.1 54 28.23 1909-Apr-01 Waite 72 280 0 0.80 ± 0.10 1.09 0.07 59.1 54 13.96 809-Apr-01 Werribee South VIC 72 281 40 1.03 ± 0.11 0.96 0.05 51.9 54 12.53 819-Feb-01 Waite 72 279 39 1.26 ± 0.15 0.82 0.06 44.3 54 23.14 1519-Feb-01 Castlereagh NSW 72 279 39 0.75 ± 0.10 1.16 0.09 62.9 54 42.27 2410-Sep-01 Waite 72 280 40 1.28 ± 0.13 1.67 0.07 90.2 54 18.24 1110-Sep-01 Gawler TAS 72 280 40 1.42 ± 0.15 0.79 0.05 42.5 54 28.59 2017-Sep-01 Waite 72 279 40 1.60 ± 0.21 0.81 0.06 43.9 54 16.06 1017-Sep-01 Albany WA 72 280 40 1.37 ± 0.14 2.37 0.10 127.7 54 21.08 1217-Sep-01 Gatton QLD 72 280 40 1.36 ± 0.17 0.87 0.06 47.1 54 17.59 11
n=number of subjects, Het.=heterogeneity, s.e.=standard error, df=degrees of freedom

164
ATTACHMENT 2 (continued) LC50 and LC95 for ten insecticides tested on diamondback moth populatiand QLD compared with the standard laboratory population (Waite) 20 PERMETHRIN
Date tested Population h n Control Slope ± s.e. Het. g χ2 df LC50 (ppm)
95% confinterv
12-May-01 Waite 48 280 40 2.41 ± 0.27 1.13 0.06 29.3 26 10.39 7.91 12-May-01 St Kilda SA 48 280 40 1.92 ± 0.28 2.04 0.18 53.1 26 112.27 73.01 21-Mar-01 Waite 48 280 40 2.14 ± 0.24 0.86 0.05 22.3 26 9.29 7.08 21-Mar-01 Werribee South VIC 48 280 40 1.46 ± 0.21 0.85 0.08 22.2 26 72.93 52.53 18-Apr-01 Waite 48 280 40 2.15 ± 0.28 1.07 0.08 27.8 26 9.31 6.20 18-Apr-01 Gawler TAS 48 280 40 1.78 ± 0.19 1.74 0.08 45.3 26 56.35 41.28 18-Apr-01 Berwick VIC 48 281 40 1.64 ± 0.18 0.69 0.05 18.0 26 68.31 54.15 07-Feb-01 Waite 48 280 40 2.39 ± 0.25 1.35 0.06 35.2 26 20.28 15.87 07-Feb-01 Castlereagh NSW 48 280 40 1.95 ± 0.27 0.71 0.08 18.5 26 210.45 163.27 12-May-01 Waite 48 280 40 2.41 ± 0.27 1.13 0.06 29.3 26 10.39 7.91 12-May-01 Near Gawler TAS 48 280 39 2.13 ± 0.28 1.20 0.09 31.3 26 47.89 33.44 30-May-01 Waite 48 280 40 1.71 ± 0.23 1.61 0.13 41.9 26 4.90 2.39 30-May-01 Lillico TAS 48 228 32 1.37 ± 0.20 0.78 0.08 20.4 26 34.72 24.23 21-Aug-01 Waite 48 280 40 1.70 ± 0.24 1.21 0.10 31.4 26 4.19 2.27 21-Aug-01 Albany WA 48 280 40 1.57 ± 0.20 1.18 0.08 30.7 26 25.41 17.53 15-Nov-01 Waite 48 280 40 1.96 ± 0.21 2.57 0.12 66.9 26 14.45 9.16 15-Nov-01 Gatton QLD 48 320 40 1.58 ± 0.16 0.88 0.04 26.5 26 147.44 116.91
n=number of subjects, Het.=heterogeneity, s.e.=standard error, df=degrees of freedom

165
ATTACHMENT 2 (continued) LC50 and LC95 for ten insecticides tested on diamondback moth populatiand QLD compared with the standard laboratory population (Waite) 20 SPINOSAD
Date tested Population h n Control Slope ± s.e. Het. g χ2 df LC50 (ppm)
95%
24-Apr-01 Waite 72 280 39 1.30 ± 0.26 1.24 0.21 32.2 26 0.04 024-Apr-01 Albany WA 72 279 40 2.53 ± 0.35 0.99 0.08 25.7 26 0.15 024-Apr-01 Gawler TAS 72 280 40 1.43 ± 0.21 1.39 0.12 36.1 26 0.16 014-Jun-01 Waite 72 278 41 1.60 ± 0.25 1.62 0.16 42.2 26 0.22 014-Jun-01 St Kilda SA 72 280 40 1.81 ± 0.28 1.23 0.12 32.1 26 0.22 014-Jun-01 Gatton QLD 72 280 40 1.78 ± 0.20 1.72 0.09 44.8 26 0.48 003-Apr-01 Waite 72 280 40 1.84 ± 0.21 1.52 0.08 39.5 26 0.23 003-Apr-01 Werribee South VIC 72 280 40 1.70 ± 0.18 2.04 0.09 52.9 26 0.37 013-Feb-01 Waite 72 280 39 2.67 ± 0.32 1.07 0.07 27.7 26 0.14 013-Feb-01 Castlereagh NSW 72 280 39 3.34 ± 0.42 1.10 0.07 28.6 26 0.16 0
n=number of subjects, Het.=heterogeneity, s.e.=standard error, df=degrees of freedom

166
APPENDIX E
BIOASSAY RESULTS 2001/2002 FOR NATIONAL INSECTICIDE RESISTANCE TESTING PROGRAM Nancy M. Endersby, Peter M. Ridland, Jingye Zhang Institute for Horticultural Development, Knoxfield, Private Bag 15, Ferntree Gully Delivery Centre VIC 3156 BACKGROUND The National Insecticide Resistance Testing Program for diamondback moth (DBM), Plutella xylostella (L.) was established in 1999. The program involves testing of field populations of DBM from each major Brassica producing state with a variety of new and long-established insecticides to detect substantial changes in susceptibility and to confirm resistance in the event of field control failure. The data collected provide information to the industry on the progress of the AVCARE DBM Insecticide Resistance Management strategy. This report gives details of results for 2001/2002. The major pest of Brassica vegetables in Australia is diamondback moth (DBM), Plutella xylostella (L.). This pest has developed insecticide resistance due to prophylactic use of insecticides over many years. Insecticide resistance has caused control failures and economic loss in vegetable crops. Resistance to synthetic pyrethroid insecticides has been identified in DBM populations from vegetable growing areas in all states and resistance to organophosphate insecticides has been identified in some states. Recently, low levels of resistance have also been documented in DBM populations from canola, forage brassicas and brassicaceous weeds (Endersby et al. 2000b). Earliest resistance testing of DBM in Australia was conducted by Hargreaves (1996), followed by Baker and Kovaliski (1999) and Endersby and Ridland (1997). In 1997, a project funded by the Horticultural Research and Development Corporation “Advancing the integrated management of DBM in crucifer vegetables” was established with additional funding from major agrochemical companies. Also in 1997, AIRAC (AVCARE's Insecticide Resistance Action Committee), in consultation with researchers, devised a two-window insecticide resistance management strategy for DBM. By late 1998, chlorfenapyr and fipronil had both been registered for control of DBM and so the two-window strategy was launched to growers around Australia. The strategy is reviewed regularly and is updated as new products become registered. Five products are currently partitioned into the two-window strategy. In southern Australia, Secure® (chlorfenapyr) and Success® (spinosad) may be used from 1st September to 31st January, whereas Regent®, Proclaim® and Avatar® may be used from 1st February to 31st August. Window strategies have also been published for WA and Qld. METHODS Larvae of diamondback moth were collected from Brassica crops in New South Wales, South Australia, Tasmania, Western Australia and Victoria (Table 1) and were reared on cabbage seedling leaves (Brassica oleracea var. capitata cv. Green Coronet) in the laboratory at 25 °C (16h:8h, L:D) for one to six generations. A susceptible laboratory population of diamondback

167
moth, maintained at IHD Knoxfield since it was obtained from the University of Adelaide, Department of Crop Protection Waite Campus, SA, in 1994, was used as a reference. Table 1. Origin and generation of Australian diamondback moth populations tested for susceptibility to insecticides, 2001/2002
Population Origin Generation tested
Waite Laboratory population * WA Wanneroo F1 – F3 SA Virginia (broccoli) F1 – F3 VIC Lindenow (cabbage) F1 – F2 TAS Devonport (fresh market broccoli) F1 – F2 NSW Cowra (cauliflower) F1 – F2 QLD Gatton (cabbage) F1 – F2
A leaf dip bioassay after Tabashnik and Cushing (1987) was adopted for testing susceptibility to each insecticide. Variations in method for some insecticides were determined by company preferences or were those used in previous monitoring programs for the particular insecticide. For example, fipronil is tested worldwide at 22°C and indoxacarb was tested at 25°C. The remaining insecticides were all tested at 28°C (Table 2). Cabbage leaf discs of 4.5 cm diameter were dipped for 5 s in distilled water solutions of formulated insecticide and hung vertically to dry in a fume hood for 2 h. Control discs were dipped in distilled water. No wetting agents were used except for Bond Spraymate with emamectin benzoate and X-77 with indoxacarb. Discs were placed into Gelman 50 mm diameter x 9 mm plastic Petri dishes. For bioassays of Regentand those running to 96 h, five third instar DBM larvae were placed on each disc and eight replicates of each concentration were set up. For each of the shorter bioassays, ten larvae were placed on each disc and four replicates of each concentration were set up. Mortality was assessed at different times for different insecticides (Table 2). Larvae were considered dead if they did not move when touched with a paintbrush. Table 2. Insecticides tested, assessment times and temperatures used in bioassays of
diamondback moth, Plutella xylostella from Australia, 2001/2002
Insecticide Product name Assessment times Temperature
alpha-cypermethrin Fastac 48 h 28°C Bacillus thuringiensis Delfin WG 72 h, 96 h 28°C chlorfenapyr Secure 48 h, 72 h 28°C emamectin benzoate Proclaim 48 h, 72 h 28°C fipronil Regent 48 h, 72 h 22°C indoxacarb Avatar 48 h, 72 h 25°C methamidophos Nitofol 48 h 28°C novaluron Rim On 48 h, 72 h 28°C permethrin Ambush 48 h 28°C spinosad Success 72 h 28°C
Analysis Concentration-mortality data for each population were analysed using the probit analysis program, POLO-PC (Russell et al. 1977) (LeOra Software). We used the program to estimate the lethal concentration expected to cause 50% mortality (LC50) of each insecticide for each

168
diamondback moth population and the 95% confidence intervals for these concentrations. The slope (+ standard error) of the probit line was also estimated. The program also performed χ2 tests for goodness-of-fit of the data to the probit model. If the model fits, the calculated value of χ2 is less than the χ2 table value for the appropriate degrees of freedom. If the model does not fit (i.e. the χ2 value exceeds the table value), the LC50 value for the particular population may not be reliably estimated and is adjusted with the heterogeneity factor (χ2/df). The index of significance for potency estimation (g) was used to calculate 95% confidence intervals for potency (relative potency is equivalent to tolerance ratio) (Robertson and Preisler 1992). Parallelism of the probit regression lines implies a constant relative potency at all levels of response (Finney 1971). Equality and parallelism of the slopes of the probit lines for the field population and the laboratory susceptible population were also tested for by POLO-PC. If the slopes are parallel, then overlap of the 95% confidence intervals for the two populations indicates that no significant difference exists between the LC50 values. RESULTS A summary of the results comparing the levels of tolerance to the test insecticides for the six populations tested in 2001/2002 is presented in Table 3. 2000/2001 tolerance ratios are included for comparison. The 2001/2002 summary is based on comprehensive listings of tolerance ratios for the ten insecticides tested on diamondback moth populations from WA, SA, VIC, TAS, NSW and QLD compared with the standard laboratory population (Waite), provided in Attachment 1. A tolerance ratio of 1 indicates that a field population is equivalent in susceptibility to the Waite population. Similarly, the values of LC50 and LC95 and associated statistics from the probit analyses for the ten insecticides tested on diamondback moth populations from WA, SA, VIC, TAS, NSW and QLD compared with the standard laboratory population (Waite) 2001/2002 are listed in Attachment 2.
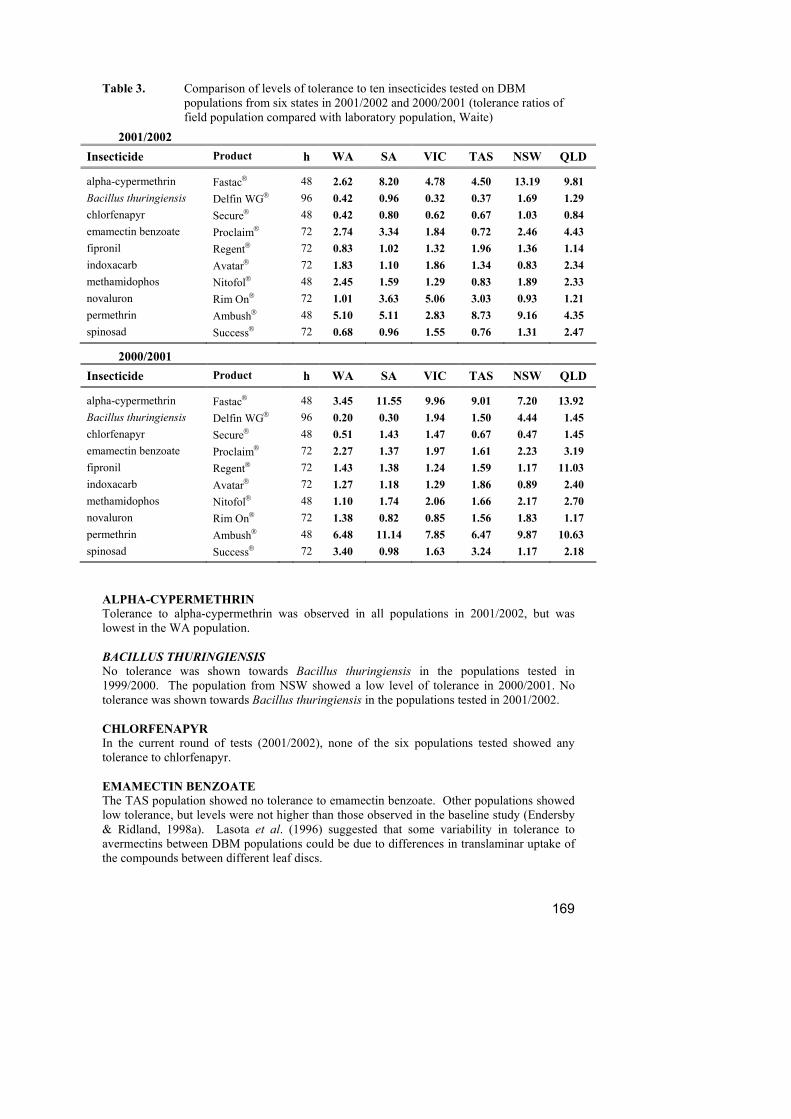
169
Table 3. Comparison of levels of tolerance to ten insecticides tested on DBM populations from six states in 2001/2002 and 2000/2001 (tolerance ratios of field population compared with laboratory population, Waite)
2001/2002 Insecticide Product h WA SA VIC TAS NSW QLD
alpha-cypermethrin Fastac 48 2.62 8.20 4.78 4.50 13.19 9.81 Bacillus thuringiensis Delfin WG 96 0.42 0.96 0.32 0.37 1.69 1.29 chlorfenapyr Secure 48 0.42 0.80 0.62 0.67 1.03 0.84 emamectin benzoate Proclaim 72 2.74 3.34 1.84 0.72 2.46 4.43 fipronil Regent 72 0.83 1.02 1.32 1.96 1.36 1.14 indoxacarb Avatar 72 1.83 1.10 1.86 1.34 0.83 2.34 methamidophos Nitofol 48 2.45 1.59 1.29 0.83 1.89 2.33 novaluron Rim On 72 1.01 3.63 5.06 3.03 0.93 1.21 permethrin Ambush 48 5.10 5.11 2.83 8.73 9.16 4.35 spinosad Success 72 0.68 0.96 1.55 0.76 1.31 2.47
2000/2001 Insecticide Product h WA SA VIC TAS NSW QLD
alpha-cypermethrin Fastac 48 3.45 11.55 9.96 9.01 7.20 13.92 Bacillus thuringiensis Delfin WG 96 0.20 0.30 1.94 1.50 4.44 1.45 chlorfenapyr Secure 48 0.51 1.43 1.47 0.67 0.47 1.45 emamectin benzoate Proclaim 72 2.27 1.37 1.97 1.61 2.23 3.19 fipronil Regent 72 1.43 1.38 1.24 1.59 1.17 11.03 indoxacarb Avatar 72 1.27 1.18 1.29 1.86 0.89 2.40 methamidophos Nitofol 48 1.10 1.74 2.06 1.66 2.17 2.70 novaluron Rim On 72 1.38 0.82 0.85 1.56 1.83 1.17 permethrin Ambush 48 6.48 11.14 7.85 6.47 9.87 10.63 spinosad Success 72 3.40 0.98 1.63 3.24 1.17 2.18
ALPHA-CYPERMETHRIN Tolerance to alpha-cypermethrin was observed in all populations in 2001/2002, but was lowest in the WA population. BACILLUS THURINGIENSIS No tolerance was shown towards Bacillus thuringiensis in the populations tested in 1999/2000. The population from NSW showed a low level of tolerance in 2000/2001. No tolerance was shown towards Bacillus thuringiensis in the populations tested in 2001/2002. CHLORFENAPYR In the current round of tests (2001/2002), none of the six populations tested showed any tolerance to chlorfenapyr. EMAMECTIN BENZOATE The TAS population showed no tolerance to emamectin benzoate. Other populations showed low tolerance, but levels were not higher than those observed in the baseline study (Endersby & Ridland, 1998a). Lasota et al. (1996) suggested that some variability in tolerance to avermectins between DBM populations could be due to differences in translaminar uptake of the compounds between different leaf discs.

170
FIPRONIL Tolerance to fipronil in populations from Queensland has been detected in previous years of the monitoring program and in the baseline study (Endersby & Ridland, 1998b; Endersby et al. 2000a), but was not detected in the population tested this season:
2001/2002: 1.14 (0.76 – 1.68; 95% confidence intervals) 2000/2001: 11.03 (7.32 – 17.37; 95% confidence intervals) 1999/2000: 7.77 (4.59 – 14.41; 95% confidence intervals) INDOXACARB No tolerance was shown towards indoxacarb in the populations tested from SA, VIC, TAS or NSW in 2001/2002 (after its second season of use). The WA and QLD population showed a very low tolerance ratio, but the levels were not higher than those observed in the baseline study made in 1999/2000 before indoxacarb was registered or used. METHAMIDOPHOS The population from TAS was susceptible to methamidophos. All other populations showed a very low level of tolerance to this insecticide. NOVALURON The TAS, SA and VIC populations of DBM showed an elevated tolerance to novaluron, but this insecticide has not yet been registered or used in the field. PERMETHRIN Tolerance to permethrin was detected in each population tested. The upper 95% confidence intervals for the populations from TAS and NSW are approaching the level at which field control failures have been observed with permethrin. SPINOSAD TAS, WA, SA, NSW and VIC populations were susceptible to spinosad. A very low level of tolerance to spinosad was observed in the QLD population, but the level was within the limits observed in the baseline susceptibility studies made in 1997 (Endersby & Ridland 1998c). DISCUSSION No resistance was detected to Bacillus thuringiensis, chlorfenapyr and fipronil in the populations of DBM tested in 2001/2002. Some elevated tolerance ratios in spinosad, emamectin and indoxacarb were observed, but were not higher than those found in the baseline studies made before the insecticides were registered and used. The Victorian population of DBM showed an elevated tolerance to novaluron, but this insecticide has not yet been registered or used in the field. There is a slightly elevated tolerance to methamidophos in DBM from WA and QLD, but resistance to synthetic pyrethroids continues to be the main problem in Australian populations of DBM in both vegetable crops and canola. Several DBM populations from canola in WA were tested in a separate study in October November 2001 and revealed high levels of resistance to permethrin (Geraldton WA (1) resistance ratio = 15.1 (10.4 - 23.3, 95% confidence intervals), Geraldton WA (2) resistance ratio = 17.2 (11.8 - 27.0, 95% confidence intervals)). The methods and sample sizes used in the National Insecticide Resistance Testing Program are able to detect substantial changes in susceptibility to insecticides by DBM and confirm resistance in case of a field control failure. If resistance is to be detected at the stage when it occurs at a low frequency in the population, very large numbers of field collected larvae (30, 000+) would have to be screened. In southern Australia, the opportunity to collect large numbers of DBM eggs usually occurs in November to December. Estimation of frequency of resistant individuals in one or two large populations of DBM is an option for future study.

171
REFERENCES Baker, G.J. and Kovaliski, J. (1999). Detection of insecticide resistance in Plutella xylostella
(L.) (Lepidoptera: Plutellidae) populations in South Australian crucifer crops. Australian Journal of Entomology 38: 132 – 134.
Endersby, N.M. and Ridland, P.M. (1997). Insecticide resistance in diamondback moth,
Plutella xylostella (L.), in southern Australia. In: (eds. A. Sivapragasam, W.H. Loke, AK Hussan & G.S. Lim) The management of diamondback moth and other crucifer pests. Proceedings of the Third International Workshop, Kuala Lumpur, Malaysia, pp. 290 – 294.
Endersby, N.M. and Ridland, P.M. (1998a). Survey of baseline levels of susceptibility to
emamectin benzoate in Australian populations of Plutella xylostella (L.). Report to Novartis Crop Protection Australasia Limited, 27 pp.
Endersby, N.M. and Ridland, P.M. (1998b). Survey of baseline levels of susceptibility to
fipronil in Australian populations of Plutella xylostella (L.). Report to Rhône-Poulenc Rural Australia Pty Ltd, 41 pp.
Endersby, N.M. and Ridland, P.M. (1998c). Survey of baseline levels of susceptibility to
spinosad in Australian populations of Plutella xylostella (L.). Report to DowAgroSciences, 29 pp.
Endersby, N.M., Ridland, P.M. and Zhang, J. (2000a). Assessment of susceptibility to
fipronil and endosulfan in Australian populations of diamondback moth, Plutella xylostella (L.) 1998/99. Report to Aventis CropScience, 18 pp.
Endersby, N.M., Ridland, P.M. and Zhang, J. (2000b). Resistance to permethrin in
diamondback moth populations from vegetable and non-vegetable hosts in southern Australia. Australian Entomological Society 31st AGM & Scientific Conference, Northern Territory University, Darwin 25-30 June.
Finney, D.J. (1971). Probit analysis. 3rd edition, Cambridge University Press, Great Britain. Hargreaves, J.R. (1996). Insecticide resistance and insecticide resistance management
strategies for three vegetable pests in south east Queensland. Horticultural Research and Development Corporation, Project report reference v/0021/r1.
Lasota, J.A., Shelton, A.M., Bolognese, J.A. and Dybas, R.A. (1996). Toxicity of avermectins to
diamondback moth (Lepidoptera: Plutellidae) populations: Implications for susceptibility monitoring. Journal of Economic Entomology 89, 33-38.
Robertson, J.L. and Preisler, H.K. (1992). Pesticide bioassays with arthropods. CRC Press,
Inc., Boca Raton, Florida, USA. Russell, R.M., Robertson, J.L. and Savin, N.E. (1977). POLO: a new computer program for
probit analysis. Bulletin of the Entomological Society of America 23: 209-213. Tabashnik, B.E. and Cushing, N.L. (1987). Leaf residue vs. topical bioassays for assessing
insecticide resistance in the diamondback moth, Plutella xylostella L. FAO Plant Protection Bulletin 35: 11-14.

172
ATTACHMENT 1 Tolerance ratio (assuming parallel slopes for each test) for ten insecticides tested on diamondback moth populations from WA, SA, VIC, NSW, QLD and TAS compared with the standard laboratory population (Waite) 2001/2002. If parallel slopes could not be fitted for a particular assay, then tolerance ratio was calculated at LC50. A tolerance ratio of 1 indicates that a field population is equivalent in susceptibility to the Waite population. ALPHA-CYPERMETHRIN
DBM population State h Tolerance 95% c. i. Gen Ratio Lower Upper Wanneroo WA 48 2.62 1.36 5.05 F2 Calculated at LC50 Devonport TAS 48 4.50 3.43 5.98 F1 Lindenow VIC 48 4.78 2.57 9.45 F1 Virginia SA 48 8.20 5.32 13.42 F1 Gatton QLD 48 9.81 7.23 13.80 F1 Cowra NSW 48 13.19 9.30 19.70 F1 BACILLUS THURINGIENSIS
DBM population State h Tolerance 95% c. i. Gen Ratio Lower Upper Devonport TAS 72 0.23 0.11 0.43 F2 Lindenow VIC 72 0.28 0.17 0.47 F2 Wanneroo WA 72 0.73 0.42 1.26 F1 Virginia SA 72 1.24 0.70 2.22 F2 Calculated at LC50 Cowra NSW 72 1.54 0.83 2.87 F1 Gatton QLD 72 1.83 1.09 3.04 F2 Calculated at LC50 Lindenow VIC 96 0.32 0.17 0.58 F2 Devonport TAS 96 0.37 0.17 0.75 F2 Wanneroo WA 96 0.42 0.22 0.79 F1 Virginia SA 96 0.96 0.49 1.84 F2 Gatton QLD 96 1.29 0.60 2.77 F2 Calculated at LC50 Cowra NSW 96 1.69 0.91 3.20 F1

173
ATTACHMENT 1 (continued) CHLORFENAPYR
DBM population State h Tolerance 95% c. i. Gen Ratio Lower Upper Wanneroo WA 48 0.42 0.06 Not calculated F2 Lindenow VIC 48 0.62 0.39 0.99 F1 Calculated at LC50 Devonport TAS 48 0.67 0.44 1.01 F2 Gatton QLD 48 0.79 0.58 1.08 F2 Calculated at LC50 Virginia SA 48 0.80 0.36 1.70 F1 Cowra NSW 48 1.08 0.82 1.43 F1 Wanneroo WA 72 Not calculated Not calculated Not calculated F2 Lindenow VIC 72 0.47 0.25 0.88 F1 Calculated at LC50 Virginia SA 72 0.65 Not calculated Not calculated F1 Devonport TAS 72 0.78 0.48 1.24 F2 Gatton QLD 72 0.84 0.62 1.11 F2 Cowra NSW 72 1.03 0.76 1.39 F1
EMAMECTIN BENZOATE
DBM population State h Tolerance 95% c. i. Gen Ratio Lower Upper Devonport TAS 48 0.73 0.41 1.30 F2 Calculated at LC50 Cowra NSW 48 1.74 1.10 2.85 F1 Virginia SA 48 2.69 1.50 5.24 F3 Gatton QLD 48 3.04 1.50 7.12 F2 Wanneroo WA 48 4.15 2.63 6.99 F2 Lindenow VIC 48 4.93 2.94 9.11 F2 Devonport TAS 72 0.72 0.35 1.24 F2 Lindenow VIC 72 1.84 0.88 4.00 F2 Cowra NSW 72 2.46 1.75 3.51 F1 Wanneroo WA 72 2.74 1.72 4.60 F2 Virginia SA 72 3.34 1.95 6.16 F3 Gatton QLD 72 4.43 2.54 8.52 F2

174
ATTACHMENT 1 (continued) FIPRONIL
DBM population State h Tolerance 95% c. i. Gen Ratio Lower Upper Virginia SA 48 1.02 0.74 1.39 F2 Gatton QLD 48 1.31 0.94 1.79 F2 Wanneroo WA 48 1.40 0.91 2.05 F2 Devonport TAS 48 1.42 0.78 2.37 F1 Lindenow VIC 48 1.50 1.03 2.14 F2 Cowra NSW 48 1.75 1.24 2.46 F1 Calculated at LC50 Wanneroo WA 72 0.83 0.52 1.24 F2 Virginia SA 72 1.02 0.74 1.38 F2 Gatton QLD 72 1.14 0.76 1.68 F2 Lindenow VIC 72 1.32 0.87 1.96 F2 Cowra NSW 72 1.36 0.94 1.95 F1 Devonport TAS 72 1.96 1.16 3.16 F1 INDOXACARB
DBM population State h Tolerance 95% c. i. Gen Ratio Lower Upper Virginia SA 48 0.97 0.56 1.71 F2 Wanneroo WA 48 1.18 0.76 1.81 F3 Lindenow VIC 48 1.29 0.72 2.33 F2 Cowra NSW 48 2.00 1.22 3.34 F2 Devonport TAS 48 2.12 1.09 4.17 F2 Gatton QLD 48 3.30 2.03 5.51 F2 Cowra NSW 72 0.83 0.49 1.43 F2 Calculated at LC50 Virginia SA 72 1.10 0.61 1.97 F2 Devonport TAS 72 1.34 0.68 2.62 F2 Wanneroo WA 72 1.83 1.14 2.96 F3 Lindenow VIC 72 1.86 1.00 3.63 F2 Gatton QLD 72 2.34 1.41 3.99 F2

175
ATTACHMENT 1 (continued) METHAMIDOPHOS
DBM population State h Tolerance 95% c. i. Gen Ratio Lower Upper Devonport TAS 48 0.83 0.60 1.14 F2 Calculated at LC50 Lindenow VIC 48 1.29 1.05 1.58 F2 Calculated at LC50 Virginia SA 48 1.59 1.26 2.00 F2 Calculated at LC50 Cowra NSW 48 1.89 1.53 2.34 F2 Calculated at LC50 Gatton QLD 48 2.33 1.96 2.77 F1 Calculated at LC50 Wanneroo WA 48 2.45 2.01 3.00 F2 Calculated at LC50
NOVALURON
DBM population State h Tolerance 95% c. i. Gen Ratio Lower Upper Cowra NSW 48 1.05 0.19 5.93 F1 Wanneroo WA 48 1.11 0.56 2.23 F1 Devonport TAS 48 2.41 1.30 4.56 F2 Virginia SA 48 3.48 1.43 10.17 F1 Lindenow VIC 48 3.81 1.80 8.70 F2 Gatton QLD 48 4.31 1.68 11.10 F2 Calculated at LC50 Cowra NSW 72 0.93 0.35 2.43 F1 Wanneroo WA 72 1.01 0.53 1.94 F1 Gatton QLD 72 1.21 0.66 2.21 F2 Calculated at LC50 Devonport TAS 72 3.03 1.54 5.94 F2 Virginia SA 72 3.63 2.14 6.31 F1 Lindenow VIC 72 5.06 2.50 10.36 F2
PERMETHRIN
DBM population State h Tolerance 95% c. i. Gen Ratio Lower Upper Lindenow VIC 48 2.83 2.11 3.80 F1 Calculated at LC50 Gatton QLD 48 4.36 3.10 6.26 F1 Wanneroo WA 48 5.10 3.71 7.01 F2 Calculated at LC50 Virginia SA 48 5.11 4.07 6.40 F1 Devonport TAS 48 8.73 5.37 14.20 F1 Calculated at LC50 Cowra NSW 48 9.16 5.91 14.20 F1 Calculated at LC50
SPINOSAD
DBM population State h Tolerance 95% c. i. Gen Ratio Lower Upper Wanneroo WA 72 0.68 0.43 1.07 F2 Devonport TAS 72 0.76 0.51 1.13 F2 Virginia SA 72 0.96 0.42 2.13 F2 Cowra NSW 72 1.31 0.83 2.09 F1 Lindenow VIC 72 1.55 1.07 2.29 F2 Gatton QLD 72 2.47 1.61 3.89 F1

176
ATTACHMENT 2
LC50 and LC95 for ten insecticides tested on diamondback moth populatiand QLD compared with the standard laboratory population (Waite) 20 ALPHA-CYPERMETHRIN
Date tested Population H n Control Slope ± s.e. Het. g χ2 df LC50 (ppm)
95% confinterv
24-Jan-02 Waite – Lab popln. 48 280 40 2.77 ± 0.33 0.48 0.06 12.6 26 26.25 20.95 24-Jan-02 Devonport TAS 48 280 40 2.95 ± 0.59 0.67 0.15 17.5 26 117.90 91.43 18-Apr-02 Waite – Lab popln. 48 280 40 2.01 ± 0.23 0.77 0.05 20.0 26 14.69 11.54 18-Apr-02 Wanneroo WA 48 280 40 1.02 ± 0.16 1.49 0.15 38.9 26 38.52 13.40 29-Apr-02 Waite – Lab popln. 48 280 40 2.30 ± 0.29 1.53 0.11 39.9 26 9.82 6.88 29-Apr-02 Virginia SA 48 280 40 2.10 ± 0.24 2.32 0.13 60.2 26 78.84 54.61 29-Apr-02 Lindenow VIC 48 280 40 1.82 ± 0.22 3.46 0.21 90.0 26 42.81 22.41 19-Jun-02 Waite – Lab popln. 48 280 40 2.51 ± 0.36 0.61 0.08 15.9 26 8.58 6.41 19-Jun-02 Cowra NSW 48 280 40 1.85 ± 0.24 1.41 0.10 36.6 26 103.56 70.04 19-Jun-02 Gatton QLD 48 280 40 2.18 ± 0.37 1.19 0.14 30.9 26 81.27 55.03
n=number of subjects, Het.=heterogeneity, s.e.=standard error, df=degrees of freedom

177
ATTACHMENT 2 (continued)
LC50 and LC95 for ten insecticides tested on diamondback moth populatiand QLD compared with the standard laboratory population (Waite) 20 BACILLUS THURINGIENSIS
Date tested Population h n Control Slope ± s.e. Het. g χ2 df LC50 (g of product/
100 L)
95% in
14-Mar-02 Waite – Lab popln. 72 280 40 1.15 ± 0.12 1.39 0.06 74.9 54 1.09 0.7214-Mar-02 Devonport TAS 72 280 40 1.34 ± 0.18 1.53 0.12 82.5 54 0.27 0.1014-Mar-02 Wanneroo WA 72 281 40 1.23 ± 0.12 1.18 0.05 63.6 54 0.80 0.5529-May-02 Waite – Lab popln. 72 280 40 1.30 ± 0.13 1.77 0.07 95.3 54 1.09 0.7029-May-02 Lindenow VIC 72 280 40 1.36 ± 0.14 0.84 0.04 45.1 54 0.31 0.2227-Jun-02 Waite – Lab popln. 72 280 40 1.07 ± 0.12 1.72 0.08 92.7 54 1.41 0.8627-Jun-02 Cowra NSW 72 281 40 1.42 ± 0.15 1.73 0.08 93.2 54 2.04 1.3604-Jul-02 Waite – Lab popln. 72 280 40 1.67 ± 0.15 1.58 0.05 85.1 54 0.79 0.5504-Jul-02 Virginia SA 72 280 40 1.02 ± 0.14 1.25 0.10 67.6 54 0.98 0.5004-Jul-02 Gatton QLD 72 280 40 0.90 ± 0.11 1.05 0.06 56.7 54 1.44 0.9314-Mar-02 Waite – Lab popln. 96 280 40 1.14 ± 0.13 1.38 0.07 74.4 54 0.51 0.2914-Mar-02 Devonport TAS 96 280 40 1.49 ± 0.25 1.34 0.16 72.2 54 0.22 0.0714-Mar-02 Wanneroo WA 96 280 40 1.19 ± 0.14 1.54 0.09 83.3 54 0.22 0.1129-May-02 Waite – Lab popln. 96 280 40 1.26 ± 0.13 1.69 0.07 91.3 54 0.43 0.2729-May-02 Lindenow VIC 96 280 40 1.27 ± 0.17 0.93 0.07 50.0 54 0.14 0.0727-Jun-02 Waite – Lab popln. 96 280 40 1.34 ± 0.15 1.66 0.08 89.4 54 0.65 0.3827-Jun-02 Cowra NSW 96 280 40 1.40 ± 0.13 2.31 0.08 124.9 54 1.11 0.6804-Jul-02 Waite – Lab popln. 96 280 40 1.31 ± 0.13 2.04 0.08 109.9 54 0.32 0.1904-Jul-02 Virginia SA 96 280 40 1.25 ± 0.16 1.37 0.09 73.9 54 0.31 0.1504-Jul-02 Gatton QLD 96 280 40 0.92 ± 0.14 1.31 0.13 70.9 54 0.42 0.15
n=number of subjects, Het.=heterogeneity, s.e.=standard error, df=degrees of freedom

178
ATTACHMENT 2 (continued) LC50 and LC95 for ten insecticides tested on diamondback moth populatiand QLD compared with the standard laboratory population (Waite) 20 CHLORFENAPYR
Date tested Population h n Control Slope ± s.e. Het. g χ2 df LC50 (ppm)
22-Apr-02 Waite – Lab popln. 48 280 40 2.39 ± 0.26 4.26 0.22 110.7 26 27.42 22-Apr-02 Virginia SA 48 280 40 2.21 ± 0.26 5.52 0.32 143.5 26 21.10 22-Apr-02 Lindenow VIC 48 280 40 1.57 ± 0.20 3.28 0.22 85.3 26 17.03 22-Apr-02 Wanneroo WA 48 280 40 2.73 ± 0.40 68.44 6.02 1779.4 26 12.29 No
4-Mar-02 Waite – Lab popln. 48 280 40 1.73 ± 0.24 0.91 0.07 23.7 26 19.05 4-Mar-02 Devonport TAS 48 280 40 1.75 ± 0.26 0.87 0.08 22.6 26 12.95 5-Jul-02 Waite – Lab popln. 48 280 40 3.41 ± 0.38 2.07 0.11 53.9 26 47.37 35-Jul-02 Cowra NSW 48 280 40 3.23 ± 0.42 0.93 0.07 24.1 26 50.82 49-Jul-02 Waite – Lab popln. 48 280 40 3.22 ± 0.38 1.07 0.06 27.7 26 36.34 29-Jul-02 Gatton QLD 48 280 40 1.98 ± 0.23 0.70 0.05 18.3 26 28.72 222-Apr-02 Waite – Lab popln. 72 280 40 2.85 ± 0.40 21.54 1.76 560.0 26 18.24 No
22-Apr-02 Virginia SA 72 280 40 2.77 ± 0.40 103.41 0.00 2688.8 26 Not calculated No
22-Apr-02 Lindenow VIC 72 280 40 1.55 ± 0.24 4.12 0.40 107.1 26 8.60 22-Apr-02 Wanneroo WA 72 280 40 Not calculated 26 Not calculated No
4-Mar-02 Waite – Lab popln. 72 280 40 2.11 ± 0.32 1.34 0.13 34.8 26 12.02 4-Mar-02 Devonport TAS 72 280 40 2.94 ± 0.58 0.61 0.15 16.0 26 11.73 5-Jul-02 Waite – Lab popln. 72 280 40 3.76 ± 0.45 2.08 0.13 54.1 26 33.06 25-Jul-02 Cowra NSW 72 280 40 5.91 ± 1.11 0.64 0.14 16.6 26 36.77 39-Jul-02 Waite – Lab popln. 72 280 40 3.27 ± 0.41 1.00 0.06 26.0 26 22.61 9-Jul-02 Gatton QLD 72 280 40 2.67 ± 0.39 0.43 0.08 11.1 26 17.53
n=number of subjects, Het.=heterogeneity, s.e.=standard error, df=degrees of freedom

179
ATTACHMENT 2 (continued) LC50 and LC95 for ten insecticides tested on diamondback moth populatiand QLD compared with the standard laboratory population (Waite) 20 EMAMECTIN BENZOATE
Date tested Population h n Control Slope ± s.e. Het. g χ2 df LC50 (ng/ ml)
95% confideintervals
25-Mar-02 Waite – Lab popln. 48 282 40 1.58 ± 0.22 3.85 0.32 100.2 26 297.99 143.12 225-Mar-02 Devonport TAS 48 280 41 3.03 ± 0.77 3.45 0.93 89.7 26 218.33 Not calculated No
09-Apr-02 Waite – Lab popln. 48 280 40 1.27 ± 0.16 1.17 0.08 30.4 26 88.32 61.93 09-Apr-02 Wanneroo WA 48 280 40 1.58 ± 0.24 0.77 0.09 20.0 26 288.62 194.78 28-May-02 Waite – Lab popln. 48 280 40 1.38 ± 0.16 1.70 0.10 44.2 26 39.09 26.59 28-May-02 Lindenow VIC 48 280 41 1.22 ± 0.22 0.86 0.12 22.4 26 210.29 134.24 2-Jul-02 Waite – Lab popln. 48 280 40 1.28 ± 0.19 0.80 0.09 20.9 26 239.00 155.52 2-Jul-02 Cowra NSW 48 280 40 1.69 ± 0.25 0.82 0.09 21.2 26 291.77 199.76 18-Jul-02 Waite – Lab popln. 48 282 40 1.35 ± 0.19 1.61 0.14 41.8 26 218.35 131.72 18-Jul-02 Virginia SA 48 282 40 1.23 ± 0.24 0.81 0.15 21.2 26 697.90 348.66 218-Jul-02 Gatton QLD 48 282 40 1.03 ± 0.22 1.21 0.24 31.3 26 1156.94 418.22 1725-Mar-02 Waite – Lab popln. 72 282 40 6.27 ± 3.76 1.31 2.00 34.1 26 236.34 Not calculated No
25-Mar-02 Devonport TAS 72 280 41 3.43 ± 0.83 3.38 0.83 87.8 26 152.17 Not calculated No
09-Apr-02 Waite – Lab popln. 72 280 40 2.34 ± 0.40 2.07 0.26 53.8 26 44.51 22.57 09-Apr-02 Wanneroo WA 72 280 40 2.20 ± 0.32 1.69 0.15 44.0 26 122.58 85.65 28-May-02 Waite – Lab popln. 72 280 40 2.27 ± 0.24 6.15 0.28 159.8 26 19.21 9.81 28-May-02 Lindenow VIC 72 280 41 2.88 ± 0.44 1.43 0.14 37.1 26 36.44 25.82 2-Jul-02 Waite – Lab popln. 72 280 40 2.47 ± 0.25 1.45 0.06 37.7 26 28.01 22.28 2-Jul-02 Cowra NSW 72 280 40 1.99 ± 0.22 1.32 0.07 34.3 26 71.44 55.12 18-Jul-02 Waite – Lab popln. 72 282 40 1.44 ± 0.17 2.29 0.13 59.6 26 60.21 39.49 18-Jul-02 Virginia SA 72 282 40 1.58 ± 0.23 1.19 0.11 31.0 26 187.99 128.37 18-Jul-02 Gatton QLD 72 283 40 1.22 ± 0.22 0.72 0.12 18.7 26 315.22 189.90
n=number of subjects, Het.=heterogeneity, s.e.=standard error, df=degrees of freedom

180
ATTACHMENT 2 (continued) LC50 and LC95 for ten insecticides tested on diamondback moth populatiand QLD compared with the standard laboratory population (Waite) 20 FIPRONIL
Date tested Population h n Control Slope ± s.e. Het. g χ2 df LC50 (ppm) co
i30-Jan-02 Waite – Lab popln. 48 240 40 2.47 ± 0.97 0.90 0.59 41.5 46 4.27 3.030-Jan-02 Devonport TAS 48 280 40 1.48 ± 0.19 1.04 0.07 56.1 54 10.81 7.506-May-02 Waite – Lab popln. 48 240 40 1.79 ± 0.30 0.61 0.11 28.2 46 2.63 1.806-May-02 Wanneroo WA 48 281 40 1.71 ± 0.19 0.84 0.05 45.2 54 3.80 2.817-Jun-02 Waite – Lab popln. 48 240 40 2.18 ± 0.28 1.32 0.09 60.7 46 1.02 0.817-Jun-02 Lindenow VIC 48 280 40 1.58 ± 0.16 1.10 0.05 59.6 54 1.67 1.217-Jun-02 Cowra NSW 48 280 40 1.54 ± 0.16 1.01 0.04 54.4 54 1.78 1.323-Jul-02 Waite – Lab popln. 48 240 40 2.24 ± 0.31 1.01 0.08 46.5 46 1.46 1.123-Jul-02 Virginia SA 48 280 40 2.06 ± 0.20 1.09 0.04 58.7 54 1.55 1.223-Jul-02 Gatton QLD 48 280 40 1.87 ± 0.18 0.88 0.03 47.3 54 2.06 1.630-Jan-02 Waite – Lab popln. 72 240 40 1.80 ± 0.33 1.66 0.22 76.4 46 2.59 1.630-Jan-02 Devonport TAS 72 280 40 1.64 ± 0.17 1.21 0.05 65.2 54 5.52 4.006-May-02 Waite – Lab popln. 72 240 40 1.76 ± 0.26 0.91 0.08 41.7 46 1.58 1.206-May-02 Wanneroo WA 72 281 40 1.44 ± 0.18 0.88 0.06 47.6 54 1.44 0.917-Jun-02 Waite – Lab popln. 72 240 40 2.39 ± 0.40 1.05 0.12 48.4 46 0.80 0.617-Jun-02 Lindenow VIC 72 280 40 1.64 ± 0.18 1.39 0.07 75.2 54 1.07 0.717-Jun-02 Cowra NSW 72 280 40 1.68 ± 0.18 1.13 0.05 61.1 54 1.11 0.823-Jul-02 Waite – Lab popln. 72 240 40 2.66 ± 0.34 1.27 0.08 58.4 46 0.90 0.723-Jul-02 Virginia SA 72 280 40 2.11 ± 0.24 1.13 0.06 61.1 54 0.95 0.723-Jul-02 Gatton QLD 72 280 40 2.29 ± 0.26 1.93 0.10 104.3 54 1.04 0.7
n=number of subjects, Het.=heterogeneity, s.e.=standard error, df=degrees of freedom Bold=90% c.i.

181
ATTACHMENT 2 (continued)
LC50 and LC95 for ten insecticides tested on diamondback moth populatiand QLD compared with the standard laboratory population (Waite) 20 INDOXACARB
Date tested Population h n Control Slope ± s.e. Het. g χ2 df LC50 (ppm)
95% coninter
19-Mar-02 Waite – Lab popln. 48 280 40 1.29 ± 0.15 1.00 0.05 26.1 26 26.06 17.95 19-Mar-02 Devonport TAS 48 280 40 0.98 ± 0.17 1.36 0.16 35.4 26 76.09 37.46 24-Apr-02 Waite – Lab popln. 48 280 40 1.16 ± 0.14 0.78 0.05 20.3 26 26.95 18.26 24-Apr-02 Virginia SA 48 280 40 0.99 ± 0.13 0.56 0.06 14.5 26 30.93 19.66 22-May-02 Waite – Lab popln. 48 280 40 1.11 ± 0.12 0.85 0.05 22.0 26 7.71 5.43 22-May-02 Lindenow VIC 48 280 40 1.27 ± 0.13 2.06 0.09 53.6 26 9.53 5.87 18-Jun-02 Waite – Lab popln. 48 280 40 1.64 ± 0.16 0.80 0.04 20.7 26 14.32 10.79 18-Jun-02 Wanneroo WA 48 280 40 1.97 ± 0.36 1.22 0.17 31.7 26 16.57 9.87 17-Jul-02 Waite – Lab popln. 48 280 40 1.27 ± 0.13 1.03 0.05 26.7 26 11.16 7.91 17-Jul-02 Cowra NSW 48 280 40 1.08 ± 0.13 0.69 0.06 18.0 26 25.10 16.75 17-Jul-02 Gatton QLD 48 280 40 1.26 ± 0.15 0.82 0.06 21.2 26 37.22 25.17 19-Mar-02 Waite – Lab popln. 72 280 40 1.24 ± 0.13 1.66 0.08 43.2 26 3.54 2.24 19-Mar-02 Devonport TAS 72 280 40 1.00 ± 0.14 1.48 0.12 38.6 26 4.58 2.01 24-Apr-02 Waite – Lab popln. 72 280 40 1.50 ± 0.16 1.72 0.08 44.8 26 2.16 1.41 24-Apr-02 Virginia SA 72 280 40 1.17 ± 0.13 1.37 0.07 35.5 26 2.21 1.37 22-May-02 Waite – Lab popln. 72 280 40 1.13 ± 0.18 0.99 0.10 36.9 26 0.32 0.14 22-May-02 Lindenow VIC 72 280 40 1.17 ± 0.17 1.42 0.13 25.8 26 0.62 0.25 18-Jun-02 Waite – Lab popln. 72 280 40 1.59 ± 0.20 1.39 0.09 36.0 26 1.07 0.69 18-Jun-02 Wanneroo WA 72 280 40 1.43 ± 0.20 0.91 0.07 23.6 26 1.87 1.14 17-Jul-02 Waite – Lab popln. 72 280 40 1.62 ± 0.20 1.46 0.09 37.9 26 1.10 0.69 17-Jul-02 Cowra NSW 72 280 40 1.14 ± 0.14 2.08 0.14 54.1 26 0.92 0.39 17-Jul-02 Gatton QLD 72 280 40 1.19 ± 0.14 1.15 0.06 29.8 26 2.23 1.44
n=number of subjects, Het.=heterogeneity, s.e.=standard error, df=degrees of freedom

182
ATTACHMENT 2 (continued) LC50 and LC95 for ten insecticides tested on diamondback moth populatiand QLD compared with the standard laboratory population (Waite) 20 METHAMIDOPHOS
Date tested Population h n Control Slope ± s.e. Het. g χ2 df LC50 (ppm)
95% cointe
6-Mar-02 Waite – Lab popln. 48 280 40 5.12 ± 0.58 1.37 0.07 35.6 26 197.62 171.36 6-Mar-02 Devonport TAS 48 280 40 2.11 ± 0.29 1.53 0.12 39.8 26 163.30 101.10 6-Mar-02 Wanneroo WA 48 280 40 3.28 ± 0.38 1.19 0.07 31.0 26 484.81 399.45 24-May-02 Waite – Lab popln. 48 281 40 6.40 ± 1.41 1.36 0.28 35.4 26 268.07 205.54 24-May-02 Lindenow VIC 48 280 41 2.58 ± 0.26 1.83 0.08 47.6 26 254.57 199.65 12-Jun-02 Waite – Lab popln. 48 280 40 6.82 ± 1.02 1.03 0.10 26.8 26 105.63 94.96 12-Jun-02 Virginia SA 48 280 40 3.30 ± 0.45 0.78 0.07 20.3 26 167.56 132.21 12-Jun-02 Gatton QLD 48 280 40 3.44 ± 0.35 0.67 0.04 17.3 26 246.33 213.83 26-Jul-02 Waite – Lab popln. 48 280 40 4.12 ± 0.43 1.74 0.08 45.4 26 253.16 211.40 26-Jul-02 Cowra NSW 48 281 40 2.77 ± 0.27 1.06 0.04 27.6 26 479.03 402.15
n=number of subjects, Het.=heterogeneity, s.e.=standard error, df=degrees of freedom

183
ATTACHMENT 2 (continued)
LC50 and LC95 for ten insecticides tested on diamondback moth populatiand QLD compared with the standard laboratory population (Waite) 20 NOVALURON
Date tested Population h n Control Slope ± s.e. Het. g χ2 df LC50 (ppm)
95% confidenintervals
18-Mar-02 Waite – Lab popln. 48 280 40 1.23 ± 0.14 1.13 0.06 29.3 26 30.91 21.12 4518-Mar-02 Devonport TAS 48 280 40 1.30 ± 0.31 1.68 0.39 43.8 26 73.78 33.26 14418-Mar-02 Wanneroo WA 48 280 40 1.09 ± 0.12 1.87 0.10 48.7 26 35.10 20.52 6431-May-02 Waite – Lab popln. 48 280 40 1.01 ± 0.11 1.63 0.08 42.5 26 17.65 10.20 3031-May-02 Lindenow VIC 48 280 40 0.86 ± 0.12 1.57 0.14 40.8 26 72.27 39.45 17301-Jul-02 Waite – Lab popln. 48 280 40 1.36 ± 0.16 7.02 0.38 182.6 26 43.51 15.79 14901-Jul-02 Cowra NSW 48 280 40 1.47 ± 0.16 18.25 0.95 474.5 26 45.01 Not calculated Not ca
01-Jul-02 Virginia SA 48 280 40 1.29 ± 0.22 0.99 0.11 25.6 26 156.80 105.56 29216-Jul-02 Waite – Lab popln. 48 280 40 1.20 ± 0.14 2.97 0.18 77.2 26 50.28 26.57 11216-Jul-02 Gatton QLD 48 280 40 0.72 ± 0.12 1.58 0.18 41.0 26 216.84 90.21 127018-Mar-02 Waite – Lab popln. 72 280 40 1.41 ± 0.14 1.16 0.05 30.1 26 11.28 7.60 16.018-Mar-02 Devonport TAS 72 280 40 1.14 ± 0.21 1.84 0.27 48.0 26 31.64 9.16 70.218-Mar-02 Wanneroo WA 72 281 40 1.16 ± 0.11 1.76 0.07 45.9 26 10.63 6.16 17.531-May-02 Waite – Lab popln. 72 280 40 1.31 ± 0.14 1.49 0.07 38.6 26 3.82 2.23 5.931-May-02 Lindenow VIC 72 280 40 1.24 ± 0.20 1.93 0.22 50.1 26 18.82 6.27 36.301-Jul-02 Waite – Lab popln. 72 280 40 1.29 ± 0.13 1.96 0.09 51.0 26 16.60 9.84 27.001-Jul-02 Cowra NSW 72 280 40 1.53 ± 0.15 11.34 0.44 294.7 26 15.85 3.37 56.401-Jul-02 Virginia SA 72 280 40 1.23 ± 0.23 0.47 0.14 12.2 26 60.45 39.05 92.016-Jul-02 Waite – Lab popln. 72 280 40 1.72 ± 0.17 11.71 0.46 304.5 26 16.91 3.75 56.516-Jul-02 Gatton QLD 72 280 40 0.96 ± 0.15 1.25 0.13 32.5 26 20.42 9.67 36.5
n=number of subjects, Het.=heterogeneity, s.e.=standard error, df=degrees of freedom

184
ATTACHMENT 2 (continued) LC50 and LC95 for ten insecticides tested on diamondback moth populatiand QLD compared with the standard laboratory population (Waite) 20 PERMETHRIN
Date tested Population H n Control Slope ± s.e. Het. g χ2 df LC50 (ppm)
9
20-Dec-01 Waite – Lab popln. 48 280 40 2.37 ± 0.25 0.91 0.04 23.6 26 32.92 220-Dec-01 Devonport TAS 48 280 40 1.45 ± 0.22 0.57 0.09 14.9 26 287.44 1912-Apr-02 Waite – Lab popln. 48 279 40 2.74 ± 0.28 2.56 0.11 66.6 26 33.07 212-Apr-02 Wanneroo WA 48 280 40 1.85 ± 0.23 1.50 0.10 39.0 26 168.62 1212-Apr-02 Lindenow VIC 48 279 40 1.70 ± 0.19 1.17 0.07 30.5 26 93.67 701-May-02 Waite – Lab popln. 48 280 40 4.03 ± 0.45 1.28 0.07 33.2 26 28.82 201-May-02 Virginia SA 48 280 40 3.71 ± 0.56 1.10 0.11 28.6 26 146.91 1211-Jun-02 Waite – Lab popln. 48 280 40 2.77 ± 0.28 2.42 0.11 62.9 26 27.32 211-Jun-02 Cowra NSW 48 280 40 1.48 ± 0.22 0.85 0.08 22.2 26 250.21 1711-Jun-02 Gatton QLD 48 280 40 2.50 ± 0.27 1.44 0.07 37.3 26 120.00 9
n=number of subjects, Het.=heterogeneity, s.e.=standard error, df=degrees of freedom

185
ATTACHMENT 2 (continued) LC50 and LC95 for ten insecticides tested on diamondback moth populatiand QLD compared with the standard laboratory population (Waite) 20 SPINOSAD
Date tested Population h n Control Slope ± s.e. Het. g χ2 df LC50 (ppm)
95
25-Feb-02 Waite – Lab popln. 72 280 40 2.31 ± 0.41 1.17 0.15 30.3 26 0.20 025-Feb-02 Devonport TAS 72 280 40 3.08 ± 0.51 1.64 0.19 42.7 26 0.16 026-Apr-02 Waite – Lab popln. 72 280 40 2.53 ± 0.27 10.11 0.48 262.8 26 0.26 026-Apr-02 Virginia SA 72 280 40 2.68 ± 0.30 2.18 0.12 56.6 26 0.25 014-May-02 Waite – Lab popln. 72 280 40 1.65 ± 0.22 0.72 0.07 18.6 26 1.22 014-May-02 Wanneroo WA 72 280 40 1.73 ± 0.17 2.06 0.09 53.6 26 0.81 021-May-02 Waite – Lab popln. 72 280 40 1.97 ± 0.28 1.16 0.10 30.3 26 0.16 021-May-02 Lindenow VIC 72 280 40 1.79 ± 0.20 1.18 0.06 30.6 26 0.25 014-Jun-02 Waite – Lab popln. 72 280 40 1.79 ± 0.19 1.88 0.09 49.0 26 0.34 014-Jun-02 Gatton QLD 72 280 40 1.88 ± 0.19 1.42 0.06 37.0 26 0.82 014-Jun-02 Cowra NSW 72 279 40 1.61 ± 0.17 1.58 0.07 41.0 26 0.45 0
n=number of subjects, Het.=heterogeneity, s.e.=standard error, df=degrees of freedom

186
APPENDIX F
BIOASSAY RESULTS 2002/2003 FOR NATIONAL INSECTICIDE RESISTANCE TESTING PROGRAM
Nancy M. Endersby, Peter M. Ridland, Jingye Zhang Department of Primary Industries, Research & Development Division, Knoxfield, Private Bag 15, Ferntree Gully Delivery Centre VIC 3156, AUSTRALIA BACKGROUND
The National Insecticide Resistance Testing Program for diamondback moth (DBM), Plutella xylostella (L.), was established in 1999. The program involves testing of field populations of DBM from each major Brassica producing state with a variety of new and long-established insecticides to detect substantial changes in susceptibility and to confirm resistance in the event of field control failure. The data collected provide information to the industry on the progress of the AVCARE DBM Insecticide Resistance Management strategy. This report gives details of results for 2002/2003.
The major pest of Brassica vegetables in Australia is diamondback moth (DBM), Plutella xylostella (L.). This pest has developed insecticide resistance due to prophylactic use of insecticides over many years. Insecticide resistance has caused control failures and economic loss in vegetable crops. Resistance to synthetic pyrethroid insecticides has been identified in DBM populations from vegetable growing areas in all states and resistance to organophosphate insecticides has been identified in some states. Recently, low levels of resistance have also been documented in DBM populations from canola, forage brassicas and brassicaceous weeds (Endersby et al. 2000b). Earliest resistance testing of DBM in Australia was conducted by Hargreaves (1996), followed by Baker and Kovaliski (1999) and Endersby and Ridland (1997). In 1997, a project funded by the Horticultural Research and Development Corporation “Advancing the integrated management of DBM in crucifer vegetables VG97014” was established. Additional funding from major agrochemical companies supported insecticide resistance bioassays of DBM. Also in 1997, AIRAC (AVCARE's Insecticide Resistance Action Committee), in consultation with researchers, devised a two-window insecticide resistance management strategy for DBM. By late 1998, chlorfenapyr and fipronil had both been registered for control of DBM and so the two-window strategy was launched to growers around Australia. The strategy is reviewed regularly and is updated as new products become registered or new management tactics become available. Five products are currently partitioned into the two-window strategy. In southern Australia, Secure® (chlorfenapyr) and Success® (spinosad) may be used from 1st September to 31st January, whereas Regent®, Proclaim® and Avatar® may be used from 1st February to 31st August. Window strategies have also been published for Western Australia and Queensland. A second project, " Implementing Pest Management of Diamondback Moth (DBM) VG00055", funded by Horticulture Australia Ltd, began in 2000 and was also supported by additional agrochemical company funding which allowed the National DBM Insecticide Resistance Testing Program to continue. METHODS Larvae of diamondback moth were collected from Brassica crops in Tasmania, Western Australia, South Australia, Victoria and Queensland (Table 1) and were reared on cabbage seedling leaves (Brassica oleracea var. capitata cv. Green Coronet) in the laboratory at 25 °C (16h:8h, L:D) for one to six generations. A susceptible laboratory population of diamondback moth, maintained at IHD Knoxfield since

187
it was obtained from the University of Adelaide, Department of Crop Protection Waite Campus, SA, in 1994, was used as a reference. Table 1. Origin and generation of Australian diamondback moth populations tested for susceptibility to insecticides, 2002/2003
Population Origin Generation tested
Waite Laboratory population *
TAS Wesleyvale - Brassica vegetable seedlings F1 - F2
WA Wanneroo - cauliflower F1 - F2
SA Adelaide Hills - cabbage F1
VIC Werribee - Brassica vegetable seedlings F0 - F2
QLD Gatton (Smithfield Rd) - cabbage F1 - F2 A leaf dip bioassay after Tabashnik and Cushing (1987) was adopted for testing susceptibility to each insecticide. Variations in method for some insecticides were determined by company preferences or were those used in previous monitoring programs for the particular insecticide. For example, fipronil is tested worldwide at 22°C and indoxacarb was tested at 25°C. The remaining insecticides were all tested at 28°C (Table 2). Cabbage leaf discs of 4.5 cm diameter were dipped for 5 s in distilled water solutions of formulated insecticide and hung vertically to dry in a fume hood for 2 h. Control discs were dipped in distilled water. No wetting agents were used except for Bond Spraymate with emamectin benzoate and X-77 with indoxacarb. Discs were placed into Gelman 50 mm diameter x 9 mm plastic Petri dishes. For bioassays of Regentand those running to 96 h, five third instar DBM larvae were placed on each disc and eight replicates of each concentration were set up. For each of the shorter bioassays, ten larvae were placed on each disc and four replicates of each concentration were set up. Mortality was assessed at different times for different insecticides (Table 2). Larvae were considered dead if they did not move when touched with a paintbrush. Table 2. Insecticides tested, assessment times and temperatures used in bioassays of diamondback
moth, Plutella xylostella from Australia, 2002/2003
Insecticide Product name Assessment time Temperature
Bacillus thuringiensis Delfin WG 96 h 28°C chlorfenapyr Secure 72 h 28°C emamectin benzoate Proclaim 72 h 28°C fipronil Regent 72 h 22°C indoxacarb Avatar 72 h 25°C novaluron Rim On 72 h 28°C spinosad Success 72 h 28°C methamidophos Nitofol 48 h 28°C alpha-cypermethrin Fastac 48 h 28°C permethrin Ambush 48 h 28°C
Analysis Concentration-mortality data for each population were analysed using the probit analysis program, POLO-PC (Russell et al. 1977) (LeOra Software). We used the program to estimate the lethal concentration expected to cause 50% mortality (LC50) of each insecticide for each diamondback moth population and the 95% confidence intervals for these concentrations. The slope (+ standard error) of the probit line was also estimated. The program was also used to perform χ2 tests for goodness-of-fit of the data to the probit model. If the model fits, the calculated value of χ2 is less than the χ2 table value for the appropriate degrees of

188
freedom. If the model does not fit (i.e. the χ2 value exceeds the table value), the LC50 value for the particular population may not be reliably estimated and is adjusted with the heterogeneity factor (χ2/df). The index of significance for potency estimation (g) was used to calculate 95% confidence intervals for potency (relative potency is equivalent to tolerance ratio) (Robertson & Preisler 1992). Parallelism of the probit regression lines implies a constant relative potency at all levels of response (Finney 1971). Tests for equality and parallelism of the slopes of the probit lines for the field population and the laboratory susceptible population were made by POLO-PC. If the slopes are parallel, then overlap of the 95% confidence intervals for the two populations indicates that no significant difference exists between the LC50 values. RESULTS/ DISCUSSION A summary of the results comparing the levels of tolerance to the test insecticides for the six populations tested in 2002/2003 is presented in Table 3. 2001/2002 (Table 4) and 2000/2001 (Table 5) tolerance ratios are included for comparison. The 2002/2003 summary is based on comprehensive listings of tolerance ratios for the ten insecticides tested on diamondback moth populations from WA, SA, VIC, TAS and QLD compared with the standard laboratory population (Waite), provided in Attachment 1. A tolerance ratio of 1 indicates that a field population is equivalent in susceptibility to the Waite population. Similarly, the values of LC50 and LC95 and associated statistics from the probit analyses for the ten insecticides tested on diamondback moth populations from WA, SA, VIC, TAS and QLD compared with the standard laboratory population (Waite) 2002/2003 are listed in Attachment 2. Table 3. Comparison of levels of tolerance to ten insecticides tested on DBM populations from
five states in 2002/2003 (tolerance ratios of field population compared with laboratory population, Waite)
2002/2003 *NSW population not provided for testing in 2002/2003
Insecticide Product h WA SA VIC TAS NSW QLD Bacillus thuringiensis Delfin WG 96 0.73 2.44 2.42 5.57 * 2.23 Chlorfenapyr Secure 48 1.54 1.97* 1.27 2.04 * 1.25 emamectin benzoate Proclaim 72 4.10 1.05 2.54 4.17 * 3.71 Fipronil Regent 72 2.37 0.99 1.70 1.29 * 2.26 Indoxacarb Avatar 72 2.48 1.67 1.43 1.37 * 1.51 Novaluron Rim On 72 0.86 1.76 1.61 1.96 * 1.77 Spinosad Success 72 2.19 1.04 1.62 2.56 * 1.80 methamidophos Nitofol 48 1.92 1.49 2.34 1.41 * 1.86
alpha-cypermethrin Fastac 48 13.21 1.54 6.74 23.19# * 17.99# permethrin Ambush 48 20.40 2.04 8.17 10.33 * 3.83
*RR calculated at LC90 as slope for Waite population was atypically very low; #atypically low LC50 for Waite
Table 4. Comparison of levels of tolerance to ten insecticides tested on DBM populations from six states in 2001/2002 (tolerance ratios of field population compared with laboratory population, Waite)
2001/2002
Insecticide Product h WA SA VIC TAS NSW QLD Bacillus thuringiensis Delfin WG 96 0.42 0.96 0.32 0.37 1.69 1.29 chlorfenapyr Secure 48 0.42 0.80 0.62 0.67 1.03 0.84 emamectin benzoate Proclaim 72 2.74 3.34 1.84 0.72 2.46 4.43

189
Fipronil Regent 72 0.83 1.02 1.32 1.96 1.36 1.14 indoxacarb Avatar 72 1.83 1.10 1.86 1.34 0.83 2.34 Novaluron Rim On 72 1.01 3.63 5.06 3.03 0.93 1.21 Spinosad Success 72 0.68 0.96 1.55 0.76 1.31 2.47 methamidophos Nitofol 48 2.45 1.59 1.29 0.83 1.89 2.33 alpha-cypermethrin Fastac 48 2.62 8.20 4.78 4.50 13.19 9.81 permethrin Ambush 48 5.10 5.11 2.83 8.73 9.16 4.35
Table 5. Comparison of levels of tolerance to ten insecticides tested on DBM populations from six states in 2000/2001 (tolerance ratios of field population compared with laboratory population, Waite)
2000/2001
Insecticide Product h WA SA VIC TAS NSW QLD Bacillus thuringiensis Delfin WG 96 0.20 0.30 1.94 1.50 4.44 1.45 chlorfenapyr Secure 48 0.51 1.43 1.47 0.67 0.47 1.45 emamectin benzoate Proclaim 72 2.27 1.37 1.97 1.61 2.23 3.19 Fipronil Regent 72 1.43 1.38 1.24 1.59 1.17 11.03 indoxacarb Avatar 72 1.27 1.18 1.29 1.86 0.89 2.40 novaluron Rim On 72 1.38 0.82 0.85 1.56 1.83 1.17 Spinosad Success 72 3.40 0.98 1.63 3.24 1.17 2.18 methamidophos Nitofol 48 1.10 1.74 2.06 1.66 2.17 2.70 alpha-cypermethrin Fastac 48 3.45 11.55 9.96 9.01 7.20 13.92 permethrin Ambush 48 6.48 11.14 7.85 6.47 9.87 10.63
BACILLUS THURINGIENSIS (Delfin WG) No tolerance was shown towards Bacillus thuringiensis in Australian populations of DBM tested in 1999/2000. A population from New South Wales showed a low level of tolerance in 2000/2001. No tolerance was shown towards Bacillus thuringiensis in the populations of DBM tested in 2001/2002. In 2002/2003, populations from Victoria, South Australia and Tasmania had slightly elevated tolerance ratios to Bacillus thuringiensis. CHLORFENAPYR (Secure) In 2001/2002, none of the six populations tested showed any tolerance to chlorfenapyr. In 2002/2003, the populations of DBM from Western Australia, South Australia and Tasmania showed slightly elevated tolerance ratios to chlorfenapyr, but LC50 values for these populations were not higher than those observed in baseline tests (Endersby et al. 2001). EMAMECTIN BENZOATE (Proclaim) In 2002/2003, all populations of DBM tested except for that from South Australia showed slightly elevated tolerance to emamectin compared with the laboratory population, but levels were similar to those observed in the baseline study (Endersby & Ridland 1998a). Lasota et al. (1996) suggested that some variability in tolerance to avermectins between DBM populations could be due to differences in translaminar uptake of the compounds between different leaf discs. FIPRONIL (Regent) Tolerance to fipronil in populations from Queensland has been detected in previous years of the monitoring program (1999/2000 and 2000/2001) and in the baseline study (Endersby & Ridland 1998b, Endersby et al. 2000a). A very slightly elevated tolerance ratio was observed in the population from Queensland tested this season:
2002/2003: 2.26 (1.74 - 2.94; 95% confidence intervals) 2001/2002: 1.14 (0.76 – 1.68; 95% confidence intervals)

190
2000/2001: 11.03 (7.32 – 17.37; 95% confidence intervals) 1999/2000: 7.77 (4.59 – 14.41; 95% confidence intervals) The population of DBM from Western Australia showed a tolerance ratio that was very similar to that of the population from Queensland. All other populations tested were susceptible to fipronil. INDOXACARB (Avatar) No tolerance was shown towards indoxacarb in the populations tested from South Australia, Victoria, Tasmania or New South Wales in 2001/2002 (after its second season of use). The West Australian and Queensland populations showed a very low tolerance ratio, but the levels were not higher than those observed in the baseline study made in 1999/2000 before indoxacarb was registered or used. In 2002/2003, 95% confidence intervals for the tolerance ratio for each population tested indicated that all levels of tolerance were equivalent to that found in the laboratory population. NOVALURON (Rim On) The Tasmanian, South Australian and Victorian populations of DBM showed an elevated tolerance to novaluron in 2001/2002, but this insecticide has not yet been registered or used in the field. Levels of tolerance were generally lower in 2002/2003. SPINOSAD (Success) Populations of DBM from Tasmania, Western Australia, South Australia, New South Wales and Victoria were susceptible to spinosad in 2001/2002. Although a very low level of tolerance to spinosad was observed in the population tested from Queensland (2001/2002), the level was within the limits observed in the baseline susceptibility studies made in 1997 (Endersby & Ridland 1998c). In 2002/2003, populations from South Australia and Victoria were susceptible to spinosad and the other populations showed ratios that were slightly elevated, but were, once again, within the limits observed in the baseline study. The LC50 of the population from Western Australia, however, was slightly higher than baseline levels. METHAMIDOPHOS (Nitofol) In 2001/2002, the population of DBM from Tasmania was susceptible to methamidophos and all other populations showed a very low level of tolerance to this insecticide. In 2002/2003, each population of DBM tested showed a very slightly elevated tolerance compared with the laboratory population. ALPHA-CYPERMETHRIN (Fastac) Tolerance to alpha-cypermethrin was observed in all populations in 2001/2002, but was lowest in the WA population. In 2002/2003, the population from South Australia was susceptible to alpha-cypermethrin. Each of the other populations tested showed tolerance to the compound and the highest ratios were observed in the populations from Tasmania and Queensland, however, results were confounded by an atypically low LC50 value for the laboratory population for these bioassays. PERMETHRIN (Ambush) Tolerance to permethrin was detected in each population of DBM tested in 2002/2003. However, the tolerance ratios for the population from South Australia and Queensland were low. The tolerance ratio for the populations from Western Australia reached the level at which field control failures have been observed with permethrin in the past (Endersby & Ridland 1997). CONCLUSIONS Resistance to synthetic pyrethroids continues to be the main type of resistance identified in Australian populations of DBM from vegetable crops. The methods and sample sizes used in the National Insecticide Resistance Testing Program are able to detect substantial changes in susceptibility to insecticides by DBM and confirm resistance in case of a field control failure. If resistance is to be detected at the stage when it occurs at a low frequency in the population, very large numbers of field collected larvae (30, 000+) would have to be screened. In southern Australia, the opportunity to collect large numbers of DBM eggs usually occurs in November

191
to December. Estimation of frequency of resistant individuals in one or two large populations of DBM is an option for future study. A project to identify candidate genes for insecticide resistance and to develop rapid molecular screening methods for insecticide resistance has been funded by the Grains Research and Development Corporation.

192
REFERENCES Baker, G.J. and Kovaliski, J. (1999). Detection of insecticide resistance in Plutella xylostella (L.)
(Lepidoptera: Plutellidae) populations in South Australian crucifer crops. Australian Journal of Entomology 38: 132 – 134.
Endersby, N.M. and Ridland, P.M. (1997). Insecticide resistance in diamondback moth, Plutella
xylostella (L.), in southern Australia. In: (eds. A. Sivapragasam, W.H. Loke, AK Hussan & G.S. Lim) The management of diamondback moth and other crucifer pests. Proceedings of the Third International Workshop, Kuala Lumpur, Malaysia, pp. 290 – 294.
Endersby, N.M. and Ridland, P.M. (1998a). Survey of baseline levels of susceptibility to emamectin
benzoate in Australian populations of Plutella xylostella (L.). Report to Novartis Crop Protection Australasia Limited, 27 pp.
Endersby, N.M. and Ridland, P.M. (1998b). Survey of baseline levels of susceptibility to fipronil in
Australian populations of Plutella xylostella (L.). Report to Rhône-Poulenc Rural Australia Pty Ltd, 41 pp.
Endersby, N.M. and Ridland, P.M. (1998c). Survey of baseline levels of susceptibility to spinosad in
Australian populations of Plutella xylostella (L.). Report to DowAgroSciences, 29 pp. Endersby, N.M., Ridland, P.M. and Zhang, J. (2000a). Assessment of susceptibility to fipronil and
endosulfan in Australian populations of diamondback moth, Plutella xylostella (L.) 1998/99. Report to Aventis CropScience, 18 pp.
Endersby, N.M., Ridland, P.M. and Zhang, J. (2000b). Resistance to permethrin in diamondback moth
populations from vegetable and non-vegetable hosts in southern Australia. Australian Entomological Society 31st AGM & Scientific Conference, Northern Territory University, Darwin 25-30 June.
Endersby, N.M., Ridland, P.M. and Zhang, J. (2001). National DBM insecticide resistance testing
program. First round of DBM bioassay results to 31st July 2000. Horticultural Research and Development Corporation Final Report, Project VG97014, pp. 54-73.
Finney, D.J. (1971). Probit analysis. 3rd edition, Cambridge University Press, Great Britain. Hargreaves, J.R. (1996). Insecticide resistance and insecticide resistance management strategies for
three vegetable pests in south east Queensland. Horticultural Research and Development Corporation, Project report reference v/0021/r1.
Lasota, J.A., Shelton, A.M., Bolognese, J.A. and Dybas, R.A. (1996). Toxicity of avermectins to
diamondback moth (Lepidoptera: Plutellidae) populations: Implications for susceptibility monitoring. Journal of Economic Entomology 89, 33-38.
Robertson, J.L. and Preisler, H.K. (1992). Pesticide bioassays with arthropods. CRC Press, Inc., Boca
Raton, Florida, USA. Russell, R.M., Robertson, J.L. and Savin, N.E. (1977). POLO: a new computer program for probit
analysis. Bulletin of the Entomological Society of America 23: 209-213. Tabashnik, B.E. and Cushing, N.L. (1987). Leaf residue vs. topical bioassays for assessing insecticide
resistance in the diamondback moth, Plutella xylostella L. FAO Plant Protection Bulletin 35: 11-14.

193
ATTACHMENT 1 Tolerance ratio (assuming parallel slopes for each test) for ten insecticides tested on diamondback moth populations from WA, SA, VIC, QLD and TAS compared with the standard laboratory population (Waite) 2002/2003. If parallel slopes could not be fitted for a particular assay, then tolerance ratio was calculated at LC50. A tolerance ratio of 1 indicates that a field population is equivalent in susceptibility to the Waite population. BACILLUS THURINGIENSIS (Delfin WG)
DBM population State h Tolerance 95% c. i. Gen Ratio Lower Upper
Wanneroo WA 96 0.73 0.48 1.12 F1 Calculated at LC50
Gatton QLD 96 2.23 1.00 4.92 F2
Werribee VIC 96 2.42 1.57 4.00 F1
Adelaide Hills SA 96 2.44 1.65 3.60 F1 Calculated at LC50
Wesleyvale TAS 96 5.57 2.66 12.88 F2
CHLORFENAPYR (Secure)
DBM population State h Tolerance 95% c. i. Gen Ratio Lower Upper
Gatton QLD 72 1.25 0.75 2.07 F2
Werribee VIC 72 1.27 0.87 1.86 F2
Wanneroo WA 72 1.54 1.26 1.89 F1 Calculated at LC50
Adelaide Hills SA 72 1.97 0.92 4.25 F1 Calculated at LC90
Wesleyvale TAS 72 2.04 1.12 3.91 F1
EMAMECTIN BENZOATE (Proclaim)
DBM population State h Tolerance 95% c. i. Gen Ratio Lower Upper
Adelaide Hills SA 72 1.05 0.75 1.49 F1 Calculated at LC50
Werribee VIC 72 2.54 1.53 4.44 F1
Gatton QLD 72 3.71 2.54 5.65 F1
Wanneroo WA 72 4.10 2.48 7.39 F1
Wesleyvale TAS 72 4.17 2.93 6.18 F1 Tolerance ratio (assuming parallel slopes for each test) for ten insecticides tested on diamondback moth populations from WA, SA, VIC, QLD and TAS compared with the standard laboratory population (Waite) 2002/2003. If parallel slopes could not be fitted for a particular assay, then tolerance ratio was calculated at LC50. A tolerance ratio of 1 indicates that a field population is equivalent in susceptibility to the Waite population.

194
ATTACHMENT 1 (continued) FIPRONIL (Regent)
DBM population State h Tolerance 95% c. i. Gen Ratio Lower Upper
Adelaide Hills SA 72 0.99 0.59 1.61 F1
Wesleyvale TAS 72 1.29 0.98 1.70 F1
Werribee VIC 72 1.70 1.31 2.19 F1 Calculated at LC50
Gatton QLD 72 2.26 1.74 2.94 F2 Calculated at LC50
Wanneroo WA 72 2.37 1.74 3.23 F2 Calculated at LC50 INDOXACARB (Avatar)
DBM population State h Tolerance 95% c. i. Gen Ratio Lower Upper
Wesleyvale TAS 72 1.37 0.62 3.04 F1
Werribee VIC 72 1.43 0.73 2.85 F1
Gatton QLD 72 1.51 0.84 2.71 F2 Calculated at LC50
Adelaide Hills SA 72 1.67 0.70 4.29 F1
Wanneroo WA 72 2.48 0.99 6.84 F2
NOVALURON (Rim On)
DBM population State h Tolerance 95% c. i. Gen Ratio Lower Upper
Wanneroo WA 72 0.86 0.28 2.60 F2
Werribee VIC 72 1.61 1.03 2.51 F1 Calculated at LC50
Adelaide Hills SA 72 1.76 0.72 4.44 F1
Gatton QLD 72 1.77 1.17 2.69 F2 Calculated at LC50
Wesleyvale TAS 72 1.96 1.09 3.61 F1
Tolerance ratio (assuming parallel slopes for each test) for ten insecticides tested on diamondback moth populations from WA, SA, VIC, QLD and TAS compared with the standard laboratory population (Waite) 2002/2003. If parallel slopes could not be fitted for a particular assay, then tolerance ratio was calculated at LC50.
A tolerance ratio of 1 indicates that a field population is equivalent in susceptibility to the Waite population.
SPINOSAD (Success)
DBM population State h Tolerance 95% c. i. Gen Ratio Lower Upper
Adelaide Hills SA 72 1.04 0.70 1.54 F1 Calculated at LC50
Werribee VIC 72 1.62 1.03 2.59 F1
Gatton QLD 72 1.80 1.14 2.90 F2
Wanneroo WA 72 2.19 1.53 3.18 F1
Wesleyvale TAS 72 2.56 1.61 4.23 F1

195
ATTACHMENT 1 (continued)
METHAMIDOPHOS (Nitofol)
DBM population State h Tolerance 95% c. i. Gen Ratio Lower Upper
Wesleyvale TAS 48 1.41 1.21 1.65 F1
Adelaide Hills SA 48 1.49 1.18 1.88 F1
Gatton QLD 48 1.86 1.53 2.26 F2 Calculated at LC50
Wanneroo WA 48 1.92 1.42 2.61 F1 Calculated at LC50
Werribee VIC 48 2.34 1.75 3.14 F2 Calculated at LC50
ALPHA-CYPERMETHRIN (Fastac)
DBM population State h Tolerance 95% c. i. Gen Ratio Lower Upper
Adelaide Hills SA 48 1.54 1.00 2.32 F1
Werribee VIC 48 6.74 4.92 9.23 F2 Calculated at LC50
Wanneroo WA 48 13.21 9.81 18.19 F1
Gatton QLD 48 17.99 11.12 32.81 F2
Wesleyvale TAS 48 23.19 12.61 51.52 F1 Tolerance ratio (assuming parallel slopes for each test) for ten insecticides tested on diamondback moth populations from WA, SA, VIC, QLD and TAS compared with the standard laboratory population (Waite) 2002/2003. If parallel slopes could not be fitted for a particular assay, then tolerance ratio was calculated at LC50. A tolerance ratio of 1 indicates that a field population is equivalent in susceptibility to the Waite population.
PERMETHRIN (Ambush)
DBM population State h Tolerance 95% c. i. Gen Ratio Lower Upper
Adelaide Hills SA 48 2.04 1.40 2.93 F1
Gatton QLD 48 3.83 2.80 5.25 F2
Werribee VIC 48 8.17 5.57 12.72 F0
Wesleyvale TAS 48 10.33 7.22 15.88 F1
Wanneroo WA 48 20.40 14.79 28.14 F1 Calculated at LC50

196
ATTACHMENT 2
LC50 and LC95 for ten insecticides tested on diamondback moth populations from WA, SA, VIC, TAS and QLD compared with the standard laboratory population (Waite) 2002/2003 (Het.=heterogeneity, s.e.=standard error, df=degrees of freedom, g=index of significance for potency estimation). BACILLUS THURINGIENSIS (Delfin WG) 96 h Population State Slope
Slope s. e.
Het. g χ2
df=54 LC50
g/ 100 L 95% confidence
intervals LC95
g/ 100 L 95% confidence intervals
Laboratory * 1.36 0.17 2.00 0.12 108.1 0.34 0.14 0.64 5.47 2.60 19.29 Wesleyvale TAS 1.03 0.12 1.89 0.10 101.8 1.78 1.05 3.29 69.55 23.65 501.45 Laboratory * 1.34 0.13 1.72 0.07 93.0 0.94 0.61 1.44 15.76 7.99 46.04 Wanneroo WA 1.81 0.18 1.91 0.08 103.3 0.69 0.44 1.03 5.57 3.27 12.85 Laboratory * 1.34 0.13 1.72 0.07 93.0 0.94 0.61 1.44 15.76 7.99 46.04 Adelaide Hills SA 4.72 1.17 2.67 0.66 144.3 2.29 Not calculated 5.12 Not calculated Laboratory * 1.73 0.28 0.80 0.10 43.4 1.23 0.74 1.75 10.97 6.93 23.79 Werribee VIC 2.68 0.46 1.68 0.20 90.8 3.31 2.27 4.49 13.58 8.55 40.26 Laboratory * 1.36 0.17 2.00 0.12 108.1 0.34 0.14 0.64 5.47 2.60 19.29 Gatton QLD 1.15 0.19 1.79 0.20 96.4 0.68 0.17 1.48 18.18 7.34 126.07
CHLORFENAPYR (Secure) 72 h Population State Slope
Slope s. e.
Het. g χ2
df=26 LC50 ppm
95% confidence intervals
LC95 ppm
95% confidence intervals
Laboratory * 1.94 0.22 2.81 0.15 73.0 30.82 17.13 46.12 217.71 127.11 633.44 Wesleyvale TAS 1.61 0.19 3.21 0.18 83.5 58.05 31.78 91.85 609.61 297.64 3028.35 Laboratory * 2.84 0.31 3.51 0.18 91.4 58.50 39.37 82.24 222.15 141.06 581.86 Wanneroo WA 7.61 1.14 0.46 0.09 12.0 90.28 81.21 99.90 148.54 129.21 186.82 Laboratory * 0.97 0.28 1.26 0.45 32.7 1.32 0.00 5.88 66.62 30.10 352.70 Adelaide Hills SA 2.52 0.38 2.91 0.29 75.6 17.10 6.59 27.08 76.98 46.80 256.49 Laboratory * 2.84 0.31 3.51 0.18 91.4 58.50 39.37 82.24 222.15 141.06 581.86 Werribee VIC 3.22 0.34 2.12 0.10 55.2 75.10 58.19 95.51 243.17 173.18 439.49 Laboratory * 1.94 0.22 2.81 0.15 73.0 30.82 17.13 46.12 217.71 127.11 633.44 Gatton QLD 2.01 0.23 1.84 0.10 48.0 39.05 25.14 54.27 258.24 164.83 561.01
EMAMECTIN BENZOATE (Proclaim) 72 h Population State Slope
Slope s. e.
Het. g χ2
df=26 LC50
(ng/ ml) 95% confidence
intervals LC95
(ng/ ml) 95% confidence intervals
Laboratory * 2.00 0.22 0.96 0.05 25.0 49.98 39.98 63.20 332.04 220.35 608.40 Wesleyvale TAS 1.59 0.23 0.88 0.08 22.9 242.05 168.81 418.86 2615.31 1165.69 10759.15 Laboratory * 1.64 0.20 1.94 0.12 50.4 18.53 11.67 26.83 187.71 102.41 596.19 Wanneroo WA 1.78 0.23 2.18 0.15 56.7 75.71 49.57 123.89 638.09 303.50 3098.15 Laboratory * 1.64 0.20 1.94 0.12 50.4 18.53 11.67 26.83 187.71 102.41 596.19 Adelaide Hills SA 2.44 0.28 1.23 0.07 31.9 19.54 14.93 24.71 92.06 65.00 158.98 Laboratory * 2.00 0.22 0.96 0.05 25.0 49.98 39.98 63.20 332.04 220.35 608.40 Werribee VIC 1.61 0.20 2.40 0.15 62.3 140.68 88.72 296.69 1488.68 569.52 11812.30 Laboratory * 2.00 0.22 0.96 0.05 25.0 49.98 39.98 63.20 332.04 220.35 608.40
Gatton QLD 1.55 0.22 1.13 0.09 29.5 217.54 147.00 401.29 2490.78 1042.25 12230.09

197
ATTACHMENT 2 (continued)
LC50 and LC95 for ten insecticides tested on diamondback moth populations from WA, SA, VIC, TAS and QLD compared with the standard laboratory population (Waite) 2002/2003 (Het.=heterogeneity, s.e.=standard error, df=degrees of freedom, g=index of significance for potency estimation). FIPRONIL (Regent) 72 h Population State Slope
Slope s. e.
Het. g χ2
df=26 LC50 ppm
95% confidence intervals
LC95 ppm
95% confidence intervals
Laboratory * 3.40 0.44 1.45 0.10 31.9 0.92 0.77 1.16 2.81 1.96 5.47 Wesleyvale TAS 3.46 0.40 1.73 0.10 44.9 1.18 0.96 1.53 3.53 2.45 6.78 Laboratory * 3.00 0.42 1.64 0.14 42.7 1.00 0.75 1.35 3.56 2.33 8.13 Wanneroo WA 2.05 0.19 1.25 0.05 32.5 2.38 1.85 3.15 15.04 9.67 28.69 Laboratory * 2.68 0.32 1.18 0.07 30.8 0.71 0.59 0.87 2.93 2.05 5.24 Adelaide Hills SA 2.98 0.39 10.58 0.78 275.1 0.70 Not calculated 2.49 Not calculated Laboratory * 3.40 0.44 1.45 0.10 31.9 0.92 0.77 1.16 2.81 1.96 5.47 Werribee VIC 2.36 0.23 2.01 0.08 52.2 1.56 1.17 2.17 7.77 4.78 17.60 Laboratory * 3.40 0.44 1.45 0.10 31.9 0.92 0.77 1.16 2.81 1.96 5.47
Gatton QLD 2.21 0.20 2.05 0.07 53.4 2.08 1.52 2.92 11.54 7.09 25.10
INDOXACARB (Avatar) 72 h Population State Slope
Slope s. e.
Het. g χ2
df=26 LC50 ppm
95% confidence intervals
LC95 ppm
95% confidence intervals
Laboratory * 1.72 0.22 1.85 0.13 48.1 0.79 0.44 1.18 7.20 4.16 20.10 Wesleyvale TAS 1.27 0.16 2.61 0.17 67.8 0.87 0.34 1.56 17.11 7.76 89.41 Laboratory * 1.15 0.16 3.02 0.24 78.5 0.57 0.12 1.23 15.41 6.13 142.66 Wanneroo WA 0.93 0.12 2.20 0.16 57.3 1.11 0.38 2.21 64.01 22.41 602.89 Laboratory * 1.15 0.16 3.02 0.24 78.5 0.57 0.12 1.23 15.41 6.13 142.66 Adelaide Hills SA 1.24 0.16 1.96 0.14 50.9 1.03 0.50 1.69 21.78 10.16 97.67 Laboratory * 1.72 0.22 1.85 0.13 48.1 0.79 0.44 1.18 7.20 4.16 20.10 Werribee VIC 1.43 0.18 2.59 0.16 67.3 1.00 0.46 1.69 14.18 6.87 63.67 Laboratory * 1.72 0.22 1.85 0.13 48.1 0.79 0.44 1.18 7.20 4.16 20.10 Gatton QLD 0.93 0.12 1.87 0.13 48.6 1.20 0.49 2.19 69.42 25.98 486.64
NOVALURON (Rim On) 72 h Population State Slope
Slope s. e.
Het. g χ2
df=26 LC50
ppm 95% confidence
intervals LC95 ppm
95% confidence intervals
Laboratory * 1.51 0.15 3.21 0.13 83.6 15.11 7.97 26.70 185.60 84.97 822.91 Wesleyvale TAS 1.20 0.14 0.58 0.05 15.0 28.93 20.44 41.16 687.16 354.85 1855.01 Laboratory * 1.05 0.11 2.68 0.12 69.7 7.18 3.20 13.97 266.92 98.48 1744.01 Wanneroo WA 0.94 0.11 4.24 0.22 110.2 5.78 1.57 14.42 328.62 87.50 8498.24 Laboratory * 1.05 0.11 2.68 0.12 69.7 7.18 3.20 13.97 266.92 98.48 1744.01 Adelaide Hills SA 1.26 0.13 3.12 0.14 81.2 13.51 6.65 25.49 273.52 108.17 1712.16 Laboratory * 1.51 0.15 3.21 0.13 83.6 15.11 7.97 26.70 185.60 84.97 822.91 Werribee VIC 2.28 0.35 1.40 0.14 36.4 24.26 14.26 34.07 127.88 85.02 271.41 Laboratory * 1.51 0.15 3.21 0.13 83.6 15.11 7.97 26.70 185.60 84.97 822.91 Gatton QLD 2.10 0.26 1.89 0.12 49.2 26.75 16.32 38.98 163.15 100.29 386.76

198
ATTACHMENT 2 (continued)
LC50 and LC95 for ten insecticides tested on diamondback moth populations from WA, SA, VIC, TAS and QLD compared with the standard laboratory population (Waite) 2002/2003 (Het.=heterogeneity, s.e.=standard error, df=degrees of freedom, g=index of significance for potency estimation). SPINOSAD (Success) 72 h Population State Slope
Slope s. e.
Het. g χ2
df=26 LC50 ppm
95% confidence intervals
LC95
ppm 95% confidence intervals
Laboratory * 1.42 0.18 1.39 0.09 36.2 0.20 0.13 0.29 2.94 1.55 8.94 Wesleyvale TAS 1.42 0.16 1.27 0.06 33.0 0.52 0.37 0.74 7.52 3.88 21.78 Laboratory * 2.01 0.23 0.89 0.05 23.2 0.32 0.25 0.41 2.10 1.40 3.83 Wanneroo WA 1.65 0.17 1.19 0.05 31.1 0.73 0.54 1.02 7.26 4.12 17.25 Laboratory * 2.01 0.23 0.89 0.05 23.2 0.32 0.25 0.41 2.10 1.40 3.83 Adelaide Hills SA 1.44 0.17 1.32 0.08 34.3 0.33 0.22 0.48 4.63 2.42 13.87 Laboratory * 1.85 0.21 1.67 0.09 43.3 0.21 0.15 0.29 1.66 0.98 4.12 Werribee VIC 1.39 0.16 1.57 0.09 40.8 0.34 0.24 0.50 5.19 2.56 17.64 Laboratory * 1.42 0.18 1.39 0.09 36.2 0.20 0.13 0.29 2.94 1.55 8.94 Gatton QLD 1.50 0.17 1.24 0.07 32.3 0.37 0.26 0.52 4.58 2.52 11.90
METHAMIDOPHOS (Nitofol) 48 h (*10 df) Population State Slope
Slope s. e.
Het. g χ2
df=26 LC50 ppm
95% confidence intervals
LC95
ppm 95% confidence intervals
Laboratory * 5.38 0.76 0.69 0.08 18.0 121.64 106.65 137.63 246.00 205.62 328.01 Wesleyvale TAS 5.90 0.70 0.79 0.05 20.5 171.64 154.20 191.65 326.06 278.23 412.40 Laboratory * 4.15 0.44 1.40 0.07 36.3 274.14 232.80 323.37 682.19 538.56 982.36 Wanneroo WA 2.53 0.39 2.32 0.27 23.2* 527.42 282.07 852.47 2357.86 1311.35 10883.76 Laboratory * 4.15 0.44 1.40 0.07 36.3 274.14 232.80 323.37 682.19 538.56 982.36 Adelaide Hills SA 3.76 0.38 1.40 0.06 36.5 408.91 343.99 489.19 1121.18 864.83 1664.60 Laboratory * 4.15 0.44 1.40 0.07 36.3 274.14 232.80 323.37 682.19 538.56 982.36 Werribee VIC 2.67 0.44 1.35 0.18 13.5* 642.63 428.79 907.30 2652.14 1647.95 7431.48 Laboratory * 5.38 0.78 0.69 0.08 18.0 121.64 106.65 137.63 246.00 205.62 328.01 Gatton QLD 3.20 0.32 1.25 0.05 32.4 226.60 190.34 270.36 739.52 563.04 1108.92
ALPHA-CYPERMETHRIN (Fastac) 48 h (*df=25)
Population State Slope
Slope s. e.
Het. g χ2
df=26 LC50 ppm
95% confidence intervals
LC95 ppm
95% confidence intervals
Laboratory * 1.68 0.35 0.79 0.17 20.5 2.95 0.99 4.90 28.19 19.43 56.39 Wesleyvale TAS 1.34 0.16 1.94 0.12 50.3 50.03 29.40 77.31 854.13 410.18 3397.80 Laboratory * 2.56 0.27 0.70 0.04 18.1 16.90 14.06 20.08 74.07 55.84 111.22 Wanneroo WA 1.93 0.19 0.75 0.04 19.5 225.05 176.92 293.26 1607.99 1046.11 2947.19 Laboratory * 2.44 0.28 1.39 0.08 36.0 13.89 10.71 17.38 65.47 46.11 115.51 Adelaide Hills SA 1.76 0.28 1.54 0.17 38.6* 18.38 8.73 28.23 158.26 92.82 471.99
Laboratory * 2.56 0.27 0.70 0.04 18.1 16.90 14.06 20.08 74.07 55.84 111.22 Werribee VIC 1.66 0.17 1.17 0.05 30.4 113.95 85.21 154.10 1110.43 661.26 2446.26 Laboratory * 1.68 0.35 0.79 0.17 20.5 2.95 0.99 4.90 28.19 19.43 56.39 Gatton QLD 1.49 0.19 1.25 0.09 32.4 45.90 29.20 65.89 579.66 327.83 1522.51

199
ATTACHMENT 2 (continued)
LC50 and LC95 for ten insecticides tested on diamondback moth populations from WA, SA, VIC, TAS and QLD compared with the standard laboratory population (Waite) 2002/2003 (Het.=heterogeneity, s.e.=standard error, df=degrees of freedom, g=index of significance for potency estimation). PERMETHRIN (Ambush) 48 h Population State Slope
Slope s. e.
Het. g χ2
df=26 LC50
ppm 95% confidence
intervals LC95
ppm 95% confidence intervals
Laboratory * 2.26 0.25 1.71 0.09 44.4 24.13 17.34 31.87 129.20 85.68 257.90 Wesleyvale TAS 2.38 0.34 1.14 0.10 29.6 245.32 190.51 358.25 1206.92 691.40 3396.77 Laboratory * 2.87 0.36 0.32 0.06 8.4 6.23 4.85 7.64 23.30 17.90 34.35 Wanneroo WA 1.95 0.22 1.31 0.07 34.0 127.18 98.58 173.63 885.26 516.65 2176.69 Laboratory * 2.02 0.27 0.99 0.07 25.7 5.04 3.42 6.67 32.95 23.67 54.34 Adelaide Hills SA 2.96 0.44 1.82 0.17 47.3 12.75 8.29 16.60 45.83 32.76 90.71 Laboratory * 1.87 0.20 1.66 0.08 43.2 20.08 14.36 26.93 151.69 95.08 326.18 Werribee VIC 1.62 0.21 0.86 0.06 22.4 169.83 129.74 243.14 1757.66 923.59 5016.85 Laboratory * 3.69 0.56 0.84 0.09 21.8 33.10 26.84 38.92 92.46 73.59 134.79
Gatton QLD 1.72 0.21 1.42 0.09 37.0 126.85 94.61 184.98 1143.42 596.06 3595.59

200
APPENDIX G
Manuscript accepted for publication in Int. Jrnl. Pest Mngt.
THE USE OF DUSTS AND DYES TO MARK POPULATIONS OF BENEFICIAL INSECTS IN THE FIELD Nancy A. Schellhorn, Gitta Siekmann, Catherine Paull, Geoff Furness1 and Greg Baker South Australian Research and Development Institute, Entomology Unit, Waite Precinct, GPO Box 397, Adelaide, SA 5001, Australia 1South Australian Research and Development Institute, Loxton Research Centre, GPO Box 411, Loxton, SA 5333, Australia Abstract: Dusts and dyes have been used to mark insects internally and externally for decades, with the majority of examples coming from laboratory-reared pest species used in mark-release-recapture studies. Using dusts or dyes to mark populations of pests and beneficial insects simultaneously in the field has received less attention. We evaluated a water-soluble fluorescent dye and a resin-based fluorescent pigment sprayed on crops to mark beneficial and pest insects, and monitored the dispersal of marked insects. Our results show that resin-based dyes provide an effective mark on several species of insects in several orders. The resin-based dye is also relatively inexpensive, non-toxic, UV-stable and water resistant, unlike the water-soluble dye. Using the resin-based dye in a broccoli production system, we were able to monitor simultaneously the movement of field populations of the parasitoids, Diadegma semiclausum (Hellén) (Hymenoptera: Ichneumonidae), and Apanteles ippeus (Nixon) (Hymenoptera: Braconidae) and the adult stage of the host, diamondback moth, Plutella xylostella (L.) (Lepidoptera: Plutellidae). Resin-based dye applied on a crop is an effective way to mark and monitor the dispersal of populations of beneficial and pest insects in relation to agricultural practices, integrated pest management and conservation biological control. Key words: fluorescent dyes, mark-capture, beneficial insects, insect dispersal Introduction Numerous techniques have been developed to mark insects to study their abundance, dispersal and survival. Fluorescent dust (also known as “powder”) was one of the first reported (Darling 1925). Many studies have used dusts, dyes, and paints applied to insects (herbivores in the majority of cases) internally and externally, on mass-reared laboratory populations and field collected samples, and some experiments have been devised for insects to self-mark (Gentry and Blythe 1978; see reviews by Reynolds et al. 1997; Hagler and Jackson 2001). However there have been few studies in which dusts and dyes have been applied directly to natural populations in the field (Rose et al. 1985; Bell 1988) and only one (Prasifka et al. 1999) where the purpose was to mark beneficial insects. The aim of this project was to develop a method of marking field populations of beneficial insects in order to monitor their dispersal from refuges into crops. An inexpensive method was needed to simultaneously mark large populations of several species of insects occurring in the field without handling, rearing and releasing them. In this paper, the following are compared: (1) fluorescent water-soluble and resin-based dyes applied to vegetation as a means of marking beneficial and pest insects, (2) methods to capture and detect marked insects, (3) the stability of the dyes on the insects, and (4) the effects of the dyes on insect mortality.

201
Materials and Methods The dyes The first dye was a red water-soluble, Xanthene-derived fluorescent dye, Rhodamine b granules (also known as ‘basic violet 10’), used for colouring in a wide variety of applications. The product is distributed by HCA Colours Australia, Pty Ltd, Kingsgrove, New South Wales, Australia. The dye was mixed at a rate of 35 gm / 100L of water, with a non-ionic, non-toxic surfactant, polyoxyethylene sorbitan monolaurate (Ecoteric®), at 50 ml / 100L of water, and applied at rates ranging between 400-600L per ha. Ecoteric®, a registered trademark of the Huntsman Corporation Australia Pty Ltd., is supplied by Orica Chemicals Australia Pty Ltd, Melbourne, Australia. Rhodamine b is not registered to be used on crops for human or animal consumption, and is most commonly used as a marker for spot spraying weeds. The second dye was a resin-encapsulated fluorescent pigment (current colours used include green, pink and blue) and is formulated for agricultural spraying, as a water-based suspension concentrate, dispersed to achieve a particle size of 10 - 20 microns. The formulation was initially developed by Orica Australia Pty Ltd (ICI), Melbourne, with further refinements by Topline Paint Pty Ltd, Adelaide, South Australia, Australia. The product is distributed by the South Australian Research and Development Institute (SARDI) and manufactured under contract by Topline Paint. Originally, the product was developed as an aid to determine spray coverage and deposition in agricultural spraying. We applied the dye at a rate of 1L / 100L of water, and a water volume ranging between 400-600L per ha. The dye can be applied at a rate of 2L / 100L of water for a more brilliant result. Although the dye is non-toxic, with restricted use patterns, and does not therefore need to be registered as an agricultural chemical, in Australia it is not registered for human consumption and a one-month withholding period should be observed. Produce marked with the dye should not be sold for human consumption. Capturing marked insects Different capture techniques have different biases associated with them. For this reason, we evaluated three capture techniques, yellow-sticky-plate traps, yellow-sticky-bucket traps and suction sampling. Pheromone traps were also evaluated to capture P. xylostella but are not discussed in this paper due to the focus on beneficial insects. Yellow-sticky-plate traps were plastic dinner plates 22 cm in diameter placed perpendicular to and 20 cm above the ground on a wooden dowel. At this height the plates only just extended above the plant canopy. Each side of the plate was coated with Tangle Trap® (The Tanglefoot Company, Grand Rapids, MI, USA). The Tangle Trap® was mixed with chloroform until the consistency of batter to make spreading easier. The chloroform is odourless and evaporates quickly, thus does not repel insects. Yellow-sticky-bucket traps were made from inverted 9 litre buckets, with a 5 cm wide rim made of particle board placed around the base, all coated with tangle trap. The 5 cm rim was found to increase moth capture four fold (Jianhua Mo, personal communication) probably because the moths landed on the rim after they freed themselves from the side of the bucket (scale trails were visible). The buckets and rims were wrapped in shrink-wrap and heated with a heat gun, then coated with Tangle Trap® diluted with chloroform. For suction sampling, we used a 21cc power blower/vac fitted with cone shaped voile and calico bags, 23 cm across the opening and 36 cm long tapering to a point, which were fitted to the end of the suction tube. Suction sampling was conducted on four to six replicates of 30 row m sections of vegetation, changing to a new bag for each replicate. The bags and contents were placed in the freezer for later analysis. Initially, we suction sampled all vegetation that had been dyed, plus the surrounding vegetation. Although this worked well with the red water-soluble dye, it did not work well with the resin dye. Resin was removed from the plants by

202
vacuuming and suspended in the bag causing contamination of the insects. Suction sampling on surrounding un-sprayed vegetation worked well even when marked insects were collected. Detecting marked insects To determine the number of marked insects on the yellow-sticky-plate traps, yellow-sticky-bucket traps, and in suction sample bags we viewed the collected insects under a 40 x dissecting scope with a Labino® UV-A TrAc Pack PRO light source (Shurechem Industries, Pty. Ltd., Sydney, Australia). For the yellow-sticky-bucket traps, the shrink-wrap was cut from the bucket and viewed under the dissecting scope and UV light. This allowed us to view a flat surface, and to detect minute amounts of dye on insects. It also eliminated the need to clean Tangle Trap® from the buckets. The insects from the suction sampler bags were placed in petri dishes, where they were sorted by species and sex and viewed under the dissecting scope. An insect was considered marked if there was a pattern of dye resembling a drop on any part of the body. A single fleck or two was considered contamination. Field experiments to evaluate marking potential of dyes Lupins In central New South Wales, cotton and grains (eg. Faba beans, lupins, pigeon peas, wheat) are the major crops. Lupins can be used as part of the rotation and are planted in early winter and harvested by early spring, just after cotton seedlings have established. Often predators will build to large numbers in small grain crops prior to cotton emerging. We used a lupin crop in a preliminary experiment to test whether the red water-soluble dye sprayed directly onto the crop would mark a significant proportion of beneficial insects. In November 2000, we sprayed the centre 2.1 ha of a 9 ha lupin field with Rhodamine b. Twelve hours after spraying we collected insects using a suction sampler in 10 row m sections replicated ten times in both the sprayed (2.1 ha) and unsprayed sections (6.9 ha). The process of collecting insects was repeated five days later. All sample bags were stored in the freezer until they could be examined. Collected insects were subsequently sorted to species and evaluated for the presence of dye under a dissecting scope and Labino® UV-A TrAc Pack PRO light source. Broccoli The main vegetable producing area of South Australia is located on the plains north of Adelaide. Brassica vegetables are in continuous, yearly production, which results in a resident population of diamondback moth, Plutella xylostella (L.), and its two most abundant larval parasitoids, Diadegma semiclausum (Hellén), and Apanteles ippeus (Nixon). To allow resident populations of insects to increase to a level that field marking and capturing was possible, usually densities > 0.50 / metre (otherwise considerably more effort has to go into capturing or marking larger source populations), we reduced the frequency of irrigation and eliminated the use of insecticides on a field of broccoli (Brassica oleraceae, var. “Marathon”), at two properties, St. Kilda and Virginia, South Australia. At the first property, St. Kilda, we conducted an experiment in broccoli in May 2001 to: 1) determine whether Rhodamine b would mark insect species in brassica vegetable systems, 2) compare the Rhodamine b with the green resin-based fluorescent dye, 3) determine the appropriate height to place the sticky traps, and 4) measure insect movement from the dyed broccoli to young unsprayed broccoli. The property was 10 ha in area with five hectares planted to broccoli and cauliflower production, and 5 ha of fallow land, primarily bare soil. Each field measured 250 m x 12 m. First, we estimated the density of adult P. xylostella, D. semiclausum, and A. ippeus using a suction sampler over four replicates of 30 row m sections. Next, we sprayed two adjacent sections (each 70 m x 12 m), in the larger broccoli field with either red water-soluble Rhodamine b, or green resin-based fluorescent SARDI dye. After spraying we placed yellow-sticky-plate traps in the field for 72 hours. We also used suction

203
sampling at 24, 72 and 144 hours post spraying to compare the proportion of marked insects over time in the two dyed sections of broccoli. However, suction-sampling from plants sprayed with resin-based dye caused cross contamination of samples, although this was not the case for the plants sprayed with the water-based dye. Therefore, only the yellow-sticky-plates were used for insect collections in this study. We also placed groups of three yellow-sticky-bucket traps spaced 35 m apart at distances of 41 m, 54 m, 68 m, and 81 m from the sprayed field. Two of the three traps in each group were placed at 20 cm above ground from the base, and one was placed at130 cm above ground from the base. Most broccoli plants were not taller than 50 cm. Immediately after placing the yellow-sticky-bucket traps the grower cultivated the broccoli field that had been sprayed with dye, and the traps were left in the field for two weeks. Twenty-four hours after cultivation we suction sampled four replicated 30 row m sections at 27 m, 41 m, 54 m, and 68 m from the dyed field. These distances were different from the distances that the yellow-sticky-bucket traps were placed because the farmer was irrigating the furthest section so we were unable to sample using a suction sampler. The traps and suction samples were returned to the laboratory (the latter were placed in the freezer and then sorted) and D. semiclausum, A. ippeus, and P. xylostella were viewed under the UV light for dye marking. At the second property, at Virginia, South Australia, in October 2001, we conducted a more thorough experiment to evaluate insect capture at different bucket heights. We placed six yellow-sticky-bucket traps 20 cm above ground, and six traps130 cm above ground in a broccoli field measuring 220 m x 100 m. Three of each height was placed at either end of the field, 25 m into the crop from the edge, and 14 m apart with different heights positioned alternately. In December 2001, at the same property, we conducted a movement experiment, the results are published elsewhere (Schellhorn and Silberbauer 2003), however an additional outcome of the movement study was that we evaluated several species of beneficial insects for the presence of the resin-based dye that were captured on the yellow-sticky-bucket traps. Effect of dyes on insect longevity We conducted a laboratory experiment to compare the possibility of toxic effects from Rhodamine b, and resin-based fluorescent dyes, on adult P. xylostella and D. semiclausum that had been reared in culture with wild types introduced every 18 months since 1998, and 2000 respectively. P. xylostella were reared on cabbage plants at 14L:10D light conditions and 25oC. D. semiclausum were reared on P. xylostella larvae feeding on cabbage plants grown under the same light and temperature conditions. There were four treatments, the three dyes (red water-soluble and green and pink resin-encapsulated) and water as a control, replicated five times. Each replicate contained 10 individuals, 5 males and 5 females for a total of 50 individuals of each species. All insects were newly emerged, collected the night before an experiment started. Insects collected until 9:00 am were considered early emergers, and those collected between 9:00 am and 12:00 am considered late emergers. Equal numbers of insects from the early and late groups were mixed to obtain an even distribution among replicates and treatments. P. xylostella adults were held in a 1L clear plastic container with a single screen side, and water. D. semiclausum were held in similar containers, but with drops of honey available for one hour after collection. D. semiclausum lives for 1-3 days without food (personal observation, C. Paull and G. Siekmann), so honey was supplied to extend life (as was shown with another parasitoid, Cotesia rubecula; Siekmann et al. 2001) in order to detect possible differences in mortality due to the dyes. P. xylostella lives up to 10 days without a sugar source and did not receive honey to prolong life.

204
One litre of each dye was prepared at the same rates as previously described. Groups of ten newly emerged insects were sprayed directly in the 1L cage with approximately 25 ml of dye solution or water alone. This amount was determined to mark the insects in a manner similar to that in the field. Insects were left to dry for 30 minutes, and then transferred into 40 cm3 cages made from aluminium frames covered with voile. Each cage (replicate) contained a potted cabbage plant with six leaves and water. The soil in the pots was covered with sand to reduce difficulty in locating dead insects. The cages with D. semiclausum contained drops of honey that was removed after 24 hours. P. xylostella were not fed. Insect survival was monitored three times a day (morning, noon, and evening) and dead insects were collected to determine sex and coverage with dye. Coverage was determined by examining insects under a dissecting microscope (40X) with a UV light source. Dye stability Preliminary observations indicated that Rhodamine B and SARDI Fluorescent Pigment dyes differed in the number of days that the mark could be detected. We investigated the stability of dyes under outdoor (UV light, rain, irrigation, and wind), and indoor conditions. One hundred dead adults each of P. xylostella and D. semiclausum were placed on paper towel in a tray and sprayed with one of the dyes (preparation and application as described previously). Yellow-sticky cards were cut in half and dyed insects were stuck on the cards. Each card had 90 similarly sprayed P. xylostella and D. semiclausum. The cards were then fixed with rubber bands to folded coat hangers and attached to a wire fence at 2 m height, facing an easterly direction outside of the insectary at the Waite Precinct. This would ensure a moderate exposure to direct sunlight each day. As a comparison, we placed 10 dead P. xylostella and 10 dead D. semiclausum on similar yellow sticky cards and stored them in a cool (20oC), dry and dark cabinet. The exposed and unexposed insects were viewed under a dissecting scope and UV light. We recorded if an individual was marked, and whether the intensity of the dye was greater than, equal to or less than a fresh spray of dye. For the first three days the cards were inspected daily, then every second day for six days and then every fourth day until 17 days. On day three, seven and 13, the exposed insects were sprayed with water for 15 minutes to simulate insects living in crops irrigated with overhead sprinklers. There were also periods of rain during the 17-day exposure. Statistical analysis A Z statistic was used to compare the proportion of brown lacewings and spiders marked with dye at two time intervals (Zar 1984). A two-factor ANOVA was used to analyse the effects of date and bucket height on the number of D. semiclausum and P. xylostella captured, and the statistical package SAS version 8 (1999) was used for the analysis. A goodness of fit test using the G statistic was performed on the contingency table for both the number of species marked with either the red water-soluble or green resin-based dye, and the number of species marked with red water-soluble dye over time. Survival data were analysed with a univariate survival analysis using the Kaplan Meier Method with subsequent Log rank and Wilcoxon tests (JMP vers. 4.0, SAS Institute, 2000). Results Field experiments – lupins and broccoli In lupins, the most abundant beneficial arthropods were brown lacewings, Micromus tasmaniae Walker (Neuroptera: Hemerobiideae), and several types of spiders including lynx, Oxyopes spp., tangle web, Achaearanea veruculata (Urguhart), and crab spiders (Thomisidae). The water-soluble Rhodamine b applied to the lupin crop marked resident brown lacewings and

205
spiders, and overall there were a higher proportion of lacewings marked compared to spiders (table 1). Marked individuals were still detected after five days (120 hours), but the proportion marked was less than those detected at 12 hours. However, there was no significant difference in the proportion of lacewings or spiders marked at 12 and 120 hours (Z= 0.028, df=2, P > 0.05). There was some movement of marked individuals from the 2.1 ha centre of the field into the surrounding un-dyed areas, yet this proportion did not change over time (Z=0.009, df=2, P > 0.05; table 1).
[Insert table 1 here] In the broccoli trial at St. Kilda, where we compared the two types of dye, both the red water-soluble and the green resin-based fluorescent dyes marked the two most abundant parasitic wasps in the system, D. semiclausum (0.44 + 0.31 per row metre) and A. ippeus (0.77 + 0.37 per row metre), and the pest, P. xylostella (1.11 + 0.75 per row metre) (mean number of individuals per row metre + SD; figure 1). There was a trend for a greater proportion of all three species to be marked by the green, resin-based dye compared to the red water-soluble dye, but the difference was not significant (G=1.52, df=2, P > 0.05; figure 1). This was most likely related to differences in dye stability (see below).
[Insert figure 1 here]
Suction samples collected from the St. Kilda broccoli sprayed with the red dye indicated that a high proportion of all three species were marked within the first 24 hours (figure 2). However, the proportion detected as marked significantly decreased over 72 hours (G=9.48, df=4, P < 0.05). D. semiclausum did not retain the dye as well as the other two species after 144 hours (figure 2).
[Insert figure 2 here]
In the dye stability experiment, the red water-soluble dye applied to the exposed insects began to fade within the first day and was almost completely gone by day five (figure 3). Neither the pink nor green resin-based dye applied to the exposed insects differed from the protected insects up to 17 days.
[Insert figure 3 here] The height of the yellow-sticky-bucket traps influenced the number of parasitoids and moths captured. At St. Kilda, the eight traps placed 20 cm above ground in the four broccoli fields, captured 3514 D. semiclausum, 72 A. ippeus, and 104 P. xylostella, whereas the four traps placed 130 cm above ground captured 12 individuals total, 3 D. semiclausum, 1 A. ippeus, and 8 P. xylostella. At Virginia, the trend was similar and yellow-sticky-bucket traps placed 20 cm above ground captured significantly more D. semiclausum , and P. xylostella than buckets placed 130 cm above ground (table 2).
[insert table 2 here]
At St. Kilda, yellow-sticky-bucket traps and suction sampling were also effective at capturing marked and unmarked individuals as they moved from the dyed field into other adjacent fields of broccoli (figures 4, and 5). However, each capture method had a bias. The greater proportion of males captured on traps compared to suction sampling suggests that males are attracted to the traps (table 3). For sex ratios for suction sampler data, the insect movement

206
data was combined with the data from the water-soluble dye samples (figure 2) because there were few numbers of individuals.
[insert table 3 here]
Species of beneficial insects from several orders were also marked and captured on yellow-sticky-bucket traps including Nueroptera: M. tasmaniae Walker, 21 marked out of 48 captured, Coleoptera: coccinellids (primarily Coccinella transversalus Fabricius, and Coccinella undecimpunctata L.), 3 marked out of 14 captured, and Hemiptera: Nabis kinbergii Reuter, 2 marked out of 6 captured. None of the dyes changed insect survival. There was no difference in survival for either P. xylostella (n=50, X2=0.763, P=0.858) or D. semiclausum (n=50, X2=1.2741, P=0.735). Ninety-nine percent of P. xylostella were dead by day 11, and the median longevity was 5.5 days, and 99% of D. semiclausum were dead by day five, and the median longevity was 3 days. Discussion Our findings demonstrate that spraying water-soluble and resin-based fluorescent dyes on populations of insects in the field is an effective marking method for several species in a variety of orders. In our studies, the water-soluble dye appeared to stain the insect cuticle and resulted in a highly visible mark for soft-bodied insects (eg. moths, lacewings, spiders, aphids, flies), but did not provide a good mark for glabrous insects such as coccinellids. In the lupin field, coccinellid densities at the time of spraying were 0.35 (+ 0. 52) per metre (Mean + SD), yet we rarely found marked individuals. When we applied the water-soluble dye surfactant mix to individuals (primarily C. transversalis and Micraspis frenata Erichson) in the laboratory the dye did not readily stain the elytra, and only the tarsi were dyed. Resin based dyes appear to mark glabrous insects as well as soft-bodied insects. In a recent study investigating property-to-property movement of beneficial insects and P. xylostella, coccinellid densities were high, and numerous individuals (primarily C. transversalis and C. undecimpunctata) were marked (unpublished data, Nancy Schellhorn). Although we were unable to use a suction sampler to collect insects from the vegetation dyed with the resin, we were able to use it to collect marked individuals from un-dyed vegetation, thus monitor their movement. The resin-based dye is formulated to stick to waxy surfaces (eg. waxy leaves) and adheres well to numerous types of insect cuticle. When a suction-sampler is used on plants where the resin dye has been sprayed the vacuum pulls the resin off of the surfaces of leaves and contaminates the insects. In addition, the water-soluble dye degrades quickly when exposed to the elements (UV and rain or irrigation), whereas the resin-based dye remained unchanged. This was seen in both the experiment with the proportion of species marked at 72 hours, and the experiment on dye stability. It is not clear why there was such a dramatic difference in the proportion of D. semiclausum dyed with the water-soluble dye compared to the resin-based dye. D. semiclausum and A. ippeus are both diurnal (P. xylostella is noctural) so the prediction would be for the water-soluble dye to degrade more quickly on the parasitoids than on P. xylostella. The yellow-sticky-plate traps, yellow-sticky-bucket traps and suction sampler were all effective in capturing species of interest. However there are biases associated with each. The yellow-sticky-plates and buckets may attract some species because of the wavelength and reflectance emitted. The yellow colour of our traps was in the wavelength range of 556-892 nm, with a reflectance of 110% over the entire range. In comparison, most green leaves reflect most of their light between 500-600 nm, and the maximum amount of energy reflected from the surface

207
of most green leaves is less than 20%, and the peak of the reflectance lies between 540 and 560 nm (Kennedy et al 1961, Pearman 1966). In the future, we will conduct an experiment with green buckets that are similar in wavelength range and % reflectance to the plant. The strong male bias on the sticky traps may be a true representation of insect movement and that males spend more time moving between plants searching for mates, or it could be an artefact of the trap, and once a virgin female is trapped males are attracted to her and are captured. The natural population of D. semiclausum and P. xylostella is male biased (as indicated by suction sampling), so competition for females may be great. This possibility will be explored further with a wind-tunnel experiment. Although the dye does not change the survival of D. semiclausum or P. xylostella, it is possible that it could inhibit movement or change grooming behaviour. A study is underway that compares the movement of D. semiclausum and A. ippeus that have been marked with trace elements (eg. rubidium, caesium) versus resin based dye. The height of the sticky trap was also important. Traps with the base placed 20 cm above ground, and nearly level with the crop canopy, captured far more D. semiclausum, A. ippeus, P. xylostella, coccinellids, nabids and lacewings than traps 130 cm above ground, and would have extended about 80 cm above crop canopy. Although the traps placed 130 cm above ground captured similar total amounts of insects, greater than 75% were flies. Marked individuals of the three species were captured at most distances, even though there was only eight yellow-sticky-bucket traps 20 cm above ground in 12,000 sq m of broccoli. Of the capture methods used, suction sampling was the method that provided the best un-biased estimate of dispersal from a source, and realistic sex ratio estimates. However, this method has biases and does neglect some groups of insects (see work by Stanley (1997). In dispersal work by Schellhorn and Silberbauer (2003) we were able to use suction sampling at 12 m intervals to 120 m to describe the response of D. semiclausum before and after cultivation of the dyed field. Because a suction device takes an instantaneous sample in time, more effort was required to generate large numbers of individuals, than for the sticky traps that were continually sampling from a static location. Although the use of dyes and paints to mark insects is by no means new, the application of resin-based fluorescent dyes to natural field populations of beneficial insects (and the relevant pest) has numerous applications to advance Integrated Pest Management and conservation biological control. For example, this method can be used to assess whether beneficial insect dispersal from on-farm refuges results in movement into the crop. Access to multiple colours of resin-based dye means that it is possible to monitor population movement from several different sources to different sinks simultaneously. In addition, given that the resin-based dye did not deteriorate after nearly 3 weeks exposure to UV and irrigation, it could also be used to conduct insect longevity studies. Acknowledgments We thank Karen Stanford and Liz Barker in Narrabri, NSW for their assistance in the field. Peter J. James provided helpful comments in the manuscript. We thank the Cotton Research and Development Corporation and Horticulture Australia Ltd for financial support to conduct these experiments. Literature Cited Bell, M.R. 1988. Heliothis virescens and H. zea (Lepidoptera: Noctuidae) feasibility
of using oil-soluble dye to mark populations developing on early-season host plants. Journal of Entomological Science 23:223-228.

208
Darling, S.T. 1925. Entomological research in malaria. Southern Medical Journal. 18:446-449.
Gentry, C.R., and Blythe, J.L. 1978. Lesser peach tree borers and peach tree borers:
a device for trapping, collecting, and marking native moths. Environmental Entomology. 7:783-784.
Hagler, J. R. and Jackson, C. G. 2001. Methods for marking insects: Current techniques and
future prospects. Annual Review of Entomology, 46:511-543. JMP version 4. 2000. SAS Institute Incorporated. Cary, NC, USA. Kennedy, J.S., Booth, C.O. and Kershaw, W.J.S. 1961. Host finding by aphids in the
field. III. Visual Attraction. Annals of Applied Biology. 49:1-21. Pearman, G.I. 1966. The reflection of visible radiation from leaves of some western
Australian species. Australian Journal of Biological Science. 19:97-103. Prasifka, J.R. Krauter, P. C., Heinz, K.M., Sansone, C.G., Minzenmayer, R.R. 1999.
Predator conservation in cotton: using grain sorghum as a source for insect predators. Biological Control 16:223-229.
Reynolds, D.R., Riley, J.R., Armes, N.J., Cooter, R.J., Tucker, M.R. and Colvin, J.
1997. Techniques for quantifying insect migration. In: Methods in ecological and agricultural entomology. eds. Dent, D.R. and M. P. Walton. CAB International. University Press, Cambridge Pp. 111-133.
Rose, D.J.W., Page, W.W., Dewhurst, C.F., Riley, J.R., Reynolds, D.R., Pedgley,
D.E. and Tucker, M.R. 1985. Downwind migration of the African armyworm moth, Spodoptera exempta, studied by mark-and-capture and by radar. Ecological Entomology 10:299-313.
SAS version 8.2. 1999. SAS Institute Incorporated. Cary, NC, USA. Schellhorn, N.A. and Silberbauer, L.X. 2003. The role of surrounding vegetation and
refuges: Increasing the effectiveness of natural enemies in cotton and broccoli systems. Proceedings for the 1st International Symposium on the Biological Control of Arthropods. Honolulu, Hawaii, USA Pp. 235-243.
Siekmann, G., Tenhumberg, B., and Keller, M.A. 2001. Feeding and survival in
parasitic wasps: sugar concentration and timing matter. Oikos 95:425-430.
Stanley, J. 1997. The seasonal abundance and impact of predatory arthropods on
Helicoverpa spp. in Australian Cotton Fields. Ph.D. thesis, University of New England, Armidale.
Zar, J. 1984. Biostatistical Analysis. 2nd edition. Prentice-Hall Press, New Jersey,
USA. Pp. 395-396.

209
Table 1. Proportion of brown lacewings and spiders marked with red water-soluble dye captured with a suction sampler in dyed and un-dyed lupin crops. Number in brackets is the number of individuals captured. Time after spraying dye Species 12 hrs 120 hrs Brown lacewings Dyed lupin 0.74 (191) 0.40 (98) Un-dyed lupin 0.11 (149) 0.08 (79) Spiders Dyed lupin 0.26 (129) 0.11 (140) Un-dyed lupin 0.02 (105) 0.01 (104) Table 2. Mean (+ SD) number of D. semiclausum and P. xylostella captured on yellow-sticky-buckets placed 20 cm and 130 cm above ground, on two dates, at Virginia, South Australia. A two-factor ANOVA was used to analyse the effects of date and height on numbers of insects captured. 20 cm 130 cm D. semiclausumα 9 October 2001 2.66 (+ 0.41) 0.16 (+ 0.41) 18 October 2001 16.5 (+ 8.91) 1.0 (+ 1.67) P. xylostellaβ 9 October 2001 57.0 (+ 43.20) 2.16 (+ 2.40) 18 October 2001 67.5 (+ 41.45) 4.16 (+ 2.48) α indicates significant difference between bucket height (F=16.59, df=1, P = 0.0005), and date (F=11.01, df=1, P = 0.003). β indicates significant difference between bucket height (F=24.29, df=1, P < 0.0001). The effect of date is not significant (F=0.27, df=1, P=0.6076). Table 3. Sex ratio of D. semiclausum, A. ippeus, and P. xylostella captured from St. Kilda with a suction sampler and yellow-sticky-bucket traps. Number in brackets is the number of individuals captured. Sex Ratio (M : F) Species Suction sampler YSB traps D. semiclausum 2.1 : 1 (161) 25 : 1 (3514) A. ippeus 0.2 : 1 (136) 1 : 1 (72) P. xylostella 4 : 1 (213) 2.2 : 1 (104)

210
Figure legends Figure 1. Proportion of D. semiclausum, A. ippeus, and P. xylostella marked with either red water-soluble or green resin-based dye at St. Kilda, South Australia. Insects were captured on yellow-sticky-plate traps from 0-72 hours after spraying the dyes. Number above bar is the number of individuals captured. Figure 2. Proportion of D. semiclausum, A. ippeus, and P. xylostella marked with red water-soluble dye at St. Kilda, South Australia. Insects were captured with a suction sampler in the dyed broccoli field at 24, 72 and 144 hours after the dye was sprayed. Number above bar is the number of individuals captured. Figure 3. The change in detection over time of red water-soluble dye on D. semiclausum and P. xylostella exposed to the elements compared to protected insects. Numbers in parentheses are hours. Figure 4. The number of D. semiclausum, A. ippeus and P. xylostella captured on yellow-sticky-bucket traps placed 20 cm above ground, at four distances at St. Kilda, South Australia. The number of individuals captured at each distance from 41-81 m was 1542, 1129, 898 and 121, respectively. Figure 5. The number of D.semiclausum, A. ippeus and P. xylostella captured with a suction sampler at four distances from the dyed field at St. Kilda, South Australia. The number of individuals captured at each distance from 27-68 m was 32, 13, 10, and 10, respectively.

211
957
18 11
1162
1117
0
0.1
0.2
0.3
0.4
0.5
0.6
0.7
D. semiclausum A.ippeus P. xylostella
Species
Prop
ortio
n m
arke
d
red water-solublegreen resin-based
30
20
63
54
50
32
78
27
91
0
0.1
0.2
0.3
0.4
0.5
0.6
0.7
0.8
24 72 144
Hours after spraying dye
Prop
ortio
n m
arke
d
D. semiclausum
A. ippeus
P. xylostella
Figure 1
D. semiclausum
A. ippeus
P. xylostella
Figure 2

212
0%
20%
40%
60%
80%
100%
0 1(24)
1(32)
2 3 5 7 9 13 17
Perc
ent m
arke
d
samefadedgone
Days
0
10
20
30
40
50
60
70
41 m 54 m 68 m 81 m
Distance from dyed field
Num
ber m
arke
d
D. semiclausum, n=3514
A. ippeus, n=72
P. xylostella, n=104
Figure 3
Figure 4

213
0
1
2
3
4
27 m 41m 54 m 68 m
Distance from dyed field
Num
ber m
arke
d
D. semiclausum, n=48
A. ippeus, n=0
P. xylostella, n=17
Figure 5

214
APPENDIX H THE ROLE OF SURROUNDING VEGETATION AND REFUGES: INCREASING THE EFFECTIVENESS OF PREDATORS AND PARASITOIDS IN COTTON AND BROCCOLI SYSTEMS N. A. Schellhorn1 and L. Silberbauer2
1South Australian Research and Development Institute (SARDI), Adelaide, Australia 2School of Environmental Science and Natural Resource Management, University of New England, Armidale, New South Wales, Australia INTRODUCTION The direct effects of cultural practices on insect pests have been extensively evaluated (Rabb et al., 1984; Herzog and Funderburk, 1986; Dent, 2000). The majority of these practices have been designed to modify crop production to lower pest densities through sanitation, destruction of alternate habitats or hosts used by the pest, tillage, crop rotation or fallowing, manipulation of planting and harvesting dates, trap cropping, and manipulation of vegetational diversity. How cultural practices can be used to increase the effectiveness of natural enemies of insect pests has been less studied (Schellhorn et al., 2000). Cultural practices can affect natural enemy population density and species diversity, and manipulation of these practices can provide the foundation for conservation biological control. Many studies demonstrate that cultural practices affect natural enemies. Trap crops (Corbett et al., 1991), rotation crops (Xia, 1994), creation of hedge rows (Coombes and Sotherton, 1986; Wratten and Thomas, 1990; Dennis et al., 2000), and manipulation of noncrop habitat can enhance natural enemy abundance (Banks, 1955; Perrin, 1975; Andow, 1991; Schellhorn and Sork, 1997; Landis et al, 2000). However, the majority of these studies are descriptive and usually compare only the abundance of natural enemies in one production system or habitat to another. In order to develop predictions about how particular cultural practices change the abundance or effectiveness of predators and parasitoids, it is necessary to understand the underlying population processes, such as movement, reproduction, and longevity (Corbett and Plant, 1993; Prasifka et al., 1999; Schellhorn et al., 2000). Here we report on the use of novel marking techniques to monitor the movement of natural populations of insect predators and parasitoids at the landscape and whole farm levels. We conducted studies in two distinct systems in Australia: cotton in New South Wales and broccoli in South Australia. The cotton (Gossypium hirsutum L.) system was characterized by a summer crop that grows for six months, followed by bare soil for six months, requiring that pests and natural enemies colonize each field anew at the beginning of the cropping season. The broccoli (Brassica oleracea L. var. “marathon”) system was characterized by Mediterranean climate (hot, dry summers and cool, wet winters), where brassica vegetables are in continuous production year round. This results in resident populations of the major pest and its parasitoids.
MATERIALS AND METHODS Cotton system Insect predator abundance in crops and noncrops. Insect samples were taken from vegetation in the Namoi Valley in northern New South Wales, Australia. Sampling focused on three cotton fields, one on each of three farms, which were within a 4 km radius of each other. At each site we employed a standardized sampling technique of running a suction sampler across random 20

215
m sections of vegetation, repeated five times. The details of this method including the types of vegetation sampled are outlined in Silberbauer and Gregg (2002). Movement of insect predators. To determine whether insect predators were moving among the different types of vegetation, a subsample (n=199) of insects collected were examined for pollen. Insect specimens were prepared for scanning electron microscopy (sem) by breaking them into four or five pieces, and then adhering them to SEM stubs using double-sided poster tape. SEM stubs were placed in a low-temperature oven (40-60 oc) for at least 12 hours prior to sputter coating with gold. Each piece of insect was then examined under at least 500x magnification. Any pollen found was examined under at least 1000x magnification and identified using Peter Gregg’s pollen SEM photographic library (unpublished) and Jones et al. (1995). As many pollen species as possible were identified to species or family level. Because the descriptions of Australia’s pollen flora is still incomplete, many of the pollen grains could not be identified, and thus were just labelled with numbers. All pollen species found were photographed and given identifying numbers.
Broccoli system The Adelaide plains is the main vegetable producing area of South Australia. Brassica vegetables are in continuous production year round, which results in a resident population of the major pest, the diamondback moth, Plutella xylostella (L.), and its most abundant parasitoid, Diadegma semiclausum (Hellén). Pest and parasitoid abundance in mature broccoli. Monitoring the movement of natural populations of insects in fields involves three steps. First the density of insects of interest must be sufficiently high to allow the use of mark and capture techniques. Second, the mark must be identifiable on the species of insects that are to be evaluated. Third, the capture methods must not cause any cross contamination or removal of the mark, and any biases should be known. To monitor the movements of P. xylostella and D. semiclausum from mature to young broccoli, we created conditions favouring rapid insect population growth by withholding irrigation for two weeks and insecticides for five weeks. In addition, because the experiment took place on a grower’s property, we arranged for the grower to withhold insecticides on all adjacent broccoli bays (long narrow adjacent fields, usually 210 m x 10 m, separated by a 1.5 m alley) for ten days (Fig. 1), even though Dipel® was the only product used on the property over the previous three months and was used infrequently. To determine if the mature bay of broccoli had sufficiently high insect densities to successfully employ spray of a fluorescent dye as a marker, we sampled a bay (210 x 10 m) for insects using a suction sampler at 30 row meters of plants, replicated ten times. From past experience we had determined that the density of a species needed to be ca one per row metre to have enough individuals in a field to mark and monitor movement.
133 m
216
Movement of pest and parasitoids. The experiment to assess moth and parasitoid movement was conducted in Virginia, South Australia, on a property that had eleven bays of broccoli in production (each bay measuring 210 x 10 m with a 1.5 m alley), and bare cultivated soil surrounding the cropped field (Fig. 1). We used a novel marking technique and sprayed a nontoxic, fluorescent resin-based dye (SARDI Fluorescent Pigment) in the broccoli field to mark natural populations of P. xylostella moths and their main larval parasitoid, D. semiclausum. In a prior experiment, we established that our dye marked the moth and the parasitoid, and that we were able to capture these species with suction sampling and yellow-sticky-bucket traps (inverted 9 liter buckets, with a 5 cm wide ring made of particle board around the base; all coated with tangle trap) placed 20 cm from the ground. At the time of our experiment, the youngest bay of broccoli was three weeks from harvest and the three most mature bays of broccoli were no longer suitable to harvest, so plants in all bays were similar in the amount of vegetative growth. To determine if P. xylostella and D. semiclausum move from mature to young broccoli before cultivation we sprayed 120 liters of the dye mixture on the entire 210 x 10 m bay of broccoli. Next, we placed four yellow-sticky-bucket traps 20 cm from the ground per bay in each of five alternating bays, plus the bay that was sprayed with the fluorescent dye. Forty-eight hours after spraying the dye, we used a suction sampler in each of the 10 bays not treated with dye (the dyed bay was excluded because suction sampling on plants with the resin picks up fluorescent dye and cross contaminates samples) to sample 30 m sections at three locations per bay. Five days after spraying the dye, we removed the yellow-sticky-bucket traps from all plots and subsampled two alternate quadrats of the traps for moths and parasitoids. To determine whether diamondback moth and D. semiclausum move from mature to younger broccoli when there is a disturbance from cultivation, we proceeded in the same manner as above. After spraying the dye and placing the yellow-sticky-buckets in the bays of broccoli, the dyed bay was cultivated (the usual practice after broccoli is harvested) leaving only bare soil, thus forcing the mobile insects from the broccoli. The yellow-sticky-buckets were removed from all bays three days after setting them up. Statistical analysis. The Kolmogorov-Smirnov goodness-of-fit test was used to determine the difference in the distribution of the parasitoids and moths before and after cultivation. A sign test was used to detect the difference in direction of the pattern of dispersal for the parasitoid and moth, before and after cultivation. RESULTS Cotton system Insect predator abundance in crops and noncrops. There were six species of abundant generalist insect predators extracted from the samples: transverse ladybird, Coccinella transversalis (Fabricus); minute two-spotted ladybird, Diomus notescens (Blackburn); a damsel bug, Nabis (tropiconabis) kinbergii Reuter; red and blue beetle, Dicranolaius bellulus (Guerin-Meneville); a green lacewing, Mallada signatus (Schneider); and a brown lacewing, Micromus tasmaniae (Walker). The average number of individuals of these six species summed that were collected from each type of vegetation through the season varied (fig. 2). Cotton, lucerne, and wheat had the highest densities of adult insect predators in spring; cotton, sorghum, and sunflower had the highest densities in early summer; and by mid summer the highest populations were in sorghum. By late summer the abundance of insect predators dropped to almost zero, with a few remaining in cotton, sorghum, pasture, or lucerne.

217
Movement of insect predators around cotton landscape. Of the 199 individuals examined, 170 (85%) carried pollen, and all six predator species had individuals that carried pollen. Of the individuals with pollen, 151 (89%) carried more than one type (“species”) of pollen. This pattern was similar for the two most abundant species captured in cotton; 72% of D. notescens (n = 47) and 82% of M. tasmaniae (n = 35) carried more than one type of pollen. The pollen types carried most frequently by M. tasmaniae were Bishop’s weed, Ammi majus, (L.), cotton, other Malvaceae and Eucalyptus spp., and by D. notescens were other Malvaceae, Bishop’s weed and Eucalyptus spp. For those individuals captured outside of cotton, 90% of M. tasmaniae (n = 10), carried more than one type of pollen and 75% carried cotton pollen; and for D. notescens (n = 14) 57% carried more than one type of pollen and 40% carried cotton pollen. Broccoli system Pest and parasitoid abundance and movement from mature to young broccoli. Immediately before spraying fluorescent dye on the mature broccoli bay (and resident insect populations), the adult P. xylostella and D. semiclausum densities were 0.75 +0.57 (SD) and 1.01 + 0.50 (SD) per row meter, respectively. Based on results from suction sampling before cultivation, marked P. xylostella did not appear to move far as all marked individuals were captured within 36 m of the dyed bay. However, after cultivation, one marked P. xylostella was captured as far as 60 m from the dyed bay, yet there was no difference in their distribution before and after cultivation (D = 0.10, df = 9, P = 0.666). The result from the yellow-sticky-bucket traps was
0
1
2
3
4
5
6
7
8
9
10L
ucer
nePa
stur
eC
otto
nL
ucer
nePa
stur
eW
heat
Pate
rson
's C
urse
Euc
alyp
tus
Bis
hop'
s Wee
dC
otto
nL
ucer
nePa
stur
eW
heat
Lip
pia
Euc
alyp
tus
Sunf
low
erSo
rghu
mB
isho
p's W
eed
Cot
ton
Luc
erne
Past
ure
Whe
atE
ucal
yptu
sSu
nflo
wer
Sorg
hum
Cot
ton
Luc
erne
Past
ure
Whe
atE
ucal
yptu
sSo
rghu
m
Mea
n nu
mbe
r pe
r 20
row
met
res
Winter Spring Early Summer Mid Summer Late Summer
Fig. 2. Mean number (± 1 SE) of the six most abundant insect predators summed in each type of vegetation per seasonal period.

218
different than from the suction sampling due to the time and type of capture. The moth, P. xylostella, moved as far as 108 m (the farthest distance sampled in broccoli) from the dyed bay both before and after cultivation (two and one marked individuals, respectively), but their distribution did not differ (D = 0.33, df = 5, P = 0.400; Table1). When considering the pattern of dispersal found on yellow-sticky-bucket traps, the direction of the difference of marked P. xylostella captured was greater at each distance before cultivation compared to after cultivation (C 0.05 (0)6, P < 0.01). Table 1. Proportion of marked P. xylostella moths captured on yellow-sticky-bucket traps before and after cultivation. “0” metres is the source of marked insects.
Distance from dyed broccoli (m)
0 12 36 60 84 108 Before cultivation (n=1128) 0.40 0.13 0.03 0.05 0.02 0.01 After cultivation (n=1137) 0.08 0.01 0.03 0.00 0.01
The dispersal pattern of D. semiclausum differed from that of P. xylostella adults. Based on results from suction sampling before cultivation, 5% of marked D. semiclausum were captured 60 m from the dyed bay (Fig. 3). After cultivation, the dispersal of marked D. semiclausum was greater (D = 0.50, df = 9, P = 0.037), and 7% of marked individuals were captured at 108 m from the dyed bay with greater than 50% of marked individuals dispersing farther than the closest bay of broccoli, 12 m from the dyed broccoli (Fig. 3).
Fig. 3. Proportion of marked D. semiclausum captured with a suction sampler (numbers above bars are numbers of wasps captured). “0” metres is the source of marked insects.
5 4
5 67 9
9 4 5 4 8 2 4 3 8 1 5 3 5 0
1 7
4 1 6 6 6 0
7 5 3 5 4 8 1 0 0 7 26 1
0
0.1
0.2
0.3
0.4
0.5
12 24 36 48 60 72 84 96 108 120
Dis tanc e from dyed broc c oli (m )
Prop
ortio
n m
arke
d
Befo re cu ltiv ationA fter cu ltivatio n

219
D. semiclausum was captured on the yellow-sticky-bucket traps as far as 108 m before and after cultivation, and there was no difference in their dispersal (D = 0.50, df = 5, P = 0.208; Fig. 4). However, the direction of the difference in dispersal of marked D. semiclausum was greater after cultivation than before cultivation–the opposite from that for diamondback moth (C 0.05
(1)6 , P < 0.01).
Although we have focused on dispersal before and after cultivation, it should be noted that dispersal over time maybe confounded with cultivation for the moths. This could have only been avoided if two colors of resin-based dye had been available (which we now have). Results from our laboratory experiments showed that 99.8% of D. semiclausum die within 5 days without a sugar source, and the average longevity is 2.9 days, and 99.8% of P. xylostella die within 11 days and the average longevity is 5.7 days (Schellhorn, unpublished data). There were five days between the cultivation experiments which suggests that the parasitoids were unlikely to have lived long enough for this issue to be important. However, P. xylostella is likely to have lived long enough, yet there was equal or less dispersal after cultivation which suggests that the issue was not important for the moths.
DISCUSSION Our results from the cotton system show that insect predators of cotton pests are present in several types of vegetation throughout the year. In addition, we found that the two most abundant insect predators, M. tasmaniae and D. notescens, visit several types of vegetation before moving into cotton, and move back and forth between cotton and other types of vegetation. These findings suggest that particular types of vegetation on-farm or in the larger landscape may conserve and enhance local populations of insect predators. Our results from the broccoli system show that the patterns of movement for P. xylostella adults and D. semiclausum before and after cultivation were different. For P. xylostella adults, the results from suction sampling suggest limited dispersal before and after cultivation, a finding similar to that of our preliminary experiments (Schellhorn, unpub.). Results from the yellow-
Fig. 4. Proportion of marked D. semiclausum captured on yellow-sticky-bucket traps before and after cultivation, (numbers above bars are numbers of wasps captured). “0” metres is the source of marked insects.
8361036809705
266
321
666208396239
206
0
0.1
0.2
0.3
0.4
0.5
0.6
0.7
0 12 24 36 48 60 72 84 96 108 120
Distance from dyed broccoli (m)
Prop
ortio
n m
arke
d
Before cultivationAfter cultivation

220
sticky-bucket traps showed that P. xylostella dispersed to 108 m, but the majority of marked individuals dispersed to the adjacent broccoli before and after cultivation. However, for D. semiclausum, the majority of marked individuals dispersed further than the adjacent broccoli. Fewer D. semiclausum dispersed before cultivation than after cultivation, suggesting that disturbance increased parasitoid movement, which was not the case for P. xylostella. The difference in the degree of dispersal suggested by suction sampling versus yellow-sticky-bucket traps before cultivation was most likely caused by the difference in the sampling date: suction sampling was conducted 48 hours after the broccoli bay was first treated with dye, versus 96 hours for the yellow-sticky-bucket traps. In large-scale monocultures, such as New South Wales cotton, planting of early-season annuals or early-flowering perennials may improve overwintering conditions, or increase colonization and subsequent population increase by M. tasmaniae or D. notescens before the occurrence of populations of summer pests. This appears to be happening in grapes in the western United States of America, where the solitary egg parasitoid Anagras spp., overwinters in French prune trees that harbor an alternative host (Doutt and Nakata, 1973; Kido et al., 1984). In the early spring, Anagrus spp. colonizes adjacent vineyards and plays a critical role in increasing parasitism and controlling populations of western grape leafhopper (Corbett and Rosenheim, 1996; Murphy et al., 1998). The next study in cotton will be to test particular annuals or perennials for improved overwintering and subsequent colonization of cotton. In the broccoli system, production is continuous so natural enemies have to be maintained, disturbance minimized and population increase encouraged throughout the year without causing an increase in pests. Maintaining bays of harvested, uncultivated broccoli (a type of refuge) at 70 m intervals may allow parasitoid populations to build-up and move into adjacent, younger plantings. Disturbance, such as harvest or cultivation, can disrupt biological control (Schellhorn et al., 2002; Honěk 1982; Carillo 1985). Maintaining on-farm refuges may reduce the effects of such disturbances on natural enemies and increase recolonization (van den Bosch et al., 1966; Mullens et al., 1996). Pollen and resin-based fluorescent dye are excellent tools to monitor movement of field populations of natural enemies and pests. The data from this project show that information on species-specific behavior and population processes, particularly movement, are helpful to manage cultural practices intended to increase natural enemy abundance as part of a biological control program. By increasing our knowledge of natural enemies and pests in relation to habitat use, we should be able to make predictions about how to implement effective cultural practices to manage pest insects. ACKNOWLEDGMENTS We thank Peter Gregg, Greg Baker, Cate Paull, Gitta Siekman, Dave Britton, Liza Costa, Richard Tennant, and Bronwyn Haller for technical assistance and John and Robyn Watson, Rob Evans and Keith Harris, Wayne Halder, John and Steve Newman for access to their properties. We thank Peter Garlick for his help with the scanning electron microscopy study. Funds were provided by Horticulture Australia Limited and the Australian Cotton Cooperative Research Centre. References Andow, D. A. 1991. Vegetational diversity and arthropod population response. Annual
Review of Entomology 36: 561-586.

221
Banks, C. J. 1955. An ecological study of Coccinellidae (Col.) associated with Aphis fabae Scop. on Vicia faba. Bulletin of Entomology Research 46: 561-587.
Carillo, J. R. 1985. Ecology of , and aphid predation by, the European earwig, Forficula auricularia L. in grassland and barley. Ph.D. thesis, University of Southampton, Southampton, United Kingdom.
Coombes, D. S. and N. W. Sotherton. 1986. The dispersal and distribution of polyphagous predatory Coleoptera in cereals. Annals of Applied Biology 108: 461-474.
Corbett, A. and R. E. Plant. 1993. Role of movement in the response of natural enemies to agroecosystem diversifcation: A theoretical evaluation. Environmental Entomology 22: 519-531.
Corbett, A. and J. A. Rosenheim. 1996. Impact of a natural enemy overwintering refuge and its interaction with the surrounding landscape. Ecological Entomology 21: 155-164.
Corbett, A., T. F. Leigh, and L. T. Wilson. 1991. Interplanting alfalfa as a source of Metaseiulus occidentalis (Acari: Phytoseiidae) for managing spider mites in cotton. Biological Control 1: 188-196.
Dennis, P., G. L. A. Fry, and A. Andersen. 2000. The impact of field boundary habitats on the diversity and abundance of natural enemies in cereal, pp. 195-214. In Ekbom, B., M. Irwin and Y. Robert (eds.). Interchanges of Insects. Kluwer Academic Publishers. Dordrecht, The Netherlands.
Dent, D. 2000. Insect Pest Management (2nd Edition). CABI Publishing, NewYork Doutt, R. L. and J. Nakata. 1973. The Rubus leafhopper and its egg parasitoid: An endemic
biotic system useful in grape-pest management. Environmental Entomology 2: 381-386. Herzog, D. C. and J. E. Funderburk. 1986. Ecological bases for habitat management and pest
cultural control, pp. 217-250. In M. Kogan (ed.). Ecological Theory and Integrated Pest Management Practice. John Wiley and Sons, New York.
Honěk, A. 1982. The distribution of overwintered Coccinella septempunctata L. (Col., Coccinellidae) adults in agricultural crops. Zeitschrift für Angewandte. 94: 311-319.
Jones, G. D., V. M. Bryant, M. H., Lieux, S. D., Jones, and P. D. Lingren. 1995. Pollen of the Southeastern United States: With Emphasis on Melissopalynology and Entomolopalynology, Series Number 30, American Association of Stratigraphic Palynologists Foundation, College Station, Texas, U.S.A.
Kido, H., D. L. Flaherty, D. F. Bosch, and K. A. Valero. 1984. French prune trees as overwintering sites for the grape leafhopper egg parasite. American Journal of Enology and Viticulture 35: 156-160.
Landis, D. A., S. D. Wratten, and G. M. Gurr. 2000. Habitat management to conserve natural enemies of arthropod pests in agriculture. Annual Review of Entomology 45: 175-201.
Mullens, B. A., N. C. Hinkle, and C. E. Szijj. 1996. Impact of alternating manure removal schedules on pest flies (Diptera: Muscidae) and associated predators (Coleoptera: Histeridae, Staphylinidae; Acarina: Macrochelidae) in caged-layer poultry manure in southern California. Journal of Economic Entomology 89: 1406-1417.
Murphy, B. C., J. A. Rosenheim, R. V. Dowell, and J. Granett. 1998. Habitat diversification tactic for improving biological control: parasitism of the western grape leafhopper. Entomologia Experimentalis et Applicata 87: 225-235.
Perrin, R. M. 1975. The role of the perennial stinging nettle, Urtica dioica, as a reservoir of beneficial natural enemies. Annals of Applied Biology 81: 289-297.
Prasifka, J. R., P. C. Krauter, K. M. Heinz, C. G. Sannone, and R. R. Minzenmayer. 1999. Predator conservation in cotton: Using grain sorghum as a source for insect predators. Biological Control 16: 223-229.
Rabb, R. C., G. K. DeFoliant, and G. G. Kennedy. 1984. An ecological approach to managing insect populations, pp. 697-725. In Huffaker, C. B. and R. L. Rabb (eds.). Ecological Entomology, John Wiley and Sons, New York.

222
Schellhorn, N. A. and V. L. Sork. 1997. The impact of weed diversity on insect population dynamics and crop yield in collards, Brassica oleraceae (Brassicaceae). Oecologia 111: 233-240.
Schellhorn , N. A., J. P. Harmon, and D. A. Andow. 2000. Using cultural practices to enhance insect pest control by natural enemies, pp. 147-170. In Rechcigl, J. E. and N. A. Rechcigl (eds.). Insect Pest Management: Techniques for Environmental Protection. CRC Press, Boca Raton, Florida, USA.
Schellhorn, N. A., T. R. Kulman, A. C. Olson, and A. R. Ives. 2002. Competition between native and introduced parasitoids of aphids: non-target effects of biocontrol. Ecology 83: 2745-2757.
Silberbauer, L. and P. Gregg. 2002. Tracing short-term beneficial insect movement through insect-borne pollen. In R. Van Driesche (ed.). Proceedings of the First International Symposium on the Biological Control of Arthropods. January 14-18, 2002, Honolulu, Hawaii, U.S.A., United States Forest Service (this proceedings).
Wratten, S. D. and C. F. G. Thomas. 1990. Farm-scale spatial dynamics of predators and parasitoids in agricultural landscapes, pp. 219-237. In R. G. H. Bunce and D. C. Howard (eds.). Species Dispersal in Agricultural Habitats. Belhaven Press, London.
van den Bosch, R., E. I. Schlinger, C. F. Lagace, and J. C. Hall. 1966. Parasitisation of Acyrthosiphon pisum (Harris) (Homoptera: Aphididae) by Aphidius smithi Sharma & Subba Rao (Hymenoptera: Aphididae) a density dependent process in nature. Ecology 47: 1049-1055. Xia, J. 1994. An integrated cotton insect pest management system for cotton-wheat intercropping in North China. p. 617. In G. A. Constable and N. W. Forrester (eds.). Proceedings of the World Cotton Research Conference–I: Challenging the Future,. August 1994, Brisbane, Australia, Commonwealth Scientific and Industrial Research Organization Publishing, Canberra, Australian Capital Territory, Australia.

223
APPENDIX I
COMMUNICATION PLAN

224
IMPLEMENTING INTEGRATED PEST MANAGEMENT OF DIAMONDBACK MOTH
Reference No: VG 00055
COMMUNICATION PLAN 2000 - JUNE 2003
Prepared by Dijana Jevremov IPM Adoption Coordinator
CONTENTS PAGE Why This Communication Plan Is Needed…………………………………….. Introduction………………………………………………………………………... Aims………………………………………………………………………………... The Plan Strategies Explained……………………………….…………………. Other Strategies That Could Be Considered………….……………..………... Timetable…………………………………………………………………………..
1 1 2
2-10 10 12
225
Why this Communication Plan is Needed The sole reliance on chemicals for pest and disease problems in Brassica vegetable growing is highly prevalent around Australia. It is well recognised in the research sphere that this is not a workable long-term solution for horticultural crop problems. This is mainly because of the risks of insecticide resistance and the build-up of secondary pests. Integrated Pest Management is the internationally and nationally recognised alternative for pest management that is sustainable in the long term. In addition, there are benefits for the environment and the grower that are not widely spoken about in the industry, but are becoming increasingly important issues. Integrated Pest Management (IPM) is about bringing into play a wide range of tactics to prevent pests from reaching damaging population levels in crops. This relies on a thorough knowledge of key components of IPM by growers and their consultants, and empowers them to make decisions and forecasts that are different from their traditional modes of operating. This Communication Plan is about developing that knowledge of the key IPM components. Some growers have adopted some elements of IPM such as crop scouting, using Bacillus thuringiensis (Bts), and the 'two window' strategy. These elements seem to be used in ways that are not part of a planned change toward a new system of farm pest management. Rather they seem to be used to create a level of security, and to take some responsibility for resistance management. They are a valuable indicator of the willingness to broaden thinking and make a change, and may also reflect the availability of information and guidance. It is also possible that growers are aware of the obstacle to IPM adoption caused by buyer/consumer demand for cosmetically flawless produce. This last obstacle will need to be overcome. A survey would need to be conducted to determine the above assumptions accurately, but it seems that growers have discovered the need for IPM but not all the tactics it contains. Further, it seems fair to say based on SA experience, that many growers remain wary of full IPM adoption because it is unproven to them, and they fear that unacceptable damage may result. The shift in thinking required, and then the behavioural change away from the traditional reliance on chemicals, is significant. It requires a dedicated and planned approach to achieve a sustainable change in behaviour on-farm. The type of change we are talking about is not likely to happen en-masse in a year or two. It is likely to take several years before enough information has reached enough growers for them to see the benefits and reasons to change their current practices. After a certain number of growers have adopted IPM as standard practice, then the remaining growers will increasingly be engaged by word of mouth from growers themselves, and may then seek out professional guidance. What is required for solid and progressive change is good communication that is delivered by credible people, in a relevant, varied and accessible form, to the target audiences. A good Communication Plan is designed to guide the information transfer over a period of time and give it direction. Introduction This Plan is written based on current knowledge, expectations and understanding of the writer. It is expected that elements will need to change or be substituted over time as new ideas or modifications are recommended. These changes will be based on the results of evaluation sheets submitted during workshops, surveys, comments made by growers in discussions, feedback by officers to the IPM Adoption Coordinator, and information gained at meetings, seminars and conferences. The document allows for flexibility, and is intended to be a guide to be followed until change is warranted. The Plan is a general document for National implementation, but it is recognised that States are at different levels of advancement in grower knowledge and adoption. The modifications to be made for those States are not written about here but will in reality be addressed by the IPM Adoption Coordinator and the relevant entomologists and officers.

226
For the purposes of this Communication Plan, those growers that are IPM aware are not treated separately from those that are unaware. They are seen as operating at a 'play safe' or low level in the understanding required for maximum potential IPM on their farms. The approach to exposing them to more information is the same as for those that have not taken on any elements of IPM. We are at early stages of development, so this strategy is appropriate. It should be noted that the role of the IPM Adoption Coordinator is a part-time role of 2 days per week. You will notice that this Plan proposes 14 Strategies and each is given a priority rating. It is intended to address those with a High rating first and then when time and money allow, to address the Medium and Low priority strategies, again in order of priority. Aims This document outlines the strategies for communication of Integrated Pest Management guidelines and research findings from the National team of research entomologists and extension officers involved in the HRDC Diamondback Moth Project. The aims of the strategies in this document are as follows: To transfer IPM information to Australian Brassica growers in an understandable and relevant form, To encourage growers to adopt IPM practices, in particular crop scouting, spray thresholds, insecticide resistance management, To start the process of awareness raising among buyers and others in the industry that will need to understand the differences they may encounter with IPM grown produce, To begin community awareness, To fit with the 'IPM for Brassicas Project' VG 99006, To facilitate better communication between researchers, Industry Development Officers, resellers and related personnel.
THE PLAN STRATEGIES EXPLAINED
GROWER WORKSHOPS - High Priority. Details Workshops have been an important part of the extension work of the National DBM team for a couple of years. Workshops held locally for the Growers, Scouts and Chemical Reps, are a valuable forum for information exchange. A minimum of two workshops per season per production region is needed to provide value. These workshops need to respond to recognised need as identified in each State by Team members. The needs of growers and others are recorded on evaluation sheets that are being distributed during workshops for anonymous feedback. These will guide the future workshops content. It is known that some Consultants (includes some chemical resellers etc) who scout for growers are lacking in knowledge of basics such as the lifecycle of the DBM. This needs to be addressed by inviting them to the Grower workshops or running them separately from Grower workshops in some districts. Training of consultants and others is important to ensure that consistent information about IPM is being delivered to all practitioners who need to know. Marketing is to consist of posters in towns and common grower venues, fliers posted to growers and also at grower suppliers, chemical companies, produce markets, and agricultural department offices, local press stories, flier follow-up phone calls to growers, radio interviews, general press releases, industry papers, IDO's, and any other avenues identified. Justification

227
Workshops continue to be a key form of information transfer that are popular with those that attend and they allow for important two-way communication and education. The challenge is to achieve a high attendance. It is expected that this could be greatly improved with more and better publicity. Live communication at the peak pest pressure times is an excellent forum for networking and discussion, along with the spread of research findings and printed material. They create an opportunity for growers to meet other growers, consultants, researchers, chemical industry personnel and buyers, and to learn about their issues. The publicity of Workshops is an important awareness-raising tool for the general community. Who By and When A workshops format and checklist has been explored and is being refined. Subjects covered need to be responsive to local needs, and will alter the Workshops format. This is happening already and will be further developed from the results of Evaluation sheets and with new ideas from the Team. The IPM Adoption Coordinator to attend workshops in each State at least once per year to provide input. Ongoing direction and advise given by phone and e-mail. IPM BROCHURE - High Priority Details A brochure for produce buyers, Industry Development Officers, and others in the industry, as well as growers, politicians and even when requested, the general public. It would be printed in languages such as Cantonese, Vietnamese and English, with others added as identified. The aim of the brochure would be to generally outline what IPM is, what its benefits are, why it is being spoken about, and how to get more information and assistance. Justification There is no general information available for a range of audiences about IPM and its significant benefits. A brochure would be highly suitable to be used at Fairs, Workshops, Seminars, IDO's satchels etc, to promote the IPM message. A brochure is also highly accessible to a range of people that may not otherwise be exposed to what IPM is, such as growers wives, because they do not read Industry publications. A short document is also very appealing to those that want to stay informed in a concise way. This Brochure would have an active life for many years. Who By and When To be written, researched and distributed by the IPM Adoption Coordinator with the approval before print, of the DBM Project Team. By September 2001. FIELD VISITS - High Priority Details Field visits have been a part of the extension work along with workshops. They are arranged as an adjunct to workshops and separately as required. Team members continue to host at a site they have been researching or at the property of an IPM grower. What is viewed at field visits will vary as the strategies of IPM gain greater adoption. Justification Field visits support the workshop content and are a tangible way to experience the things talked about in the workshop. They are a way to demonstrate what has been learnt. Who By and When Officers hosting a Field Visit are responsible for the organisation. Support and ideas from the other DBM Team members is to be sought and the IPM Adoption Coordinator to provide support and input as possible. Ongoing. A TESTIMONIAL SHEET - High Priority

228
Details A double-sided sheet that contains quotes from committed Australian IPM Brassica growers, about how IPM practices have benefited them, how long it took them to develop, and why they are practitioners. Could also contain the researched cost benefits that have been identified from the SA research and others, perhaps in graph form. This sheet could be produced once a year and have different content each time. The proposal is for the first edition to have at least one grower from each State represented to make the document relevant nationally. Ideally subsequent editions would be State editions that have a majority of case studies from that State. This sheet would be available for free handout at workshops, forums, field days, and extracts copied into newsletters. Justification Testimonials of others' learning experiences and successes are not readily available to growers, so the sheet fills a gap in providing tangible persuasion in support of IPM practices, and would be available for Officers to use on a daily basis. Handouts are good for reinforcing information given at workshops and forums. Who By and When Team effort in providing the grower contacts, but collaboration in compiling the sheet rests with 'IPM for Brassicas project' Officers, and the Adoption Coordinator. Depending on the availability of suitable growers for comment, this sheet would be produced as soon as possible in 2001 and yearly updates timed to be ready for Spring Workshops. FIELD KIT - High Priority Details A 'bum bag' design of a durable fabric, able to be strapped around the waist, or perhaps an across the shoulder bag design. It would contain a recording booklet with 'How to Scout' instructions in the front, waterproof pens or pencils, 10X Magnifying Hand Lens, tweezers, counter, field guide to pests and beneficials ID booklet if not already given, small vials for collecting unidentified insects, a vehicle bumper/window sticker with an IPM message. A laminated card of "Insecticide Windows" could also be incorporated and updated as chemicals and Bts change. Distribute Free to all growers that have attended education sessions about IPM for DBM. Sponsors would be sought for this kit. Justification Regular crop monitoring and good record keeping are the cornerstones of successful IPM programs. A practically designed kit that makes record keeping while monitoring the crop easier to achieve is likely to be used frequently. Since the kit would assist 2 key practices of IPM, it is an important part of this Plan. Who By and When Sponsorship and Research to be conducted by the IPM Adoption Coordinator. Team guidance and assistance may be required. Distribution to growers by the Project Team members. Depending on the time delays with approvals etc, this idea could take 1 - 1.5 years to bring about. MARKETING IPM TO PRODUCE BUYERS AND CONSUMERS - High Priority Details A concerted effort is eventually going to be required to change the perceptions of Buyers and Consumers if adoption of IPM by growers is to be widespread and successful. The budget and current scope of the DBM Project Team, and the Adoption Coordinators role and time availability (working 2 days per week), do not lend themselves to this type of marketing. In the scope of the current Project there is potential to go some way towards this with such things as the IPM general brochure, consistently inviting buyers to workshops and events, doing media releases and radio interviews before and after workshops and events, and at peak times of research results. All these

229
things will reach a far greater audience than just growers and Industry personnel. They keep the information flowing around and stimulate interest and awareness. Justification This is an important element to be addressed if IPM grown produce is to be readily accepted and appreciated. The consumer has a demand for safe and blemish free produce, and hence, so do the wholesale buyers and supermarkets. To some extent the idea that produce being totally blemish free is 'ideal and a sign of health', is a development borne out of the modern era of chemical reliance where control of consistency of yield and 'look' of the produce is possible. This has created expectation in the consumer for what is familiar to them. The practice of successful IPM means that at times the pest pressure is tolerated for longer than traditionally allowed and this can result in some eaten and marked plant parts. In order to free farmers of the burden to produce only blemish and insect free produce and wrapper leaves, education is required to change expectations. The message is a simple one that consumers may well accept if they understood the reasons and the benefits to them and the environment. After all, they once thought blemishes were normal and to be expected. The growing market for Organic and Clean and Green purchasing, is evidence that the consumer is ready for this type of awareness raising to begin. The awareness raising of Buyers needs to be held in tandem with educating the growers. There is no need at present to be intensive in introducing IPM to buyers, however the practice of it needs to be progressively put before them, so that they understand the consequences for consumers and the environment of current practices that rely heavily on insecticides. They need to appreciate that tangible benefits for consumers can be attained from IPM produce with only minimal or no loss of cosmetic quality. The phenomenon of insecticide resistance has, in some cases, made production of blemish-free produce an impossibility even for those using conventional chemically intensive production systems. There is a chance to improve quality through adoption of IPM. It seems important for buyers to know this. Ultimately they are powerful allies in the marketing to the consumer. The consumer can be treated the same way as buyers for the present, in terms of effort in information delivery, however please note the following statement: The scope of this project does not allow for intensive consumer marketing, however it needs to be recognised that with good marketing, it is possible that consumer demand could drive the adoption of IPM by growers at a very rapid rate. A good market survey would reveal the likelihood of this happening. Who By and When The IPM Adoption Coordinator has developed a checklist for members of the project team to look at publicity avenues before workshops and provided sample media releases for use. The role of monitoring publicity and advertising prior to events is the role of the Coordinator to facilitate and ensure follow-through. Timeframe is to be Ongoing for the life of the Project. It is strongly recommended that HRDC consider the creation of a Proposal to address the Buyer and Consumer audiences and issues as outlined under the 'Justification' heading. The speedy pathway to IPM adoption demands a close look at this marketing opportunity, far beyond that which is possible by this Plan. ENHANCED COMMUNICATION WITH GROWERS - High Priority Details This strategy is about maximising the contact potential with Growers. Team members to be encouraged to communicate regularly with growers by means they find most comfortable, (either phone calls, faxes, visits, e-mails or a mix of these). The communication can be about News items of interest or reminders

230
of workshops, or to simply see how things are progressing with them. IPM Adoption Coordinator to be active in assisting this to happen and raising the confidence level of the Team. Tips for Officers (A weekly tip / suggestion via e-mail) under the following categories: Fostering Grower Relationships Motivational Sayings Winning over Problem Growers Tracking Your Effectiveness Running a Good Workshop Writing a Press Release Handling Media Interviews Others as identified. Justification Regular communication with growers provides the opportunity for learning about their needs, gaining updates about what is happening in the field, builds rapport and trust. Publicity and advertising of work are not skills that can be expected of research officers. There is bound to be a reluctance and shyness towards this unfamiliar work. Support and encouragement is required to gain confidence. Regular encouragement and tips are easier to accept and digest than bulk information supplied at one time. Who By and When Officers are to be encouraged to contact growers on a regular basis by the Coordinator. Self-reliance by the officers to do the contacting. Weekly e-mails to be done by IPM Adoption Coordinator. A years supply of tips and sayings has already been created and has begun circulation. To be ongoing. OCCASIONAL FORUMS IN EACH STATE - Medium - High Priority Details A Forum type event held in each State running over about 3 or 4 hours on a weekend or a weekday evening. This forum event could be yearly if money was available, or at least once in each State before June 2003. Timing could be in June/July across the nation where DBM and IPM speakers are invited, researchers speak of their work, videos and other visual material is displayed, food and drink provided. An event where Growers, IDO's, Buyers, Chemical Reps, Consultants and Grower Suppliers are all invited. A major event with the same speakers travelling the Nation along with local content. The Agenda can change each year. Justification There seems to be a need for this type of event where leading authorities can speak to Growers and Industry personnel as a large group and cover the topics that are not able to be addressed at Workshops or be discussed face to face with key personnel. There are many growers who are not able to attend conferences, but it could appeal to come to an event like this held locally. Midyear timing avoids the Spring and Autumn workshops schedule but could change. Who By and When The Team would need to cooperate extensively to agree to a forum program and the organisation. This could be discussed as a topic at the annual get-together of the Team. The Coordinator could be the contact person for the Program and be the travelling organiser for the event. Venues, food, displays, publicity locally and transport etc., would need to be organised by the States Team members. Sponsorship for the event could be sought by HRDC each year or an Interested body such as Dupont. NATIONAL BRASSICA IPM NEWSLETTER TO INCORPORATE PLUTELLA UPDATES - Medium - High Priority Details Currently the Plutella Updates are distributed about 6 times a year and contain the information from Officers around Australia about Diamondback moth. It is produced in Victoria. The IPM for Brassicas Project VG99006 is linked to the DBM Project. In order to provide greater representation to the range
231
of issues each project is covering, I propose an expansion on the Updates to create a Newsletter for distribution around 3 times a year. The newsletter is to be an IPM for Brassica Vegetables Newsletter and at the times it is produced, if it coincides with the Plutella Update, that the update be incorporated as part of it. The same distribution list as those that receive the Handbook updates as well as the Plutella Update is to be used for the Newsletter. A funding arrangement with 'Galls and All' Newsletter of Victoria is possible. Justification A newsletter is something that would allow for greater Brassica IPM information from the field experiences of Team members, and growers to be shared nationally with interested parties. It could be sent to buyers, IDO's etc. It creates a communication link beyond the email and phone communication of the Team, and creates a significant opportunity to let growers know of national research findings and experiences. Who By and When Input into the national newsletter would be possible by all IDO's, the IPM for Brassicas Project Officers, The DBM Team members, and Growers themselves. Three issues per year to be compiled by the IPM for Brassicas project Officers, Adoption Coordinator, and the current author of the Plutella Update. Printing and distribution responsibility can be shared among the compilers. HANDBOOK UPDATE - Medium - High Priority Details In order to fit with the 'IPM for Brassicas Project', the proposal is to change the cover of the current Handbook of the National Diamondback moth Project Team, to encompass all aspects of IPM for Brassica vegetable pest and disease management generally. This would allow for other sections to be put into the book that deal with other problems besides Diamondback Moth. Sections and Updates to go into the Handbook, as they are completed throughout the two Projects. The translating and printing of the Handbook into Vietnamese and Cantonese needs to be explored. Justification A handbook of IPM for Brassica vegetables would be an efficient 'one stop shop' reference book that simplifies the reference material. The current Handbook folder is big enough to accommodate more information. It unites the different Projects and makes us appear to be collaborative, communicative with each other, and mindful of not wasting resources. Some Team members have said that there are non-English speaking Vietnamese and Cantonese Growers that could benefit from the Handbook information. Who By and When The Officers of the 'IPM for Brassicas Project' and the Adoption Coordinator liaise to have this come about. The current authors of the present form of the Handbook need to be in agreement and retained as authors of sections and updates. Enquiries to be made regarding translating the Handbook. Ongoing for the life of this Project. A VIDEO PRODUCTION OF IPM - COMMITTED GROWERS FROM EACH STATE - Medium Priority Details A 10 - 12 minute colour video is produced to show at workshops and forums. The video would contain interviews on site with at least one successful IPM grower per State. They would tell their IPM journey story and motivations. Set to a voiceover, music and visuals that make the production interesting.

232
Justification Provides a visual and tangible form of communicating the success stories from around Australia. The video could be used by buyers, TV news stations, schools, growers supplies, IDO's, at fairs and events, markets, conferences etc. No such video currently exists for the Australian Vegetable industry. Could be a very motivating means of encouraging adoption. Fosters the notion that the problem of DBM is national and there is effort being made elsewhere, and that each State has its 'Pioneers'. Who By and When A production of this sort should not be attempted till there is a grower in most States that is successful in IPM for Brassicas, is confident and willing to speak to a camera, and the video project is supported by an officer in each State. Considerable organisation is required to bring this into being. The IPM Adoption Coordinator has produced a video of this kind in the recent past and a copy is available for viewing. A production of this kind done to Broadcast TV Quality would cost about $13,000, with the cost of travel of the film crew and accommodation added on top. Currently there is no money in the budget for this item. Funds would need to be found. Adoption Coordinator to be responsible. ARTICLES IN INDUSTRY NEWSPAPERS AND MAGAZINES - Medium Priority Details The periodical writing of articles for publications such as CleanAg Link Newsletter, Access to Asian Vegetables Newsletter, Good Fruit and Vegetables Magazine and the various State rural newspapers and magazines, is a good way to keep information flowing regularly. Articles can be about new staff, research results, highlighting a growers achievements, or workshop photos and results, or advertising DBM Forums, etc. Each State to aim for two articles in a national publication, as well as at least two in a State publication per year. Other forms of communicating our work and promoting IPM also needs to be explored. The Prime Notes CDROM contains a section called the MarketPlace where contributor agencies can place 1 or 2 page advertorials to draw attention to their various products, services and consultancies. Prime Notes is a key distribution medium for all Australian state departments of agriculture / primary industries along with a range of other information providers to the rural and agribusiness sectors. This CD is updated twice yearly. Justification This kind of publicity reaches a large target audience of the type this Plan is addressing. The regularity of the publications and the expected large readership gives profile and exposure to our work. Who By and When IDO's are known to seek articles from Officers so this needs to be pursued regularly if not each month. The Officers themselves need to respond to requests for articles, or seek input to the various publications. The IPM Adoption Coordinator has begun this kind of publicity with adding 2 fact sheets on IPM to the MarketPlace section of the next edition of PrimeNotes CD. The contents of the Handbook could be added in full to the next PrimeNotes edition. Each officer to respond to calls for articles locally in their States publications at least two per year, and to aim for two per year in a National publication. Adoption Coordinator to submit articles for National publications from time to time, and assists Team members to write. This needs to be ongoing for the Project life. EXHIBITION DISPLAYS IN EACH STATE - Medium Priority Details
233
Posters and project display materials to be developed so that IPM is promoted at Market events, Conferences, Seminars and Field Days when appropriate. Team members to attend the displays whenever possible to be on hand to answer questions. Team members as speakers at such events is also an initiative to be sought after. A vehicle for print material such as the IPM Brochure to be circulated. The displays can be used for workshops also. Live samples of pests and beneficials could be incorporated. Justification Events such as those mentioned above attract a wide audience besides just growers and this adds to the recognition and push for IPM. It gets people talking and understanding. They provide a place where Team Members are able to speak with growers and their partners, buyers, and others, that would not normally occur. Who By and When The Coordinator has circulated display posters created by Team members in electronic form. These and others could be made up into posters and laminated for the Group along with photos gathered over time. The testimonial statements sheet could be enlarged and made into placards for display. Some of these activities to be progressed by the Coordinator, but a local flavour is important so ownership of the content needs to rest with the relevant Team members. Ongoing for the Project life. REVIEW OF WEB SITES - Medium to Low priority Details The various websites referred too in the DBM Handbook do not give profile to the Team or the HRDC. The sites do not recommend each other or link at strategic points. A review is needed to make the sites more useful and informative. The Handbook content needs to be put on the Net. Ideally conferences and workshops are posted on the sites and updated regularly. Justification The Internet is currently estimated to be used by about 5% of growers, so this is not a primary source of information gathering by growers. However the sites need to better inform about the National Project, link information and refer readers on to other useful sites more than they do. If this is not addressed then growers are not inspired to visit because it becomes limited in what it offers for their time. People from other sectors of the industry are also likely to benefit from an improvement in this area e.g. AVCARE chemical industry representatives, resellers, and other researchers. Who By and When The Team can discuss this at the next annual meeting. Each States Team members and the Adoption Coordinator to explore what action is possible and to implement improvements. The SARDI site has already begun review to include the suggestions. This may take some time to achieve but needs to happen before June 2003 by which time uptake of the Internet among growers may be higher than at present and we need to be prepared for this.
OTHER STRATEGIES THAT COULD BE CONSIDERED
• Farmgate Coreflute Signs Details Large signs of about 1m square made of plastic coreflute or painted metal that contain information about the IPM practices on the farm. A suitable logo could be used. The message could be as simple as the following statement initially: Insecticide Reduction is Practised on this Farm. The signs would be used to publicly recognise growers adoption of IPM strategies on the farm, with additional statements added as the grower makes further changes.

234
A system of 'ticks' could be used similar to the Quality Assurance signs, that would provide a tick for each IPM strategy undertaken, with a statement alongside the tick to outline the strategy. This proposal is essentially a marketing strategy for the drive-by general community, buyers, and industry personnel, but importantly it would serve to reinforce the message of IPM to growers and create a competitive mindset. It gives public recognition to what the grower is doing, and provides an opportunity for growers to be recognised for their IPM initiatives. Only those worthy of the sign should be able to acquire one and this would be at the discretion of the State Team members. This strategy would need to become a topic of discussion at the annual general Team meeting to discuss the format for grower accreditation for the sign, the logo to be used, the slogans, colour etc. Publicity of IPM Practices in the Produce Marketing publications as opposed to the Technical or general publications currently targeted. Details This is something that could be considered later in the project as adoption gains momentum. • Sponsorship for a bulk purchase of Pheromone Traps that could perhaps have IPM advertising on them Details Since this is not a primary step in IPM adoption, it could be pursued if officers thought it worthwhile. • Palm Pilots To Assist Decision Making In The Field Details These are a portable computerised decision support system for IPM in the field. A version has been developed by CSIRO and taken up in the cotton industry in Australia called EntomoLOGIC. They simplify in field recording of insect data from scouting, and can incorporate action thresholds and appropriate recommendations. Separate recording of daily monitoring and actions is easy as the data can be stored or downloaded to a PC. Also would aid growers getting accustomed to using computer technology. • Signage For Display In Towns Details A permanent place in the districts where information can be posted by Team members and changed periodically. Placed in a prominent spot where growers frequent and will look at regularly. If such an area already exists then capitalising on it, or if not, creating one with Council permission etc. Used for the publicising of workshops, field days, peak pest control times and management issues, conferences etc.
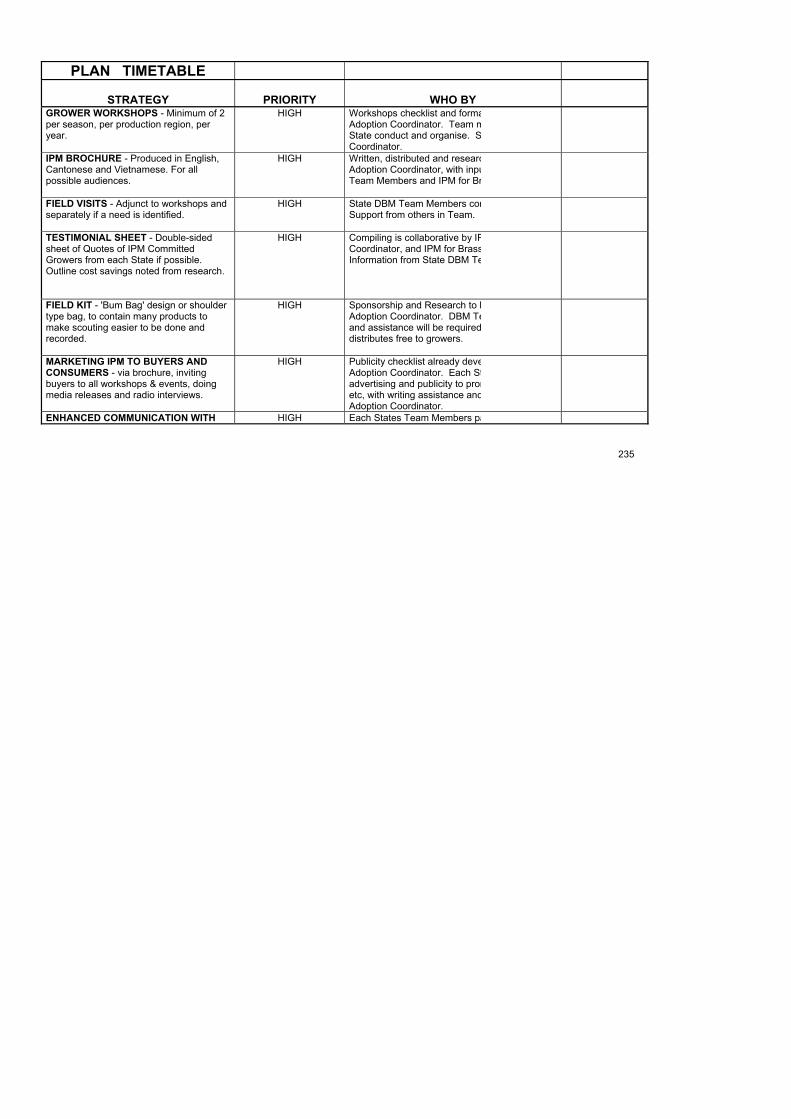
235
PLAN TIMETABLE
STRATEGY
PRIORITY
WHO BYGROWER WORKSHOPS - Minimum of 2 per season, per production region, per year.
HIGH Workshops checklist and formaAdoption Coordinator. Team mState conduct and organise. SCoordinator.
IPM BROCHURE - Produced in English, Cantonese and Vietnamese. For all possible audiences.
HIGH Written, distributed and researcAdoption Coordinator, with inpuTeam Members and IPM for Br
FIELD VISITS - Adjunct to workshops and separately if a need is identified.
HIGH State DBM Team Members conSupport from others in Team.
TESTIMONIAL SHEET - Double-sided sheet of Quotes of IPM Committed Growers from each State if possible. Outline cost savings noted from research.
HIGH Compiling is collaborative by IPCoordinator, and IPM for BrassInformation from State DBM Te
FIELD KIT - 'Bum Bag' design or shoulder type bag, to contain many products to make scouting easier to be done and recorded.
HIGH Sponsorship and Research to bAdoption Coordinator. DBM Teand assistance will be requireddistributes free to growers.
MARKETING IPM TO BUYERS AND CONSUMERS - via brochure, inviting buyers to all workshops & events, doing media releases and radio interviews.
HIGH Publicity checklist already deveAdoption Coordinator. Each Stadvertising and publicity to prometc, with writing assistance andAdoption Coordinator.
ENHANCED COMMUNICATION WITH HIGH Each States Team Members pa

236
GROWERS - Allocated time by each State to regularly contact Growers.
a schedule of half hour per weeEncouragement and assistanceAdoption Coordinator.
OCCASIONAL FORUMS PER STATE
MEDIUM - HIGH Dependant on funds for speakecooperation by Team to organis
NATIONAL BRASSICA IPM NEWSLETTER - three per year.
MEDIUM - HIGH Input by DBM Team, IDO's, & GCompiled and written by IPM foProject and IPM Adoption Coorwith author of Plutella Update.
HANDBOOK UPDATE - Change cover and content to be IPM for Brassicas generally.
MEDIUM - HIGH
IPM for Brassicas Project and ACoordinator Liaise to have this Team input and current authors
VIDEO PRODUCTION OF IPM -Committed growers from each State captured on short film.
MEDIUM Funds needed. Not attempted state available to confidently spCoordination of Production by ICoordinator.
ARTICLES IN INDUSTRY NEWSPAPERS & MAGAZINES - Periodical submission of articles both national and local publications.
MEDIUM DBM Team per State to responinformation, and write at least 2national publication each year, least two for State publicationsCoordinator assistance.
EXHIBITION DISPLAYS IN EACH STATE - Posters and project display materials developed for promotion, speaking at forums.
MEDIUM Electronic copies of Team creacirculated by IPM Adoption Coolaminated copies made, refinemothers developed to continue. and content important.
REVIEW OF WEB SITES - Increase team profile and HRDC in content, link sites, put Handbook on net.
MEDIUM - LOW To be discussed at annual meecoordination by each State Teathe Adoption Coordinator. SARbegun.

237
APPENDIX J
WORKSHOPS
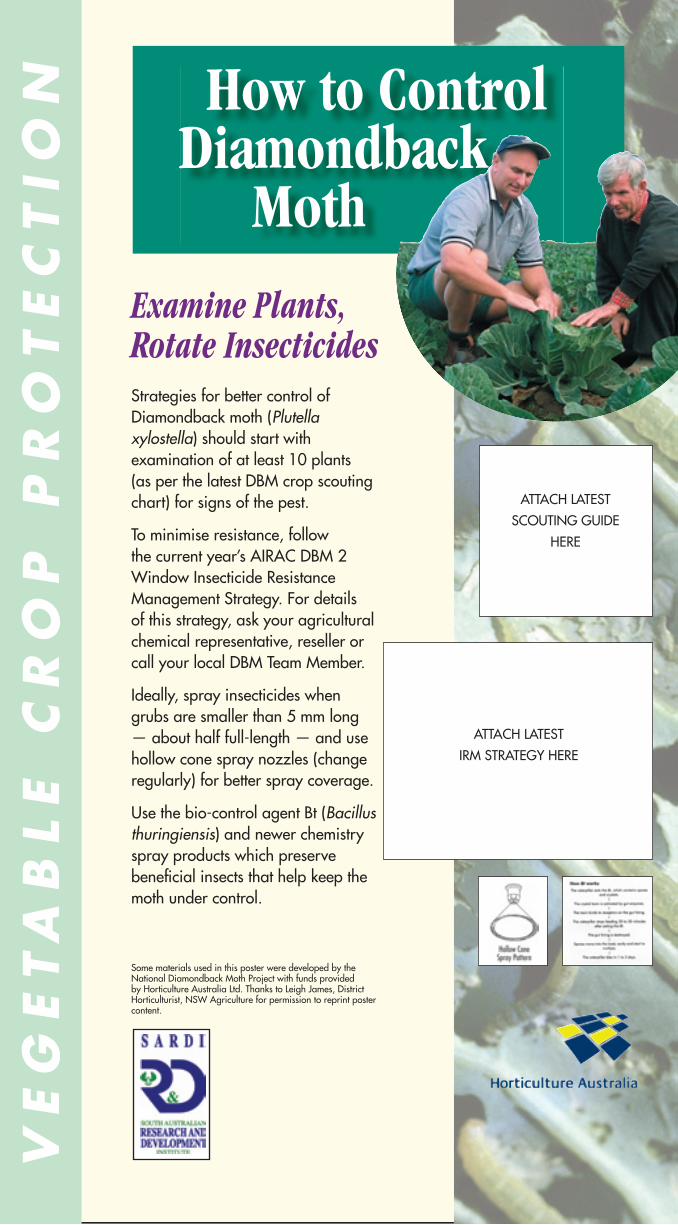
VE
GE
TA
BL
E C
RO
P P
RO
TE
CT
ION
Examine Plants, Rotate InsecticidesStrategies for better control of Diamondback moth (Plutella xylostella) should start with examination of at least 10 plants (as per the latest DBM crop scouting chart) for signs of the pest.
To minimise resistance, follow the current year’s AIRAC DBM 2 Window Insecticide Resistance Management Strategy. For details of this strategy, ask your agricultural chemical representative, reseller or call your local DBM Team Member.
Ideally, spray insecticides when grubs are smaller than 5 mm long — about half full-length — and use hollow cone spray nozzles (change regularly) for better spray coverage.
Use the bio-control agent Bt (Bacillus thuringiensis) and newer chemistry spray products which preserve benefi cial insects that help keep the moth under control.
How to Control Diamondback
Moth
Some materials used in this poster were developed by the National Diamondback Moth Project with funds provided by Horticulture Australia Ltd. Thanks to Leigh James, District Horticulturist, NSW Agriculture for permission to reprint poster content.
ATTACH LATEST
SCOUTING GUIDE
HERE
ATTACH LATEST
IRM STRATEGY HERE

VE
GE
TA
BL
E C
RO
P P
RO
TE
CT
ION Why Diamondback
Moth is hard to control
A Short Lifecycle; Resistant to InsecticidesDiamondback moth (Plutella xylostella) is diffi cult control because:
The grubs can develop high levels of resistance to a broad range of insecticides — Organophosphate (OP) and Synthetic Pyrethroid (SP) resistance is widespread in Australian DBM populations.
Grubs tend to feed inside the concealed and sheltered parts of the plant.
The pest has a short lifecycle. For example, DBM can develop from egg to moth in 18–20days in warm midsummer weather.
A female moth can lay about 100–200 eggs.
In extended warm spells, moth generations can overlap and pest numbers can build-up and quickly become out of control.
Insecticides do not kill eggs or the cocoons (pupae).
Many insecticides kill DBM benefi cials which allows DBM to increase unchecked.
Some materials used in this poster were developed by the National Diamondback Moth Project with funds provided by Horticulture Australia Ltd. Thanks to Leigh James, District Horticulturist, NSW Agriculture for permission to reprint poster content.

VE
GE
TA
BL
E C
RO
P P
RO
TE
CT
ION Reducing the Risk
of Insecticide Resistance
Top Ten Tactics 1 Combine chemical control with other
tactics.
2 Rotate insecticides — use your AIRAC 2 Window Strategy.
3 Use insecticides that are soft on benefi cials.
4 Scout your crops and treat only when needed.
5 Apply insecticide only to the areas of a crop that need it.
6 Only use the recommended rate of product and water volume. Not less or more.
7 Time product application for the most susceptible insect stage.
8 Don’t tank mix insecticides for the same target insect.
9 Aim to rely on your benefi cial insects and predators.
10 In the event of a control failure — check the effectiveness of your spraying fi rst.
241
Diamondback Moth Workshop – Take Home Messages
November 2001
Benefits of Scouting (different to inspecting only) Good crop scouting and recording allows the following to happen: Identification of pest presence and numbers Identification of natural enemies present Gain knowledge to make informed decisions about whether to spray Can eliminate ‘insurance’ sprays Helps to determine the effectiveness of sprays Provides the opportunity to save money on insecticides, time taken in spraying, and equipment wear and
tear. Recent Brassica research in Adelaide has shown that a minimum of $208 per hectare on common insecticide cost can be saved in approximately one month. This was done using spraying decisions based on what was observed in the field according to a threshold level of pest numbers observed before spraying. There was no loss of yield or marketability of the produce
Reduces the incidence of Insecticide Resistance. Provides a permanent record of what is found in the field at a certain time and gives a comparison for future
reference. 'How' to scout is covered in the DBM handbook. Benefits of Integrated Pest Management for DBM Control Saves money: input costs of insecticides, time and equipment life Health benefits: reduces exposure to chemicals Increases the effective life of chemical insecticides and Bt’s May lead to better acceptance of produce on export markets.
How Insecticide Resistance Develops All populations of insects have a few individuals with natural resistance to chemicals. Diamondback moth is no different. In fact they were the first insect pests to become resistant to DDT. Insecticide Resistance happens when a few hardy insects in a target pest population survive the impact of an insecticide and they pass on this ability to survive to subsequent generations. With continued spraying of the same chemical, more and more of the population will carry that resistance from the original few. These chemicals will become less effective and eventually there is minimal impact from the spraying of the same insecticide that once worked so well. Increasing the concentration of the chemical solution is unlikely to help the situation. By rotating the insecticide groups used in a year, you give the opportunity for more than one insecticide to affect those hardier survivors and eliminate them from the population before they breed up into significant numbers. The very great threat with insecticide resistance is that it can leave the grower with no effective chemical to use. It takes at least 10 years of testing and approvals to release a new chemical, so it can be some time before new chemicals are available to combat the resistant pests. That is where the range of Integrated Pest Management strategies is so powerful. It reduces your reliance on chemicals as the primary means of control. More information on managing DBM will come your way via future workshops, and in printed material such as a future national IPM for Brassicas newsletter that will be mailed.

IMPACT OF INSECTICIDES ON NATURAL ENEMIES FOUND IN BRASSICAS Prepared by Bronwyn Walsh with members of the National Diamondback moth project team. For enquiries contact Bronwyn Walsh, Ph: 07) 5466-2222
Legend = Very Low, L = Low, M = Moderate, H = High, VH = Very High: rating derived from reduction in the natural enemy numbers due to toxic effect after spraying.
Information provided is based on the current best information available from research data. Users of insecticides should check the label for registration in their State and for rates, pest spectrum, safe handling and application details.
= star rating derived from an average toxic effect on all the natural enemies by the product group after spraying.
*Acknowledgements: The authors gratefully acknowledge the following people for permission to use data from their research; Mo & Baker; Endersby, Ridland & Guo; Wilson, Holloway, Mensah & Murray. The Good Bug Book 2nd Edition, published by Australasian Biological Control, and Cotton IPM Guidelines 2001 Field Guide. Produced December 2003.
TOXIC EFFECT ON SPECIFIC NATURAL ENEMIES INSECTICIDES Parasitic wasps Predators RATING OF INSECTICIDE IMPACT ON NATURAL
ENEMIES OVERALL* Active ingredient E
aras
itoid
gg
pTr
icho
gram
ma
Larv
al a
nd p
upal
pa
rasi
toid
s
Pred
ator
y be
etle
s
Pred
ator
y bu
gs
Lace
win
gs
Spid
ers
The Natural Enemies Assessed; Larval, Egg and Pupal Parasitoids Predatory Beetles
Predatory Bugs
Lacewings
Spiders
Bacillus thuringiensis (Bt) VL VL VL VL VL VL SOFTEST
pirimicarb (Pirimor) H VL VL L VL VL
pymetrozine (Chess) L L L L L L
spinosad (Success, Entrust)
VH M VL M VL VL
emamectin benzoate (Proclaim) M M L H L M
indoxacarb (Avatar) L M H L VL VL
chlorfenapyr (Secure) VH M M M L L
endosulfan VH M M M L M
imidacloprid (Confidor) VH M H H L L
fipronil (Regent) VH H L M VL M
organophosphates H H H H L M
methomyl (Lannate, Marlin, Nudrin)
H H VH H H M
synthetic pyrethroids H VH VH VH H VH
HARDEST

243
INVITE YOU TO ATTEND A FREE
& BBQ
TO BE HELD AT
VIRGINIA HORTICULTURE CENTRE OLD PORT WAKEFIELD ROAD VIRGINIA
ON Tuesday 27 MAY 2003 Program 2.00-5:00 PM
FREE DRINKS & BBQ 5:00-7:00 PM
Dr
THE PROGRAM WILL INCLUDE:
• DBM Movement research – by Dr Nancy Schellhorn (SARDI). • White Blister project research – by Liz Minchinton (VIC AG). • Clubroot – the latest information from Dr Ian Porter (VIC AG). • Launch of the new DBM Crop Scouting Guide. • Launch of the Insecticide Toxicity Chart. • Outline of the future DBM project activities.
Bring 10 DBM Grubs along for a CONFIDENTIAL assessment of your parasitism levels. A SLAB OF BEER for the MOST PARASITISED GRUBS!
So that we have enough food and drink, Please RSVP by
Friday, 23rd May 2003 To Craig Feutrill - Office (08) 8568 1824
Mobile 0418 831 089

244
APPENDIX K PRESS RELEASES / MEDIA ITEMS / FACT SHEETS

245
LIST OF MEDIA ITEMS
Those Originated by IPM Adoption Coordinator ITEM DATE
Circulated Press release and photo of Qld grower Kevin Neimeyer to all in team
Sept 2000
Interview and photo for SA Grower magazine to introduce the coordinator role Sept SARDI DBM local newsletter compiled to go to all veg growers & consultants Oct Produced article for Good Fruit and Vegetables edition Jan 2001 SA workshops media release for March 13 Feb Prepared 2 material fact sheets for National Prime Notes CD Marketplace Feb Press release follow-up to WA workshops May SARDI DBM local newsletter compiled May Wrote insert item for SA Grower magazine Aug Press releases following workshops in Sydney prepared Nov Media releases about consumer survey at Royal Adelaide Show created and 3 radio interviews held, along with written articles for GF&V, Hortlink, National Marketplace News, Stock Journal. 5 ABC radio news-runs of the story were repeated around SA but monitoring was not conducted in other states.
Nov
DBM conference attended in Melbourne and Media Release written afterwards about the event at the request of the convenors.
Nov
Promotion articles written for Professor Tony Shelton visit in Perth. Jan 2002 Story written for ‘SA Grower’ publication with images about the SA Brassica workshops
April
SA Grower article written for August issue about useful Website addresses July Item for GF&V Sept issue about the national newsletter Aug PrimeTime PIRSA publication article and photo organised about the national newsletter
Nov
Article written for April GF&V Vegetables Platter section March 2003 Article written for PIRSA open gate section of Stock Journal May Article written for GF&V July edition June Tasmania
ITEM DATE Newspaper story on IPM Team in Advocate paper Oct 2000 Story on trap catches and IPM advice put in Tas country and Advocate papers. Oct & Nov 00 Story in Advocate paper on novel chemicals & weed management Nov 00 Tas Country paper reported on pest numbers alert Dec 00 TasRegions DPI magazine reported on DBM IPM Strategies Dec 2000 Issued 2 general mass media releases 2001 Large display poster created 2001 2 magazine articles with photos published 2001 1 radio interview conducted 2001 Getting Results (IDO newsletter) IPM for Brassicas - Advertising the forthcoming CD Rom
June 2002
Getting Results (IDO newsletter) Diamondback moth project with Dijana’s contact details
September 2002

246
Getting Results (IDO newsletter) IPM for Brassicas - Advertising the CD Rom. October 2002 Article placed in Tas Regions (Dept. Journal for farmers) DPIWE News (Dept. newsletter for staff) “Fighting the diamond-backed moth”, about the 3 Tasmanian members of HAL project team.
Printed in Newspapers were the following: Tas Country, “Messy Moth Menace”, pest alert with IPM notes. Advocate, “Diamond-backed moths hit crops”, pest forecast; Advocate, “Farmers braced for moth plague”, pest forecast; Advocate, “Moth-ridden crops may be rejected”, quotes Royal Adelaide Show survey; The Examiner, “Farmers warned of moth plague”, pest alert with IPM notes; The Examiner, “Threat of moth plague”, pest alert with IPM notes;
27 December 02 Nov 2003 13 Nov 2003 14 Nov 2003 13 November 03 14 November 03
Radio Several interviews in spring with ABC Rural radio concerning unusually high pest pressure plus aspects of IPM practice.
Spring 2003
Television Pest forecast and crop scouting story with ABC News.
12 November 2002
Victoria Institute for Horticulture Development Media Releases can be found at http://www.nre.vic.gov.au/agvic/ihd/resources/media-releases.htm Co- authored ‘A field guide to pests, diseases and disorders of vegetable brassicas’,
00
1 article for Pesticide Outlook (British publication) 2001 3 media releases 2001 4 published media articles 01 2 media interviews conducted 01 3 DBM Newspaper articles published in ‘Southern Farmer’ of same edition Dec 2001
01
1 Newsletter article published in Vic. ‘Vegetable Matters’ 01 Produced 4 Plutella Updates and circulated to 100 people on mailing list
Various times in 2001
Updated NRE Vic DBM website DBM project display @ Werribee Vegetable Expo. 2001 NRE Conference Presentation 2001 30 January 2002 - IPM in brassicas - from grower to grower (article about impending release of IPM video)
Jan 02
22 March 2002 – Dealing with insecticide resistance (interview with Peter Ridland about DBM)
Mar 02
25 July 2002 - On-screen boost for Brassica pest management (article about release of CD-ROM)
July 02
Conference papers 2002 Horticultural Conference, Knoxfield, 21-22 August. Dispersal of diamondback moth: beginnings of a molecular marker approach
Aug 02

247
Endersby NM, Weeks, AR, McKechnie SW and PM Ridland (2002). Australian Entomological Society 33rd AGM & Scientific Conference, Fremantle WA, 22-27 September 2002 Endersby NM, Weeks, AR, McKechnie SW and PM Ridland (2002). Population structure and movement of diamondback moth in Australia: beginnings of a molecular marker approach
Sept 2002
Proceedings of the International Symposium Improving Biocontrol of Plutella xylostella (DBM 2002), Montpellier, France, 21-24 October 2002. Endersby NM, McKechnie SW and PM Ridland (2002). Population structure and movement of diamondback moth in Australia: beginnings of a molecular marker approach
Oct 2002
Industry Article Nicol A. (2003) Diamondback moths – is there a pattern? GRDC Ground Cover Issue 45 June 2003 (http://www.grdc.com.au/growers/g_cover.htm)
June 03
Western Australia Resistance Management Strategy A5 laminated card updated and posted out to growers, chemical reps, and resellers.
2001
Plutella Update article contributed on the impact of natural enemies study in Perth
2001
2 media releases sent to multiple sources before and after workshops 2001 3 published articles in Newspapers and Magazines 2001 1 ABC radio interview about workshops, Publicity posters/flyers produced to promote workshops,
4 media releases 2002 A media release summarising major points of workshop meetings held in April 2003 at 4 locations. 2 radio interviews also conducted at the same time.
May 2003
South Australia 3 local brassica grower DBM newsletters produced and circulated Nov 2000, May 2001, and January 2002
2000 - 02
3 Press Releases circulated 2000 SA workshops media release for March 13 Feb 01 7 Articles published in State ‘Grower’ publication as follows: ‘Brassica IPM in New Zealand’ with colour image of specialist visitor, August 2000 ‘Stepping up the fight against DBM’ November 2000 Article ‘Newsletter launch for Brassica growers’ in SA Grower magazine News section. Aug 2002 Article ‘Newsletter for brassica IPM practice launched’ in SA Grower magazine Veglink section Sept 2002 Story published ‘Pest workshop to help provide grower solutions’ March 2001 SA Grower article written for August issue about ‘Useful Website addresses’ July 02 ‘IPM tools for Brassica producers’ February 2003 Queensland Newspaper article for Gatton Star Rural Report published 2001

248
Two Brassica Improvement Group newsletter items written about the DBM conference
2001
Project objectives and results presented at Queensland Fruit and Vegetable Growers “Growing for Profit” forum
Informed of national DBM project objectives and activities at ACIAR project meetings and Review,
2 fact sheets written
2001
New South Wales Co-author with Greg Baker of paper ‘Review of the national Diamondback Moth Project - advancing integrated management of DBM in crucifer vegetables’, for the Sydney Basin Field Grown Vegetables Conference July 00.
July 2000
4 Articles published on DBM in ‘Good Fruit and Vegetables’ April edition, NSW ‘Agriculture Today’, ‘The Land’, & Hawkesbury gazette
2001
TwoVeg IDO newsletter articles published 2002 1 GF&V items written 2002 Other articles published in IDO newsletter submitted by Adoption Coordinator 2002 - 03
249
MEDIA RELEASE
October 2001
ANNUAL DBM MEETING SUCCESS Positive comments flowed around the table in the final hours of a highly successful two days at
Knoxfield in Victoria. Growers from the Brassica Research and Development Committee of
Horticulture Australia, came to meet with Research Scientists, Industry Development and
Extension Officers from around Australia involved in conducting work on Integrated Pest
Management of Diamondback moth.
It was the annual opportunity to share research results, get feedback from growers, discuss
milestones and plans for the next two years of research and extension programs.
The Diamondback moth is a major pest of cauliflowers, cabbage, broccoli, and brussels
sprouts nationally. The annual meetings provide comparisons of research findings from the
different growing regions around the country, and the effectiveness of strategies used.
Enthusiastic comments of praise and satisfaction with the work being done so far, came from
each of four growers present from the Brassica R&D Committee.
Planning at this years meeting was also done for the next 'International Workshop on the
Management of Diamondback moth and Other Crucifer Pests' being hosted by Melbourne on
November 26th - 30th this year. Further information is available from
www.conferences.unimelb.edu.au/moth/ or by ringing Bronwen Hewitt at the University of
Melbourne on 03) 8344 6389.
For media enquiries please call:
Photo Caption example: Grower members of the Horticulture Australia Brassica R&D
Committee meeting with scientists and extension officers in Victoria.

250
And the South Australian
Research and Development
Institute
FACT SHEET
Horticultural crop monitoring - the key to informed decisions Why should I monitor?
Integrated pest management (IPM) involves making pest control decisions based on sound knowledge of the pests and beneficial insects in the crop and their abundance. Much of this knowledge is gained through crop monitoring (inspecting). Regular crop monitoring and good record keeping are the cornerstones of successful IPM programs.
What are the advantages of crop monitoring?
• Detecting the build-up of pests well before economic damage can occur. • Ensuring correct decisions on whether control measures are necessary. • Selecting the most appropriate control measure. • Optimising the timing of spraying or other control measures. • Finding out how successful the control measure has been. • Identifying problem varieties and areas within crops.
Who can monitor? Growers or staff can monitor. It is important that the monitoring not be seen as low priority and that it be done thoroughly each time. In some areas, specialist crop consultants can be hired.
How do I monitor?
Inspect plants throughout the crop, not just near the edges or in one spot. Walk a zigzag or figure-8 pattern through the crop, starting at a different place each assessment and looking at plants at regular intervals. Look at the whole plant, including both sides of leaves. Look for eggs on the stem and leaf stalks. Write down what you find on each plant. A sample insect record sheet is provided below. Diamond Back Moth (DBM)
How many plants should I look at? The national Diamondback moth project has developed a monitoring guide that aims to make crop inspecting fast and reliable. The guide is set up as a decision tree that asks the monitor such questions as – the type of crop they are monitoring eg. cauliflower, growth stage of the crop, market destination eg. export, chemical use in the crop, and wasp parasitism rates of grubs. Once key questions are answered, the reader is led to a sampling plan that tells them how many plants to sample to make an accurate decision about whether to not take action and scout again in five days, or spray or not spray. The guide is available via the SARDI website at www.sardi.sa.gov.au/entomology/index.html
How often should I monitor?
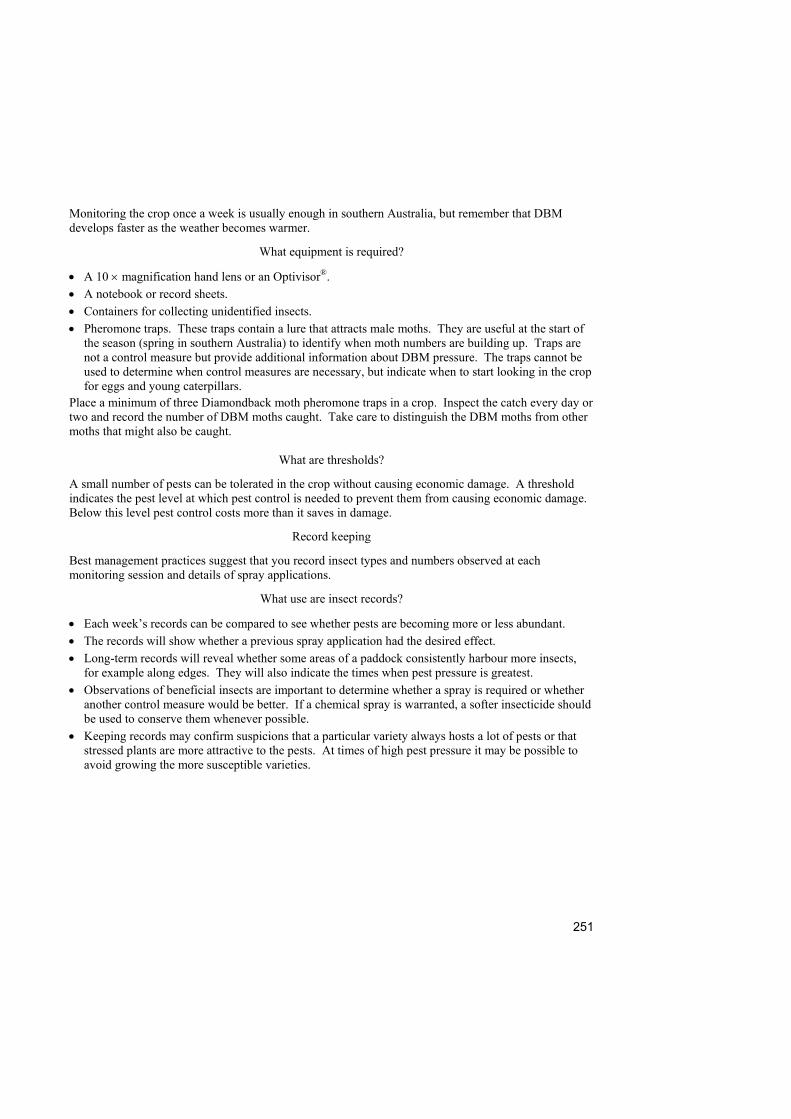
251
Monitoring the crop once a week is usually enough in southern Australia, but remember that DBM develops faster as the weather becomes warmer.
What equipment is required?
• A 10 × magnification hand lens or an Optivisor®. • A notebook or record sheets. • Containers for collecting unidentified insects. • Pheromone traps. These traps contain a lure that attracts male moths. They are useful at the start of
the season (spring in southern Australia) to identify when moth numbers are building up. Traps are not a control measure but provide additional information about DBM pressure. The traps cannot be used to determine when control measures are necessary, but indicate when to start looking in the crop for eggs and young caterpillars.
Place a minimum of three Diamondback moth pheromone traps in a crop. Inspect the catch every day or two and record the number of DBM moths caught. Take care to distinguish the DBM moths from other moths that might also be caught.
What are thresholds?
A small number of pests can be tolerated in the crop without causing economic damage. A threshold indicates the pest level at which pest control is needed to prevent them from causing economic damage. Below this level pest control costs more than it saves in damage.
Record keeping Best management practices suggest that you record insect types and numbers observed at each monitoring session and details of spray applications.
What use are insect records?
• Each week’s records can be compared to see whether pests are becoming more or less abundant. • The records will show whether a previous spray application had the desired effect. • Long-term records will reveal whether some areas of a paddock consistently harbour more insects,
for example along edges. They will also indicate the times when pest pressure is greatest. • Observations of beneficial insects are important to determine whether a spray is required or whether
another control measure would be better. If a chemical spray is warranted, a softer insecticide should be used to conserve them whenever possible.
• Keeping records may confirm suspicions that a particular variety always hosts a lot of pests or that stressed plants are more attractive to the pests. At times of high pest pressure it may be possible to avoid growing the more susceptible varieties.

252
Sample insect record sheet
Date Block Crop Moth numbers Plant DBM
eggs DBM larvae small large
DBM pupae
Other eggs
Other larvae
Aphids Notes Beneficials
1 2 3 4 5 … Total
What use are spray records?
• Spray records are valuable for future management decisions. • They are helpful in tracing the sources of problems such as spray failures. • They will help to keep track of your resistance management program so that you can practice
rotations and not overuse a particular insecticide. • They provide documented evidence of what was sprayed and when. • They may be required in quality assurance production systems and food safety plans.
Sample spray record sheet Date Target pest Time Spray rig Location/Block Tractor gear Crop rpm Variety Pressure Crop stage Water volume per ha Chemicals and surfactants Rate 1. 2. Weather Water pH Comments

253
Further information " Integrated Management of Diamondback Moth in Crucifers, The Handbook. A production of the National Diamondback Moth Project Team, supported with funds from Horticulture Australia Limited."
Last update: September 2003 Agdex: 250/614
Author: Dijana Jevremov, IPM Adoption Coordinator, Entomology Unit, SARDI. Disclaimer Use of the information/advice in the Fact Sheets is at your own risk. The Department of Primary Industries and Resources and its employees do not warrant or make any representation regarding the use, or results of the use, of the information contained herein as regards to its correctness, accuracy, reliability, currency or otherwise. The entire risk of the implementation of the information/advice which has been provided to you is assumed by you. All liability or responsibility to any person using the information/advice is expressly disclaimed by the Department of Primary Industries and Resources and its employees.

254
And the South Australian
Research and Development
Institute
FACT SHEET
Integrated pest management (IPM) What is IPM? Integrated pest management (IPM) is the term used for a wide range of tactics to prevent pests of all kinds from reaching damaging levels in crops. A pest can be an insect, mite, vertebrate such as birds, a disease, or weed. By using a range of tactics to deal with pests, it removes the reliance on any single method of control, such as chemical sprays. IPM tactics generally fall into the following categories:
• Biological – the protection or release of natural enemies such as parasitoid insects, pathogens or predators. • Cultural or managerial – such as crop rotation, trap cropping, and using healthy transplants. • Chemical – use of pesticides as a last resort, favouring those that conserve natural enemies, and rotating products to
avoid resistance. • Physical or mechanical – barriers such as crop covers and screens, light traps, and vacuums. • Genetic – pest resistant crop varieties.
Who is IPM for? IPM benefits growers, the environment and consumers. It is equally about both the economic and the social sustainability of growing food for the benefit of all. Growers who implement IPM as part of their cropping enterprise, have the potential to save money and reap the multiple benefits and peace of mind that comes with an integrated approach to growing. Benefits of IPM The benefits from using an IPM system are many and varied. Some are listed below: • By inspecting crops regularly, potential problems are noticed early so remedial action is likely to be successful. • IPM results in strategic use of chemicals, which reduces health risks to producers, their families and staff as well as
consumers. It also minimises the chance of pests developing resistance to chemicals. • Reduces negative impacts on the environment. • It encourages natural enemies to help manage pests. • IPM leads to a more robust system since it doesn’t rely on one control method. • Money can be saved from a more cost effective use of treatments and a consistent production of market-quality
produce.
This tiny wasp is a natural enemy to the Diamondback moth, a pest of Brassica vegetables in Australia. What is needed for IPM to work? Successful IPM requires growers and their consultants to have knowledge of key components in the field that will guide sound decisions and forecasts. These include:
• Accurate pest and natural enemy identification. • Understanding the pest lifecycle, biology and ecology. • Understanding the effects of pest damage on crop quality and market value at different levels of the pest population. • Knowing the effects of control measures on both the pest and other organisms.
Much of the essential knowledge can be gained from regular crop inspection (monitoring) and good record keeping, together with readily available published information. Inspecting crops regularly is the cornerstone of a successful IPM program.

255
A 10 X magnifying glass is a handy tool for pest and natural enemy identification during inspections. Agriculture and research organisations around Australia conduct research, arrange workshops, expos, field days and print material to help food producers understand and implement IPM. Why was IPM developed? The history of IPM can be traced back to the late 1800’s when ecology was identified as the foundation for scientific plant protection. The catalyst for modern day IPM began in the 1950’s when over-reliance on chemicals in the field led to catastrophic results. It showed that the sole reliance on chemicals for pest problems in horticulture is not a long-term solution. There are many examples where the serious challenge of pests developing resistance to chemicals has initiated a ‘sea-change’, where advanced IPM practices have been successfully implemented. Where is IPM practiced? IPM is widely practiced by Australian vegetable growers to varying degrees. Brassicas, lettuce, sweetcorn, and greenhouse vegetables are some of the crops. Some growers have even developed their own IPM marketing and promotion. Most countries of the world practice IPM to some degree. It is widely accepted as the modern approach to agricultural pest management. Where to find more information There are many good websites and publications on IPM. These are just a few: World Wide Web: www.brisbane.tafe.net/Library/horticulture General growing, one-stop-shop site that acts like a library catalogue. www.sardi.sa.gov.au/entomology/index.html www.nre.vic.gov.au/farming/index www.dpi.qld.gov.au www.goodbugs.org.au Biological control of pests in Australasia. www.nysaes.cornell.edu/ent/biocontrol/ Biological control/IPM, Cornell University, USA. Books: Most State Departments of Agriculture or Primary Industries have bookshops or libraries that can be used. Universities also are good sources of IPM books. A couple of titles to start with are below: What Garden Pest or Disease is That? by Judy McMaugh 1986 Landsdowne Press. Australian Vegetable Growing Handbook by John Salvestrin 1998, Scope Publishing Victoria.

256
This fact sheet has been developed by SARDI, a member organisation of the national Diamondback moth project, with partnership funding by Horticulture Australia.
Last update: September 2003 Agdex: 250/614 Author: Dijana Jevremov, IPM Adoption Coordinator, Entomology Unit, SARDI. Disclaimer Use of the information/advice in the Fact Sheets is at your own risk. The Department of Primary Industries and Resources and its employees do not warrant or make any representation regarding the use, or results of the use, of the information contained herein as regards to its correctness, accuracy, reliability, currency or otherwise. The entire risk of the implementation of the information/advice which has been provided to you is assumed by you. All liability or responsibility to any person using the information/advice is expressly disclaimed by the Department of Primary Industries and Resources and its employees.

257
PROJECT UPDATE This is an update from an annual project workshop held in Adelaide, August 2002 for the project “Implementing the pest management of diamondback moth in brassica vegetable crops”. It is a national Horticulture Australia funded project, with participation from South Australian Research and Development Institute, the University of Adelaide, Agriculture Victoria, Queensland Department of Primary Industries, NSW Agriculture, Tasmanian Department of Agriculture and Fisheries and the Western Australian Department of Agriculture. Resistance management Testing done by AgVic shows there have been no elevated levels of resistance in DBM populations to the new chemistries in any State. A survey by the Avcare Insecticide Resistance Action Committee showed 75% of growers are using their State DBM resistance management strategy. Of these, 80-100% of growers always use it or use it most of the time. This good news indicates the brassica vegetable industry aim to protect the ‘new’ pesticides they have available for DBM control.
Workshop participants gather to report on brassica pest management research and extension Killing DBM adults One of the hot topics for discussion was whether growers should be targeting pesticide sprays at adults.
Surfactants The results of previous research were further emphasised, that some surfactants can actually increase the number of eggs found on brassica vegetable crops. It is believed some surfactants strip the waxy surface off the leaf and the resulting odour produced from the plant attracts moths.
DPI corner

258
Growers and researchers at the workshop agreed that the effectiveness of this management tool was questionable, especially in an IPM system. There were several reasons for this. Firstly pesticides are not registered for use against adult DBM. Secondly, hitting a moving target with enough insecticide to kill it is highly inefficient. Using a dye to mimic an insecticide, less than 40% of adult DBM were hit by the dye. This could select for resistance. Thirdly, some of the pesticides used to target adults have been reported to have a repellent effect, only to later have moths reinvade. Fourthly, it would be more cost effective to target sprays at larvae, the life stage that is actually damaging the crop. Lastly pesticide applications severely disrupt the natural enemy population. While seeing dead moths on the ground may show the pesticide killed some moths, it may also indicate that the predatory insect population is low, as they are usually responsible for removing dead insects within the crop. Natural enemies, especially predators, are slower to recolonise a crop, even further reason to avoid the use of non-selective pesticides. IPM CD and Video AgVic released a video and CD outlining the principles of IPM in brassica vegetable crops. It gives some good information about clubroot and some of the key areas to consider when implementing IPM, such as farm hygiene, resistance management, scouting and natural enemies. It features a good mix of growers and researchers talking about IPM issues, including some local talent. It is being sent to all Australian brassica vegetable growers within the next couple of weeks Priorities in pest management • Other pests and integrating their management with DBM control • Dispersal of DBM and natural enemies • Enhancing biological control Pest management issues were raised by researchers and then prioritised by the attending grower representatives Research in DBM dispersal and natural enemies, scouting and attractiveness of different crop varieties is on-going. For particular information about these areas please contact me. Contact details: Bronwyn Walsh, QDPI Gatton(07) 5466 2222

259
APPENDIX L TEAM AND R&D COMMITTEE MEETINGS

260
HAL DIAMONDBACK MOTH PROJECT PLANNING MEETING Wednesday AUGUST 7th - Friday AUGUST 9th 2002
Meeting Rooms 1&2, Plant Research Centre, Hartley Grove, Waite Campus
AGENDA
WEDNESDAY DAY 1 Day 1 will consist of research updates as per the prior circulated reports, followed by discussion with focus on milestone objectives, future directions for the next 12 months and beyond. 9.00am START: WELCOME AND INTRODUCTION (Greg Baker) Insecticide Resistance Management 9.10 – 9.25 am: The Insecticide Resistance Monitoring Program (Nancy Endersby and Peter Ridland) 9.25 – 9.40am: Update of Repositioning of Insecticides in the DBM “Two Window” IRM Strategy. Summary of the AIRAC Survey (Greg Baker). 9.40 – 10 am: Open Discussion 10.00 – 10.15 am: MORNING TEA DBM Dispersal 10.15 – 10.30 am: DBM and Parasitoid Dispersal, 2002 Studies (Nancy Schellhorn) 10.30 – 10.45 am: Molecular marker approach to DBM population structure and movement, PhD project (Nancy Endersby) 10.45am – 11.00am: Open Discussion Innovative Control Options 11.00 - 11.15 am: DBM Adulticidal Activity (Nancy Schellhorn) 11.15 - 11.30 am: DBM pest risk assessment for commercial Brassica varieties (Peter Ridland) 11.30 - 11.45am: Nursery management of DBM using Trichogramma wasps (Peter Ridland) 11.45 -12.00 noon: Open Discussion 12.00 -1.00 pm: LUNCH Natural Enemies 1.00 – 1.15 pm: Impact of natural enemies on DBM in Perth (Françoise Berlandier) 1.15 – 1.30 pm: QLD (ACIAR project) Natural Enemy Studies (Mike Furlong) 1.30 – 1.45 pm: Incorporating natural enemies into Brassica IPM (Mike Keller) 1.45 – 2.00 pm: Open Discussion Crop Scouting Research / Validation 2.00 – 2.15 pm: S.A. Threshold Levels of Presence-Absence Scouting (Nancy Schellhorn) 2.15 – 2.30 pm: W.A Thresholds in Cabbage & Broccoli (Françoise Berlandier) 2.30 – 2.45 pm: TAS. Crop Scouting Research (Lionel Hill) 2.45 – 3.00 pm: Open Discussion 3.00 – 3.15 pm: AFTERNOON TEA

261
3.15 – 4.15 pm approx: Milestones Discussion - (led by Greg Baker) Summarising our existing Milestones, Forward Planning for the next 12 months. 4.15 pm: Viewing of the “IPM for Brassicas” Project CD Rom and Video. Discussion re marketing of the products. 7 pm: GROUP DINNER - Edinburgh Hotel - drinks at the bar beforehand.
THURSDAY DAY 2
8.30 am START: INTRODUCTION (Greg Baker) 8.35 am Jonathan Eccles Jonathan's presentation will include information about: • The Vegetable Strategic Plan • Funding projections for the various levied vegetable industry sectors • Overview of the decision making format for R&D projects, including timeframes • HAL's preparedness to jointly fund proposals with other funding agencies Question Time allowed. 9.30 am Dijana Jevremov • Summary of the 2001-02 Extension Activities nationally and the Project’s Extension Milestones • Evaluation Sheets of Workshops - 2 year summary 9.50am: Open Discussion 10.15 – 10.30 am: MORNING TEA 10.30 am: SESSION: Future Project Extension - Proposal Planning 12.30 – 1.30 pm: LUNCH 1.30pm - 2pm: Future Project Extension - Proposal Planning continues. 2.00 pm: Nancy Schellhorn SESSION: Future Project Research - Proposal Planning 3.15 - 3.30 pm: AFTERNOON TEA 3.30pm: Future Project Research - Proposal Planning continues. 5pm: CLOSE
262
FRIDAY DAY 3
Essentially a researchers and extension team planning day. IDO's and Growers do not need to attend unless they wish.
8.30 am START: INTRODUCTION (Greg Baker) 8.35 - 9.00am: Dr Richard Vickers • Rundown on what Richard will be presenting in Montpellier, France in October, on 'Biocontrol of
DBM in Oceania'. • What the 'European Union DBM Project' aims to achieve. 9.00 - 9.10 am: - ACIAR Project Future Funding Directions - (Mike Furlong) 9.10 - 10.30 am: • Extension Plans For 2002-03 (facilitated by Dijana Jevremov)
Timeframes and plans for workshops etc, materials needed, modules development, handouts, who will fulfil tasks.
• Websites analysis • Publicity Pack 10.30 – 10.45 am: MORNING TEA 10.45 - 11.15 am: Future Project Extension Priorities:
Levels of input & personnel determined.
11.15 am: Future Project R&D Priorities, Planning and Funding. (led by Greg Baker/Nancy Schellhorn)
Level of resourcing required for each R&D topic Tabling of personnel names and percentages of time Summarising for Concept Development Proposal
12.30 - 1.15 pm: LUNCH 1.15 - 3.00pm: Continue Future Project Planning of R&D. 3.15 - 4.45pm: Any Other Items 5pm: CLOSE

263
HAL DIAMONDBACK MOTH PROJECT PLANNING MEETING Wednesday AUGUST 7th - Friday AUGUST 9th 2002
Summary of Extension Points
SUGGESTIONS • Check with consultants re the format for the future scouting charts. ? should they be half the size
and hang on a cord around the neck. • 2 months after the release of the next scouting charts - survey the consultants and growers to
determine use. Around May - nationally. • To encourage growers to look at parasitism - ask them to bring 5 grubs along to a workshop for
dissection. The most parasitised grubs get a slab for the owner. • Start to fax out growers/consultants reminders at each change in window of the IRM Strategy. CURRENT PROJECT • Workshops Schedule for next year: To include a survey conducted at the sessions re the practice of scouting, Dissection techniques, Adulticidal activity, New Scouting information, Pest ID and Natural Enemies covered again if appropriate. Could include the following also if the information is available - Cultivar Selection, New Insecticide Selection Chart, Dispersal and Movement further results. WA - October 02 and also maybe April. TAS - March 03 SA - End of March early April QLD - Adulticidal activity, Beneficials. March NSW - Absent VIC - Spinosad talk, September 02. • Handbook Modules: Other pests : (G Baker, P Ridland, B Walsh) Slugs - to be written by Lionel, Aphids & Cabbage white butterfly - Greg B. Able to finish by February 1. Heliothis, Onion Thrips, Cabbage Centre Grub & Cluster caterpillar - Bronwyn. Able to have ready by end of March. For printing by May 03. Resistance Strategy : (G Baker, B Walsh) Release as handbook insert by mid October 2002. Scouting Module updated : (N Schellhorn) Expect to have ready for March workshops presentation. Printing by Leigh in May, circulation by early June. Natural Enemies : (M Keller) Modes of action. Printing by Leigh in May, circulation early June.

264
Cultivars : (P Ridland) Interim reports for early March - module later. Insecticide Chart : (B Walsh, G Baker) End of this year. Dispersal of DBM : (N Schellhorn) Printing by Leigh in May, circulation early June. FUTURE PROJECT • August 2004 is the International Congress of Entomology which Myron Z is organising. Look at
getting speakers from that, to travel around the country and present. • Fax all growers/consultants/resellers at the start of each new window. • Start the concept of Pre-serving Natural Enemies. • 'Know your beneficials' poster. • New Modules of Advanced IPM Strategies. • Continue the National Newsletter 3 times per year. • Everything also produced in Vietnamese. • Pest and beneficial ID workshops continue annually per State. • Magnifying glass gift at workshops to encourage scouting. • Reseller and advisers breakfast sessions on IRM strategy & mixing of insecticides. Posters of
Resistance Charts plus Window Strategy updates per Store.
• Engage community with vegetable growing districts via Royal Show displays, Food Expos, Regional Show displays so the community can learn about how vegetable food is grown, particularly children.
• Pilot demonstration plots for growers learning about IPM techniques - to happen on key best practice
grower properties - not on separate rented land. Regular visits looking at different aspects each time, eg. Varieties, scouting, thresholds, fertiliser.
• Spray Roadshow - one per State in the life of the project (year 1), UV light ? one per State purchased
or check if service is available locally. Cost is approximately $3,000 per unit. ? sponsorship. Promote use of light for assessing coverage.
• Further print run of IPM Brochure. WEB CHANGES • Put resistance windows on the web pages. • New modules on the Web.

265
HAL DIAMONDBACK MOTH PROJECT PLANNING MEETING Monday JULY 30TH to Wednesday AUGUST 1ST 2001
KEY POINTS SUMMARY
22 In Attendance: John Cranwell, Craig Feutrill, Alison Anderson, Jeff McSpedden, Roger Tyshing, Nancy Schellhorn, Dijana Jevremov, Mike Keller, Lionel Hill, Bronwen Walsh, Francoise Berlandier, Mike Furlong, Michael Badcock, Paul Horn, Patrick Ulloa, Anita Chennell, Emily Tee, Greg Baker, Peter Ridland, Nancy Endersby, Kon Koroneos, Richard Vickers. Apologies: Dan Hood, Johnathon Eccles, Leigh James, David East. DAY 1. Research Updates given via individual presentations followed by discussion. Insecticide Resistance Management The Insecticide Resistance Monitoring Program (Nancy Endersby) As per report submitted. The Need to Reposition Some of the New Insecticides in the DBM “Two Window” IRM Strategy (Greg Baker) A future meeting in Sydney between Greg and company representatives will clarify this. The 2 window strategy generally was discussed. It was stated that the prices of the chemicals in the windows plays a role in the strategy being adopted. Then warehouse stocks and the advice of consultants comes in too. Kon and John C, feel the strategy should be pushed. It was suggested by Bronwyn that the window strategy be enlarged to A3 poster size and distributed for display to suppliers nationally, (some have requested this). Dijana and Leigh will do this. DBM Dispersal DBM and Parasitoid Dispersal, 2001 Studies (Nancy Schellhorn) Movement of DBM is as follows; Greg Baker has determined that Males travel 60-100 metres, Females travel 110-200 metres. In actively growing crops DBM do not travel far - upto 30metres on average. Beneficials were dyed in Nancys study showing Appanteles and Diadegma travel upto 93m. Key points made were that watering at night is a good control option since it very much disrupts egg laying. Stressed plants attract DBM. Stressed - includes damaged or dehydrated plants. Genetic markers for DBM population structure and movement, PhD project (Nancy Endersby) Nancy is soon to begin her PhD developing molecular genetic markers for DBM. This project will assist in resistance management as well as other management. Simon Baxter is the new research officer beginning SPIRT (CESAR/DNRE Vic funded). He will be mapping the gene of DBM with the aim being to prevent resistance to Bt.

266
Natural Enemies Impact of natural enemies on DBM in Perth (Françoise Berlandier) Cage experiments showed that full cage covered resulted in the most damage impact. Note a correction in the circulated report in the middle of page one which should show the figure of 44% rather than 42%. As the temperature drops the population of Diadegma goes up. Francoise will be repeating her study at 3 different sites. Commented that Mike Keller has found that insects do not orient and lay eggs properly in complete darkness. DBM need light to navigate. When light is withdrawn from DBM, they will lay eggs on the stem or cage rather than on the plant.
* A new DBM natural enemy to Australia - Oomyzus sokolowski has been found in WA, QLD, & TAS. • Grower asked if releasing of wasps in the field to boost numbers was an option. The reply was that
lab rearing of diadegma results in more males, so that is a problem. Tasmanian survey of DBM parasitoids (Lionel Hill) Most of the caterpillar samples sent to Victoria for testing show that they are usually parasitised. 19 properties sampled - all north-west broccoli growing. Average parasitism is 50%. Found Diadromus, Diadegma Semiclausum and Diadegma Rapi. QLD (ACIAR project) natural enemy studies (Mike Furlong) Looked at the differences in cage experiments of crops using calendar spraying and those using IPM. All crops had natural enemies. Unsprayed crops had more however. The order of abundance was as follows: 1. D. Semiclausum 2. D. Collaris 3. A. Ippeanus 4. O. Sokolowskii. Other natural enemies found were spiders, beetles, lacewings and coccinelis. Open cages had more parasitism. Predation can have a big impact on DBM numbers. DBM losses in closed cages still happened but not from predation. Incorporating natural enemies into Brassica IPM (Mike Keller) Parasitoids live longer with nectar sources. Evaluating nectar sources was done. The aim is for conservation biological control. Results of work so far are inconclusive. Overall gross survival of insects in the field shows no impact of flowers on DBM numbers. Parasitic wasps and bees harvested the nectar. A new student will evaluate scales of movement by wasps. Will be examining ways to incorporate parasitism into decision-making. Evaluate additional nectar and pollen sources. All parasitic wasps like broccoli flowers. The Broccoli crops flower too late to be useful, but old harvested planting may prove useful. Wasps are active in warmer temperatures and DBM are active at lower temperatures.

267
Should not focus just on parasitoids. Spray will always have a negative impact on parasitoids. Even soft sprays will negatively impact. Spiders and beetles are important to provide a buffer for those times when sprays are needed. Predators need to be encouraged by pollen plants. No consistent results with products such as Predfeed or Envirofeast. These allow the grower to feel they are doing something even thought they may not achieve much but psychologically does. In terms of ID of parasites - Jo Kent has the developed the best ‘Keys to Parasites’, and Mike can forward these on. In identifying the differences between Apanteles and Cotesia - the following helps. Apanteles are all black coloured with an external ovipositor you can see, and Cotesia has brown mixed in. • Grower comments: would like to encourage predators, rather than parasitism alone, as the predators
are the ones that will minimise damage, which is the key thing for saleability. Parasitism still results in damage.
• Mike Furlong has found that predation does happen early in the season. In his research 90% of eggs lost to predators.
Suggestion that maybe the window strategy needs to change to accommodate predator viability. Predation rates vary enormously and the focus of future study is to see which species are having the biggest impact. Mike Keller feels we could still look at importing further Diadegma Semiclausum, from say South Africa, to help address the male bias in Australian populations. Asked that we record sex ratios when possible in our research. Males don't parasitise and females often lay male eggs. Around 5 years is needed to bring about approvals and research for new insect introductions. Paul Horn - Entomologist and Crop Monitoring Consultant Spoke about his work and in the field observations. Favours IPM to improve crop quality and pest control. IPM over the whole of a site is important. Has found that the role of predators is more important than the role of parasites. Any grubs in produce are bad for rejection of produce. Therefore the role of predators requires more focus. Paul scouts for all pests and predators in the field. Aphids, cupworm, thrips etc will thrive if DBM were gone, so all insects need to be taken into account. Records each type of beneficial and pests. No formal thresholds are used. Gut feel is relied on. Sometimes there is lots of damage but no economic loss. Pesticide damage to lacewings etc all need to be known by a grower. For true IPM - Paul supports Bt's and then selective sprays for beneficials. Crop Scouting Research / Validation VIC Crop Scouting Report (Nancy Endersby and Peter Ridland) Regular crop monitoring underpins IPM Programs. Crop scout training began in Victoria in 1998. Each year, training happens in the lab and the field. 9 scouts trained so far. It has been learnt that to educate scouts effectively 4 sessions is needed. They cover the following; 1. explain methods, benefits & limitations of scouting 2. assistance with interpretation and implications of results 3. end of season summary and feedback session with growers 4. spray records, reduced insecticide use and other benefits. Scouting today could be improved by the following:

268
- Continued training - Effect of natural enemies included in decision-making - Longterm adoption by commercial enterprises - Use of the 15% threshold. - Supported experience gained by scouts will lead to less conservative management. It was suggested that sharing of field scouting data could be relayed to other scouts to build a regional picture. It was commented that scouts have a hard time getting a picture of what they are finding in the field if they don't see the grower on their visits. A location on the property for spray data to be accessed by the scout needs to be arranged. SA Crop Scouting Research – Evaluating the Presence-Absence Scouting Plan (Nancy Schellhorn) 15% threshold is flexible and can be extended with experience. Scouting with the chart can be a very real time saver in the field. The chart does not suit all crop varieties and ages of plants. Using the chart in the field has suggested the following: - Threshold level of 15% may be too conservative for broccoli and possibly cauli and cabbage - Rule of thumb may be to protect plants with Bt for the first 2 weeks, relax thresholds from week
2-8, then protect plants weeks 8- harvest. - 15% Threshold is appropriate for brussels sprouts, may need to include eggs in decision making. The chart helps to keep the scout focussed. Just going out but not recording can allow them to rely just on gut feeling, and it is possible they can be distracted by mobile phones etc. Charts provide reliability. John Cranwell noted that employing a scout is excellent value for money, and the scout also picks up on nutrition and other crop information. “Operating without a scout is like driving without a speedometer.” TAS Crop Scouting Research (Lionel Hill) Has found that it is possible to have very high moth numbers with very low egg laying numbers. Most growers scout, but not using the 15% chart at present. Open Discussion occurred on how well are thresholds working in other States, and the merit of developing a decision-tree which incorporates parasitism levels and DBM population density and trajectory. Not all States had adequately trialled the threshold chart to comment. Three growers present stated that they want the 15% threshold chart encouraged among growers, but to also encourage them to test the boundaries further. DAY 2 Overview of the 2000-01 Extension Activities nationally and the Project’s Extension Milestones (Dijana Jevremov) This was delivered via summary slides of each States activities and matched with the milestones aimed for. All items of extension were either met, or planned to be met in the near future. Overview of the “IPM for Brassicas” Project (Anita Chennell and Emily Tee) Video production of IPM is the major focus of the future of this project. It was suggested that the title 'Growing for the Future' not be used as it was too close to the Ausveg video production title.

269
Overview of the Communication Plan (Dijana Jevremov). Delivered, and used to set the scene of information for prioritisation of the 14 strategies contained in the Plan, and the rating of importance of the ancilliary strategies. Group Discussion and Prioritization of the Communication Plan Strategies (facilitated by Bronwyn Walsh) All present were asked to choose their top 8 strategies from those presented. Votes were then recorded by separating growers’ top choices and the choices of all others present. The result of this is as below: Growers Priorities • Field Days • Enhanced electronic information flow via email and phone etc • National newsletter • Handbook change and updates • Testimonial sheets • Video production • Marketing of IPM to a moderate level to consumers/buyers • Case studies/focus groups • Articles in print media. Others Priorities • IPM brochure • Field days • Enhanced electronic communication • Websites updated and created • National newsletter • Handbook change and updates • Video production • Articles in print media. Below is the summary of agreement as to who will be responsible for fulfilling the strategies.
Strategy Personnel to conduct • Field Days Team member in each state responsible • Enhanced electronic information flow via
email and phone etc DJ and each State team member
• National IPM brassica newsletter DJ with input from all • Handbook change and updates Other Pests - Greg B has old factsheets, Bron
W, Peter R, Nancy S. Resistance Strategy - GB, BW Update Scouting - NS, include diseases and weeds Natural enemies - Mike K Cultivar selection & ? Speedlings - PR Dispersal - NS, GB Adulticidal Activity - NS Insecticides & Natural Enemies - BW, GJ, NS

270
Enhanced Bio Control - Mike K • Testimonial sheets Team member in each State to provide to DJ • Video production Anita & Emily supported by DJ with guidance
Strategy
Personnel to conduct
• Marketing of IPM to a moderate level to consumers/buyers
To be met short term by the IPM brochure
• Case studies/focus groups on site and reactive to problems
Recognise the benefit. Grower field days during the year provide a crude form of this idea. More than these is not in the scope of the project. IDO possibility to organise.
• Articles in print media. DJ and State team members • Websites updated and created SA & Vic with DJ to oversee • IPM brochure DJ • Testimonial sheet Each State team member Research Interlude Auto-dissemination studies (Richard Vickers) This study involving zooptera fungus being showered onto males in a pheromone trap, may be extended in a partnership funding arrangement with HAL as raised at the workshop. Susceptibility of Brassica cultivars to DBM (Nancy Endersby and Peter Ridland) As per report. Extension Plans For 2001-02 (facilitated by Francoise Berlandier) Timeframes and plans for workshops, materials needed and who will fulfil tasks.
Due Date Milestone (in bold) Outcome (in bold) Delay to July 2002 Information base for growers
selection of cultivars improved. Interim report on Cultivars prepared and results presented to growers at annual workshops and via other means.
Who: Ag Vic What: Further work on other
cultivars Progress to date: 2 cauli cultivars done (pre-lim)
Issues: International Conference in
Nov making timelines hard to meet.
July 2002 – deadline is still feasible
Property separation information communicated to growers and advisors, & strategies based on dispersal findings.
Interim report on DBM dispersal findings relayed to growers at annual workshops & via other channels

271
Who: Nancy S, G Baker with help of Mike K
What: specific to IRM programs relationship to thresholds in terms of adult population increase & moving into younger plantings. - management of beneficials / implication on beneficial nursery.
Progress to date: Mo’s findings supported, DBM don’t move far; parasitoids move further.
Due Date Milestone (in bold) Outcome (in bold)
1 July 2002 Due date still feasible
Insecticide Resistance Management improved
Update IRM window strategy published as Handbook module and promoted.
Who: Greg B with others Suggestion: Laminated A3 version
for Resellers also.
1 Jan 2002 Due date feasible for #1. below only
Information base for growers selection of insecticides is improved
Interim report on adulticide activity of Registered Insecticides prepared and presented to growers at annual workshops & via other means
Who: Nancy S 1. Deliver summary of info
(published) on adulticidal activity for DBM
Extension info from NS and DJ
2. Define research: to consider exp.
to determine adulticidal activity of the new chemistrys
July 2002 Due date feasible
Growers aware of practises that promote performance of natural enemies
Draft Handbook module on conservation biocontrol published and circulated
Who: Mike K Progress to date: See report
presented for this workshop event. More work planned for next few months.

272
Grower Workshops 2002
Stated workshop schedules for each State are as follows: WA – August 2001 and April 2001 VIC – Day after DBM conference will hold one for Growers and Resellers TAS – April 2002, ?October mid Spring also QLD – March, Sept, Oct 2002 SA – Late March 2002 NSW – Spring with Greg and Nancy S presenting. Industry Development Officers and the DBM Team (facilitated by Craig Feutrill) Outcomes of the presentation and discussion led to Craig suggesting that he and Dijana meet to discuss communication pathways and protocols once back in Adelaide. Value of a national newsletter with local content established and for those States such as WA where it is not suitable, then content is sent to IDO for inclusion into local publication. Use mailing list of IDO’s to distribute, and for other information transfer to growers. Other issues? • The spray roadshow being run again was discussed and it was agreed that it should be on video in future for
practicality. • IPM Australia site to be posted onto the list-server.

273
APPENDIX M NEWSLETTERS / IPM BROCHURE

W elcome to the first issue of BRASSICAIPM National Newsletter. The primaryaim of this newsletter is to inform
growers, consultants and resellers about research,tools, ideas and other information to do with anintegrated approach to Brassica pest and diseasecontrol. It is an initiative of the NationalDiamondback moth (DBM) Project Team ofresearchers and extension personnel, who operatewith funding from Horticulture Australia.
There will be 2-3 issues per year. Input into futureeditions is welcome from practitioners outside theteam. Contact IPM Adoption Coordinator DijanaJevremov using the contact details at the end ofthis publication.
HANDBOOK NOTE:Integrated Pest Management (IPM) combines innovativescience, environmentally sensitive technologies and naturalsolutions for managing pests. The aim of IPM is to growbetter quality produce with less cost and risk to producers andmore protection for our environment. There are many goodpublications to assist with implementing IPM and one of themis ‘The Handbook of Integrated Management of DiamondbackMoth in Crucifers’ written by members of the DBM NationalProject Team.
It’s easy to use format describes what IPM means, guidesthrough crop scouting, explains insecticide resistancemanagement, the role of Bacillus thuringiensis (Bt) and muchmore. Brassica growers are reminded to refer to the valuableinformation contained in this white folder.
The handbook is progressively being added to by the teammembers, and provided growers are on the mailing list oftheir DBM Team member or Vegetable Industry DevelopmentOfficer in their State, there should be no problem getting newinserts as they are developed. All Brassica growers shouldhave a copy of this free handbook, but if you are a growerwithout a copy, ring your State DBM team member using thecontact details at the end of this newsletter.
THIS ISSUE
A GROWER’S STORYWhy I changed to Integrated Pest Management
Below is an extract from a talk given recently to AdelaideBrassica growers by Queensland grower Kevin Niemeyer.
“I started farming in the early seventies with a mentality ‘thatif you have a problem, throw a chemical at it’. Chemicalswe’d use then were DDT and Endrin among others. In theearly eighties I began growing Brassicas. This went OK for afew years until DBM became uncontrollable due to chemicalresistance.
Our attitude at the time was, farm today for today. We usednew chemicals as they became available with no considerationto the environment. If they worked we used them and whenthey didn’t, we poured in another chemical. A new chemicalmight last 2 seasons. There was no thought to resistancemanagement. I would mix two or three chemicals togetherand was spraying every second day, the moths were as thickas ever, harvest was about a 60% cut-out and then thequality was poor.
In the late eighties chemical resistance in DBM became sohigh that the Department of Primary Industries, GattonCollege and Industry worked together to develop a strategy.A summer production break was introduced and accepted bygrowers, only because it became uneconomical to growBrassicas due to the high cost of pest control in the summerperiod and poor, unmarketable produce. At this time I wasseriously considering exiting the industry due to viabilityproblems and the difficulty in producing a quality product.
I became involved in IPM in the early nineties when anextension officer approached me to do commercial trials.Another grower from a different area in the district wasapproached, he also agreed to run trials. This proved to be avaluable decision as we were able to make comparisonsbetween the two areas.
It was lucky I had success in the first year. The second yearproved to be more difficult while it was the opposite for theother grower. The interesting factor was the approach thateach farmer had taken. Myself with success in the first
Issue 1 September 2002
T o w a r d s I n t e g r a t i n g P e s t M a n a g e m e n tPrinted on 100% recycled paper with soy based inks. Produced with funding from
DBM NATIONAL RESEARCH ROUNDUPcontinued...Adulticidal Activity ResearchThis research is about finding the potential for certaininsecticides to be used to kill the moths of DBM. An articlein the next newsletter will explain what we know so far.
Impact of Insecticides on BeneficialsThis work is developing a chart that lists the relative impactof insecticides on beneficials. This is in the final stages, andit is expected to be ready for release in the next couple ofmonths.
A WORD ON WETTERSWetters or surfactants are needed to get good spraycoverage and to make pesticides stick to the waxy leaves ofBrassica plants. A US study in the 1990’s showed that leavestreated with wetters stimulate egglaying by DBM. AUniversity of Adelaide laboratory study showed that thisphenomenon occurs with several different types of wetter(non-ionic, cationic and canola-oil based).
In each case, about twice as many eggs were laid on plantstreated with the wetters compared to untreated plants. Theeffect of the wetters on moth behaviour lasted 2-7 days,depending on the plant cultivar and weather conditions.Growers should be aware that all sprays mixed withwetters/oils may promote egg laying by DBM. Field studiesare needed to assess the effect of these wetters on DBMegglaying and population increase when applied to crops.
NEW BRASSICA IPM CD-ROM & VIDEOIn a few weeks time, growers can expect to receive a copy inthe mail of a new CD ROM to play in their computers. It isthe product of the ‘IPM for Brassicas Project’ funded byHorticulture Australia and the Victorian Department ofNatural Resources and Environment. Growers that don’thave a CD ROM player or computer, can still view theinformation via a loaned video copy that will be with eachState Vegetable Industry Development Officer (IDO) and DBMTeam member.
The interactive CD and video features first-hand accountsfrom Australian Brassica growers, scouts and researchers whohave used various IPM techniques to manage a variety ofpests and diseases.
If growers have changed their mailing address or don’t get acopy of the CD within a couple of months, contact yourState Vegetable IDO.
4
N A T I O N A L N E W S L E T T E R
BBrraassssiiccaa IIPPMM
Field day at Kevin Niemeyer’s farm in 1997.
KEY CONTACTS DETAILSVictoriaPeter Ridland, Entomologist, DBM Project contact. Ph: 03) 9210-9222, email: [email protected]
Patrick Ulloa, Vegetable Industry Development Officer, Ph: 0429 990 553, email: [email protected]
TasmaniaLionel Hill, Entomologist, DBM Project contact. Ph: 03) 6421-7636, email: [email protected]
Roger Tyshing, Vegetable Industry Development Officer, Ph: 03) 6331-6377, email: [email protected]
Western AustraliaFrancoise Berlandier, Entomologist, DBM Project contact. Ph: 08) 9368-3249, email: [email protected]
David Ellement, Vegetable Industry Development Officer, Ph: 08) 9456 4077, email: [email protected]
This newsletter compiled and edited by Dijana Jevremov
South AustraliaGreg Baker, Entomologist, DBM Project contact. Ph: 08) 8303 9544, email: [email protected]
Dijana Jevremov, IPM Adoption Coordinator Ph: 08) 8303 9536. Wed, Thurs, Frid. email: [email protected]
Craig Feutrill, Vegetable Industry Development Officer Ph: 0418 831 089, email: [email protected]
QueenslandBronwyn Walsh, Entomologist, DBM Project contact. Ph: 07) 5466-2222, email: [email protected]
Julia Telford, Vegetable Industry Development Officer, Ph: (07) 3213-2425, email: [email protected].
New South WalesLeigh James, Estension Horticulturist Vegetables, DBM Project contact. Ph: (02) 4577-0622, email: [email protected]
Alison Anderson, Vegetable Industry Development Officer,Ph: 0409 383 003, email: [email protected]
HANDBOOK NOTEA GROWERS STORYCLUBROOT UPDATECONSUMER SURVEYDBM NATIONAL RESEARCH ROUNDUPA WORD ON WETTERSNEW BRASSICA IPM CD-ROM & VIDEOKEY CONTACTS
NEXT ISSUE
REPLY TO GROWERS QUESTIONS
THE FUTURE OF INSECT CONTROL
PROFESSOR TONY SHELTON’S VISIT
ADULTICIDAL ACTION OF
INSECTICIDES
USEFUL WEBSITES

BBrraassssiiccaa IIPPMMN A T I O N A L N E W S L E T T E R
A GROWERS STORY continued...
season having started with a soft approach, finding thesecond season more difficult when starting with heavychemicals. The other grower did the opposite finding the firstseason difficult when starting with heavy chemicals, while
having success in the second year when he took the softapproach to start that season. It became obvious to me that asofter pesticide such as Bt which is more selective at the startof each season, seemed to be a move in the right direction.
I began to realise that the beneficials although low innumbers after the summer break were the breeding stock forthat season.
To alleviate my lack of confidence I employed a professionalconsultant. I still use and recommend that all growers use aconsultant. He is moving around the district and can beaware of pest pressures developing before the grower sees iton his own farm.
With an experienced consultant to monitor my crop, I decidedto reduce the size of my first planting in the third year, take asoft approach, and if necessary sacrifice that planting. This Ihoped would increase the numbers of predators and parasitesfor later in the season and reduce our dependence onchemical controls. This strategy did work with no less cut-outin that planting than in previous years, and it did achieveeasier control later in the season.
All this was done in an intensive cropping area, withneighbours still using conventional style chemical technologyand growing practices. The important step to getting weanedoff chemicals was to learn to recognise pest damagesymptoms. The correct identification of pests, naturalbeneficials, predators and parasites.
Step by step we learnt that we could tolerate higher pestnumbers than previously thought possible. We became awarethat pest management with the use of predators & parasitoidsis not only about controlling pests, but also about preventingthem. Under a conventional program you create a sterileenvironment.
I no longer spray with an ovicide. We carefully monitor thematurity of eggs to see if they have been parasitised, andthen spray at hatching to kill the larvae that come through,preferring to use Bt so as not to kill the parasitic wasp.
Timing of this spray is critical. Learning this was a major stepforward. I now add molasses to the spray to encouragefeeding. By doing this I have achieved good control of CentreGrub. This draws them out onto the leaf to feed where thespray has been placed. I plant Alyssum randomly throughoutthe crop. This encourages hover fly and parasitic wasps bygiving them a nectar source needed to survive. When sprayingtoday, I consider what I don’t want to kill, as well as what Ineed to kill.
It is my dream, before I finish farming, to grow a planting ofcabbage without spraying an insecticide at all. I have achievedthis in broccoli over the last 5 years. Be prepared for achange of attitude, this is most important, it is a change youwill prefer in time. I watch with great delight as small birdsfeed on moths, I see small green frogs living at the bottom ofcabbages feeding on small larvae. All this helps reduce pestpressures and significantly reduces the risk of chemical residuein the produce leaving my farm.
Today I look at soil management, rather than soil preparation.Soil health, a balanced plant nutrition, better fertiliserplacement and timing, all help with pest management. Now Ifarm for tomorrow today. A Positive Step Towards SustainableAgriculture.”
CLUBROOT UPDATEThe National Clubroot Program funded by HorticultureAustralia, recently developed key outcomes for the remainderof the program.
Much of the research to date has been summarised in apamphlet entitled ‘A guide to the prevention andmanagement of clubroot in vegetable Brassicas’ and the videoand CD-Rom entitled ‘Integrated Pest Management forBrassicas’ (see further article). Seedling growers can expect toreceive a series of nursery fact sheets in the future, that willrecommend hygiene and disinfestation practices to avoidentry and transfer of the clubroot organism.
Growers can look forward to the following in the finalyear of the project:1. Development of shed posters, fact sheets and a Brassica
roadshow to develop effective on-farm IPM strategies.2. Verification of the predictive power of the recently
developed quantitative diagnostic test for clubroot.
Growers wishing to nominate their site for the soil samplingsurvey, or to obtain more information about the NationalClubroot Program, can contact Caroline Donald on (03) 9210 9299.
CONSUMER SURVEYGood News For the Industry
IPM Adoption Coordinator Dijana Jevremov conducted acommunity survey at the last Adelaide Royal Agricultural &Horticultural Show. This show is a highly popular yearly
event that attracts a large number of people from all sectorsof the community. A stand was set up with samples ofbroccoli with DBM pupae on them along with photo imagesof other Brassicas with damage and insect pests on them.The community was asked to look at the samples and imagesto answer 6 simple questions, and then put their anonymoussheets in a survey box. The aim was to see what thecommunity thought about finding insects/damage in theirproduce. It is recognised that growers are uneasy about changing current practices toward IPM because of fear it maymean unacceptable damage and contamination until newstrategies are established.
Here are some of the results:• 747 people filled in survey forms over nine days. • The majority of respondents were in the 26-64 years age
group.• 56% of people either have or do find insects in their
Brassica produce.• 74% are affected either a little or not at all by finding
them.• At least 90% of people aged 26 and over are
prepared to accept finding an occasional insect if it means less chemicals are used in the growing.
• However every age group shows a strong willingness to accept an insect to reduce chemical use.
Dijana is confident that the findings would be very similaracross the nation. The results show that the consumer whois informed about what finding an insect or damage mightmean, is willing to be an ally towards positive change on thefarm. Dijana has done several ABC radio interviews,‘National Market News’ article and press releases about thefindings.
Anyone wanting a full copy of the results is welcome tocontact Dijana using details supplied at the end of thisnewsletter.
DBM NATIONAL RESEARCH ROUNDUPBelow is a summary of some Brassica research happeningaround Australia. This newsletter will include useful articleson results in future. Unless stated otherwise, all research isgratefully supported by Horticulture Australia Limited (HAL).
Some of the Research and Extension officers in Australiawho spend time working on DBM management.
Scouting and Action ThresholdsTesting of threshold levels in scouting of various Brassicacrops at different stages of crop growth, is happening.Thresholds are used to indicate the pest level where controlmeasures are needed to avoid economic damage. Below acertain level, pest control will often cost more than thedamage. The aim is to develop guidelines that considerseveral types of information when making a decision aboutwhether to spray an insecticide. Next instalment of scoutingguidelines will be available in a couple of months.
Movement ResearchExperiments have been done to determine if DBM and theirmain parasitoid move from mature to young broccoli, bothbefore and after harvesting of the mature plants. Results andwhat they mean for growers, will be available in March 2003.
National Resistance Monitoring ProgramThis program was established in 1999 and involves testing offield populations of DBM from each major Brassica producingState, where a variety of new and long-establishedinsecticides are used. The data collected provides valuableinsight into the progress of resistance management.
No resistance was detected to Bacillus thuringiensis, Secure,Success, Proclaim, Avatar or Regent in the populations ofDBM tested in the 2001-2002 financial year. Resistance tosynthetic pyrethroids continues to be the main problem inAustralian populations of DBM in both vegetable crops andcanola. Expansion of the testing program is planned for thefuture.
Genetic structure of Australian Populations of DBMThis non-HAL funded research is gathering information aboutlong-range dispersal of DBM. The information will bevaluable to optimise management of insecticide resistanceand improve control strategies. One year of three years PhDwork has been completed so far.
The parasitic wasp Diadegma Semiclausum is a commonenemy of DBM.
Natural EnemiesExperiments have shown that parasitic wasps live longer andare more active when they are able to feed on sugar sourceslike floral nectar. Research is being done in SA to examinethe use of flowering plants in Brassica growing with the aimof making recommendations to growers as part of an IPMprogram. The Australian Centre for International AgriculturalResearch (ACIAR) is funding work on the impact of naturalenemies (predators, parasitoids and pathogens) on DBM insoutheast Queensland.
2 3T o w a r d s I n t e g r a t i n g P e s t M a n a g e m e n tT o w a r d s I n t e g r a t i n g P e s t M a n a g e m e n t
Volunteers needed!Researchers need to sample and monitor soil fromsites nationally to meet objective 2 above. Volunteergrowers are invited to participate. All soil tests will be completed free of charge (value$180 per test) and participants will receive a reporton the outcome of their soil tests and project results.
Kevin Niemeyer (left) in SA with grower Steve Newman.

THIS ISSUE
Issue 2 February 2003
T o w a r d s I n t e g r a t i n g P e s t M a n a g e m e n tPrinted on 100% recycled paper with soy based inks. Produced with funding from4
N A T I O N A L N E W S L E T T E R
BBrraassssiiccaa IIPPMM
KEY CONTACTS FROM THIS ISSUEREPLY TO GROWERS QUESTIONSDBM in Canola
THE FUTURE OF INSECTICIDE CONTROL A chemical company perspective.
PROFESSOR TONY SHELTON’S VISITKey points
WHITE BLISTER/RUST UPDATEUSING INSECTICIDES ON MOTHS Research results
NEW DBM SCOUTING GUIDENew format
NEW INSECTICIDE TOXICITY CHARTUSEFUL WEBSITES
NEXT ISSUE
ALL ABOUT RESISTANCE
What it is
Why it happens
What to do about it.
DBM MOVEMENT RESEARCH
PLUS MORE
For the contact details of the State DBM Team members, refer to issue one of this newsletter or contact Dijana Jevremov below.
Greg Baker, Entomologist, DBM Project contact, Ph: 08) 8303 9544 email: [email protected] Jevremov, IPM Adoption Coordinator, Ph: 08) 8303 9536. Wed, Thurs, Frid, or 0438 466 511anytime, email: [email protected] Schellhorn, Entomologist, S.A. DBM Project contact, Ph: 08) 8303 9543email: [email protected] Elizabeth Minchinton, Researcher, DPI Knoxfield, Victoria, Ph: 03) 9210 9222 email: [email protected] Walsh, Senior Entomologist, Queensland DPI, Ph: 07) 5466 2222 oremail: [email protected]
This newsletter compiled and edited by Dijana Jevremov
W elcome to issue two. This newsletter isan initiative of the NationalDiamondback moth (DBM) Project Team
of researchers and extension personnel, whooperate with funding from Horticulture Australia.
REPLY TO A GROWER QUESTION
Do DBM come from canola and what Is their resistanceto chemicals?
By Greg Baker - Entomologist, South Australian Research andDevelopment Institute.
Movement of DBM between different cropping regions andhost-plants is very important. It has implications for goodpest management such as pinpointing key risk times for cropinvasion, the choice of control options, etc. For insecticideresistance management (IRM) a strategy that is coordinatedbetween the canola and Brassica vegetable industries may benecessary. However DBM movement is still poorlyunderstood. What do we currently know?
DBM primarily feed on plants from the family Brassicaceaethat includes Brassica vegetables, canola, and weeds such aswild turnip, shepherd's purse, alyssum, cresses, mustards,rockets, radishes and charlocks.
Over the past several decades, researchers have learnt that amajor influx of DBM into Brassica vegetable crops occurs inthe spring in most years across southern Australia. This influxof adult moths coincides with the haying off of the winterhosts of DBM, such as canola crops and Brassica weeds,which suggests these hosts may be primary sources of theseDBM invaders. These invasions were observed to occurbefore the 1990’s explosion in canola cropping acrosssouthern Australia. The extent to which these springinvaders are currently sourced from canola crops remainsunknown. At these times DBM moths can fly long distances,
and in 2002 are thought to have crossed Bass Strait intoTasmania from the mainland in larger numbers thanpreviously recorded.
Nancy Endersby, a Victorian member of the HorticultureAustralia national DBM project, is conducting PhD work todetermine if populations of DBM are isolated, or are inter-mixing at different times in the year.
Over the past several years DBM has caused major losses tomany canola crops in WA, SA, NSW and VIC. Frequentspraying with synthetic pyrethroid (SP) insecticides has been acommon response, and moderate levels of SP resistance wererecorded in 2001 in DBM collected from canola crops.Interest in obtaining canola registration for the 5 newinsecticides registered for DBM control in Brassica vegetablecrops is now mounting in some sections of the canolaindustry.
If DBM populations in vegetable and canola crops are inter-mixing, this has major implications for our long-term abilityto limit the evolution of resistance to these new products forDBM in vegetable crops. These developments reinforce theimportance of improving our understanding of the interplaybetween DBM populations in vegetable crops, canola andweeds.
If you have a question you would like answered aboutBrassica pest or disease management, send them to DijanaJevremov using the contact details on the back page. Wewill aim to answer as many as we can in future editions.
NEW INSECTICIDE TOXICITY CHART
Bronwyn Walsh has taken the lead from the DBM Team andproduced a chart that characterises the toxicity of currentinsecticides to both pests and natural enemies. The chart is intable form and includes active ingredients and their impact onpests and beneficials, a persistence rating and an IPM rating.
The chart has been produced for use by growers andconsultants as a tool to guide their selection of insecticides,in conjunction with the information from scouting. Referringto the chart will make the choice of product to preservebeneficials easier.
The information comes from laboratory and field tests, andwas generated from research in Brassicas and cotton(Narrabri, NSW). Look out for this tool in the post by April.
Further enquiries direct to DijanaJevremov using details on back page.
Bronwyn Walsh, Senior Entomologist, QueenslandDepartment of Primary Industries.
THE FUTURE OF INSECTICIDE CONTROLcontinued...
"There are no “silver bullets” when it comes to pest insectcontrol, since no one technology is appropriate or suitable toevery pest problem. Because insecticides provide apredictable, effective, and timely means to address pestproblems, they are likely to remain a key component of IPMprograms for the Diamondback moth, and most otherimportant insect pest species.
In light of DBM’s long history of resistance development, atrue integration of control tactics is essential to the long-termavailability of control options for DBM.
There is a real need / responsibility to make the best use ofthe new products we have. For a variety of reasons,including the continuing rapid consolidation of theagrochemical industry worldwide, the future replacement ofany of the current products is increasingly problematic. Newproduct development can take 8-12 years and is increasinglyexpensive to do. A cost of $US100 million dollars to developis not uncommon. The loss of any of the new chemistriespotentially represents an irreplaceable resource."
Tom Sparks, with the Editor at the International Workshop on Crucifer Pests in Melbourne
USEFUL WEBSITESwww.brisbane.tafe.net/Library/horticultureGeneral growing one-stop-shop site that acts like alibrary catalogue.
www.nre.vic.gov.au/agvic/ihd/projects/dbm.htm www.sardi.sa.gov.au/entomology/index.html Note that the SA site is under reconstruction.
www.waite.adelaide.edu.au/Teaching/Diagnosis/welcome.htmDiagnosis of problems in brassica vegetables.
www.nre.vic.gov.au/farming/index then select'Horticulture', 'Agnotes', then the triangle next to'Vegetables' for notes on; Clubroot of cruciferous cropsDowny mildew of BrassicasCabbage growingIntegrated pest management tactics for DBM.
www.goodbugs.org.auBiological control of pests in Australasia.
www.nysaes.cornell.edu/ent/biocontrol/Biological control/IPM, Cornell University, USA.
Do you want a speaker?If you have an industry gathering coming up, keep in mind that members of the DBM team and others referred to in
this newsletter, may be available to give a presentation. Contact direct or via Dijana Jevremov using details below.

BBrraassssiiccaa IIPPMMN A T I O N A L N E W S L E T T E R
WHITE BLISTER/RUST UPDATE
By Dr Elizabeth Minchinton – Researcher, Dept of PrimaryIndustries, Victoria
The current outbreak of white blister/rust on broccoli wasfirst reported from Werribee, Victoria during the summer of2001/02. It has now been found on broccoli in most otherVictorian growing regions and was recently found on broccoliin Tasmania. In the past it has been reported in NSW, butthere have been no reports of it on broccoli in Queensland or SA.
The disease is caused by a fungus, which appears as a whiteblister. The blister contains masses of white dust-like sporeson swollen broccoli florets (see Fig) and on the undersurfaceof leaves. Wind, rain, insects, boots and equipment spreadthese spores. The fungus can also cause swellings on rootsand stems and distortion of shoots.
Ten races of white blister have been named. Of these, Race7 occurs on Brassica rapa (chinese cabbage, pak choi), Race 9on Brassica oleracea (broccoli, cauliflower, chinese broccoliand kohlrabi) and Race 4 on shepherd’s purse, a commonweed. In the glasshouse, Races have been reported to crossfrom one host to another.
Horticulture Australia, the vegetable industry levy, PlantStandards Victoria and the Department of Primary IndustriesVictoria, are establishing a study to find the source(s) of theepidemic and management options for white blister/rust onBrassicas.
For more information contact Dr Elizabeth Minchinton, DPI,Knoxfield (03) 9210 9222.
USING INSECTICIDES TO KILL MOTHS
By Nancy Schellhorn - Entomologist, South AustralianResearch and Development Institute.
Growers often ask what insecticides they can use to killmoths rather than grubs, and whether it is an effectivestrategy. We conducted a study where we, 1) reviewedprevious research, 2) sprayed non-toxic fluorescent dyes onfield populations of DBM to ask a) what proportion of mothsand beneficial insects are hit during a spray, and b) does thetime of day that the spraying is done, matter? The resultsare as follows.
The ExperimentUsing non-toxic fluorescent dyes as a marker, we sprayedfield populations of moths in the morning and evening atdifferent times and assessed the proportion marked.
Table 1. Highest percentage of moths and wasps that werehit by the fluorescent spray during December 2001 & April 2002
Our results showed that the highest percentage of mothsthat were either hit by or came into contact with the dye was41%. For parasitoids, it was 68%, and both occurred in themorning. The results for the evening spray showed that only20% of moths and parasitoids were hit by the spray.
Summary of Findings Less than half of the moth population was hit by dye spray,and of those, most only had trace amounts. With SyntheticPyrethroids such as Ambush® and Dominex®, a wide range ofpests including DBM are mostly repelled by them rather thankilled by them. This means that the majority of moths avoidthe spray, or receive only a little as they move away from it,then recolonise later. Due to the low-dose of insecticide thatis delivered to the moth, it can increase the rate of resistance.
In the lab when permethrin was sprayed onto cocoons ofDBM, only 5% died, but 65% of the beneficial insect,Diadegma spp., died. Killing off a high percentage of thebeneficial insects locks a grower into a heavy spray program.The most effective use of insecticide is to target the grubs!
For more information contact Nancy Schellhorn on 08) 83039543 or email: [email protected]
NEW SCOUTING GUIDE FOR DBM
It is well known that crop scouting is one of the mostimportant activities that a grower can do to make sounddecisions about pest control. The current scouting guide youmay be using, developed by the National IPM for DBMProject is about to be superseded.
Dr. Nancy Schellhorn (SARDI Entomology) and Dr. AndrewHamilton (DNRE Victoria) have developed the new cropsampling guide to help agronomists and growers make moreinformed decisions about pest control. The guide is set up as a decision tree that asks a grower /scout such questions as - the type of crop they are scouting(eg. cauliflower or broccoli), growth stage of the crop,market destination (eg. export, processing, fresh), chemicaluse in the crop, and wasp parasitism rates of grubs.Parasitism is determined by simply pulling the grub apartunder a magnifying glass or microscope, to reveal thepresence of the wasp larva inside the grub. Agronomists arebeing trained to quickly dissect the grubs (10 in 10 minutes),and to use the sampling guide.
Once key questions are answered, the reader is led to asampling plan that tells them how many plants to sample to
make an accurate decision about whether to spray, not spray,or scout again in five days.
Currently the plan is being trialed and refined for specificconditions in NSW by Mary Cannard and Robert Spooner-Hart in Richmond and Gus Campbell in Bathhurst, in WA byFrancoise Berlandier, SA by Nancy Schellhorn and John Jeffs,and soon to be tried in Tasmania. Nancy Schellhorn recentlyvisited Lionel Hill, Felicity Wardlaw and Kellie Gillespie inDevonport, TAS to determine what adjustments needed to bemade to the plan so that it will work in Tasmania.
It is hoped that the scouting guide will, 1) save money forBrassica growers by reducing spraying costs while stillproducing a high-quality crop, 2) help growers move forwardin IPM practices by providing them with reliable tools toconfidently advance. The guide will be distributed widely inlate April.
PROFESSOR TONY SHELTON’S VISIT
This is a condensed version of a presentation given togrowers and consultants by Professor Tony Shelton inAdelaide last year. Tony is Professor of Entomology & Assoc.Director of Research for the College of Agriculture and LifeSciences at Cornell University in upstate New York. He hasmany years experience with DBM and is recognised as aworld leader in DBM management. The full transcript isavailable from Dijana Jevremov.
DBM Control"We now have the tools to manage DBM worldwide. I willoutline the relevant ones for yourselves.
• Natural enemies such as parasitoids and predators. In Queensland, research by Mike Furlong estimates thatanywhere from 10-70% of predation of eggs, larvae andpupae of DBM can be attributed to predators such asspiders, birds etc.
• We have diseases or pathogens of DBM such as Bacillus thuringiensis (Bt) that is a bacterium that you spray on thecrop that releases a protein that the insect ingests & then dies.
• Make sure that your transplants are pest free before you put them in the ground. Those moths may have resistanceto many insecticides from what has been used at the nursery.
• Rotation of crops or host-free periods is a control strategy.
• Use insecticides that are compatible with natural enemies - Bt's, Success, Avatar and perhaps some others. Wherever Ihave gone and seen outbreaks of DBM, more than half thetime I can attribute that outbreak to the destruction of the
2 3T o w a r d s I n t e g r a t i n g P e s t M a n a g e m e n tT o w a r d s I n t e g r a t i n g P e s t M a n a g e m e n t
Professor Tony Shelton (right) with grower Kevin Niemeyer in Adelaide
natural enemies by the use of OP and SP insecticides.
• How you apply insecticide is as important as what insecticide you choose. The effectiveness of your sprayer is very important.
• Scouting gives the information a grower needs to reduce insect populations. By knowing what is out there, you areable to time when you spray better, and can select thetreatment better and so the results are better.
ResistanceWith DBM you always need to be on guard for resistance. It has developed resistance in some populations, toorganophosphates, pyrethroids, carbamates, proteins in Bt,insect growth regulators and spinosad, and so we need toask ourselves what is next.
Tony’s Top Ten For Insecticide Resistance Management1. Integrate chemical control with other tactics. 2. Use insecticides that are soft on beneficials.3. Time product application for the most susceptible insect
stage. 4.Only use the recommended rate. Not less or more. That
goes for water volume too.5. Scout your field and treat only when needed.6. Don't tank mix insecticides for the same target insect. If
you are treating for DBM and you are using a Bt, don't mix it with something else because that will just exacerbate the problem of resistance developing to all the products at once, and is not cost effective.
7. Rotate insecticides - use your AIRAC 2 window strategy.8. Apply the insecticide only to the areas of a field that need it.9. Aim to rely on your beneficial insects.10. In the event of a control failure - check your method of
spraying first.
The Future • We have done tests on a broccoli variety where the leaf has
been engineered to produce Bt and so contains the sameprotein that you spray when you use a Bt. We believe thatthis is a very powerful tool for controlling DBM.
• Trap cropping is something that is being studied by us at Cornell. Trap crops are all about planting somethingdifferent to attract the DBM so it will spend time in it, andleave the major crop alone. In WA I saw a grower who hasbeen doing it for 3 years. In about 4 years time I will havesome more answers on these crops based on our research.
• There may also be some tools to assist growers to determine the parasitism levels on their properties. Thiscan then further guide whether to spray or not.
For sustained management of DBM you need to combinetactics to have control in individual fields, but you also need acoordinated effort among farmers in a region."
THE FUTURE OF INSECTICIDE CONTROL
This article is an extract of a talk given in Australia by ThomasSparks, Senior Research Scientist in Discovery Research atDow AgroSciences USA. (Dow manufacture spinosad /Success) He was an invited speaker at the 'FourthInternational Workshop on The Management ofDiamondback Moth and Other Crucifer Pests' held inMelbourne a year ago.
DBMMorning 41%Evening 20%
Diadegma (wasp) speciesMorning 68%Evening 20%
Fig. Swollen floret on broccoli caused by white blister.
Percentage Marked

THIS ISSUE
Issue 3 July 2003
T o w a r d s I n t e g r a t i n g P e s t M a n a g e m e n tPrinted on 100% recycled paper with soy based inks. Produced with funding from4
N A T I O N A L N E W S L E T T E R
BBrraassssiiccaa IIPPMM
KEY CONTACTS FROM THIS ISSUE
ALL ABOUT INSECTICIDE RESISTANCE- What it is- Why it happens- What to do about it.
DBM MOLECULAR MOVEMENT RESEARCH
BLACK ROT PATHOGEN DETECTION
A CONSULTANTS VIEW ON SCOUTING AND IPM
NEXT ISSUE
DBM MOVEMENT BETWEEN PROPERTIES
USING THE NEW CROP SCOUTING GUIDE
THE NEW DBM PROJECT OUTLINE
USING THE NEW INSECTICIDE TOXICITY CHART
PLUS MORE
For the contact details of the State DBM Team members, refer to issue one of this newsletter or contact Dijana Jevremov below.
Greg Baker, Entomologist, DBM Project contact, Ph: 08) 8303 9544 email: [email protected] Jevremov, IPM Adoption Coordinator, Ph: 08) 8303 9672 or 0438 466 511. email: [email protected] Endersby, Entomologist, DPI Knoxfield, Victoria, Ph: 03) 9210 9222 email: [email protected] Tracy Berg, Project Officer, NSW Agriculture, Ph: Len Tesoriero on 02) 4640 6428 email: [email protected] Horne, IPM Technologies, Victoria, Ph: 03) 9710-1554 or email: [email protected]
This newsletter compiled and edited by Dijana Jevremov. Items for future editions are welcome from other Brassica Horticulture Australia funded projects. Contact Dijana using details above.
W elcome to issue three. This newsletteris an initiative of the NationalDiamondback moth (DBM) Project Team
of researchers and extension personnel, whooperate with levy funding from HorticultureAustralia. Items for future editions are welcomefrom other Brassica Horticulture Australia fundedprojects. Contact Dijana Jevremov using details atthe back of this issue.
A CONSULTANTS VIEW ON SCOUTING AND IPM This is an article by Paul Horne, Director of IPMTechnologies Pty Ltd, a private company created toconduct entomological research, particularly in the areaof sustainable agriculture. IPM Technologies alsoprovides crop-monitoring services with the aim ofincreasing adoption of IPM.
Paul has a PhD in entomology and has worked for 20 yearson aspects of entomology in many parts of the world. For 10 years prior to starting IPM Technologies, Paul worked forthe Department of Agriculture, Victoria where he was a team leader and senior entomologist, specialising in IPM andbiological control.
“IPM to me is an approach to controlling pests in any crop,and is based on biological control and management (cultural) methods. The term IPM, in my opinion, is much abused andis being used by some to describe anything that involves pest control, including pesticide resistance managementstrategies and simple pest monitoring.
IPM in Brassicas to me means making decisions on whatactions to take, each week, on a paddock by paddock or planting by planting basis, taking into account the level ofbeneficial species that are present to combat pests. Insecticides are applied only when necessary, and are selectedon the basis of what effect they will have on beneficial species as well as on pests.
The part of IPM that is most often forgotten is the“Integrated” component. Not only do all methods need to beused to control a pest such as Plutella (DBM), but all methodsfor control of ALL pests need to be integrated. That is, contorlmeasures taken for aphids, thrips, cutworms, cabbage white
butterfly, loopers and fungal diseases all need to be compatible and not interfere with each other. That is, there isno point trying to encourage beneficials to control Plutella and atthe same time spraying broad-spectrum sprays for aphids.
Growers accustomed to controlling pests just with pesticidescan recognize pests such as Plutella and aphids and know what happens if they miss a spray when pests are present. So it is a big step for growers to begin trusting insect predators and parasites that they have never seen and do notknow how to manage. The approach that IPM Technologiestakes is to show growers beneficial insects in their own crops,and encourage the growers to begin making decisions basedon what they find in weekly monitoring.
Growers using IPM have been able to achieve far better qualityin their produce, and have done so using less pesticide. Whenpesticides have been applied, they have been much safer forbeneficial species, users and consumers. Experienced growers have been both surprised and pleasedabout this change and plan to keep IPM the basis for their crop protection. For example, Anthony Agosta of WerribeeSouth intends to promote his produce as grown using an IPM approach by stating so on his boxes of cauliflowers.
Anthony has this to say “ IPM works for me. My normalprogram would wipeout everything. Now I spray less oftenand I have learned that the timing of when I spray is the criticalthing. Knowing when the eggs of pests have hatched isimportant now. I save time and application costs, use saferchemicals, it gives me confidence to know what is actually happening in the crop. I sleep better at night and have peace ofmind. I haven’t done the sums but there would be a saving indollars. Spraying when not really effective is a waste of money.”
Con Ballan, also of Werribee South, grows a range of brassicasand other lines, and uses an IPM approach to protect them all.Darren Schreurs (of Peter Schreurs & Sons, Devon Meadows,Victoria) has seen a massive benefit in using IPM and he haseliminated some of his (previous) worst pest problems by usingthis system. He also has included an IPM logo on all boxes ofproduce grown using IPM. All of these growers know that IPMdepends on regular monitoring and not on pre-determined orcalendar decisions.”
RESISTANCE TO Bt (BACILLUS THURINGIENSIS)PRODUCTS IN AUSTRALIAN DBM
By Greg Baker – Entomologist, South Australian Research andDevelopment Institute (SARDI).
What is the Risk?We know that DBM in the USA and Asia have developedresistance to Bt in the field, so the potential of a similardevelopment in Australia is real. A common forerunner toresistance is reduced susceptibility to the particular insecticidein populations of the pest. Recent studies of thesusceptibility to Bt of Australian DBM have shown shiftstowards lower susceptibility in some of the field populationstested. However, the scale of the shifts observed so far is relatively small and not presently capable of affecting controlwith commercial Bt sprays.
What can be done to Manage This Risk?Unfortunately the difference between the Bt productsavailable in Australia is not sufficient to benefit from an IRMrotation strategy. Therefore, to help conserve the Bt productsagainst the risk of resistance, growers should carefully planwhen and how often to spray with Bt. For good resistancemanagement growers should consider having a break onceor several times per year when they don’t spray with any Btproducts for at least one DBM generation time (4 weeks insummer to 10-12 weeks in winter).
To obtain the greatest IPM benefit from Bt spraying avoid theuse of these products when DBM pest pressure is high. Do not mix Bt products with synthetic pyrethroids or otherinsecticides used to control caterpillar pests, and considerfavouring the Bt products when scouting indicates thatbeneficial activity is high.
WHAT IS A RESISTANCE MANAGEMENTSTRATEGY?
The last newsletter gave a top ten list of strategies formanaging insecticide resistance so please refer to them again(or ring the editor for a copy). A key component of that listof ten was the use of an insecticide rotation system based onmode of action.
It is the ‘mode of action’ of the insecticide products thatmakes all the difference to the rotation system beingeffective. AIRAC (Avcare Insecticide Resistance ActionCommittee) has developed the DBM rotation strategy togroup insecticides for DBM control according to their modeof action based on classification. It is updated regularly withnew products as necessary. It is therefore important to havethe latest issue of the strategy for your State.
Call your Vegetable Industry Development Officer or DBMteam member in your State if you don’t have this years issue.
Why does the window strategy vary for some States?There is an AIRAC strategy for DBM for use in VIC, SA, TAS,and NSW. Separate AIRAC strategies have been developedfor QLD and WA. This is because they take into accountclimate and growing time frames applicable to those Statesspecifically.
What if you suspect you have resistance?If you believe the problem isn’t caused by poor spraytechnique or timing, and the water quality used for the mix isfine, then you may have an insecticide resistance problem.Take this up with your consultant or reseller store in the firstinstance. They may contact the manufacturer to confirmactual resistance to the product applied. Don’t repeat anapplication with a chemical of the same class until you findout the cause of your control failure.
Darren Schreurs (left), of Peter Schreurs & Sons Victoria, with Paul Horne and a box bearing an IPM logo.
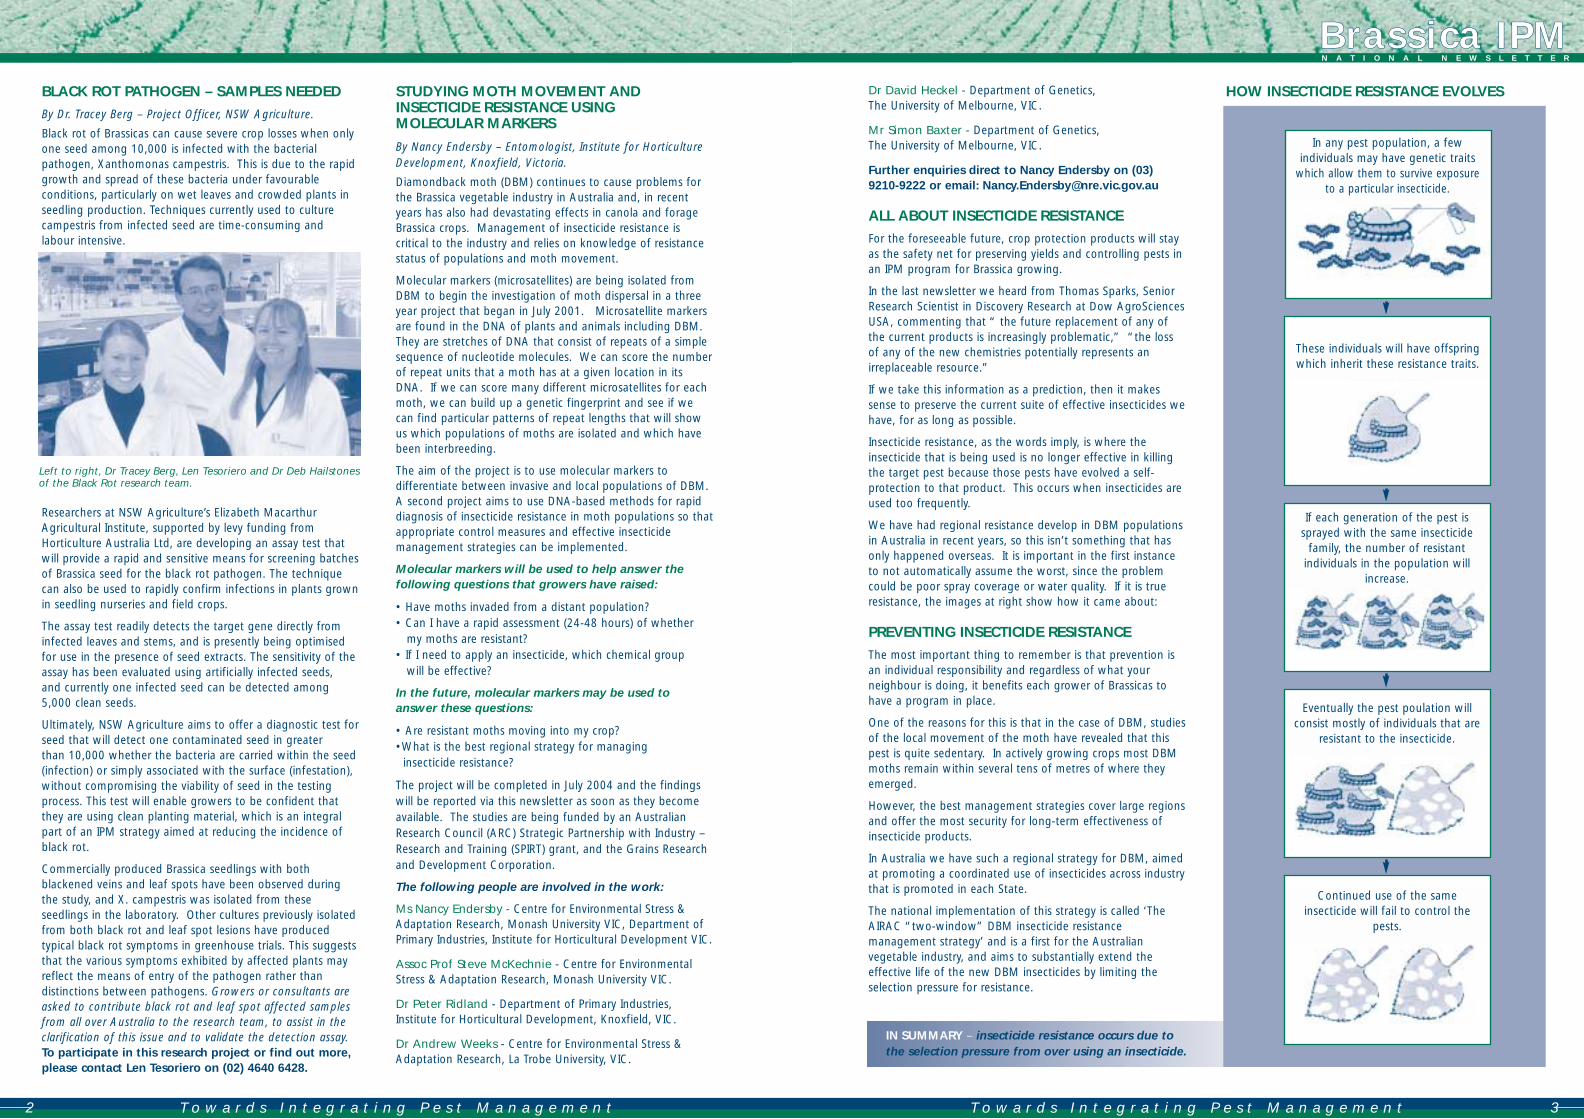
HOW INSECTICIDE RESISTANCE EVOLVES
BBrraassssiiccaa IIPPMMN A T I O N A L N E W S L E T T E R
BLACK ROT PATHOGEN – SAMPLES NEEDED
By Dr. Tracey Berg – Project Officer, NSW Agriculture.
Black rot of Brassicas can cause severe crop losses when onlyone seed among 10,000 is infected with the bacterialpathogen, Xanthomonas campestris. This is due to the rapidgrowth and spread of these bacteria under favourable conditions, particularly on wet leaves and crowded plants inseedling production. Techniques currently used to culturecampestris from infected seed are time-consuming andlabour intensive.
Researchers at NSW Agriculture’s Elizabeth MacarthurAgricultural Institute, supported by levy funding fromHorticulture Australia Ltd, are developing an assay test thatwill provide a rapid and sensitive means for screening batchesof Brassica seed for the black rot pathogen. The techniquecan also be used to rapidly confirm infections in plants grownin seedling nurseries and field crops.
The assay test readily detects the target gene directly frominfected leaves and stems, and is presently being optimised for use in the presence of seed extracts. The sensitivity of theassay has been evaluated using artificially infected seeds, and currently one infected seed can be detected among5,000 clean seeds.
Ultimately, NSW Agriculture aims to offer a diagnostic test forseed that will detect one contaminated seed in greater than 10,000 whether the bacteria are carried within the seed(infection) or simply associated with the surface (infestation),without compromising the viability of seed in the testingprocess. This test will enable growers to be confident thatthey are using clean planting material, which is an integralpart of an IPM strategy aimed at reducing the incidence ofblack rot.
Commercially produced Brassica seedlings with bothblackened veins and leaf spots have been observed duringthe study, and X. campestris was isolated from theseseedlings in the laboratory. Other cultures previously isolatedfrom both black rot and leaf spot lesions have producedtypical black rot symptoms in greenhouse trials. This suggeststhat the various symptoms exhibited by affected plants mayreflect the means of entry of the pathogen rather thandistinctions between pathogens. Growers or consultants areasked to contribute black rot and leaf spot affected samplesfrom all over Australia to the research team, to assist in theclarification of this issue and to validate the detection assay.To participate in this research project or find out more,please contact Len Tesoriero on (02) 4640 6428.
STUDYING MOTH MOVEMENT ANDINSECTICIDE RESISTANCE USING MOLECULAR MARKERS
By Nancy Endersby – Entomologist, Institute for HorticultureDevelopment, Knoxfield, Victoria.
Diamondback moth (DBM) continues to cause problems forthe Brassica vegetable industry in Australia and, in recent years has also had devastating effects in canola and forageBrassica crops. Management of insecticide resistance is critical to the industry and relies on knowledge of resistancestatus of populations and moth movement.
Molecular markers (microsatellites) are being isolated fromDBM to begin the investigation of moth dispersal in a three year project that began in July 2001. Microsatellite markersare found in the DNA of plants and animals including DBM.They are stretches of DNA that consist of repeats of a simplesequence of nucleotide molecules. We can score the numberof repeat units that a moth has at a given location in itsDNA. If we can score many different microsatellites for eachmoth, we can build up a genetic fingerprint and see if wecan find particular patterns of repeat lengths that will showus which populations of moths are isolated and which havebeen interbreeding.
The aim of the project is to use molecular markers todifferentiate between invasive and local populations of DBM.A second project aims to use DNA-based methods for rapiddiagnosis of insecticide resistance in moth populations so thatappropriate control measures and effective insecticidemanagement strategies can be implemented.
Molecular markers will be used to help answer thefollowing questions that growers have raised:
• Have moths invaded from a distant population?• Can I have a rapid assessment (24-48 hours) of whether
my moths are resistant?• If I need to apply an insecticide, which chemical group
will be effective?
In the future, molecular markers may be used toanswer these questions:
• Are resistant moths moving into my crop?•What is the best regional strategy for managing
insecticide resistance?
The project will be completed in July 2004 and the findingswill be reported via this newsletter as soon as they becomeavailable. The studies are being funded by an AustralianResearch Council (ARC) Strategic Partnership with Industry –Research and Training (SPIRT) grant, and the Grains Researchand Development Corporation.
The following people are involved in the work:
Ms Nancy Endersby - Centre for Environmental Stress &Adaptation Research, Monash University VIC, Department of Primary Industries, Institute for Horticultural Development VIC.
Assoc Prof Steve McKechnie - Centre for Environmental Stress & Adaptation Research, Monash University VIC.
Dr Peter Ridland - Department of Primary Industries,Institute for Horticultural Development, Knoxfield, VIC.
Dr Andrew Weeks - Centre for Environmental Stress &Adaptation Research, La Trobe University, VIC.
Dr David Heckel - Department of Genetics, The University of Melbourne, VIC.
Mr Simon Baxter - Department of Genetics, The University of Melbourne, VIC.
Further enquiries direct to Nancy Endersby on (03)9210-9222 or email: [email protected]
ALL ABOUT INSECTICIDE RESISTANCE
For the foreseeable future, crop protection products will stayas the safety net for preserving yields and controlling pests inan IPM program for Brassica growing.
In the last newsletter we heard from Thomas Sparks, SeniorResearch Scientist in Discovery Research at Dow AgroSciencesUSA, commenting that “ the future replacement of any ofthe current products is increasingly problematic,” “the lossof any of the new chemistries potentially represents anirreplaceable resource.”
If we take this information as a prediction, then it makessense to preserve the current suite of effective insecticides wehave, for as long as possible.
Insecticide resistance, as the words imply, is where theinsecticide that is being used is no longer effective in killingthe target pest because those pests have evolved a self-protection to that product. This occurs when insecticides areused too frequently.
We have had regional resistance develop in DBM populationsin Australia in recent years, so this isn’t something that hasonly happened overseas. It is important in the first instanceto not automatically assume the worst, since the problemcould be poor spray coverage or water quality. If it is trueresistance, the images at right show how it came about:
PREVENTING INSECTICIDE RESISTANCE
The most important thing to remember is that prevention isan individual responsibility and regardless of what your neighbour is doing, it benefits each grower of Brassicas tohave a program in place.
One of the reasons for this is that in the case of DBM, studiesof the local movement of the moth have revealed that thispest is quite sedentary. In actively growing crops most DBMmoths remain within several tens of metres of where theyemerged.
However, the best management strategies cover large regionsand offer the most security for long-term effectiveness ofinsecticide products.
In Australia we have such a regional strategy for DBM, aimedat promoting a coordinated use of insecticides across industrythat is promoted in each State.
The national implementation of this strategy is called ‘TheAIRAC “two-window” DBM insecticide resistance management strategy’ and is a first for the Australianvegetable industry, and aims to substantially extend theeffective life of the new DBM insecticides by limiting theselection pressure for resistance.
2 3T o w a r d s I n t e g r a t i n g P e s t M a n a g e m e n tT o w a r d s I n t e g r a t i n g P e s t M a n a g e m e n t
Left to right, Dr Tracey Berg, Len Tesoriero and Dr Deb Hailstonesof the Black Rot research team.
IN SUMMARY – insecticide resistance occurs due to the selection pressure from over using an insecticide.
In any pest population, a fewindividuals may have genetic traits
which allow them to survive exposureto a particular insecticide.
These individuals will have offspringwhich inherit these resistance traits.
If each generation of the pest issprayed with the same insecticide
family, the number of resistantindividuals in the population will
increase.
Eventually the pest poulation willconsist mostly of individuals that are
resistant to the insecticide.
Continued use of the sameinsecticide will fail to control the
pests.

274

275
Growers with Dr Nancy Schellhorn at the March 13 Virginia Workshop
March 2001 DBM WORKSHOP REPORT The Diamondback Moth Workshop held in March at the Virginia Horticulture Centre was a great success. The organisers Dr Nancy Schellhorn, Greg Baker, and Dijana Jevremov from SARDI, and Dr Mike Keller from Adelaide University, would like to thank all participants at the event for their enthusiasm and valuable input. About 32 growers, 3 crop scouts, and 4 chemical representatives came out for a great evening of good food, conversation and presentations. AgVic entomologists Dr Peter Ridland and Nancy Endersby, presented information about DBM management based on their extensive research and scouting experience. The night was very hands-on with displays and microscope viewing of stages of DBM and other pests development on cabbage plants, and a dissection ‘experience’ by Dr Keller showing how parasitic beneficials infest the DBM grubs. The needs of the industry were identified through feedback
during the course of the night. An interest in more work on biological control and crop scouting workshops was expressed. The following questions were put forward by industry: 1. Is it a good idea to mix chemicals? 2. Why are synthetic pyrethroid sprays less effective in summer? 3. Could parasitic wasps be released into Brassica crops to improve biological control? 4. Are there any host plants that are resistant to DBM? 5. Can we tell if DBM come from canola? Are they resistant to certain chemicals? 6. Can we time sprays based on knowledge of DBM movement? 7. What effects do surfactants have on DBM egglaying? 8. Which chemicals are compatible with Bacillus thuringiensis? 9. Can Bacillus thuringiensis performance be improved by mixing with petroleum oils? 10. Is independent information on the new DBM chemicals available? 11. What effect does water quality have on the performance of different pesticides? What is known
about the mode of action of the new DBM chemicals? 12. What is known about the effectiveness of different spray technologies (ie. air bags, ultra low
volume) in Brassica vegetable crops?
Diamondback moth - Integrated Pest Management News May 2001
Horticulture Australia Limited - National Plutella Project
276
Three of the above questions are answered in this newsletter. Answers to the remaining questions will be provided in future issues. The workshop has been followed up by a Field Visit to Steve and John Newman’s property at Virginia, where 13 growers attended to see hands-on scouting techniques for DBM and their beneficial insects. Experiments on biological control of DBM were also viewed and discussed. Stay tuned to this newsletter and your mail boxes for future notice of Workshops and Field Visits we will run.
Workshop Question 1- Is It A Good Idea To Mix Insecticides? Mixing insecticides in the same tank is only an acceptable practice when you are trying to control different types of pests (eg. aphids and grubs). This practice is well-established, time-saving and cost-effective.
Mixing Insecticides to Control a Single Pest
Mixing insecticides in the same tank from different insecticide groups to control a single pest is not a good idea. Although the perception is that mixtures can more effectively control the pest, this practice is not appropriate for the following reasons: 1. It is not cost-effective to try and kill something twice! The kill of the two insecticides together is
no greater than the kill of the better insecticide. 2. Contrary to popular belief, it does not delay the development of further resistance, and in fact is
thought to speed up the development of resistance in such a manner that the DBM become resistant to both chemicals at once.
To assist with resistance management all insecticides are now classified into a specific mode of action group by Avcare. This grouping is listed on the product label. For example, all organophosphates (eg. chlorpyrifos, parathion, methamidophos, etc) are group 1B, all synthetic pyrethroids are 3A. (Refer to the flip side of the attached '2001 Insecticide Resistance Management Strategy' sheet.)
Workshop Question 2 - Why Do Some Insecticide Treatments Seem Less Effective In Summer? Summer conditions can influence the effectiveness of insecticides in a number of ways. Warmer temperatures, UV radiation and overhead irrigation change the speed of the development of pests and the effectiveness of insecticides. 1. Warmer weather speeds the rate of pest development. Insects grow faster in warm weather, and slower in cold weather. At 15°C it takes DBM almost 7 weeks to complete one generation (egg larva pupa adult moth), whereas at 28°C it only takes 2 weeks. So in the 7 weeks that it takes one generation to complete development in winter at 15°C, three and a half generations will have completed development in the summer at 28°C. As a result, DBM population densities increase more rapidly in summer, and this can make insecticides seem less effective. 2. Temperature influences the toxicity of some insecticides.

277
A parasitic wasp injects an egg into a DBM larvae
It has been shown for many synthetic pyrethroids (SPs) that their toxicity to pests declines as temperatures increase. Although this phenomenon has not been tested for DBM, it is conceivable that the field performance of some SPs may be reduced in extreme SA hot summer conditions. For organophosphates the effect of temperature is quite variable, and no clear trend dominates. For carbamates their effectiveness is generally not influenced by temperature. The influence of temperature on the performance of the five new DBM insecticides has not been determined. 3. UV radiation degrades insecticide residues. The UV radiation component of sunlight is an important cause of insecticide degradation. The high intensity UV radiation during the summer will accelerate the breakdown of insecticide residues, thereby reducing the number of days (or hours) the insecticide provides effective control of the target pest. 4. Overhead irrigation Heavy rains and overhead irrigation can wash some pesticide residues off plants and reduce their residual impact. Hence the greater frequency of overhead irrigation in summer may lessen the residual performance of some insecticides. However, the negative effect of overhead irrigation washing off residues is countered by the dislodging and drowning of DBM larvae and pupae. Also, irrigation at dusk is known to disrupt mating and egglaying by female DBM. During mid-summer, it may be worthwhile to spray during the evening hours to avoid the potentially harmful effects of high temperature and UV radiation.
Workshop Question 3 - Continuing Work On Biological Control Of DBM?
What is biological control?
Biological control uses natural enemies (i.e. predators and parasitoids) to suppress pests such as diamondback moth (DBM). The different types of natural enemies suppress pests in different ways. Birds, spiders and insect predators (eg. lady bird beetles) consume the eggs, larvae, pupae or adults of pests. Parasitoids are wasps or flies which parasitise the host ( ie DBM larvae / grubs or pupae / cocoons). The wasp lays its egg in the host, (see image below), and when the wasp egg hatches the wasp larva feeds on and develops in the internal organs of the DBM, eventually killing it. A wasp then emerges from the cocoon instead of a DBM moth.
What are the types of biological control? There are three types of biological control; mass release, classical and conservation. Mass release biological control involves rearing large numbers of natural enemies and releasing them at regular intervals or when sampling indicates a potential pest problem. Classical biological control involves identifying and introducing an exotic natural enemy specific to the
pest. The natural enemies are usually found in the same place (country)the pest originated. Evidence
278
suggests that DBM and the natural enemies that help to control them originated in Europe.
Conservation biological control involves manipulation of the environment to: 1) minimise disturbance by reducing the number of chemical sprays, or conserving areas of habitat where there is little or no disturbance, and 2) enhance the conditions of survival for natural enemies by providing them with additional sources of food and shelter. If ideal conditions can be provided for natural enemies there is a greater likelihood of them remaining on farm and reducing pest populations. How can biological control be used to improve DBM control?
While there are examples where mass release of natural enemies has successfully controlled pests, especially in glasshouses and high value crops, the cost of rearing large numbers of natural enemies usually prohibits the use of this method. This is generally the case for brassica vegetables so releasing wasps into the field is often not an option. Several parasitoids of DBM were introduced and are already established in Australia, and three species are commonly found in the Adelaide plains and hills. These species were shown to be the most effective at controlling DBM and our current research focuses on how to conserve them and increase their effectiveness. This is an example of ‘conservation biological control’ and provides the greatest promise for controlling DBM. Current Research on Biological Control of DBM
As part of the national DBM project, we are conducting research to enhance the effectiveness of the natural enemies of DBM. Insect predators and parasitoids are known to live longer and kill more pests when they have access to food such as nectar. Dr. Mike Keller from the University of Adelaide is identifying the flowering plants that provide the best food source for natural enemies, along with study in parasitism in the field of DBM.
Furthermore, two high school students from the CSIRO student research scheme 2001, worked with us to determine whether DBM moths benefit from flower nectar. The results were promising and showed that the presence of nectar did not increase the number of eggs laid by DBM moths. Although more research is needed, this is the first step to make sure that altering the habitat to benefit natural enemies does not benefit the pests too.
If DBM control by predators and parasitoids is to be adopted by farmers it must be easily adapted into current brassica farming practices. We are aware that ideally the best flowering plants would provide food for natural enemies, be low to the ground, easy to propagate, flower throughout spring and summer and be planted in the alley ways between bays of plants.
In addition to the work on flowering plants we are also researching how to determine the effectiveness of natural enemies found during DBM scouting. This will involve developing a strategy to identify and assess the degree of predation and parasitism in the field. For more information on natural enemies of DBM check the field guide to “Pests, Diseases and Disorders of Vegetable Brassicas.”
What is the Difference Between a Parasitoid and a Parasite? Parasitoids are different from parasites because they 1) kill their host, 2) have an adult stage living freely outside of the host, and 3) attack other insects, whereas parasites attack higher-level organisms such as mammals or fish.)
CROP SCOUTING A major topic presented at the workshop in March was scouting of crops for DBM larvae and beneficials.

279
If you would prefer to engage experienced consultants to scout your crops, we provide below the profiles of two consultant businesses in South Australia for Brassica growers. The principal consultants of each business attended the recent DBM workshop. Pest & Disease Monitoring Services (PDMS) Specialises in the regular monitoring of pest and diseases in horticultural crops. PDMS is managed by John Jeffs who has been working in this field for the past six years. John has a degree in Applied Science - Agriculture, and a Graduate Diploma in Agronomy & Farming Systems. This included post graduate study at The University of Adelaide on the Diamondback Moth, its parasites and insecticides used for its control. More recently, John has been working with SARDI to help determine economic thresholds for DBM and scouting techniques in Brasssicas at Virginia and the Adelaide Hills. John has spent 4 years monitoring pests and diseases for over 50 growers of wine grapes, table grapes, pome fruit, stone fruit, citrus and almonds in the Barossa, Angle Vale, Eden Valley, Adelaide Hills, Riverland, Mildura and Griffith. Contact Details: John Jeffs, Mobile 0409 289 019, Fax. 8289 5531. Cavallaro Horticultural Services Cavallaro Horticultural Services was established over 10 years ago to provide advice and support to the growers of the northern Adelaide plains. The services provided include both scouting for pests and plant and soil nutrition to both greenhouse and broadacre vegetable growers. The principal adviser Domenic Cavallaro, has a blend of over 20 years experience working on a family farm and university studies completed to a postgraduate level overseas. Training in irrigation management, integrated pest management and soil and plant nutrition has been provided to more than 250 growers in small workshop groups by this Service in the past. Contact Details: Domenic Cavallaro, Mobile 0417 839 082. Contact Details: Greg Baker, Senior Entomologist (SARDI) Ph: 08 8303 9544 Nancy Schellhorn, Entomologist (SARDI) Ph: 08 8303 9543 Mike Keller, Senior Lecturer in Entomology (University of Adelaide) Ph: 08 8303 7263 Craig Feutrill, (SA Vege IDO) Ph: 0418 831 089 Dijana Jevremov, IPM Adoption Coordinator (SARDI) Ph: 08 8303 9536.

280
PLUTELLA UPDATE 26 October 2000 No. 46
"Plutella Update" aims to provide up to date information about diamondback moth (Plutella xylostella) activity around Australia plus news of Plutella research trials being undertaken. It is sent out at intervals to interested people (chemical industry, consultants, Agriculture Victoria officers & Brassica growers). I would appreciate some of your news for the "Update". Information for "Plutella Update" can be faxed, posted or E-mailed to Nancy Endersby, Agriculture Victoria, Institute for Horticultural Development, Knoxfield, Private Bag 15, South Eastern Mail Centre VIC 3176, FAX (03) 9800 3521, E-mail: [email protected], PH. (03) 9210 9222.
New HRDC National Plutella Project
Implementing pest management of diamondback moth (DBM) in crucifer vegetables
HRDC has funded a new Plutella project through the AUSVEG levy. The project runs until June 2003. The main project activities will include grower meetings in each state, a national insecticide resistance monitoring program, investigation of movement of DBM between vegetables and other host plants, enhancement of natural enemies of DBM and assessment of innovative control techniques (adulticides, seedling dissemination of biocontrol agents and selection of less susceptible cultivars. Dijana Jevremov (SARDI) has joined the team to work as the project's IPM Adoption Coordinator.
IPM for Brassicas Project (formerly known as Brassicas Research to Practice).
Emily Tee and Anita Chennell work on this project funded by HRDC through the AUSVEG levy. They have been producing workshop materials and working with the National Plutella and Clubroot Projects to present Brassica IPM workshops. They will also collect economic information about Brassica production systems to identify areas for improvement.
Elders workshop, Pakenham, Victoria
Gerome Raco of Elders, Pakenham, hosted a workshop for Brassica growers and chemical companies on 6th October 2000. Members of the national DBM and IPM for Brassicas teams presented a pest and beneficial insect identification session with microscopes and live specimens.
SOUTH AUSTRALIA
Centre grub (Hellula hydralis) was observed in the Adelaide Hills in the last week of September. Plutella eggs were also present in this district at that time.

281
WESTERN AUSTRALIA
DBM moths were present in Manjimup and the 'DBM season' was just beginning two weeks ago. Although pest pressure is not dramatic, Rachel Lancaster of Agriculture Western Australia reports that most growers have commenced spraying for the pest.
VICTORIA
Plutella moths were observed in Cranbourne in the second week of October. Moths and Plutella eggs were abundant on wild radish weeds in Dalmore this week. Crop scouts have been finding Plutella eggs in Werribee South this month.
DBM Insecticide Resistance Management
For NSW, SA, TAS and VIC
We are now in Window 1 of the IRM Strategy (1st Sep – 31st Jan). If DBM control is warranted at this time of year, the insecticides to choose from are any Bacillus thuringiensis products, synthetic pyrethroids and organophosphates registered for DBM. New insecticides that may be used in this window are Secure® and Success®. Regent® and Proclaim® should not be used until the second window (1 Feb – 31 Aug).
A field guide to PESTS, DISEASES and DISORDERS of VEGETABLE BRASSICAS
A full colour, hard wearing 85 page booklet covers everything from pests (with built in scale to size drawings) to beneficial insects, plant diseases, nutritional, genetic, physiological, environmental and chemical disorders. This guide was sent to all Brassica growers around Australia. Others associated with the Brassica industry may wish to purchase a copy at $25.00 per copy + $2.50 GST
Available from:
Crop Health Services Bookshop
Agriculture Victoria
Private Bag 15
Scoresby Business Centre VIC 3176
Please make cheques payable to Department of Natural Resources and Environment or you may request an order form from Nancy Endersby.
FOURTH INTERNATIONAL WORKSHOP ON THE MANAGEMENT OF DIAMONDBACK MOTH AND OTHER CRUCIFER PESTS
282
26th to 29th November 2001
The University of Melbourne, Victoria 3010, Australia
The fourth international DBM workshop will continue the tradition of the first two workshops held in Taiwan and the third workshop held in Malaysia, of bringing together scientists and others involved with the Brassica industry from around the world. Themes of the workshop will focus on revision of progress made in Brassica Integrated Pest Management in the past two decades since the first workshop and will aim to identify the major impediments to its further progress. Emphasis will be placed on innovations in pest management techniques.
For further details, please contact: Fiona Campbell, Conference Management
The University of Melbourne, Victoria 3010, Australia
Email: [email protected],
Telephone: +61 (03) 8344 6389
Facsimile: +61 (03) 8344 6122
Please visit the Workshop web site: http://www.studentadmin.unimelb.edu.au/moth/
Proposed themes of invited papers
Improving the integration of pest management practices: the theoretical and practical challenges
Brassica IPM adoption: progress and constraints
New chemistries: modes of action and effect on beneficial organisms

283
The principles and practice of insecticide resistance management with particular reference to Bacillus thuringiensis
Advances in insecticide application techniques for mechanised and labour-intensive Brassica production systems
Recent innovations with microbial control of DBM
Enhancement of parasitoid performance through selective breeding
Note that there will be no concurrent sessions. Contributed papers and posters may fit into the themes outlined above. Other topics may include host plant resistance, ecology, behaviour of pests and parasitoids, host plant interactions, pheromones and chemical control.
Time for discussion
The last session of each day will be run as a broad discussion led by eminent participants in diamondback moth research and development.
Field Trip
A field trip to an intensive vegetable-growing region close to Melbourne is being planned at the end of the workshop for interested participants.

284
(Refer to National Newsletters 1-3.pdf)

285
APPENDIX N HANDBOOK MODULES

286
secticide Resistance Management Strategy for the Lockyer Valley, Queensland.
2002
This strategy aims to delay the development of resistance to new insecticide groups
For more information on the Qld strategy please contact Bronwyn Walsh or Sue Heisswolf (07) 5466 2222
January Feb March April May June July Aug Sept October Nov Dec
Bt
Production break Production break
Feb 1
Jun 15
Jun 16
Oct 31
SuccessR
RegentR
SPs, OPs, Carb, Endosulfan SPs, OPs, Carb, Endosulfan
SecureR
ProclaimR
AvatarR
Bt
AIRAC is Avcare’s Insecticide Resistance Action Committee
• Regent®, Proclaim ® or Avatar ® may be used from 1 February until 15 June. • Secure® or Success ® may be used from 16 June until 31 October. • Labels of new products place a limit on the number of applications to be used. If further control is required on one
planting, different groups within the same window should be rotated. • It is important to monitor crops regularly. • Do not use mixtures of insecticides for controlling DBM. • Use of the biological insecticide, Bt, in the early stages of crop development is encouraged. • Good crop hygiene, such as use of clean seedlings and the prompt working in of harvested crops, will reduce your
Note: Products from the synthetic pyrethroid, organophosphate, carbamate, and endosulfan groups may be used in either window. However high resistance levels exist in Queensland DBM populations. These groups should be rotated if they are used.
AIRAC Diamondback Moth (DBM)

287
RESISTANCE MANAGEMENT STRATEGY (RMS) for Diamondback moth (DBM) in vegetable brassica crops for Western Australia (Update No. 6, September 2003)
#WHP = withholding period (days) * 3 day WHP for broccoli ** Mavrik is only registered on cauliflowers *** 14 day WHP for broccoli 1. Xentari Bt has an extra active agent compared to all other Bt products currently available; use Xentari as the first Bt option in Window 2. 2. Note that a longer withholding period may be required for some export destinations. Contact the manufacturer for details. 3. Diazinon, situated in Window 2, can be used at anytime for control of onion maggot in south-west crops.
Bt’s (Bacillus thuringiensis): Dipel, Delfin, Biobit, Novosol, MVP & others, Xentari1 # WHP 0
chlorfenapyr (Secure) WHP 7
spinosad (Success) WHP 32 fipronil (Regent) WHP 7
indoxacarb (Avatar) WHP 7
emamectin (Proclaim) WHP 3
SP’s: alpha-cypermethrin (Dominex, Fastac); beta-cyfluthrin (Bulldock*), cypermethrin (Cypermethrin) WHP 1
deltamethrin (Decis); esfenvalerate (Sumi-Alpha); permethrin (eg. Pounce); tau-fluvalinate (Mavrik**) WHP 2
OP - Subgroup 3: mevinphos (Phosdrin) WHP 7
OP - Subgroup 1: maldison (Hy-Mal) WHP 3 methadathion (Supracide) WHP 7 prothiofos (Tokuthion) WHP 7
OP - Subgroup 2: acephate (eg.Orthene, Lancer) WHP 3*** chlorpyrifos (Lorsban) WHP 5 diazinon (Diazinon3) WHP 14 methamidophos (Nitofol, Monitor) WHP 7
Crop stage
Early
Mid- late
Late

288
TO: – ALL BRASSICA GROWERS / CONSULTANTS FROM: - Your Industry Development Officer and The National Diamondback Moth Project. September 2003
IMPORTANT IRM WINDOW STRATEGY REMINDER This is sent to remind you that the new window for Insecticide Resistance Management in Diamondback moth has begun on September 1. We understand in an IPM system we avoid using chemicals except as a last resort. The IRM chart is there to guide the selection if chemicals are necessary, but take note that a Bt is always at the top of the list. The Strategy is developed specifically for Brassica growers around Australia. It aims to delay the development of resistance to the insecticide groups, and therefore maximise the effective life of the various products. Compliance with the strategy is in the best interests of all growers.

289
APPENDIX O SURVEYS

290
IPM WORKSHOP - Evaluation Form LOCATION…FORTH DATE 29TH OCTOBER 03
Thankyou for taking part today. Please take the time to assist us to evaluate the effectiveness of the event by answering these few anonymous questions. Feel free to be as open as you like. 1. Would you recommend this workshop to others? 2. How would you rate the following elements of the workshop; Circle your answer.
1 = excellent 2 = good 3 = could be better 4 = not good Amount of Information given 1 2 3 4 Too Much or Too Little? (circle) The Workshop Organisation 1 2 3 4 Length of time taken 1 2 3 4 Longer or Shorter? (circle) Interest Value 1 2 3 4 Usefulness 1 2 3 4 3. Is there another way besides a workshop, that you would prefer to hear of the information? 4. What improvements (if any) do you think could be made to this workshop? 5. What would you like to hear more about or next? 6. Please circle which you are;- Grower Other

291
SUMMARY OF NATIONAL INFORMATION REQUESTED Compiled May 2002 by Dijana Jevremov
This is a summary of Question 5 of the evaluation sheets used in workshops, or otherwise as stated below for each State. Growers and 'Others' comments are all co-mingled here since the audience for our work is all of them. Question 5 reads:
'What would you like to hear more about or next?'. Sources of Information - 169 forms in total: NSW - evaluation sheets of 3 workshops. Insecticide use seems to dominate QUEENSLAND - survey done by Sue Heisswolf, but no formal evaluations of workshops done. Project Officers assessments recorded SA - evaluation results of 2 workshops, most frequent statements recorded TASMANIA - evaluation results of 2 workshops WESTERN AUSTRALIA - evaluations results of 8 workshops VICTORIA - 1 workshop evaluation Methodology Used For Collating Each States comments were condensed to the most stated ones that were the same or similar in nature. Then these comments were further divided into categories where the 4 headings below suited the comment ranges best. Interpreting the Lists The quantity under each heading reflects the frequency that the subject area was raised as a topic. It is believed that 'Scouting' is not mentioned since most of the evaluations came from workshops where scouting was covered. ------------------------------------------------------------------------------------------------------------------------------ Spraying Better Spraying techniques, and combining foliar sprays Spray strategy tuned to pest mix, & specific areas About chemicals modes of action and performances re beneficials. How new chemicals or techniques fit in the wider IPM system. Bt's more info & re possible resistance Timing of sprays compared to irrigation say morning or evening etc. Spray equipment - volumes, nozzles, cones, fans? Modes of action (? We have a chart of this) of
various chemicals & best conditions and application methods. Beneficials ID of parasitism in grubs Many growers/consultants/resellers have found pest and beneficial insect identification workshops
useful. Beneficials and Predators - their impacts and how to encourage them.
IPM Take IPM to next step Companion Planting and beneficials Effective control of other pests in horticulture ( Fact sheets on aphids & budworm done and will
make into module in handbook). Resistance Resistance & Rotation Moths Movement In Winter.

292
Summary of Albany DBM Workshop Evaluation Held April 2001
7 Respondents Total (6 Growers)
1. Would you recommend this workshop to others?
YES 100% (1 said, "Yes definitely")
2. How would you evaluate the elements of this workshop?
Elements of Workshop
4
2
3
1
5
3
5
4
6
2
0 1 2 3 4 5 6 7
Amount of Information
Organisation
Length of Time
Interest Value
Usefulness
Respondents
ExcellentGoodCould be BetterNot Good
3. Is there another way besides a workshop that you would prefer to hear of the
information? Most respondents also wanted direct mailouts and field visits. 4. What improvements (if any) do you think could be made to this workshop?
Only one respondent (a grower) added anything to this question. He requested that a diseased plant be brought in for identification of the problem and discussion of related problems. 5. What would you like to hear more about or next? No particular subject dominated. The range of comments is below.
Growers: DBM, Getting Higher Prices, Spray Efficacy, Continued Improved Control, Biological Controls, Plant Diseases And Fungi,
Spray Alternatives, Moths Movement In Winter, New Chemicals. Other: Resistance & rotation - why?

293
Summary of Virginia DBM Workshop Evaluations Held March 2002
Kevin Niemeyer & Tony Shelton speaking
22 Respondents Total (13 Growers)
6. Would you recommend this workshop to others? YES 100%
7. How would you evaluate the elements of this workshop?
8. Is there another way besides a workshop that you would prefer to hear of the information? Growers said the following: In field scouting x3, Farmer to farmer talks x1, Newsletter and other mailouts x3. Others said: Email x1, Field trips x2, More frequent workshops x1. 9. What improvements (if any) do you think could be made to this workshop? The following comments were made. Not everyone responded.
Improve supplier industry involvement, (Sales Agronomist said this). Break in the middle to stretch legs x2 Start earlier for more time x1(non-grower) In field demos x1 10. What would you like to hear more about or next?
W o rk s h o p E le m e n ts
0
2
4
6
8
1 0
1 2
1 4
1 6
1 8
Am o u n t o f In fo rm a tio n O rg a n is a tio n L en g th o f T im e In te res t V a lu e U se fu ln es s
Res
pond
ents
N o t G o o dC o u ld b e B e tte rG o o dE xc e llen t

294
5 growers responded to this question.
Wanted more on: Monitoring workshops Real life stories x2. Spray calibrations (agronomist) Update of research results next year More IPM info Holistic - crop mutation, nitrogen/potassium , molasses sprays, other organic approaches. (non-grower)

295
Summary of Longford and Devonport DBM Workshops Evaluation Forms
Held January 2002
20 Respondents Total (8 are Growers) but 27 filled in the contacts sheets with their details.
11. Would you recommend this workshop to others? YES X 100%
12. How would you evaluate the elements of this workshop?
13. Is there another way besides a workshop that you would prefer to hear of the information? Mostly respondents want newsletters or mailouts first x6, then website x3, email x2, then field days x1. 14. What improvements (if any) do you think could be made to this workshop?
Held in Winter to attract more growers x1, field time included x3, more handouts x2, more concise x1, information re the new chemical controls x1. 15. What would you like to hear more about or next?
Not everyone filled this in. The range of comments is below.
Strategies in fodder brassica x1 Bt's more info & re possible resistance x1 Timing of sprays compared to irrigation say morning or evening etc. x1
W O R K S H O P E L E M E N T S
0
2
4
6
8
1 0
1 2
1 4
1 6
1 8
2 0
A m o u n t o fIn fo rm a t io n
O rg a n is a t io n L e n g th o f Tim e In te re s t V a lu e U s e fu ln e s s
RES
PON
DEN
TS
N o t G o o d C o u ld b e B e t te r G o o d E x c e lle n t

296
Local information on DBM programs in Tas. & success failure examples x1 Latest new updates x1 Spray equipment - volumes, nozzles, cores, fans? Modes of action of various chemicals & best conditions and application methods x1.
Research Requests Raised In Discussion Time at the 2 Workshops
Two Window Strategy - Appropriate dates for Tasmania
• For seed growers - 'Regent' not in the flowering period. Not in the first window. • First window to be from Spring to February 14 • Need a chemical in the second window that has a short withholding period • Which chemicals to use that can be grazed after harvest Devonport • Weeds - Brassica weeds management research needed. Serv Ag is running a project. • Information regarding relationship between what is being caught in pheromone traps and
infestations levels. • Effectiveness of Bts in Tasmania. Longford • Water volumes for spray application • Feeding additives • Updating information on the website • Publicise the website.

297
Plutella Management Workshop
Hosted by Elders VP (cnr Koo Wee Rup Road & Livestock Way, Pakenham, Victoria) 9: 30 am, Friday 6th October 2000
Session 1 presented by the two projects funded by HRDC through the AUSVEG levy, 'Implementing Pest
management for DBM' and 'IPM for Brassicas (RtP)' Presenters: Nancy Endersby, Peter Ridland, Emily Tee and Anita Chennell Attendees: Bill Marous and Mark Milligan (A&G Lamattina), Robert Talbot (RJ-KA Talbot), David Fisher (D.G.
Fisher Market Gardens), Geoff Raymond (BASF), David Richards (DuPont), Ian Cass (Dow AgroSciences), Stuart McLaverty (Aventis), Gerome Raco and Brian Brewer (Elders, Pakenham)
Aims 1. To enable growers to understand the biology of diamondback moth and to undertake more effective crop
scouting. This should lead to better control of this pest by improving the growers' timing of insecticide applications and their choice of control methods.
2. To pilot the use of crop monitoring materials prepared by the IPM for Brassicas Project including the sequential sampling chart (developed by Jianhua Mo) used to promote presence/ absence sampling and 15% infested plant threshold to the growers
3. To pilot other workshop activities including ballot box tests, life cycle diagram construction and dissection of larvae to check for parasitism
PROGRAM 10: 00 am 1. Introduction to the two projects presenting the workshop, the presenters and the workshop structure 2. Ballot box pre-test (15 min): How much do the participants know about pest and beneficial insects, crop monitoring and insecticide resistance? 3. Session 1 - Information session about diamondback moth (DBM)
• Biology (host plants, life cycle, temperature-development) Life cycle activity - After discussion of the DBM life cycle, each participant was given a laminated colour photograph of one life stage of DBM (egg, larva (I), (II), (III), (IV), prepupa, pupa, moth). The photographs had velcro on the back and the participants were asked to put the life cycle together in the correct order on a display board. Yellow arrows were used to link each stage.
• Insecticide resistance development (cartoon sequence was explained and put up on the display board) Results of resistance monitoring studies of Australian DBM populations
• Insecticide Resistance Management 11:00 am Morning Tea
• Integrated Pest Management (IPM) • Crop monitoring and the benefits of employing professional crop scouts (Used workshop materials
prepared by IPM for Brassicas project, including crop scouting chart). Crop monitoring activity: Each participant was given some crop monitoring data (a 40 plant sample with a number of plants infested with DBM larvae) collected from a range of Brassica crops last season. Participants used the data to simulate a crop monitoring session and used the sequential sampling chart to decide whether they would have to spray or not.
4. Session 2: Workshop session with microscopes
Identification of pest and beneficial insects found in Brassica crops (microscopes, live and dead insect specimens and photographs for the growers to work with).
Diadegma activity: Potentially parasitised larvae (IV instar) were brought from our laboratory colony. Each participant was given a larva and was shown how to pull it apart to check for parasitism by Diadegma. In many cases the wasp larva could be seen moving and the participants could look at it under the microscope.
5. Ballot box post test – Same questions as for the pre-test. Workshop Evaluation Form 1:00 pm Lunch 6. Presentation of ballot box test results 7. Session 3: Chemical company presentations

298
Ballot boxes were placed around the room. A multiple-choice question and ballot paper accompanied each box. Some questions related to a photograph and live specimen of an insect. Participants circled their choice of answer, put an identifying mark on their ballot paper and put it into the box. The same questions were used for both the pre-test and the post test. Results and correct answers were presented at the end of the workshop.
Ballot Box Test – Questions and Answers
1. What is this? (Answer = C) A. Plutella (DBM) egg B. Plutella (DBM) pupa C. Diadegma wasp cocoon D. Spider web 2. What is this insect? (Answer = A) A. Diadegma wasp B. Plutella (Diamondback Moth) C. Fly D. Winged aphid 3. What is this insect? (Answer = C) A. Helicoverpa (heliothis) caterpillar B. Maggot C. Plutella (DBM) larva (caterpillar) D. Cabbage white butterfly larva 4. What is the correct sequence of the DBM life
cycle? (Answer = B) A. Egg, pupa, larva, moth B. Moth, egg, larva, pupa C. Moth, pupa, egg, larva D. Larva, pupa, egg, moth
5. Insecticide resistance in DBM is caused by (Answer = D) A. Less active formulations of insecticide being
produced B. Pests not being sprayed enough C. Poor spray coverage D. Selection of resistant individuals by frequent use
of insecticides 6. How can development of insecticide resistance be slowed down? (Answer = D)
A. B. Avoid tank mixtures of more than one insecticide C. Use different chemical groups in rotation D. Use insecticides only when necessary All of the above 7. DBM pheromone traps may be used to: (Answer = A) A. Monitor build up in numbers of male moths B. Attract and kill female moths
C. Predict when to spray the crop D. Trap heliothis moths 8. The most accurate method of crop monitoring is to: (Answer = D) A. Concentrate on checking many plants in one
corner of the crop B. Check edge plants only C. Look for damaged plants and check them D. Check many plants throughout one planting

299
Ballot Box Test - Results Question Correct – pre-test (10
participants) % Correct – post-test (9 participants) %
% Change
1 10 0 - 10 2 90 100 + 10 3 70 100 + 30 4 80 100 + 20 5 90 72 - 18 6 90 100 + 10 7 65 72 + 7 8 95 89 - 6
CONCLUSIONS Participants still had difficulty distinguishing between Plutella pupae and Diadegma cocoons after the workshop. We suggested that they collect pupae, try to separate them and then rear them out. All participants were able to identify Plutella larvae and Diadegma wasps after the workshop and they all knew the sequence of the DBM lifecycle. Some participants remained unsure about the process of development of insecticide resistance, but could identify ways to slow down development of resistance. There was a small improvement in the participants' understanding of use of pheromone traps. Most participants knew that sampling throughout the crop and not just in one corner or at edges achieves accurate crop scouting.

300
Summary of Workshop Evaluation 16. Would you recommend this workshop to others?
YES 100% (1 said, "Yes, most definitely")
17. How would you evaluate the elements of this workshop?
18. Is there another way besides a workshop that you would prefer to hear of
the information?
Grower: Updates on new information resulting from research Other: CD – PowerPoint presentation Other: In field during the season Other: No Other: CD ROM, software
19. What improvements (if any) do you think could be made to this workshop?
Grower: None needed Grower: Field trips Other: A bit more information and pictures about the other caterpillar pests CWB, heliothis, Spodoptera eggs, larvae and adults Other: Economic information, spray application – coverage Other: See more people (growers) attending (not your fault really, but I
thought I would say it anyway). Other: Very effective in small groups Other: Other pests other than DBM added to the workshop
20. What would you like to hear more about or next?
Grower: Lettuce/Celery Grower: Other vegetables Grower: Lettuce and celery problems Other: Helicoverpa spp. management Other: Take IPM to next step Other: Effective control of other pests in horticulture
0 1 2 3 4 5 6 7 8 9
Amount of informationgiven
Workshop organization
Length of time taken
Interest value
Usefulness
Number of respondents
excellent good could be better not good

301
SARDI
MEDIA RELEASE
27 November 2001
SHOW SURVEY - GOOD NEWS FOR FARMERS
The results of a consumer survey conducted by the South Australian
Research and Development Institute (SARDI) at this year's Royal Agricultural
and Horticultural Show has shown encouraging news for the State's vegetable
farmers wanting to implement better pest control on their farms.
SARDI Integrated Pest Management Adoption Coordinator Dijana Jevremov
said growers are keen to reduce insecticide use, but the obstacle is the buyer
and consumer expectation for undamaged and uncontaminated produce.
"We wanted to identify the current public opinion on the subject and saw the
Royal Agricultural and Horticultural Show as an ideal place to capture a broad
section of the mainstream buying public. The results were very pleasing and
surprising" Dijana said.
747 people of all ages filled in the survey forms over the nine days. The
results identified that 56% of people have, or do, find damage or an insect in
their broccoli, cabbage and cauliflower, and the majority of them have little or
no negative reaction to these findings. Most interesting is that at least 90% of
people are prepared to accept finding an occasional insect if it means less
chemicals are used in the growing.
"This is valuable and empowering information for growers, buyers and
wholesalers alike" Dijana said.
With an integrated approach to pest management, such as the timing of
planting, crop scouting, and using insecticides that target only the pest while
conserving beneficial insects, it is possible to reduce the number of sprays
needed to give good control of pests. The sole reliance on chemicals as a
solution to pests is not a long-term answer for horticultural crops.

302
"The problem is that growers are uneasy about changing current practices
because of fear it may mean unacceptable damage and contamination until
new strategies are established", she said.
This survey shows that the informed consumer is willing to be an ally towards
positive change. For further enquiries please call:
Dijana Jevremov, Integrated Pest Management Adoption Coordinator on 0438 466
511 Oksana Dniprowyi, SARDI Communications Officer on 8303 9433 or 0401 122 128

303
SARDI Vegetables Survey Hello SARDI's Entomology Unit is involved in a pest management project in vegetables and we would like to get your thoughts on finding an insect in broccoli, cauliflowers and cabbages. Please take the time to answer these 6 anonymous questions. 1. Do you cook or eat fresh broccoli, cauliflower or cabbage at home?
(circle one)
Yes No (thankyou, there is no need to continue) 2. Please circle your age group. Up to 15…………15-25……….26-40……….41-64……….65 or over.
3. Have you ever found an insect or other creature in the broccoli, cauliflower or cabbage that you have bought?
(circle one) Yes No Not sure
4. Have a look at the vegetables and /or photos on display here. If you found the same things in your purchased vegetables, how would it affect you?
(circle one)
Not at all…..………A Little………..…….A Lot.
Why?
5. What would you do about finding insects in your vegetables? 6. Some insects and other creatures are beneficial to farmers in controlling their pests and may mean a grower can use less chemical sprays. Would you be prepared to find an occasional insect if it meant that less chemicals had been used?
(circle one)
Yes No Maybe
Thankyou very much!

304
Report of the Royal Adelaide Show Community Survey 2001 The survey was conducted from Friday August 31st till Saturday September 8th 2001 (9 days). The survey display consisted of a large plinth with a plastic container of contaminated broccoli in ice on top. There was a tray of survey forms and pens in front of large photos of damaged Brassica. The stand was often not attended by staff, so many people filled in forms unprompted. Number of respondents overall was 747.
o Approximately 398 filled in survey forms during Monday to Friday. o Approximately 349 filled in survey forms during Saturday and Sunday. The
emptying of the survey box did cross over days so complete accuracy is not possible.
o 200 of the forms were analysed in full, 100 from each of the weekdays and weekend groups. This was to capture the different demographic groups that it was expected would attend at the two different times of the week.
o For question 6 of the survey, total responses were analysed. The graphed results for five of the six questions are recorded below. Question 1 is not reported because only those that answered ‘Yes’ to the question were included in the survey.

305
Q2. Please circle your age group
0 10 2 0 3 0 4 0 5 0
N o r e sp o n s e
Up t o 1 5
1 5 -2 5
2 6 -4 0
4 1 -6 4
> 6 5
%
Q3. Have you ever found an insect or other creature in the broccoli, cauliflower or cabbage that you have bought?
Q3
0 10 20 30 40 50 60
No response
Yes
No
Not sure
%
Q4. Have a look at the vegetables and/or photos on display here. If you found the same things in your purchased vegetables, how would it affect you?
Affect by Age
0
20
40
60
Up to15
15-25 26-40 41-64 >65
% R
espo
nden
ts
A lotA littleNot at all

306
Q4. Why?
0 1 0 2 0 3 0 4 0
G ro w o wn
N u m b e rs de p e n d a n t
W a s te o f ve g
D e p e n ds o n id e n t ity o f
N o t h e a l th y ve g
L e s s c h e m i c a ls
Ha r m le s s
Lo o k s b a d
Fe a r o f e a t i ng th e m
No r e s p on s e
% Re sp on d e nt s
Q5. What would you do about finding insects in your vegetables?
0 10 20 30 40 50
O ther
R eturn to s hop
Tel l groc er
R eport
Do not hing
N o res pons e
Dis card veg
W as h off
R em ove
% R esp o n de n ts
Q6. Some insects and other creatures are beneficial to farmers in controlling their pests and may mean a grower can use less chemical sprays. Would you be prepared to find an occasional insect if it meant that less chemicals had been used?
0
25
50
75
100
Up to15
15-25 26-40 41-64 >65
Age
% R
espo
nden
ts
YesNoMaybe

307
Summary of results:
• The majority of respondents were aged 26-64.• 56% of people have/do find an insect in their cauliflower,
broccoli and cabbages.• 74% are effected either a little or not at all by finding
them.• At least 90% of people aged 26 and over are prepared to
accept finding an occasional insect if it means less chemicals are used in the growing.
• Every age group shows a strong willingness to accept finding an insect to reduce chemical use.