
ImplementationofaProbabilisticStructuralHealthMonitoring...
10
Hindawi Publishing Corporation Advances in Civil Engineering Volume 2012, Article ID 307515, 9 pages doi:10.1155/2012/307515 Research Article Implementation of a Probabilistic Structural Health Monitoring Method on a Highway Bridge Adam Scianna, Zhaoshuo Jiang, Richard Christenson, and John DeWolf Department of Civil and Environmental Engineering, University of Connecticut, Storrs, Connecticut 06269-2037, USA Correspondence should be addressed to Richard Christenson, [email protected] Received 30 June 2011; Revised 25 October 2011; Accepted 29 December 2011 Academic Editor: Piervincenzo Rizzo Copyright © 2012 Adam Scianna et al. This is an open access article distributed under the Creative Commons Attribution License, which permits unrestricted use, distribution, and reproduction in any medium, provided the original work is properly cited. This paper describes the application of a probabilistic structural health monitoring (SHM) method to detect global damage in a highway bridge in Connecticut. The proposed method accounts for the variability associated with environmental and operational conditions. The bridge is a curved three-span steel dual-box girder bridge located in Hartford, Connecticut. The bridge, monitored since Fall 2001, experienced a period of settling in the Winter of 2002-2003. While this change was not associated with structural damage, it was observed in a permanent rotation of the bridge superstructure. Three damage measures are identified in this study: the value of fundamental natural frequency determined from peak picking of autospectral density functions of the bridge acceleration measurements; the magnitude of the peak acceleration measured during a truck crossing; the magnitude of the tilt measured at 10-minute intervals. These damage measures, including thermal effects, are shown to be random variables and associated P values are calculated to determine if the current probability distributions are the same as the distributions of the baseline bridge data from 2001. Historical data measured during the settling of the bridge is used to verify the performance of the bridge, and the field implementation of the proposed method is described. 1. Introduction Structural health monitoring (SHM) is a general term used in many engineering disciplines that describes a process to determine the integrity of a structure. There have been num- erous techniques developed to ascertain the integrity of a structure including methods of visualization, nondestructive evaluation (NDE) as well as indentifying changes in vibration characteristics. All of these methods have a common goal to detect, locate, and quantify varying degrees of deterioration and damage within a structure. Visual inspection and NDE are common methods of health monitoring. Visual inspection, however, is neither ob- jective nor reliable, containing great uncertainty in identify- ing the existence, location, and degree of damage [1–3]. Ad- ditionally, visual inspection supplies information only at the time of inspection. Realistic SHM should supply information on a continuous basis if it is to be of real use. New technolo- gies for the NDE of civil structures include ultrasonic testing, penetrant testing, visual testing (different than visual inspec- tion), magnetic particle testing, radiographic testing, acous- tic emission, and eddy current testing [4, 5]. These technolo- gies determine local damage and typically require the general region of damage on the structure to be first identified. For many structures, locating the damage prior to inspection is difficult. Using vibration measurements is a less subjective method for structural health monitoring that can allow for global as well as local evaluation. As such, vibration-based techniques are receiving much recent attention [6–14]. Employing methods that rely on ambient vibration or operational loads are challenging as these excitations tend to excite the lower frequency global modes that can be insensitive to local dam- age [15]. Furthermore, environmental and operational varia- bility of civil structures can affect the natural frequencies and mode shapes, rendering SHM methods that rely on chan- ges in these parameters ineffective except in the presence of extreme damage [16]. Despite these challenges, using vibra- tion measurements for SHM has continued to receive the at- tention of researchers and is the focus of this study.
Transcript of ImplementationofaProbabilisticStructuralHealthMonitoring...
Hindawi Publishing CorporationAdvances in Civil EngineeringVolume 2012, Article ID 307515, 9 pagesdoi:10.1155/2012/307515
Research Article
Implementation of a Probabilistic Structural Health MonitoringMethod on a Highway Bridge
Adam Scianna, Zhaoshuo Jiang, Richard Christenson, and John DeWolf
Department of Civil and Environmental Engineering, University of Connecticut, Storrs, Connecticut 06269-2037, USA
Correspondence should be addressed to Richard Christenson, [email protected]
Received 30 June 2011; Revised 25 October 2011; Accepted 29 December 2011
Academic Editor: Piervincenzo Rizzo
Copyright © 2012 Adam Scianna et al. This is an open access article distributed under the Creative Commons Attribution License,which permits unrestricted use, distribution, and reproduction in any medium, provided the original work is properly cited.
This paper describes the application of a probabilistic structural health monitoring (SHM) method to detect global damage in ahighway bridge in Connecticut. The proposed method accounts for the variability associated with environmental and operationalconditions. The bridge is a curved three-span steel dual-box girder bridge located in Hartford, Connecticut. The bridge, monitoredsince Fall 2001, experienced a period of settling in the Winter of 2002-2003. While this change was not associated with structuraldamage, it was observed in a permanent rotation of the bridge superstructure. Three damage measures are identified in thisstudy: the value of fundamental natural frequency determined from peak picking of autospectral density functions of the bridgeacceleration measurements; the magnitude of the peak acceleration measured during a truck crossing; the magnitude of the tiltmeasured at 10-minute intervals. These damage measures, including thermal effects, are shown to be random variables andassociated P values are calculated to determine if the current probability distributions are the same as the distributions of thebaseline bridge data from 2001. Historical data measured during the settling of the bridge is used to verify the performance of thebridge, and the field implementation of the proposed method is described.
1. Introduction
Structural health monitoring (SHM) is a general term usedin many engineering disciplines that describes a process todetermine the integrity of a structure. There have been num-erous techniques developed to ascertain the integrity of astructure including methods of visualization, nondestructiveevaluation (NDE) as well as indentifying changes in vibrationcharacteristics. All of these methods have a common goal todetect, locate, and quantify varying degrees of deteriorationand damage within a structure.
Visual inspection and NDE are common methods ofhealth monitoring. Visual inspection, however, is neither ob-jective nor reliable, containing great uncertainty in identify-ing the existence, location, and degree of damage [1–3]. Ad-ditionally, visual inspection supplies information only at thetime of inspection. Realistic SHM should supply informationon a continuous basis if it is to be of real use. New technolo-gies for the NDE of civil structures include ultrasonic testing,penetrant testing, visual testing (different than visual inspec-
tion), magnetic particle testing, radiographic testing, acous-tic emission, and eddy current testing [4, 5]. These technolo-gies determine local damage and typically require the generalregion of damage on the structure to be first identified. Formany structures, locating the damage prior to inspection isdifficult.
Using vibration measurements is a less subjective methodfor structural health monitoring that can allow for global aswell as local evaluation. As such, vibration-based techniquesare receiving much recent attention [6–14]. Employingmethods that rely on ambient vibration or operational loadsare challenging as these excitations tend to excite the lowerfrequency global modes that can be insensitive to local dam-age [15]. Furthermore, environmental and operational varia-bility of civil structures can affect the natural frequencies andmode shapes, rendering SHM methods that rely on chan-ges in these parameters ineffective except in the presence ofextreme damage [16]. Despite these challenges, using vibra-tion measurements for SHM has continued to receive the at-tention of researchers and is the focus of this study.

2 Advances in Civil Engineering
Bridge health monitoring (BHM), a type of SHM appliedspecifically to bridges, has been applied in Connecticut since1984, when the University of Connecticut and the Con-necticut Department of Transportation began evaluating thestructural conditions of bridges in the state [17–19]. Sincethat time there have been various temporary sensor installa-tions that have helped determine in-service behavior and jus-tify rehabilitation and repair plans [19]. The portable moni-toring system applications have provided benefits in the formof fewer or no repairs totaling over $2.5 M and have identifiednecessary repairs increasing safety. A long-term continuousbridge monitoring program has been in place since 1997,when permanent monitoring systems were installed on avariety of bridge types across Connecticut. The objective ofthe continuous monitoring is to identify global changes in abridge’s behavior over multiple years [17]. The bridge exam-ined in this study is part of the long-term continuous BHMprogram in Connecticut.
Prior work conducted at the University of Connecticutstudied the effects of damage on the dynamic properties of abridge and the effects of temperature variation on these mea-surements. This previous work indicates that monitoring thebridge’s modal information as well as peak values can providea global measure of the bridge’s structural integrity and iden-tify major changes in the structural integrity [20]. In addi-tion, tiltmeters are employed to measure the general orienta-tion of the bridge as a measure of its health in terms of stru-ctural changes. The effect of temperature on modal informa-tion and tilt measurements have been identified and quanti-fied in Liu and DeWolf [21] and Olund [22].
While the tools for statistical analysis are numerous andwell established, there has been limited research applyingthese methods to BHM [12]. A statistical pattern recognitionparadigm was proposed by Rytter [23]. More recently, Zhang[24] showed that by selecting a damage feature, characterizedas a random variable with a normal distribution, a probabil-ity of damage could be determined by comparing a feature ofan unknown condition to that of a known condition. Olundand DeWolf [20] established the basis for BHM in Connecti-cut showing a statistical approach that can be very robustwith respect to environmental and operational variability.
This paper extends the statistical BHM approach ofOlund and DeWolf [20] to examine the vibration characteri-stics and tilt of an actual highway bridge in Connecticut veri-fying the proposed approach using historical data collectedover a period that included a permanent rotation in the bri-dge deck. This paper goes on to describe the implementationof a fully automated BHM system on an in-service highwaybridge in Connecticut.
2. Bridge and Monitoring System Description
The bridge selected for this study, part of the long-term con-tinuous BHM program in Connecticut, is referred to as theHartford Flyover Bridge. This bridge connects I-84 east to I-91 north in Hartford, CT, USA. Figure 1 shows an aerial viewof the Hartford Flyover Bridge.
The structure is comprised of two steel box girders with acomposite concrete deck. The bridge in its entirety is nine
Hartford Flyover Bridge
N
I-91
I-84
Figure 1: Aerial view of the Hartford Flyover Bridge.
spans consisting of three sets of three continuous spanswhich are simply supported. Previous studies have identifiedthe fundamental natural frequency of the continuous bri-dge span being monitored being equal to approximately1.52 Hz [22]. The monitoring system’s 22 sensors include 8accelerometers, 8 temperature transducers and 6 tiltmeters.Figure 2 shows the location of the various sensors on thebridge. All sensors are located in or on the box girder of themiddle continuous three span segment. This is the portionof the bridge with the longer columns. The sensors were dis-tributed to capture the behavior of this segment of the bridgein order to determine the cause of cracking in the supportingcolumns observed during the biannual visual inspection. Thetiltmeters and accelerometers are located along the length ofthe bridge while all the temperature transducers are locatedat the midspan cross-section of span 4.
The accelerometers are PCB Piezotronics Model 393Cquartz accelerometers with a measurement range of ± 2.5 gand a frequency range of 0.025–800 Hz. Six of the accelerom-eters measure vertical accelerations and two measure hor-izontal accelerations. These are labeled as AV# and AH#,respectively, in Figure 2. The acceleration measurementsare dynamic measurements collected at a sampling rate of90.91 Hz for a duration of 30 seconds when a truck travelsover the bridge and triggers sensor AV2 to exceed the pre-scribed 0.0095 g threshold. The data acquisition system usedto collect data during 2002-2003 period employs a 2-poleanalog low-pass filter with a cut-off frequency of 2 Hz. Assuch, the monitoring system is able to capture the frequencycontent of only the fundamental mode without distortion.The current upgraded system provides a bandwidth up to500 Hz. A comparison of the autospectral density functionmeasured from AV1 measured with the original and up-graded systems in shown in Figure 3. Both measurementsshow the fundamental natural frequency at 1.52 Hz as wellas higher frequencies above 2 Hz. It is observed that highermodes are excited by the crossing truck traffic and highermodes can be used in current studies.
Tiltmeters 1, 2, 4, 5, and 6, applied geomechanics model801-S ± 3 degrees, are located at the piers while tiltmeter 3is located at midspan of Span 4, collocated with the array of

Advances in Civil Engineering 3
SPAN 4
Span 5
SPAN measured along BL
T2
T3
T4
T5
A
A
AV1
AV5
AV2, AH3
AV4
AV7
AV8
AH6
TiltmeterAccelerometer
Temperature sensors
All temperature sensors located at
section A-A, see Figure 4 for details
TUB 1
TUB 2
B L
T1 at PIER 2
T6 at PIER 6
C PIER 4
C PIER 5
L
L
C PIER 3L
N
R57.7 m
57.7 m
R139.2 m
53.8 m
+ −
+ −
+ −
+ −
Figure 2: Sensor locations for the Hartford Flyover Bridge.
−260
−240
−220
−200
−180
−160
−140
−120
−100
−80
PSD
(g2
)
0 5 10 15 20 25 30 35 40
Fequency (Hz)
Data from updated systemData from original system
Figure 3: Autospectral density function of AV1 (vertical dashed lineat fundamental natural frequency, 1.52 Hz).
temperature sensors. Tilt measurements are collected at re-gular ten-minute intervals.
The temperature transducers are RdF model 29258 RTDcapsules for measuring ambient and inside deck tempera-tures. RdF surface flange mount model 22802 are used formeasuring surface temperatures. The transducers provide
temperature measurements with a 0.041◦C (0.074◦F) resolu-tion. Of the eight temperature transducers, two measure theconcrete deck temperature, four measure the temperaturein the steel tub corners, and the other two record ambienttemperature both inside and outside the tub. These transduc-ers were originally placed in this configuration to study theeffects of a temperature differential on tilt in the cross-sectionof a steel girder bridge with a composite concrete deck [25].The temperature detector locations are identified in Figure 4.Temperature measurements are also collected at regular tenminute intervals corresponding to the tilt measurements.The eight temperature measurements are closely correlatedand as such only the measurement of the first temperaturesensor, R1, is employed in this study.
3. Probabilistic Structural HealthMonitoring Method
To address the challenges of environmental and operationalvariability, including unknown traffic excitation, inherentvariability of the excitation, measurement error, and uncer-tainty in the structure itself, a probabilistic framework isadopted. In this probabilistic method damage measures(DMs) corresponding to the structural health of the bridgeare determined from the structure’s dynamic response and

4 Advances in Civil Engineering
+ −
B L
Varies
1842 mm 914 mm 2438 mm 2743 mm
1949 mm
432 mm 432 mm1829 mm
2007 mm
R1
R3R2 R7
R8
R4
R5
R6
Cross-bracing not shown for clarity
T3
Tilt
(+)Counter clockwise
Clockwise
Tiltmeter
Temperature sensor
(−)
Figure 4: Cross-section of the Hartford Flyover Bridge with temperature sensor layout.
rotation of the bridge deck. The basis for this method is thata baseline damage measure (DMB) can first be determined.At subsequent times, the current damage measure (DMC)can be determined and compared to the baseline case. Forthis study the DMs used are: (i) the estimated fundamentalnatural frequency of the bridge, calculated as the firstpeak of the power spectral density function (PSD) of theacceleration; (ii) the peak acceleration resulting from a truckcrossing over the bridge; (iii) the 10-minute tilt measure-ments of the bridge. Although almost any damage measureproposed in the literature can be used, these three benchmarkparameters were chosen because of prior experience in BHMin Connecticut [18].
The DMs, calculated from measured responses forvarying traffic loading, are observed from the approximatestraight lines in the normal probability plots to be randomvariables with a Gaussian distribution. As random variables,not just one realization of the baseline DM is calculated,but a set of n baseline DMs are determined. The mean andvariance of an original set of data for the baseline structure isdetermined so that the probability density function of DMB
is known. At each current time, n new DMs are calculatedand the mean and variance are determined as before so thatthe probability density function of DMC is now known. Thebasis for this method is then to compare the distributionof a current DM to the baseline DM to determine if thereis a change in the underlying distribution, thus indicating apotential change in the structure and possible damage.
3.1. Statistical Test. In previous analytical work, a normaldifference method was used to compare the distribution ofDMC to the DMB [26]. This was appropriate because the
number of samples in each distribution was set equal to eachother. For the actual implementation, the sample sizes ofeach distribution are likely to be different due to the actualvarying truck volumes over specific time periods. It is alsoassumed that the variance of the two samples is unequal.With these considerations, Welch’s t-test is used to comparedistributions [27]. Welch’s t-test defines the statistic t as:
t = XH − XC
sXH−XC
, (1)
where
sXH−XC=√
s2H
nH+
s2C
nC(2)
XH and XC , s2H and s2
C , and nH and nC are the mean, vari-ance, and sample size, respectively, of the healthy and currentdistributions. The degrees of freedom v is approximatedusing the Welch-Satterthwaite equation:
v =((s2H/nH
)+(s2C/nC
))2(s4H/N
2H(NH − 1)
)+(s4C/N2
c (Nc − 1)) . (3)
The t-distribution can be used to test the null hypothesisthat the two DM means are equal at a certain significancelevel. If the current t-statistic is smaller in absolute value thanthe critical t-value for a particular level of significance, thenull hypothesis is rejected; this indicates a statistically signif-icant change in the mean and potential for damage in thestructure. If the current t-statistic is greater in absolute valuethan the critical t-value for a particular level of significance,the null hypothesis cannot be rejected; this indicates no
Advances in Civil Engineering 5
statistically significant change in the mean and that the struc-tural integrity of the current scenario should be assumed thesame as the structural integrity of the baseline scenario.
To provide further insight into the statistical test the Pvalues instead of a general “pass” or “fail” result are observed.The P value is the probability of observing an event at leastas extreme as the one actually observed, given that the nullhypothesis is true. The P value for a two-tailed Welch’s t-testcan be calculated as:
P = 2[1−Φ(t)]. (4)
Generally one rejects the null hypothesis when the P value issmaller than or equal to the significance level.
3.2. Thermal Effects. To account for thermal effects on thedamage measures, each DM is paired with an associatedtemperature. Since tilt and temperature data are collectedsimultaneously, this data is already paired. The accelerationdata is paired with the temperature record that has a time-stamp closest to that of the acceleration data. The paireddata sets are distributed into temperature bins. For tiltdata, the temperature bins have a range of 0.056◦C (0.1◦F)and for the acceleration data the temperature bins have arange of 0.56◦C (1.0◦F). A smaller bin is used for tilt databecause it is more dependent on temperature than the accele-ration-based DMs. When the probabilistic SHM method isapplied the distribution of the DM from each temperaturebin of the baseline year is compared to that of the same tem-perature bin for the current year. A temperature dependantP value, PT1<T<T2 , is determined. The associated temperaturedependant P values are averaged over all of the temperaturebins such that:
P = 1N
N∑n=1
pΔT·(n−1)<T<ΔT·n, (5)
where P is the average P value for all temperatures, N isthe number of temperature bins, and ΔT is the size of thetemperature bin. The P value is then compared to a pre-scribed significance level to determine if the null hypothesis,that the means are equal, can be rejected.
4. Verification of the Probabilistic SHMMethod Using Historical Data
To verify the proposed method, actual bridge data is used.The baseline data from September 2001–August 2002, whenmonitoring of this bridge began, is compared to the most re-cent 10-month data set, from September 2003–August 2004.It should be noted that during each of these years data wasonly collected 10 months out of each year due to ongoing sys-tem maintenance. While bridge inspections over this three-year time period verify that there is no structural damage tothe bridge, the bridge did experience a permanent rotationbetween September 2002 and August 2003. Additionally, anaccelerometer sensor was observed to not function properlyduring this period. Both events provided the opportunity forverifying the ability of the SHM system to detect a change in
11/0
1
01/0
2
03/0
2
05/0
2
07/0
2
08/0
209
/03
10/0
3
12/0
3
03/0
4
05/0
4
07/0
4
0
0.1
0.2
0.3
Time (month/year)
Tilt
rea
din
g (d
eg)
Tilt 1Tilt 2Tilt 3
Tilt 4Tilt 5Tilt 6
Tilt data versus time from September 2001–August 2004
−0.7
−0.6
−0.5
−0.4
−0.3
−0.2
−0.1
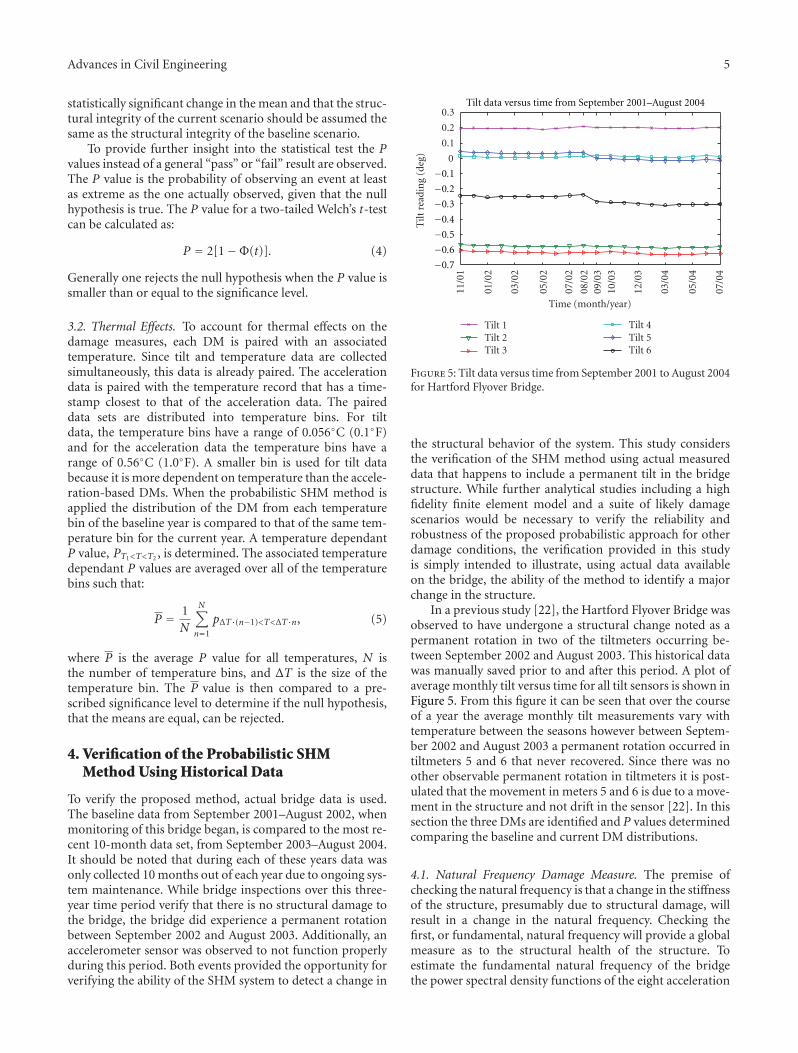
Figure 5: Tilt data versus time from September 2001 to August 2004for Hartford Flyover Bridge.
the structural behavior of the system. This study considersthe verification of the SHM method using actual measureddata that happens to include a permanent tilt in the bridgestructure. While further analytical studies including a highfidelity finite element model and a suite of likely damagescenarios would be necessary to verify the reliability androbustness of the proposed probabilistic approach for otherdamage conditions, the verification provided in this studyis simply intended to illustrate, using actual data availableon the bridge, the ability of the method to identify a majorchange in the structure.
In a previous study [22], the Hartford Flyover Bridge wasobserved to have undergone a structural change noted as apermanent rotation in two of the tiltmeters occurring be-tween September 2002 and August 2003. This historical datawas manually saved prior to and after this period. A plot ofaverage monthly tilt versus time for all tilt sensors is shown inFigure 5. From this figure it can be seen that over the courseof a year the average monthly tilt measurements vary withtemperature between the seasons however between Septem-ber 2002 and August 2003 a permanent rotation occurred intiltmeters 5 and 6 that never recovered. Since there was noother observable permanent rotation in tiltmeters it is post-ulated that the movement in meters 5 and 6 is due to a move-ment in the structure and not drift in the sensor [22]. In thissection the three DMs are identified and P values determinedcomparing the baseline and current DM distributions.
4.1. Natural Frequency Damage Measure. The premise ofchecking the natural frequency is that a change in the stiffnessof the structure, presumably due to structural damage, willresult in a change in the natural frequency. Checking thefirst, or fundamental, natural frequency will provide a globalmeasure as to the structural health of the structure. Toestimate the fundamental natural frequency of the bridgethe power spectral density functions of the eight acceleration

6 Advances in Civil Engineering
Table 1: P values for comparison of natural frequency distributions.
AV1 AV2 AH3 AV4 AV5 AH6 AV7 AV8
P values 0.4098 0.3904 0.3863 0.4019 0.3695 0.2531 0.3312 0.3262
Table 2: P values for comparison of peak acceleration distributions.
AV1 AV2 AH3 AV4 AV5 AH6 AV7 AV8
P values 0.3734 0.3971 0.2392 0.3680 0.3916 0.0267 0.4328 0.4398
measurements are determined, where Gyy( f ) is the one-sided autospectra of the measured absolute acceleration [28].The spectral density functions are defined as:
Gyy(f) = 2 lim
T→∞1TE[∣∣Yk
(f ,T
)∣∣2]
, (6)
where Yk( f ,T) is calculated using the finite Fourier trans-form (FFT) of the measured output, f is frequency, T is therecord length, and E[·] is the expected value operator overthe ensamble index k in question. An FFT is performed oneach record of collected acceleration data. Using these func-tions, the first natural frequency of the bridge can be esti-mated as the corresponding frequency, f , of the maximumvalue of the real-valued autospectral density function Gyy( f )while searching over a range of ± 10% of the measured base-line natural frequency.
The natural frequencies calculated during September2001 to August 2002 represent the baseline scenario. Thenatural frequencies calculated during September 2003 to Au-gust 2004 represent the current scenario. Table 1 shows theP values as calculated from (5) for each accelerometer col-lecting data when Welch’s t-test is applied at 5% significancewith a null hypothesis that the mean natural frequency fromeach year is the same.
All P values exceed 5% (0.05) significance so the observa-tion is consistent with the null hypothesis—that the means ofthe natural frequencies are the same for the current period asfor the baseline period, and thus the structure is healthy.
4.2. Peak Acceleration Damage Measure. The peak accelera-tion provides a local measure of the response and is expectedto change in the presence of structural damage. This time do-main measurement is able to provide meaningful results evenin the presence of potential nonlinear behavior. The peakacceleration was calculated for each triggered truck cross-ing during September 2001 to August 2002 to representthe baseline scenario. The peak accelerations calculated dur-ing September 2003 to August 2004 represent the current sce-nario. Table 2 shows the P values as calculated from (5)for each accelerometer collecting data when Welch’s t-test isapply at 5% significance with a null hypothesis that the meanpeak acceleration from each year is the same.
Table 2 shows that with exception to AH6, the null hypo-thesis cannot be rejected and it is likely that the structureis still healthy. Sensor AH6 is observed during the currentperiod to have a permanent offset. The sensor was removedand recalibrated to remove the offset. Thus the SHM methodidentified here a change in the sensor, not a change in the
Table 3: P values for comparison of tilt distributions.
Tilt 1 Tilt 2 Tilt 3 Tilt 4 Tilt 5 Tilt 6
P values 0.1491 0.0084 0.0431 0.3096 0.0000 0.0000
structural system. This example illustrates how any SHMmethod should not be considered to replace regular bridgeinspections but should supplement these inspections andindicate when there is a significant statistical event to warrantfurther investigation.
4.3. Tilt Damage Measure. As Virkler [25] pointed out, theoriginal purpose of using tiltmeters on the Hartford FlyoverBridge was to see if excessive tilting of the superstructure wasthe cause of the noticed column cracking. Thus, five of thetiltmeters were placed at piers and one at the midspan ofSpan 4. Olund [22] showed that during the winter of 2002-2003 there was a recorded permanent tilt of the bridge. Theproposed probabilistic SHM method is applied to the tiltdata. Applying Welch’s t-test at 5% significance to the tilt dis-tributions for the distributions of the baseline and current tiltDMs gives the following P values in Table 3.
Table 3 shows the P values for tiltmeters 5 and 6 are zerowhich verifies Olund’s [22] conclusion. Additionally, the Pvalues for tiltmeters 2 and 3 indicate there may have beenmore extensive, yet slight, tilt occurring over the length of thebridge whereby Span 4 in addition to the previously identi-fied Span 6 may have undergone permanent drift. This resultshows that using a probabilistic SHM method can show stati-stical significance in the difference of two values when aperson physically observing the data might not be able to seethis change.
5. Field Implementation of the SHM Method
The verification of the probabilistic SHM method was veri-fied using actual measured data during a period where per-manent tilt in the bridge was observed. The data used inthis verification is from 2001–2004 was collected by a bridgemonitoring system that automatically triggered and savedraw data and required the user to manually archive and pro-cess this data. A viable long term implementation of an SHMmethod on an actual highway bridge will require less manualeffort. A fully automated system is being deployed on theHartford Flyover Bridge that will trigger, process, save locally,and regularly archive data. The proposed SHM method isimplemented at the bridge on a PC located in a cabinet

Advances in Civil Engineering 7
Monitored bridge
Network camera
RDV
Viewer PC
Data acquisition and data turbine PC
Remote
Supervisor PC
Data storage PC
In field
RBNB
LabVIEW
Figure 6: Automated bridge monitoring system architecture.
under the bridge with a Microsoft Windows Platform, usingLabVIEW Software and National Instruments hardware fordata acquisition. The system components and architectureare based on those proposed by Jiang [29]. A schematic ofthe system architecture can be seen in Figure 6.
Sensor measurements are collected by the National Ins-truments data acquisition system connected to the onsite PC.Once sampled and digitized, the measurements are processedin LabVIEW and data is collected and archived for laterretrieval for SHM. In addition to automated processing andarchiving to an FTP site, real-time viewing of streaming dataand video is available.
Data acquisition refers to the sampling and analogto digital (A/D) conversion of the sensor measurements.The data acquisition system is a 32-channel analog input,16-bit, 1.25 MS/s single-channel system, compatible withLabVIEW. Acceleration, tilt, and temperature measurementsare acquired at different intervals and sampling rates. The tiltand temperature data are continuously collected at a sampl-ing rate of 10 minutes (a single measurement is taken onceevery 10 minutes). Acceleration data is acquired by the sys-tem when triggered by an acceleration measurement of AV2exceeding the predefined threshold of 0.0095 g. This triggerlevel corresponds to the crossing of a truck, which ensuressufficient excitation of the bridge. Once triggered, a record issaved with a sampling frequency of 100 Hz, starting 14 sec-onds prior to the triggering event, and lasting for a durationof 30 seconds.
The digitized data is processed in LabVIEW accordingto the probabilistic SHM method presented in this paper. Ifan anomaly in the data occurs during the SHM method, anemail is generated stating the anomaly in the bridge behaviorwhich is sent to another remote PC for a supervisor to
investigate. Both raw and processed data are sent via FTPautomatically to a remote PC at the Connecticut Departmentof Transportation for data storage.
Data is also streamed from the onsite PC to a data turbineprogram in real-time. Data Turbine is a high performancetime-synchronized data streaming service [30]. Data Turbineallows data captured from a network video camera and thedata acquisition system to be synchronized and stored in abuffer for viewing. This allows remote users to view the dataand video in either real-time or in playback mode throughthe buffered data in Data Turbine. Data Viewing is accompli-shed through a Java-based software called the Real-TimeData Viewer (RDV) which was originally developed by TheNetwork for Earthquake Engineering CyberinfrastructureCenter (NEESit) now NEEShub (http://nees.org/).
6. Conclusion
This paper uses an in-service highway bridge to verify a prob-abilistic SHM method. The bridge selected for this study is acurved steel box-girder with composite concrete deck locatedin Hartford, CT, USA. The bridge is being monitored as partof the University of Connecticut’s long-term bridge moni-toring project. The bridge is outfitted with accelerometers,temperature sensors, and tiltmeters. The damage measuresstudied are the fundamental natural frequency, peak acceler-ations, and tilt. The probabilistic SHM method uses Welch’st-test to compare damage measure distributions. The ap-proach verifies the permanent rotation first observed byOlund [22] and that there is no structural damaged asobserved by regular bridge inspections. It has also beenshown through the error in accelerometer AH6 that this pro-babilistic BHM method is meant to complement regular

8 Advances in Civil Engineering
bridge inspections and not to replace them. An automatedbridge monitoring system is described with the probabilisticstructural health monitoring method implemented on anactual highway bridge.
7. Acknowledgments
University of Connecticut, the Connecticut TransportationInstitute, and the Connecticut Department of Transporta-tion are acknowledged for their joint participation in theongoing bridge monitoring project funded by the Connecti-cut Department of Transportation and the Federal HighwayAdministration. This paper, prepared in cooperation withthe Connecticut Department of Transportation and the Fed-eral Highway Administration, does not constitute a stand-ard, specification, or regulation. The contents of this paperreflect the views of the authors who are responsible for thefacts and the accuracy of the data presented herein. Thecontents do not necessarily reflect the views of the Con-necticut Department of Transportation or the Federal Hig-hway Administration.
References
[1] S. W. Doebling, C. R. Farrar, M. B. Prime, and D. W. Shevitz,“Damage identification and health monitoring of structuraland mechanical systems from changes in their vibration chara-cteristics: a literature review,” Report LA-I3070-MS, Los Ala-mos National Laboratory, Los Alamos, NM, USA, 1996.
[2] S. W. Doebling, F. M. Hemez, L. D. Peterson, and C. Farhat,“Improved damage location accuracy using strain energy-based mode selection criteria,” AIAA Journal, vol. 35, no. 4,pp. 693–699, 1997.
[3] S. W. Doebling, C. R. Farrar, M. B. Prime, and D. W. Shevitz,“A review of damage identification methods that examine cha-nges in dynamic properties,” Shock and Vibration Digest, vol.30, no. 2, pp. 91–105, 1998.
[4] F. K. Chang, Structural Health Monitoring: Current Status andPerspectives, Technomic, Lancaster, Pa, USA, 1997.
[5] S. B. Chase and G. Washer, “Nondestructive evaluation forbridge management in the next century,” Public Roads, vol. 61,no. 1, pp. 16–25, 1997.
[6] L. D. Olson and C. C. Wright, “Nondestructive testing for re-pair and rehabilitation,” Concrete International, vol. 12, no. 3,pp. 58–64, 1990.
[7] C. R. Farrar, W. B. Baker, T. M. Bell et al., “Dynamic chara-cterization and damage detection in the I-40 bridge over theRio Grande,” Report LA-12767-MS UC-906, Los Alamos Na-tional Laboratory, Los Alamos, NM, USA, June 1994.
[8] A. Chakraborty and D. Okaya, “Frequency-time decomposi-tion of seismic data using wavelet-based methods,” Geophysics,vol. 60, no. 6, pp. 1906–1916, 1995.
[9] O. S. Salawu and C. Williams, “Bridge assessment using forc-ed-vibration testing,” Journal of Structural Engineering, vol.121, no. 2, pp. 161–173, 1995.
[10] C. R. Farrar and S. W. Doebling, “Lessons learned from appli-cations of vibration based damage identification methods tolarge bridge structure,” in Structural Health Monitoring: Cur-rent Status and Perspectives, F. K. Chang, Ed., pp. 351–370,Technomic Publishing, Lancaster, Pa, USA, 1997.
[11] O. S. Salawu, “Detection of structural damage through chan-ges in frequency: a review,” Engineering Structures, vol. 19, no.9, pp. 718–723, 1997.
[12] C. R. Farrar, S. W. Doebling, and D. A. Nix, “Vibration-basedstructural damage identification,” Philosophical Transactions ofthe Royal Society A, vol. 359, no. 1778, pp. 131–149, 2001.
[13] J. Caicedo, S. J. Dyke, and E. A. Johnson, “Health monitoringbased on component transfer functions,” in Advances in Stru-ctural Dynamics, J. M. Ko and Y. L. Xu, Eds., vol. 2, pp. 997–1004, 2000.
[14] F. K. Chang, Structural Health Monitoring 2000, Technomic,Lancaster, Pa, USA, 2000.
[15] H. Sohn, Charles R. Farrar, Michael L. Fugate, and Jerry J.Czarnecki, “Structural health monitoring of welded connec-tions,” in Proceedings of the 1st International Conference on Steel& Composite Structures, Pusan, Korea, June 2001.
[16] H. Sohn, M. Dzwonczyk, E. G. Straser, A. S. Kiremidjian, K.H. Law, and T. Meng, “An experimental study of temperatureeffect on modal parameters of the Alamosa Canyon Bridge,”Earthquake Engineering and Structural Dynamics, vol. 28, no.7-8, pp. 879–897, 1999.
[17] J. T. Dewolf, M. P. Culmo, and R. G. Lauzon, “Connecticut’sbridge infrastructure monitoring program for assessment,”Journal of Infrastructure Systems, vol. 4, no. 2, pp. 86–90, 1998.
[18] DeWolf and T. John, “Structural health monitoring of threebridges in connecticut,” in Proceedings of the 88th AnnualMeeting Transportation Research Board Annual Meeting (TRB’09), 2009.
[19] R. G. Lauzon and J. T. DeWolf, “Connecticut’s bridge monitor-ing program: making important connections last,” TR News,no. 224, p. 46, 2003.
[20] J. Olund and J. DeWolf, “Passive structural health monitoringof Connecticut’s bridge infrastructure,” Journal of Infrastruc-ture Systems, vol. 13, no. 4, pp. 330–339, 2007.
[21] C. Liu and J. T. DeWolf, “Effect of temperature on modal vari-ability of a curved concrete bridge under ambient loads,” Jour-nal of Structural Engineering, vol. 133, no. 12, pp. 1742–1751,2007.
[22] J. Olund, Long term structural health monitoring of Connecti-cut’s bridge infrastructure with a focus on a composite steeltub-girder bridge, M.S. thesis, The University of Connecticut,Storrs, Conn, USA, 2006.
[23] A. Rytter, Vibration based inspection of civil engineering struc-tures, Ph.D. thesis, Aalborg University, Aalborg, Denmark,1993.
[24] Q. W. Zhang, “Statistical damage identification for bridgesusing ambient vibration data,” Computers and Structures, vol.85, no. 7-8, pp. 476–485, 2007.
[25] C. Virkler, Continuous structural monitoring coupled with finiteelement modeling for a composite steel box girder building, M.S.thesis, The University of Connecticut, Storrs, Conn, USA,2005.
[26] A. M. Scianna and R. Christenson, “Probabilistic structuralhealth monitoring method applied to the bridge health moni-toring benchmark problem,” Transportation Research Record,no. 2131, pp. 92–97, 2009.
[27] A. H.-S. Ang and W. H. Tang, Probability Concepts inEngineering Planning and Design, Basic Principles, vol. 1, JohnWiley & Sons, New York, NY, USA, 1975.
[28] J. S. Bendat and A. G. Piersol, Random Data Analysis andMeasurement Procedures, Probability and Statistics, John Wiley& Sons, New York, NY, USA, 3rd edition, 2000.

Advances in Civil Engineering 9
[29] Z. Jiang, The use of NEES cyberinfrastructure in structuralhealth monitoring and earthquake education, M.S. thesis, TheUniversity of Connecticut, Storrs, Conn, USA, 2008.
[30] DataTurbine: http://www.dataturbine.org/.

International Journal of
AerospaceEngineeringHindawi Publishing Corporationhttp://www.hindawi.com Volume 2010
RoboticsJournal of
Hindawi Publishing Corporationhttp://www.hindawi.com Volume 2014
Hindawi Publishing Corporationhttp://www.hindawi.com Volume 2014
Active and Passive Electronic Components
Control Scienceand Engineering
Journal of
Hindawi Publishing Corporationhttp://www.hindawi.com Volume 2014
International Journal of
RotatingMachinery
Hindawi Publishing Corporationhttp://www.hindawi.com Volume 2014
Hindawi Publishing Corporation http://www.hindawi.com
Journal ofEngineeringVolume 2014
Submit your manuscripts athttp://www.hindawi.com
VLSI Design
Hindawi Publishing Corporationhttp://www.hindawi.com Volume 2014
Hindawi Publishing Corporationhttp://www.hindawi.com Volume 2014
Shock and Vibration
Hindawi Publishing Corporationhttp://www.hindawi.com Volume 2014
Civil EngineeringAdvances in
Acoustics and VibrationAdvances in
Hindawi Publishing Corporationhttp://www.hindawi.com Volume 2014
Hindawi Publishing Corporationhttp://www.hindawi.com Volume 2014
Electrical and Computer Engineering
Journal of
Advances inOptoElectronics
Hindawi Publishing Corporation http://www.hindawi.com
Volume 2014
The Scientific World JournalHindawi Publishing Corporation http://www.hindawi.com Volume 2014
SensorsJournal of
Hindawi Publishing Corporationhttp://www.hindawi.com Volume 2014
Modelling & Simulation in EngineeringHindawi Publishing Corporation http://www.hindawi.com Volume 2014
Hindawi Publishing Corporationhttp://www.hindawi.com Volume 2014
Chemical EngineeringInternational Journal of Antennas and
Propagation
International Journal of
Hindawi Publishing Corporationhttp://www.hindawi.com Volume 2014
Hindawi Publishing Corporationhttp://www.hindawi.com Volume 2014
Navigation and Observation
International Journal of
Hindawi Publishing Corporationhttp://www.hindawi.com Volume 2014
DistributedSensor Networks
International Journal of


![Static and Dynamic Mechanical Properties of Long-Span ...downloads.hindawi.com/journals/ace/2017/6198296.pdf · design of the first US FRP cable-stayed pedestrian bridge ... [24]](https://static.fdocuments.in/doc/165x107/5a77741e7f8b9ad22a8e2f80/static-and-dynamic-mechanical-properties-of-long-span-a-design-of-the.jpg)