IMPLEMENTATION OF THE CQT METHODOLOGY FOR BUSINESS PROCESS OPTIMIZATION · 2014-01-07 ·...
20
73 business process management, optimization Jiří TUPA ∗ , Josef BASL IMPLEMENTATION OF THE CQT METHODOLOGY FOR BUSINESS PROCESS OPTIMIZATION Abstract This contribution deals with business process optimization and management. The aim of this paper is to introduce new CQT methodology for process management and optimization. This new methodology combines known principles and methods for the process management and optimization. The CQT (Cost-Quality- Time) methodology target is the quality improvement, process time and cost reduction as principal process management objectives. The contribution presents also a practical application of the CQT methodology for printed circuit board manufacturing. 1. INTRODUCTION “The oft-quoted “If I can not measure it, I cannot optimize it” applies equally to processes. It is therefore essential for companies to formulate their process objective related to time, cost, and quality in terms of specific measurable performance indicators. The latent synergies in the company can be exploited to the full with benchmarking and process comparisons and best practices can be identified.” (Prof. A. W. Scheer – Corporate Performance Management, Preface) This shared vision emphasizes aim and issue of this paper, focused on description of the new methodology leading to business process optimization. Business process optimization (BPO) represents significant part of the process management application. Business process management (BPM) is a method of production and non-production activities management in manufacturing and services in present time. This approach is an effective way of organizing and managing how work activities create value for the customer and other interested parties. Prof. August – Wilhelm Scheer mentioned in his book, that process management has become an important control instrument in many companies, because its practitioners realized that ∗ Ing., Ph.D.,University of West Bohemia (UWB) in Pilsen, Faculty of Electrical Engineering, Department of Technologies and Measurement, Univerzitni 8, 306 14 Plzen (Pilsen), Czech Republic, e- mail: [email protected] ∗∗ Prof. Ing., CSc., University of Ecomomics, Faculty of Informatics and Statistics, Department of Information Technologies, nam. W. Churchilla 4, 130 67 Praha (Prague) 3, Czech Republic, e- mail:[email protected]
Transcript of IMPLEMENTATION OF THE CQT METHODOLOGY FOR BUSINESS PROCESS OPTIMIZATION · 2014-01-07 ·...

73
business process management, optimization
Jiří TUPA∗, Josef BASL IMPLEMENTATION OF THE CQT METHODOLOGY FOR
BUSINESS PROCESS OPTIMIZATION Abstract
This contribution deals with business process optimization and management. The aim of this paper is to introduce new CQT methodology for process management and optimization. This new methodology combines known principles and methods for the process management and optimization. The CQT (Cost-Quality-Time) methodology target is the quality improvement, process time and cost reduction as principal process management objectives. The contribution presents also a practical application of the CQT methodology for printed circuit board manufacturing.
1. INTRODUCTION
“The oft-quoted “If I can not measure it, I cannot optimize it” applies equally to processes. It is therefore essential for companies to formulate their process objective related to time, cost, and quality in terms of specific measurable performance indicators. The latent synergies in the company can be exploited to the full with benchmarking and process comparisons and best practices can be identified.”
(Prof. A. W. Scheer – Corporate Performance Management, Preface) This shared vision emphasizes aim and issue of this paper, focused on description of the
new methodology leading to business process optimization. Business process optimization (BPO) represents significant part of the process management application. Business process management (BPM) is a method of production and non-production activities management in manufacturing and services in present time. This approach is an effective way of organizing and managing how work activities create value for the customer and other interested parties. Prof. August – Wilhelm Scheer mentioned in his book, that process management has become an important control instrument in many companies, because its practitioners realized that
∗ Ing., Ph.D.,University of West Bohemia (UWB) in Pilsen, Faculty of Electrical Engineering, Department of Technologies and Measurement, Univerzitni 8, 306 14 Plzen (Pilsen), Czech Republic, e-mail: [email protected] ∗∗Prof. Ing., CSc., University of Ecomomics, Faculty of Informatics and Statistics, Department of Information Technologies, nam. W. Churchilla 4, 130 67 Praha (Prague) 3, Czech Republic, e-mail:[email protected]

74
optimizing a company’s capacity to create value in the form of processes has a direct and immediate effect on the bottom line [1].
The process approach became the centre of interest in the 1990s, with the publication of Michael Hammer’s book entitled ¨Reengineering the Corporation“. Central to Hammer’s version of the BPR approach was the idea that companies can increase their competitiveness by radical restructuring and optimizing the organization of core business process. This approach was greeted with enthusiasm in Europe, absent from Michael Hammer’s approach – based on support of the business process reengineering concept.
Nowadays, the issue focused on BPM is an integrated and continuous approach, which deals equally with organizational and technological considerations. It is important to understand that BPM itself represents a process. It is a process consisting of the phases of process strategy, process definition, process implementation and process control [1, 2].
The main purpose of the process approach is to enhance an organization’s effectiveness and efficiency in achieving its defined objectives. And we can analyze which management methods and tools can be useful for the process optimization for the BPM application. The focus of this paper will be to address this question for the BPM application in industry. We would like to introduce new methodology, entitled CQT (Cost-Quality-Time) methodology, which can be suggested for process optimization as well. The new CQT methodology will be described in the first part of the paper focused on the literature review and CQT methodology description. The practical examples of CQT application then will be presented in a case study. 1.1. Literature review
At first we summarized the number of articles and papers in the selected world electronics sources [3, 4, 5] published since the end of 1990 until July 2006. Presumably, the high number of citations on BPM seems to prove that BPM is a significant field of the recent research. Secondly, we concentrated on methods and tools for BPM in research, necessary for problem solution. It includes methods and tools such as mathematical methods of graph theory and discrete optimizing for planning and decision tasks, TOC method for optimizing the process time and cost and identification of key manufacturing processes, process analysis and fishbone diagrams for quality improvement, risk analysis for process management, the BSC method for diagnostic processes establishment and performance measurement and ITIL library (see table 1).
Tab.1. Number of articles in the science databases
Keyword Database
IEEE Database
Sciencedirect Database Proquest
Business Process Management 86 48 34764
Business Process Reengineering 161 116 7074
Knowledge management 1218 680 8103
Information Management 4734 866 22251
Theory of Constraints 62 93 173 Balanced Scorecard 59 102 1218
75
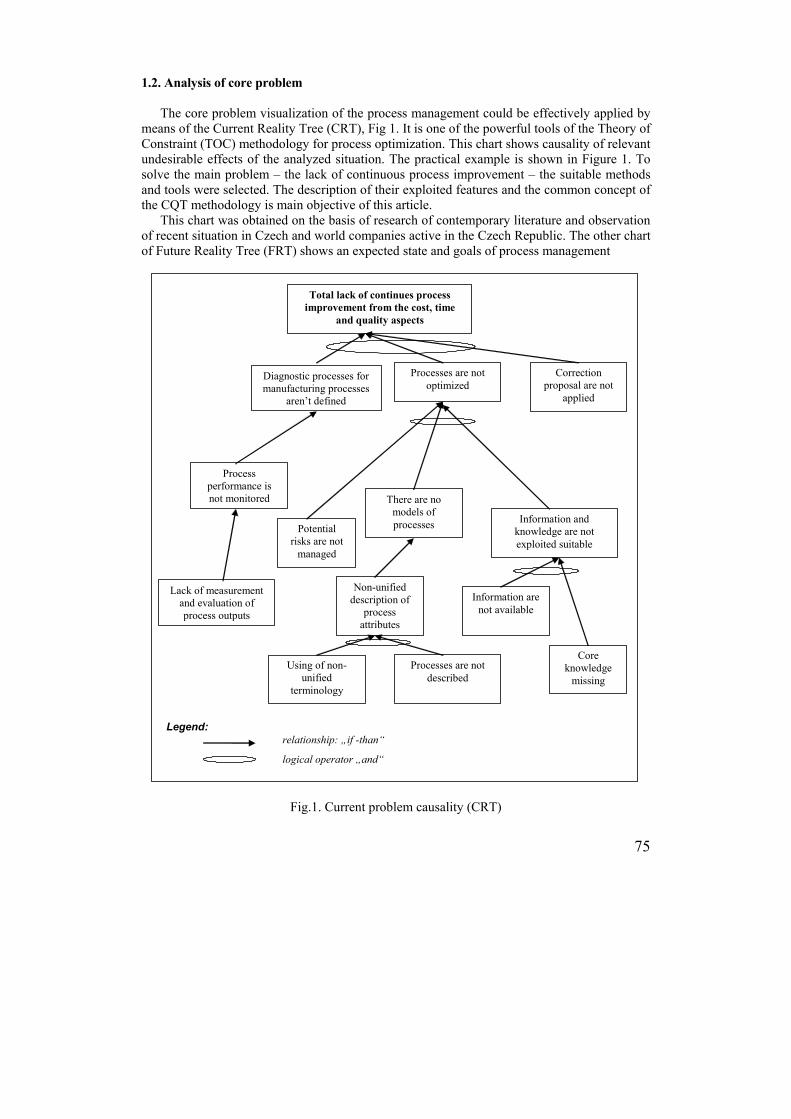
1.2. Analysis of core problem The core problem visualization of the process management could be effectively applied by
means of the Current Reality Tree (CRT), Fig 1. It is one of the powerful tools of the Theory of Constraint (TOC) methodology for process optimization. This chart shows causality of relevant undesirable effects of the analyzed situation. The practical example is shown in Figure 1. To solve the main problem – the lack of continuous process improvement – the suitable methods and tools were selected. The description of their exploited features and the common concept of the CQT methodology is main objective of this article.
This chart was obtained on the basis of research of contemporary literature and observation of recent situation in Czech and world companies active in the Czech Republic. The other chart of Future Reality Tree (FRT) shows an expected state and goals of process management
Process performance is not monitored
Lack of measurement and evaluation of process outputs
Diagnostic processes for manufacturing processes
aren’t defined
There are no models of processes
Non-unified description of
process attributes
Processes are not described
Information are not available
Total lack of continues process improvement from the cost, time
and quality aspects
Processes are not optimized
Core knowledge
missing
Potential risks are not
managed
Using of non-unified
terminology
Information and knowledge are not exploited suitable
Correction proposal are not
applied
relationship: „if -than“
logical operator „and“
Legend:
Fig.1. Current problem causality (CRT)

76
application. Figure 2 presents significant steps leading to efficient and successful process
management application.
Processes improvement from quality, cost and
time aspects
Process performance is measured
Processes are optimized
Diagnostic system exists
Processes risks are
controlled
Processes models exist
Processes are described and analyzed
Methods and optimizing criteria
are defined
Information and knowledge are
controlled
Correction proposal is applied
Unified terminology is implemented
Processes goals and metrics are defined
Fig.2. Future reality tree (FRT) 2. CQT METHODOLOGY DESIGN
CQT methodology was designed for support of process management application. The CQT methodology was developed as one result of our research. This methodology combines known principles and methods of business process management. The aim of this methodology is the solution of presented core problem in previously part and provides framework for process management application. The main contribution of undertaken analysis and the selection process of suitable methods and tools is proposal of the new methodology where the methods and tools are applied in defined steps. The methodology is named CQT according to main goal criteria, eg. C – cost, Q – quality and T – time (see table 2). The CQT methodology target (Cost-Quality-Time) is the quality improvement, processing time and cost reduction as process management targets. Needless to say that the methodology respects present trends of management presented in introduction.

77
Tab.2. CQT methodology framework
The used methods were divided into two groups according to dynamic and static view (see
Fig. 3). It represents the relation between process, information and knowledge. This view can be used for description of processes (modelling, definition of process attributes, identification
Process Input Output Methods and Tools
Current state and problem identification
Strategy and targets
Current Tree Reality, Future Tree Reality, Conflicts Diagrams and key problems identification
Thinking Process - Current Tree Reality, Future Tree Reality, Conflict Diagram (Evaporating Cloud)
Process mapping Key problem
Process map, terminology list
Forms for process map construction and process attribute identification
Process modelling Process map, terminology list
Object process model and process attribute description
Methodology for process modelling e.g. ARIS
Identification of key process making constraint system
Object model
The constraint is determined
TOC (Theory of Constraint) method, mathematical tools e.g. graph theory
Detailed key process analysis
Information about key process
The process was analyzed and information was recorded
Brainstorming, Causes and events diagram, detailed model of process.
Cost and time analysis Attributes description, accounting, data
Cost and process time analysis
Cost and time analyzing methods, controlling, process measurement
Proposal for improvement and optimizing process according to quality requirements
Process, cost and time analysis
The problem was solved TOC, real experiment or process testing, mathematical optimizing (application graph algorithm)
Information and knowledge management system and establishment
Optimizing processes
Application of methods and tools
ITIL ( Information Technology Infrastructure Library)
Information management and knowledge method (e.g. BS 7799)
Risk analysis Process and situation description
Risk evaluating a risk treatment plan
Risk analysis method
Process diagnostic system design
Process goal and strategy
Performance measurement system and diagnostic process establishment
Balanced Scorecard method
ITIL

78
knowledge and information). Second view called dynamic view shows relation between process parameters – quality, process time and cost. The dynamic view can be used for proposal of optimizing method and for performance measurement.
Information Knowledge
Processes
Information Knowledge
Processes Cost
Quality
TOCBSC
Informationand
KnowledgeManagement
Time
Cost
Quality
TOCBSC
Informationand
KnowledgeManagement
Time
Fig.3. Static (left) and dynamic (right) view The CQT methodology using mathematical methods of graph theory and discrete
optimizing for planning and decision tasks, TOC method for optimizing of process time and cost and identification of key manufacturing processes, process analysis and fishbone diagram for quality improvement, risk analysis for process risk management, BSC method and ITIL library as method for diagnostic processes establishment and performance measurement. Table 2 shows the important activities leading to the methodology implementation. 3. DESCRIPTION OF THE METHODS AND TOOLS USED
In this part we would like to introduce significant methods and tools for business process
modelling, optimization and performance measurement, which were used for CQT methodology design 3.1. Methods and tools for process modelling
Methods of company modelling offer support for mastering comprehensive tasks in the
organization. Business process modelling is a useful tool to capture, formalize and structure the knowledge of business process. The models can be deterministic, stochastic, uncertain but structured, uncertain but imperfectly structured. Business process modelling tools can be categorized into business process chain-based type such as IDEFO, IDEF3, ARIS-eEPC, Petri net, etc., object-oriented type such as UML and IDEF4, and formal description type such as WPDL, XML, predicative logic, process algebra, etc. The overall model is analyzed on the individual models. Models would have to contain all process attributes, static and dynamic parameters such as process time, process threats, cost etc. The methods for process modelling and analysis are e.g. described in [2, 6, 7, 8].
3.2 Process optimization and Theory of Constraint (TOC)
The TOC is one of the three major management concepts of the eighties and nineties:

79
Just in Time (JIT). Total Quality Management (TQM). Theory of Constraints (TOC).
Each of these three approaches is used to answer the existing urgent management problems. But in fact all three concepts are different facets of the similar management philosophy. The TQM management philosophy by W. Edwards Deming covers system thinking, process measurement and a never ending cycle of process improvement. The TOC is also methodology for performing systems thinking using the concept of throughput on the business entity as a whole to focus on changes to be made on constraints that are directly limiting better total-system profitability. JIT and MRP emphasise inventory reduction and resource scheduling can be then understood as just a specific application of TOC to one area of the business. Thus, JIT and MRP are subsets or consequences of TOC that is a part of TQM. Tab.3. Examples of application of “5 TOC steps” in the enterprise
When TOC defines its goal, when it is looking for the constraints and finally is dealing with
their elimination then the following principles and techniques are used: The Socratic Method. The Effect-Cause-Effect methodology. Five focusing steps.
The all applications of TOC including the production, project management and even the thinking process are based on the very simple five steps:
1. IDENTIFY the system's constraint. 2. Decide how to EXPLOIT the system's constraint. 3. SUBORDINATE everything else to the above decisions. 4. ELEVATE the system's constraint. If in any of the previous steps, the constraint has
been broken. 5. RETURN to step 1.This means do not let INERTIA become the system's constraint. These five steps must be repeated, perhaps many times. Therefore TOC has the similar
philosophy like CPI (Continuous Process Improvement), but on the other hand the elevation (step
Production Project management Enterprise 1. IDENTIFY the system's constraint
Materials Capacity
Sources Knowledge
Market Policy Motivation of people
2. Decide how to EXPLOIT the system's constraint.
No waste of material or capacity Production maintenance
Source productive all the time
Not wasting more on constraint
3. SUBORDINATE everything else to the above decisions.
Organize proper buffer and proper timing of material coming to production
Using proper buffer to protect constraints Disturb of constraints source are not allowed
Share common sense of enterprise constraints and respect this
4. ELEVATE the system's constraint.
Better delivering New machine
New capacity Better marketing Training staff
5. Don't let INERTIA become the system's constraint.
Keep attention about the production constraints
Keep attention about the project constraints
Keep attention about the enterprise constraints

80
4) of the systems´ constraint might be common with the BPR (Business Process Reengineering). [10]
Business Process Optimization via TOC paradigm. The logistics processes are core part of the business process as a whole. Therefore their optimization is very important and more attention is given to its analysis. The acronym of BPO is based on three key words: Business, Process, and Optimization. For each of them one can find the equivalent in the TOC (Table 4).
Tab. 4. Equivalent in the TOC
BPO TOC
Business Goal – making money
Process Constraint – of global chain
Optimisation Throughput – maximisation
The TOC understands the process like a chain using the proper metrics to be implemented.
Instead the effort in searching for the local optimum, it is necessary to consider all aspects and look for the global optimum. It is generally true but on the other there are so many decisions done in firms in favour of local optimisation (TOC mentioned example “cost world”). When we are looking for throughput it is similar like to find the strength of the chain. Then it is not a sum of strength of each element but it depends on the weakest part of the chain. This approach is called like “throughput world”. The weakest part of the chain (process) prevents from the higher strength (throughput). It is called constraint.
The metrics used for measurement of process by method TOC, are defined by accounting system called Throughput Accounting. Throughput Accounting is a system based on the Theory of Constraints (TOC). The basic metrics are:
Throughput (T): the rate at which the system generates money through sales. Investment (I): all the money the system invests in purchasing things the system
intends to sell. Operating Expense (OE): all the money the system spends in turning investment into
throughput.
3.3. Risk control and risk analysis New phenomenon risk management and risk analysis is one of the tasks for management
nowadays. Risk management can be defined as a process, purpose of which is prevention and elimination of existing or probable risks. In the enterprise we can identify risks in the area of production technology, labour protection, investment to the production and development, implementation of information system, etc.
Many of these risks are to be found in operative events, arising from business processes, organizational structure, IT systems and external factors. Such risks can only be identified and managed efficiently if the company has a functioning risk management system implemented. Only then can risk awareness be developed and mission-critical processes maintained even in crisis situation (Business Continuity Planning).
Practically for establishment it means systematic application of policy, procedures and practices on the exercises that determine contexts, identify, analyze, rate risk and apply the risk monitoring. Today risk management is related to building-up of information security system.

81
The building up of these systems results either from entrepreneurs decision or from legislation. For risk management and risk analysis we can use sophisticated quantitative and qualitative methods for example FMEA, HAZOP, ETA etc., in manufacturing area and standards BS 7799 and ISO/IEC TR 13335 for information security management system.
3.4. Process performance management and Balanced Scorecard
Performance measurement should be used for the realization of effective management system in enterprises. Measurement can be the key to prosperity. If you can’t measure of processes, you can’t control it, you can’t manage it. If you can’t manage it, you can’t improve it. The performance can be defined as a n-dimensioned metrics set. These metrics characterize system behaviour in a determinate period and are responses (outputs) of the system on the input signal and control signal.
The performance measurement system has to be determined for effective and objective control of all the processes. This system is a one of part of feedback. We have to determine available tools for global and local level of control to measure is regular. The methods: Balanced Scorecard, European Foundation for Quality Management (EFQM), Value Based Management, and Throughput Accounting (TA) can be used for global level. Six Sigma method or regulation diagrams can be used for local measurement of performance.
Performance measurement is important part of process management and diagnostic of processes. Determination of diagnostics goals is the first step of performance measurement processes. Therefore all strategy goals should be determined by measurable metrics or indicators. The strategy goals and metrics should be transferred on all level to all processes (local level) from strategy to global level. One effective of the tools for performance management is Balanced Scorecard (BSC) method. The Balanced Scorecard (BSC) supplements traditional financial measures with three additional perspectives: the customers, the internal business process and the learning and growth perspective.
The Balanced Scorecard (BSC) supplements traditional financial measures with three additional perspectives: the customers, the internal business process and the learning and growth perspective. It is supposed to be a tool describing an organization’s overall performance across a number of measures on a regular basis [2, 9].
The BSC method gives a definition of strategy as hypothesis summary about causes and results. It can be declared as a sequence of “if – then”. For example the chain of causation between improving of training of staff and upper profit, can be formulated following hypothesis sequence:
“If you improve quality of training on problems of a manufacturing printed circuit board (PCB), then the staff will be able to understand more about the problems in the process manufacturing. If they understand more about the problems of manufacturing, then the quantity of correct PCB’s will be higher. If the quantity of correct PCB’s is higher, then the customers will be satisfied. If the customers are satisfied, then the profit of sale will be higher. If the profit of sale is higher, then the performance will be higher”. An example of causes and results chain is illustrated by Figure 4. The process strategic goals were determined by management of the organization according to strategy and quality policy. The goals of process are linked to one chain of causes and results between all perspectives (Fig. 4).

82
Financialperspective
Profit
Key indicators
Process time
Skills and knowledge ofoperators Cost of process Customer
satisfaction
Quality of process
CustomerperspectiveInternal process
Learning and growthperspective
Fig. 4. Example of causes and results chain of a manufacturing process
3.5. Information management and ITIL
The next stream of research was focused on a selection of a useful method information
management for BPM application. One of these methods described in contemporary literature is ITIL. What does ITIL mean? The ITIL is short for Information Technology Infrastructure Library and it is the documentation of best practice for Information Technology Service Management. ITIL consists of a series of books giving guidance on the provision of quality IT services, and on the accommodation and environmental facilities needed to support IT [11].
ITIL has been developed in recognition of organizations' growing dependency on IT and embodies best practices for Information Technology Service Management. The problem and incident management is part of service support disciplines. The goal of incident management is to restore normal service operation as quickly as possible and minimise the adverse impact of incidents on business operations, thus ensuring that the best possible level of service quality and availability is maintained. “Normal service operation” is defined here as service operation within Service Level Agreement (SLA) limits. Incident management must be quick as possible. An incident is any event which is not part of the standard operation a service and which causes, or may cause an interruption to, or a reduction in, the quality of the service.
The main goals of problem management are: to minimise the adverse impact of incidents and problems on the business; to prevent recurrence of incidents related to these errors. The Problem management process requires the accurate and comprehensive recording of incidents in order to identify effectively and efficiently the cause of the incident trends.
The relationship between ITIL and BPM is described in paper [12]. This paper addresses basic issues of supporting ITIL with process-oriented tools such as workflow management systems. It discusses the need for workflow management support of service management processes to achieve service level compliance, and presents criteria for determining which IT Service Management processes can and should be supported by workflow management systems. The IT Service Management processes defined by ITIL are evaluated and divided into

83
four basic process classes according to their suitability for workflow management, thereby laying a foundation to future top-down approaches for comprehensive ITIL tool support.
The main advantage of ITIL application should be complexity and depth of solution. The main processes and important management areas are described in 8 books. For example the books provide these management areas: security management, software asset management, financial planning, strategic management etc. The solution which is included in the ITIL standard is based on “best practice” recommendation. Best practice in management means tried solution which was applied in the past time and gives very good result for an organization. The well-developed relationship with standards ISO 9000 and 15000 is next ITIL significant benefit.
The diagnostics can be a good example of ITIL application in the manufacturing area. Diagnostics can be explained as testing and measurement of components and processes in the manufacturing and provides evaluation of result. The result of a diagnostics process is prognosis of the system or processes behavior in the future. The information obtained from a diagnostic should be processing in an information system. This idea leads to use of the ITIL as a diagnostic of process in the manufacturing area.
On the other hand the disadvantages of ITIL should be presented. The first important argument concerns knowledge. The ITIL is used by manufacturing mangers who do not know this standard, because the ITIL describes processes and management process for informatics system but not for manufacturing system. Manufacturing managers know standards from the Quality Management Standards ISO 9000 and understanding ITIL can be a problem. The definition of scope application and translation ITIL requirements for manufacturing can be a very difficult problem too. An other point of view is the application. The application of the ITIL supposes training of all responsible managers, but the training courses are very expensive. The long time and financial demands can be restricted for ITIL application in the manufacturing area, especially at small and medium enterprises (SME).
The next view of research is the focus on information security management. I would like to emphasize that information and process management should include information security nowadays. Information security has been, is, and will continue to be a hot topic for discussion. Information security is same ways like confidentiality. That means information is accessible only to those authorized to have access. But that is just only part of information security. Integrity and availability are also important parts of information security. Integrity means safeguarding of the accuracy and completeness of information and processing methods. Availability is ensuring that authorized users have access to information and associated assets when required.
In practice there are a lot of standards for the establishment of information security management system (ISMS), for example: Trusted computer system evaluation criteria (TCSEC), Information technology security evaluation criteria (ITSEC), Canadian trusted computer product evaluation criteria (CTCPEC), and especially ISO 15408 - Common Criteria, British Standard BS 7799 and ISO/IEC TR 13335. The implementation of standard BS 7799 is described in one issue of ITIL and can be recommended for information security management as one part of the ITIL application. If the information security management system is applied, then the BPM and Information Security Management policy, documentation and processes should be established as part of ITIL.

84
4. CASE STUDY
This case study shows example of CQT methodology application for business process optimization. The study is focused on printed circuit board manufacturing. The manufacture is one part of our department and its customers are other universities departments and small companies from the Pilsen region. The main goal of this application was to optimize production quality and process time. Definition of core problem of manufacturing was first task.
3.5. Definition of core problem
The core problem of visualization was effectively solved by the Current Reality Tree (CRT). This chart shows causality of relevant undesirable effects of the analyzed situation. The practical example is shown in Fig. 5. The main problem is fall of profit related to production time, capacity and quality of process. On the other hand this situation might be described by a conflict diagram (Fig. 6). The diagram describes decision and optimizing problem of manufacturing - determination of optimum batch size.
The conflict exists between increasing and decreasing of the batch size. The increasing of production run (D) makes to cost reduction (B) and decreasing (D) of the batch size makes to high quality of products (C). Both described situations have negative effect on the production plan and profit. These problems and conflict were solved by designing methodology effectively. So cost reduction, quality improvement and time reduction were the main optimizing criteria according to methodology.
Extending Term of Delivery
Long Time of Main
Production Process
High Cost on Processes
Idle Capacity of Machine
Lack of Qualified Worker
High Emphasis on Quality
Customer Decrease
High Number of Small and Difference
Orders
High Process Variability
Fall in Profit
High Product Price
Implication
Fig. 5. Current problem of causality

85
A Production
plan fulfilment
BProcess cost
reduction
CQuality requirements
fulfilment
DBatch size increasing
D’Bach size
decreasing
Conflict
Fig. 6. Conflict diagram of company 3.2 Process description and process analysis
Process description should be a result of process analysis and mapping. Process analysis is
the first step for design of the process measurement system. The processes can be divided into serial, parallel, hard, soft. The hard process means process, where the steps of process can not be exchanged. The soft process means process, where the steps of process can be exchanged. The results of process are recorded in form represented by process map (see Fig. 7). The process map should be used for process model construction. We used object modelling by ARIS method. The Fig. 8 represents model value – added chain diagram. This model type - specifies the functions in an organization which directly influence the real added value of the organization. These functions can be linked together in the form of a sequence of functions and thus form a value-added chain.
Process identification map record
Mai
n
Supp
ortiv
e
Con
trol
Key
Har
d
Soft
Material Cutting X X Requirements Material on required dimension Process time
Drilling PCBDrilling
X X X
Material on required dimension Drilled PCB
Process Time, Failure drilled PCB Number, Quality
Inspection X X Drilled PCB Tested PCB Process Time, CostDiagnostic Planning X X Testing requirements Diagnostic Plan Process TimeDiagnostic Process X X Diagnostic Plan Diagnosis Process Time, Cost
Plating Preparing X XDrilled PCB Prepared PCB Process Time, Failure
PCB number, Quality
Plating PCB X X XPrepared PCB Plated PCB Process Time, Failure
PCB number, QualityPCB Printed Circuit Board
Output Key process measured parametrsProcesses Sub processes
Process Type
Input
Fig. 7. Table for process mapping
Material Cutting Drilling Plating Preparing Plating
Fig. 8. Process value - added chain diagram

86
3.3. Key process identification and analysis
The key process was identified by TOC method. The parameter for identification of the system's constraint was process time and capacity of process. The drilling process had the worst process time and capacity of all manufacturing processes in this case. So according to CQT methodology the drilling process was analyzed and optimized.
Key process analysis consists of these steps: • Technological process analysis • Process description and process modelling • Time and cost analysis • Identification of constraint and process optimizing • Information and knowledge control • Process risk analysis • Diagnostic of process A fishbone diagram was used for technological analysis and optimizing of the drilling
process. The fishbone diagram (see Fig. 9) was developed by Professor Kaoru Ishikawa and is often referred to as an Ishikawa diagram. It can help to structure the process of identifying possible causes of a problem. The diagram describes the relationship between process attributes (knowledge, control methods, condition which can lead to a problem). The brainstorming technique can be used for diagram construction.
Entry
Hole Quality
Knowledge and Operator
Experience
Material
MechanicalLaminate
Methods
Tool Changes
Chip Load
Backup
Hits per Tool
Drilling Program
Air
SpindleDrill Bits
Tooling Pins
Drill Bits
Machine
Surfaces
Spindle Speed
Fig. 9. Fishbone diagram of process drilling
The optimizing problem was identified through a fishbone diagram (Figure 9). It optimized the tool life and determined the cycle of drill repair and time to its change. The problem relates to materials, conditions and methods of drilling. Especially the change of drill bit geometry and tool life influence the quality of process [13]. Tool life is an economic factor which is generally small relative to other costs of production, because machining parameters giving ultra long life tend to reduce productivity. Therefore, it is high productivity that determines the operating parameters, while the operating environment determines the tool life. It is the knowledge of the relationship between actual tool life and the operating parameters which permits the definition of drill change criteria. This example of knowledge description is necessary for ITIL application.

87
The problem was solved by experiment. We observed the change of holes structure during drilling of 10000 holes on boards. We used 3 boards in stacks and we observed the differences between qualities of drilled holes depending on position of boards in stack. The result is prediction tool life (5000 hits for used drill bit size) and it is recommendation for production. This result leads to solution of the conflict and core problem in the manufacturing. 3.4. Cost and Time Analysis
Simple table (see Table 5) we used for time and other type of table for cost analysis. We
recorded the data on used material and process time according to drill hits. Results of records were used for process optimization proposal.
Tab. 5. Form for machine time record
Table A Machine Time
Drill bit size [mm]
No. of holes per
panel
Number of drilled panels
Total number of
drilled holes
Panels per drilled
stack
Totla No. of drilled
hits
Total No. of drilled
stack
Stacks per machine loads
Number of machine
loads
Drill time per load
[h]
Total machine time [h]
0,8 60 18 1080 3 360 6 1 6 0,3 1,80,9 150 18 2700 3 900 6 1 6 0,75 4,50,7 30 18 540 3 180 6 1 6 0,15 0,9
1 50 18 900 3 300 6 1 6 0,6 3,61,5 10 18 180 3 60 6 1 6 0,1 0,6
Total 300 90 5400 1,9 11,4 3.5. Mathematical process optimization
The TOC method or mathematical methods were used for process optimization on the basis
of process, cost and time analysis. Determination of optimum time for tool change (drill) is an example in case of drilling process. The solution should be obtained by real testing or research. The minimization of constraint and reduction of the cost and processes time are main optimizing criteria. A simple example of the use of mathematical graph method is presented below.
Task: The operator of a drilling process has to make 5 processes p1, p2, p3, p4, p5. The processes p1, p3, p5 can be start at the same time (parallel processes) and the processes p2, p4 can not to be start at the same time with other processes (because he has to operate separately each process). The task for planning is the determination of minimum time for implementation of all processes. All processes have same process time – 10 mins. For solution of this task we can use method of graph colouring and determination of maximum independent set (use of backtracking algorithm).
The vertex colouring and finding the maximum independent set is used for solution of our task. The vertex colouring is dividing the processes on parallel (sub)processes. The vertex is linked, if the process can’t be run in parallel (see Fig. 10). The colour number of graph in this case is three – it means we need 30 minutes process for diagnostic test.
The processes p1, p3, p5 are of the same colour, while of different colour are p2 and p4 . The parallel processes make to maximum independent set (3). In the case of complicated structure and tasks we can use algorithms for determination of colour number of graph and maximum independent set.

88
p1
p5
p4 p3
p2
Fig. 10. Graph model
3.6. Detailed model of key process
The detailed process model is the result of process modelling, and it is present way of describing the process. The eEPC (Extended Event-driven Process Chain) process model ARIS is used for modelling the process of drilling (Fig. 11). The left side of the model presents elementary procedures of process (function driven by event). The sub-process is linked with important attributes (risk factor, requirement knowledge, and data for process, process input and output). The ITIL library can be used for diagnostic process control. The right side is the example of diagnostic process model for process drilling. The Incident and Problem management defined by ITIL can be used for diagnostic process control as well.
Drilled PCB
Drilling
Diagnostic Part by ITIL
PCB is OK
Inspection
DiagnosticProcesses
Basic PCB
Next process
PCB is faulty
Diagnostic
Diagnosis
Risk Factor
Operator
NC DrillMachine
RequiremntKnowledge
Incident isService Failure
NC program
Incident isService Request
Incidentdetection
and recording
ServiceRequestHandling
IncidentMonitoring
and Escalation
IncidentManagement
Internal Customercontacts
Diagnostic Support
SelectIncident Type
NewIncidentrecorded
ExistingIncident
record updated
Continuation
Incident Record
Fig. 11. ARIS eEPC model of drilling process with diagnostics part

89
3.7. Process diagnostic system design The diagnostic system for process management contains these activities: - performance measurement system establishment, - diagnostic process design. Performance measurement system. The application of BSC method is demonstrated on
the drilling process. Table 6 contains the planned and the real values and their evaluation. The performance is also presented in Fig. 12. The metrics and indicators use different weight for calculation or estimation of the total process performance. Conditions and parameters for the measurement should be comparable all the time. The results of the process measurement should be compared with planned value and the difference of tolerance area should be indicated and analyzed by a responsible person - and this person is expected to correct the failure (incident) or process according the plan.
Drilling Process Perfomance during Year
y = 0,2375x + 0,3508
0%
20%
40%
60%
80%
100%
120%
140%
160%
180%
1 2 3 4 5
Quarter
Pers
pect
ive
wei
ghte
d m
ean
devi
atio
n av
erag
e
Financial perspective
Customer Perspectives
Internal Perspective
Learning and Growth perspective
Average
Linear trend
Fig. 12. Graph of process performance
Diagnostic process establishment. The ITIL library can be used for diagnostic process control. The examples of ITIL application were described in previous part. Figure 13 shows processes in the formation of knowledge databases. The inputs are incident report and problem report (outputs from problem and incident management processes). These records are stored in the knowledge database supported by IT application. The output of the knowledge database is a model of causes and events (see Fig. 14). Service team use this model as a support for the incident or problem classification and diagnosis decision-making.

90
Tab. 6. Process performance measurement - data
Process Performance Measurement by BSCMeasurement Interval: QuarterFinancial Perspective
Metrics Abs. value M Abs. value C O v % kv kv x OOverall Performance [-] 1,30 1,50 0,9 10,00 8,67 Weighted mean deviation 0,845
Customer PerspectiveInternal customer satisfaction [-] 2,30 1,20 1,9 1,00 1,92 Repair number [piece] 23,00 10,00 0,4 2,00 0,87 Weighted mean deviation 0,928
Internal Process PerspectiveDelay time [h] 15,00 15,00 1,0 2,00 2,00 Process cost [EUR] 13,00 20,00 1,5 5,00 7,69 Incident number [piece] 23,00 15,00 0,7 1,00 0,65 Risk factor [-] 120,00 50,00 0,4 4,00 1,67 Weighted mean deviation 0,883
Learning and Growth PerspectiveOperators satisfaction [-] 1,20 1,50 1,3 5,00 6,25 Training number [-] 4,00 2,00 2,0 6,00 12,00 Operators Productivity [-] 0,30 0,40 0,8 7,00 5,25 Absence from work [h] 18,00 10,00 0,6 4,00 2,22 Weighted mean deviation 0,607
Use abbreviation listTotal Process Performance M Real valuePerspective weighted mean deviation average C Target valueFinancial perspective 0,85 O Deviation - division C/M or M/CCustomer Perspectives 0,93 kv Weight coefficient of target valueInternal Perspective 0,88 Learning and Growth perspective 0,61 Average 0,82
KnowledgeDatabase
Incident Report
Problem Report Data recording Data reading Causes - eventmodel
Model of qualityfactor
input
storageoutput
IT Subsystemsupport
Fig. 13. Process model of knowledge database formation

91
SmearingTemperature causes
causesGeometry DrillBlunting Nail-heading
Delamination
Loose Fibres
Fig. 14. Model of causes and events
5. CONCLUSIONS The purpose of this paper was to present the new CQT methodology for business process
optimization. This methodology integrates the selected methods and tools for BPM. This methodology was presented and described above part. The benefits were:
support of business process management systems, quality improvement, cost and process time reduction, focus on diagnostics of processes.
The real application and verification was described in the case study. As we can see the increasing trend of the process performance in Fig. 12 is the evidence that CQT methodology leads to improve the process and achieve the main objectives of BPM application (cost and time reduction, quality).
The CQT methodology reflects new point of view, called Corporate Performance Management (CPM), in business process management area. The concept of Corporate Performance Management was introduced by Gartner Group to describe the combination of “process, methodologies, metrics and technologies to measure, monitor and manage the performance of the business”. CPM is thus directed at continuous monitoring of the effectiveness of the results of all company processes and constant optimization thereof, i.e. its objective is a monitoring system that continuously monitors the business performance of all relevant business processes, detects and reports weaknesses and problem situations, ideally even suggests optimization options, and evaluates the success of improvement measure. And process performance itself might be regarded as the heart of CPM [1]
A comprehensive development of CQT methodology for business process optimization on base of CPM would be one possible direction for further work. Acknowledgments
This research is supported by the research plan MSM4977751310 “Diagnostics of
interactive processes in electrical engineering“.
References [1] SCHEER A-W., JOST W., HESS H. and KRONY A.: Corporate Performance Management, ARIS in
Practice, Springer, Berlin, 2005
92
[2] KŁOS S.: The Method of Effective Reengineering of Business Processes in Project-Driven Enterprise, Applied Computer Science, Wydawnictwo Akademii Techniczno-Humanistycznej w Bielsku-Białej, Vol. 1, No 1, 2005, p. 7-10
[3] http://ieeexplore.ieee.org [4] http://www.sciencedirect.com [5] http://proquest.umi.com [6] ZHOU Y. and Chen Y: The Methodology for Business Process Optimized Design, Industrial Electronics
Society, The 29th Annual Conference of the IEEE , vol.2, no.pp. 1819- 1824 Vol.2, 2-6 Nov. 2003 [7] BECKETT R.C.: Determining the anatomy of business systems for a virtual enterprise, Computers in
Industry, No.51, pp.127-138, 2003 [8] JANG K.: A model decomposition approach for a manufacturing enterprise in Business Process
Reengineering, Int. J. Computer Integrated Manufacturing, Vol.16, No.3, pp.210-218, 2003 [9] SCHEER A.-W., ABOLHASSAN F., JOST, W., KIRCHNER M.: Business Process Excellence,
Springer, Berlin, 2002 [10] GOLDRATT E. M.: The Theory of Constraints and How it should be Implemented, North River Press.
1990 [11] http://www.itil.co.uk [12] BRENNER M.: Classifying ITIL Processes A Taxonomy under Tool Support Aspects. [13] ROSS W. M.: Comprehensive Guide to The Design and Manufacture of Printed Board Assemblies,
Volume 2, Manufacture, Quality Assurance and the Environment, Port Erin, 1998 [14] TUPA J., BASL J., STEINER, F. and SKOČIL V.: Measurement of manufacturing
processes, Proceedings of the First Manufacturing Engineering Society International Conference, Cádiz, Spain, 2005, pp. 1-8
[14] TUPA, J.: New CQT Technological Process Methodology, Doctoral Thesis UWB in Pilsen, Pilsen, 2006