Monitoring Programmes for Implementation in South African ...

Implementation of the African Food
Safety Index and biennial review of food
safety control based on set indicators
1
PACA Secretariat, AU Commission
Africa Food Safety Conference 20214 August 2021
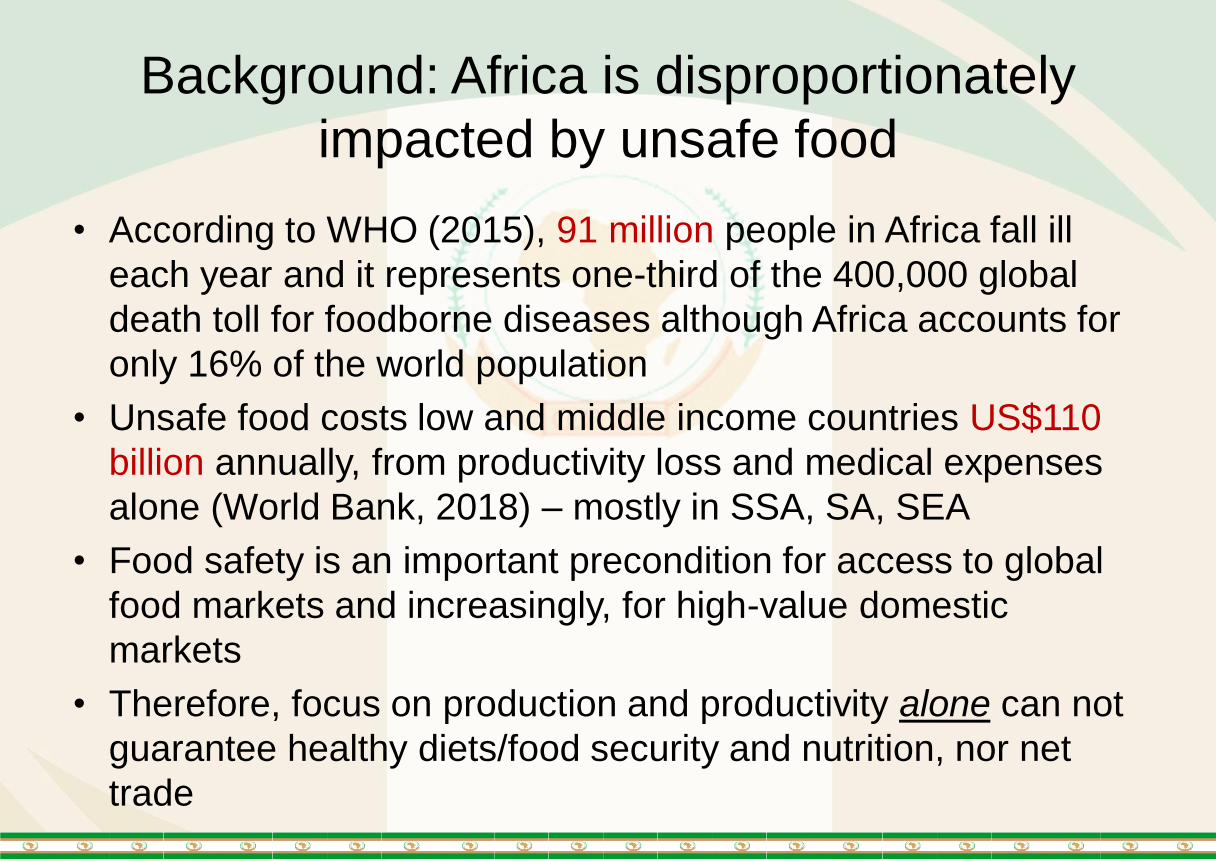
Background: Africa is disproportionately
impacted by unsafe food
• According to WHO (2015), 91 million people in Africa fall ill
each year and it represents one-third of the 400,000 global
death toll for foodborne diseases although Africa accounts for
only 16% of the world population
• Unsafe food costs low and middle income countries US$110
billion annually, from productivity loss and medical expenses
alone (World Bank, 2018) – mostly in SSA, SA, SEA
• Food safety is an important precondition for access to global
food markets and increasingly, for high-value domestic
markets
• Therefore, focus on production and productivity alone can not
guarantee healthy diets/food security and nutrition, nor net
trade

Food safety is crucial to attainment of AU Malabo
Declaration Commitments
• In 2014, AU leaders signed Malabo Declaration on Accelerated Agriculture Growth and Transformation for Shared prosperity and Improved Livelihoods in Africa
• Among the seven Malabo Commitments (targets to be achieved by 2025), food safety is crucial to achieve the following:
– Ending hunger: Malabo Decl. 3d
– Tripling intra-Africa trade: Malabo Decl. 5a &b
– Halving poverty: Malabo Decl. 4
• ‘Malabo Declaration’ also committed AU member states to Mutual Accountability, which requires to conduct a Biennial Review of Agriculture and related sectors: tracking, monitoring and reporting on progress
• However, food safety not adequately captured when the Biennial Review was launched.

“Biennial Review” and food safety
• The inaugural biennial review report was presented to the January 2018 Summit with 43 indicators
• Food safety is part of the Malabo Declaration Implementation Plan but was not tracked in the First Biennial Review
• The BR has seven indicators tracking nutrition outcomes, which is a move in the right direction.
• However, among 43 indicators in the BR, food safety is not adequately captured.
• Food safety identified as one of the gaps in the first BR, as unsafe foods will hold back Commitments 3, 4, and 5 on ending hunger, poverty reduction (raising incomes), and tripling intra-African trade in agricultural commodities
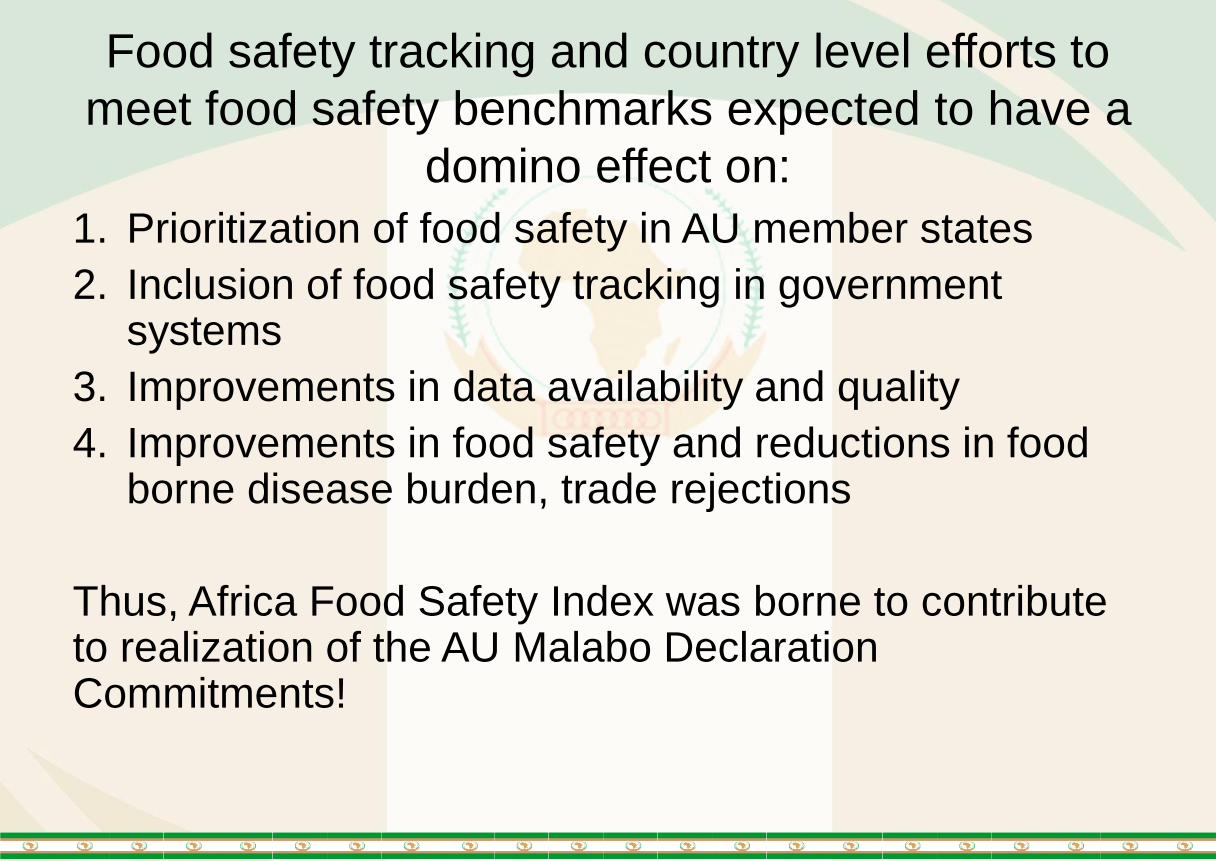
Food safety tracking and country level efforts to
meet food safety benchmarks expected to have a
domino effect on:
1. Prioritization of food safety in AU member states
2. Inclusion of food safety tracking in government systems
3. Improvements in data availability and quality
4. Improvements in food safety and reductions in food borne disease burden, trade rejections
Thus, Africa Food Safety Index was borne to contribute to realization of the AU Malabo Declaration Commitments!

Steps in institutionalizing food safety (AFSI)
through AU BR
• Stakeholder consultation
• Development of the index
• Establishment of Food Safety Experts Network (FSEN)
• Capacity building training to national experts and
technical backstopping using FSEN members
• Development of a bi-directional digital platform for data
submission/reporting – alignment to the AU eBiennial
• Data collection and submission
• Validation studies to improve AFSI

Consultations (mostly expert) on inclusion of
food safety indicator in the 2nd Malabo BR
Experts at
4th CAADP
Partnership
Platform
recommend
ed to
include food
safety in 2nd
BR,
Libreville
BR Experts
Task Force
identified
food safety
as one of
the critical
gaps,
Cotonou
April 2018 May 2018
PRC of AU
appreciated
the efforts to
initiate food
safety
tracking in
the 2nd BR,
AUC
BR
Technical
Working
Group Lead
Experts
approved
inclusion of
AFSI in BR,
AUCAug 2018
Writeshop
to draft the
Africa
Food
Safety
Index,
AUC
Sep 2018
PACA
PPM
reviewed
draft
AFSI,
Dakar
Peer-to-
Peer
Meeting of
AU MS
endorsed
inclusion
of AFSI,
Nairobi
A side event at
the 1st
FAO/WHO/AU
Int. Food
Safety Conf.
applauded
AFSI, AUC
Oct 2018 Feb 2019

Structure of AFSI: What is measured?
Food Safety Trade Indicator (FSTI)
Food Safety Systems Indicator (FSSI)
Food Safety Health Indicator (FSHI)
Africa Food
Safety Index (AFSI)
AFSI is composed of three indicators looking at two dimensions in an attempt to capture the complexity of food safety; taking into account the state of data availability and country level capacity but also ned to drive improvements towards optimal systems
Food safety outcome indicators
Indicator on country preparedness to improve food safety
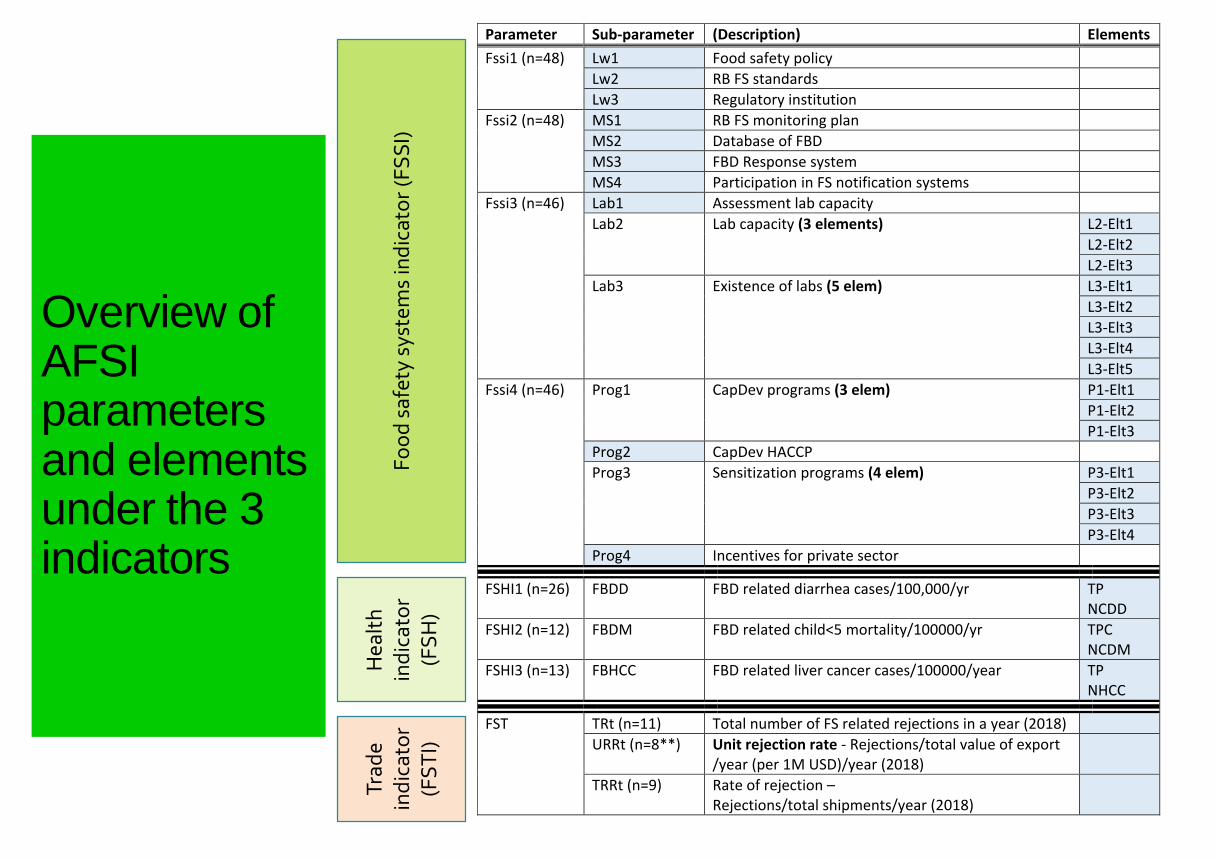
Parameter Sub-parameter (Description) Elements
Fssi1 (n=48) Lw1 Food safety policy
Lw2 RB FS standards
Lw3 Regulatory institution
Fssi2 (n=48) MS1 RB FS monitoring plan
MS2 Database of FBD
MS3 FBD Response system
MS4 Participation in FS notification systems
Fssi3 (n=46) Lab1 Assessment lab capacity
Lab2 Lab capacity (3 elements) L2-Elt1
L2-Elt2
L2-Elt3
Lab3 Existence of labs (5 elem) L3-Elt1
L3-Elt2
L3-Elt3
L3-Elt4
L3-Elt5
Fssi4 (n=46) Prog1 CapDev programs (3 elem) P1-Elt1
P1-Elt2
P1-Elt3
Prog2 CapDev HACCP
Prog3 Sensitization programs (4 elem) P3-Elt1
P3-Elt2
P3-Elt3
P3-Elt4
Prog4 Incentives for private sector
FSHI1 (n=26)
FBDD FBD related diarrhea cases/100,000/yr TP NCDD
FSHI2 (n=12)
FBDM FBD related child<5 mortality/100000/yr TPC NCDM
FSHI3 (n=13)
FBHCC FBD related liver cancer cases/100000/year TP NHCC
FST TRt (n=11) Total number of FS related rejections in a year (2018)
URRt (n=8**)
Unit rejection rate - Rejections/total value of export /year (per 1M USD)/year (2018)
TRRt (n=9) Rate of rejection – Rejections/total shipments/year (2018)
Fo
od
saf
ety
syst
ems
ind
icat
or
(FS
SI)
Hea
lth
in
dic
ato
r (F
SH
)
Trad
e in
dic
ato
r (F
ST
I)
Overview of AFSI parameters and elements under the 3 indicators

Scoring of the AFSI: like any index AFSI is a score
AFSI
FSSI FSHI FSTI
FSSI1
FSSI2
FSSI3
FSSI4
FSHI1
FSHI2
FSHI3
FSTI1
Africa Food Safety Index
Note: AFSI is scored as arithmetic mean of the 3 indicators (sub-indices), which are in turn average of respective parameters and elements
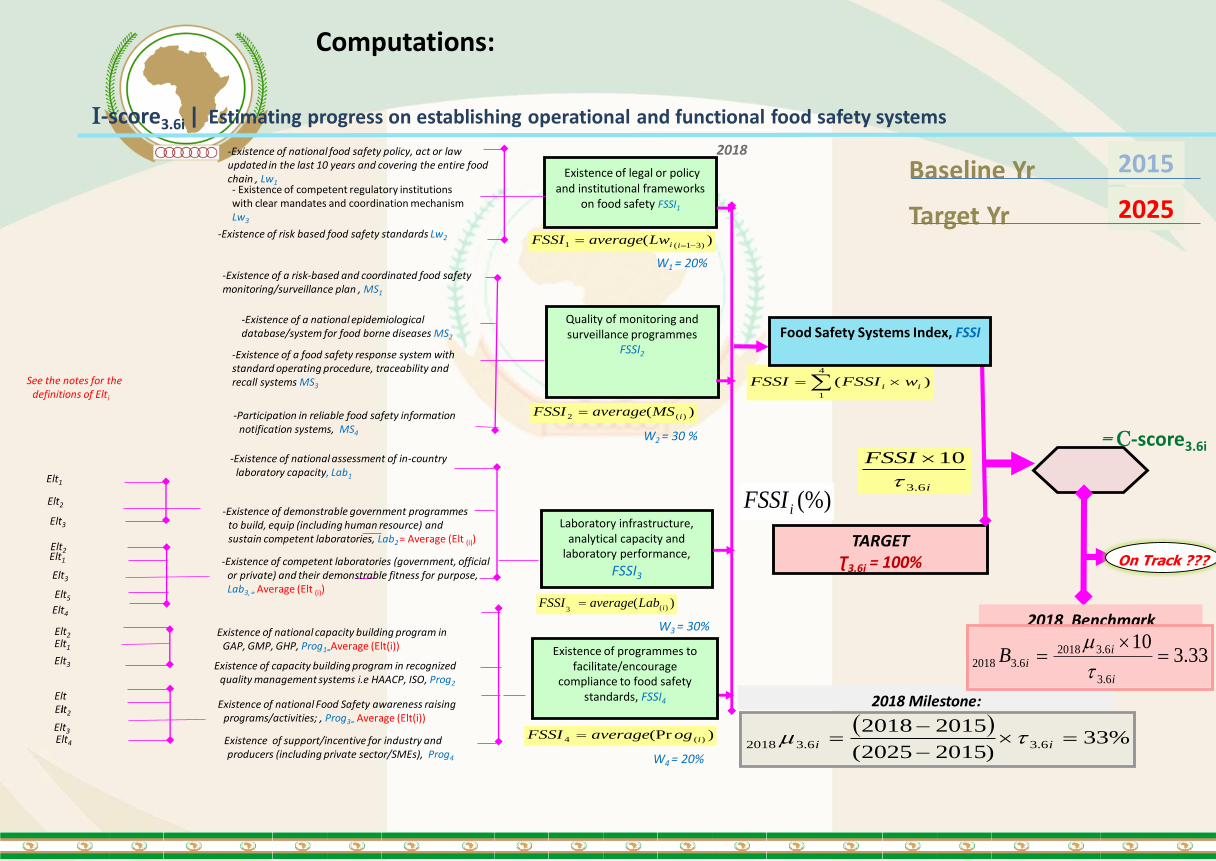
I-score3.6i ǀ Estimating progress on establishing operational and functional food safety systems
Existence of legal or policy and institutional frameworks
on food safety FSSI1
2018
TARGETƮ3.6i = 100%
i
FSSI
6.3
10
(%)iFSSI
Baseline Yr 2015
Target Yr 2025
)(4
1
ii wFSSIFSSI
Quality of monitoring and surveillance programmes
FSSI2
Laboratory infrastructure, analytical capacity and
laboratory performance,
FSSI3
Existence of programmes to facilitate/encourage
compliance to food safety standards, FSSI4
W1 = 20%
W2 = 30 %
W3 = 30%
W4 = 20%
-Existence of national food safety policy, act or law updated in the last 10 years and covering the entire food chain , Lw1
-Existence of risk based food safety standards Lw2
- Existence of competent regulatory institutions with clear mandates and coordination mechanism Lw3
)()31(1
iiLwaverageFSSI
-Existence of a risk-based and coordinated food safety monitoring/surveillance plan , MS1
-Existence of a national epidemiological database/system for food borne diseases MS2
-Existence of a food safety response system with standard operating procedure, traceability and recall systems MS3
-Participation in reliable food safety information notification systems, MS4
-Existence of demonstrable government programmesto build, equip (including human resource) and sustain competent laboratories, Lab2 = Average (Elt (i))
-Existence of national assessment of in-country laboratory capacity, Lab1
)( )(3 iLabaverageFSSI
Existence of national capacity building program in GAP, GMP, GHP, Prog1=Average (Elt(i))
)(Pr )(4 iogaverageFSSI
2018 Milestone:
%33
)20152025(
201520186.36.32018
ii
= C-score3.6i
On Track ???
2018 Benchmark
33.310
6.3
6.320186.32018
i
iiB
)( )(2 iMSaverageFSSI
-Existence of competent laboratories (government, official or private) and their demonstrable fitness for purpose, Lab3, = Average (Elt (i))
Existence of capacity building program in recognized quality management systems i.e HAACP, ISO, Prog2
Existence of national Food Safety awareness raising programs/activities; , Prog3= Average (Elt(i))
Existence of support/incentive for industry and producers (including private sector/SMEs), Prog4
Food Safety Systems Index, FSSI
Elt1
Elt2
Elt3
Elt2
Elt3
Elt5
Elt1
Elt2
Elt3
Elt1
Elt2
Elt3Elt4
Elt1
See the notes for the definitions of Elti
Elt4
Computations:
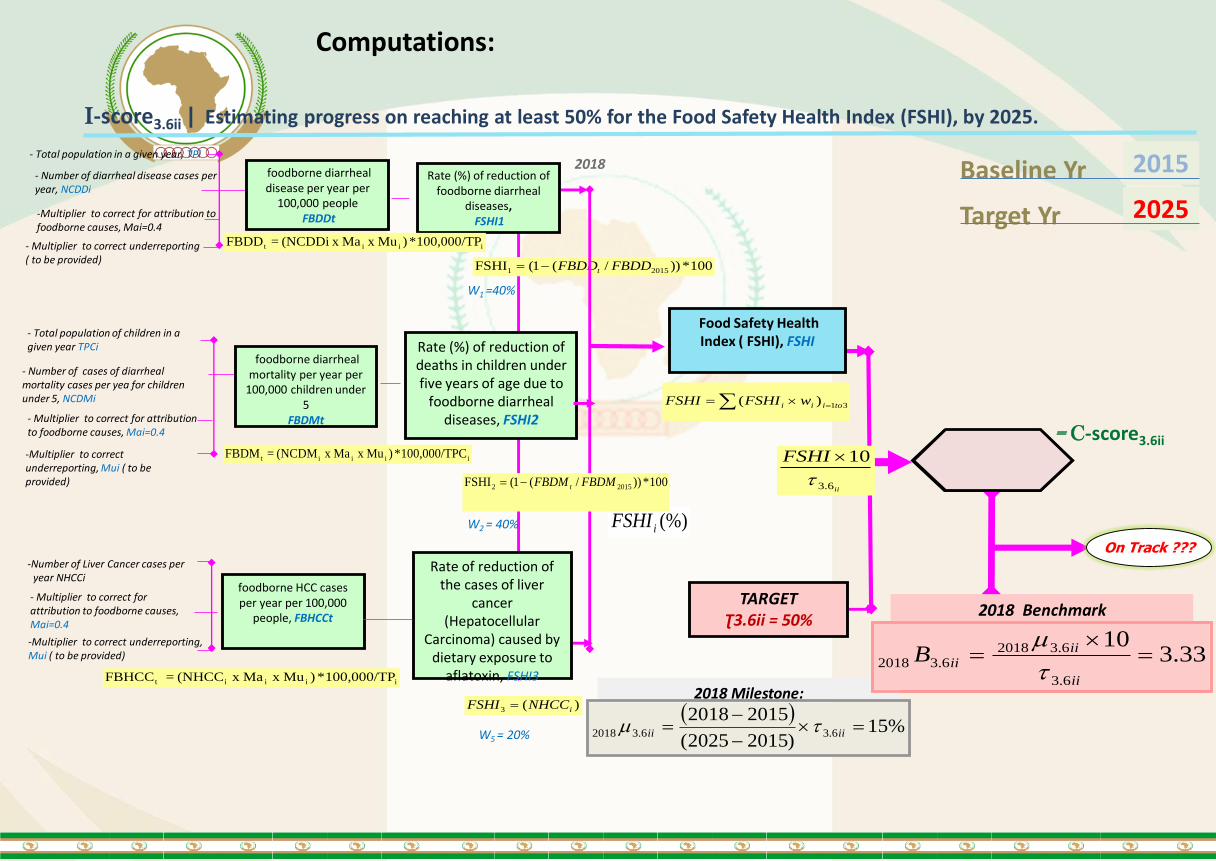
I-score3.6ii ǀ Estimating progress on reaching at least 50% for the Food Safety Health Index (FSHI), by 2025.
2018
TARGETƮ3.6ii = 50%
I-score3.6ii
On Track ???
ii
FSHI
6.3
10
(%)iFSHI
Food Safety Health Index ( FSHI), FSHI
Baseline Yr 2015
Target Yr 2025
31)( toiii wFSHIFSHI
W1 =40%
W2 = 40%
W5 = 20%
- Total population in a given year, TPi
- Number of diarrheal disease cases per year, NCDDi
100*))/(1(FSHI 20151 FBDDFBDDt
- Total population of children in a given year TPCi
-Multiplier to correct underreporting, Mui ( to be provided)
-Number of Liver Cancer cases per year NHCCi
2016 Benchmark
33.310
6.3
6.320182.12018
iii
iiiB
2018 Milestone:
%15
)20152025(
201520186.36.32018
iiii
= C-score3.6ii
2018 Benchmark
33.310
6.3
6.320186.32018
ii
iiiiB
-Multiplier to correct for attribution to foodborne causes, Mai=0.4
- Multiplier to correct underreporting ( to be provided)
- Number of cases of diarrheal mortality cases per yea for children under 5, NCDMi
- Multiplier to correct for attribution to foodborne causes, Mai=0.4
Rate (%) of reduction of foodborne diarrheal
diseases, FSHI1
Rate (%) of reduction of deaths in children under five years of age due to
foodborne diarrheal diseases, FSHI2
Rate of reduction of the cases of liver
cancer (Hepatocellular
Carcinoma) caused by dietary exposure to
aflatoxin, FSHI3
100*))/(1(FSHI 20152 FBDMFBDM t
)(3 iNHCCFSHI
foodborne diarrheal disease per year per
100,000 peopleFBDDt
ii it 100,000/TP*)Mux Ma x (NCDDi = FBDD
foodborne diarrheal mortality per year per
100,000 children under 5
FBDMt
iiiit C100,000/TP*)Mu x Ma x (NCDM = FBDM
foodborne HCC cases per year per 100,000
people, FBHCCt
iiiit 100,000/TP*)Mu x Ma x (NHCC =FBHCC
2018
-Multiplier to correct underreporting, Mui ( to be provided)
- Multiplier to correct for attribution to foodborne causes, Mai=0.4
Computations:

I-score3.6iii ǀ Estimating progress on reaching at least 50% for the Food Safety Trade Index (FSTI)
2018
TARGETƮ3.6iii = 50%
Food Safety Trade Index, FSTI
Baseline Yr 2015
Target Yr 2025
Rate of reduction in unit rejection of food
commodities due to food safety violation
(non-compliance) disaggregated by type of
violation, FSTp1
Total value of shipment of food commodities exported per year TVSt
Number of rejected shipments based on food safety related trade violations in exported food commodities per year, TRt
Violation type 1 and number of rejection TRV1
2018 Milestone:
%15
)20152025(
201520186.36.32018
iiiiii
Violation type 2 and number of rejection TRV2
Violation type 3 and number of rejection TRV3
Other violations and number of rejections TRV4
RRV1=TRV1*100/TNS
RRV2=TRV2*100/TNS
RRV3=TRV3*100/TNS
RRV4=TRV4*100/TNS
iii
FSTI
6.3.
10
TRt = ∑(TRV(i))
2018 Benchmark
33.310
6.3
6.320186.32018
iii
iiiiiiB
000,000,1*/ USDTVTRURRt
t
On Track ???
= C-score3.6ii
Computations:
Regional considerations in the design of
AFSI indicators
• Dietary staples prone to aflatoxin account for over 60% of calorie intakes in Africa
• Aflatoxin occurs in 80% of crop samples, often at levels unfit for human consumption
• Biomarker assays of human body fluids also show high exposure of African populations to aflatoxin
• Liver cancer is the number one cause of cancer mortality in Africa
• Up to 40% of liver cancer cases attributed to aflatoxin
• It was important to capture public health impacts of both microbial and chemical hazards especially aflatoxin
• The following slides show why liver cancer was one of the health indicators
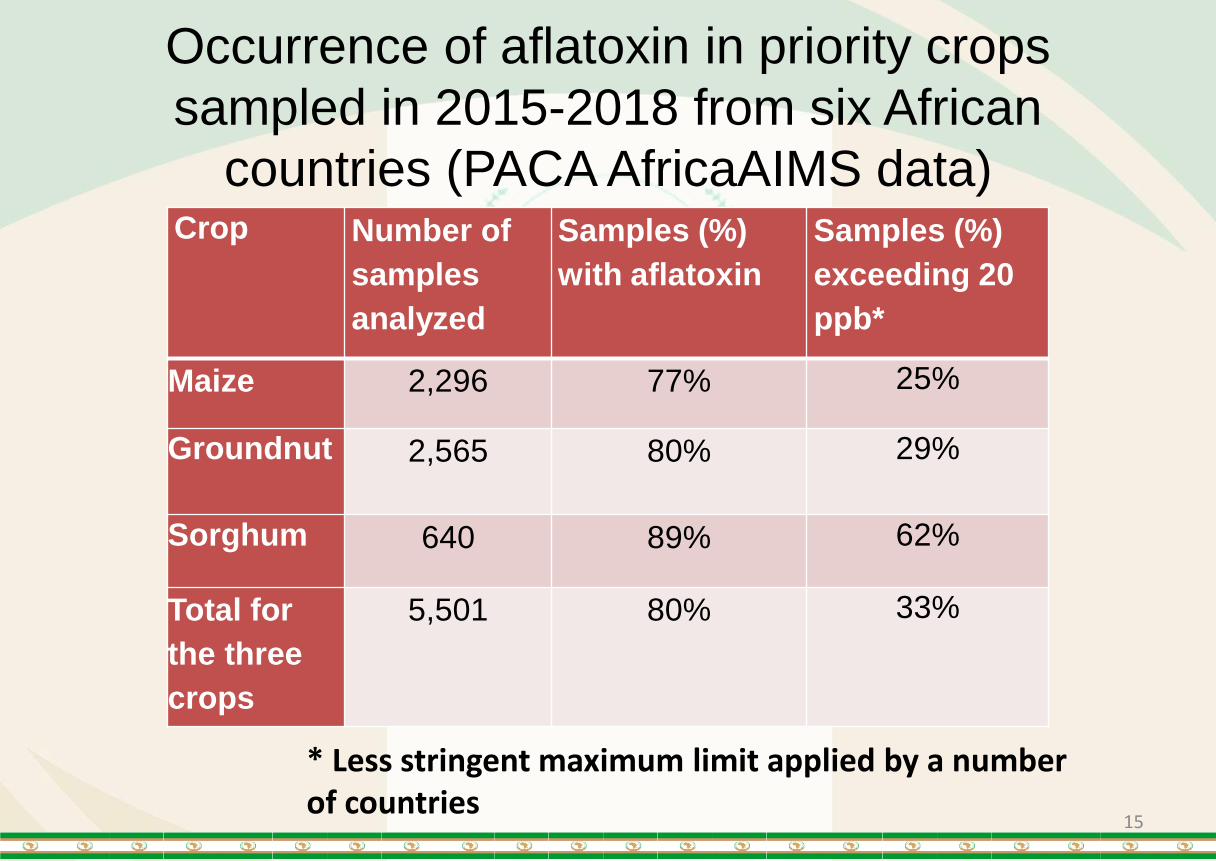
Occurrence of aflatoxin in priority crops
sampled in 2015-2018 from six African
countries (PACA AfricaAIMS data)Crop Number of
samples
analyzed
Samples (%)
with aflatoxin
Samples (%)
exceeding 20
ppb*
Maize 2,296 77% 25%
Groundnut 2,565 80% 29%
Sorghum 640 89% 62%
Total for
the three
crops
5,501 80% 33%
15
* Less stringent maximum limit applied by a number of countries

Aflatoxin is a priority food safety issue for Africa:
harmful +widespread + hits staple foods/ grains

Extent of data submission in 2019: 49 of the 55 AU MS
submitted data on at least 1 of the three AFSI indicatorsIndicator Parameter Number of
countries
Food Safety Systems
Indicator
Legal, policy and institutional frameworks 48
Monitoring and surveillance programs 48
Lab infrastructure, analytical capacity and
lab performance
46
Programs to facilitate compliance to
standards
46
Food safety health
indicator
Rate of reduction in food borne diarrheal
diseases
26
Rate of reduction in diarrheal mortality in
children under 5
12
Rate of reduction in liver cancer cases
caused by dietary exposure to aflatoxin
13
Food safety trade indicator Rate of reduction in unit rejection of food
commodities due to food safety violation
(non-compliance) disaggregated by type of
violation
8-11

AFSI validation studies: relevance, usability
and validity of AFSI • Three-pronged approach of validation:
1. Online questionnaire
2. Focus group interview (data collectors and submitters) and stakeholder meetings in a sample of 9 countries
3. Analysis of the actual 2019 data (qualitative and Item Response Theory analysis)
• In general, need to improve ability of parameters to discriminate among countries with below average to average systems
• Overall, there is a need for capacity boost in food safety data collection and submission at country level for better data availability
• Some improvements made in AFSI for the 2021 data collection and capacity building trained continued; more systemic capacity improvements will be needed

Item Response Theory (IRT) analysis showed that
some of the parameters were able to discriminate
among countries with below average to average
systems (unpublished, credit: ILRI)

Future prospects of AFSI
• Further data collection in 2021, 2023, and 2025
• Further assessment and continuous improvement, at
the risk of losing comparability of successive data
points
• Develop AFSI into food safety data hub for Africa
– Develop data architecture for generating data beyond AU
BR
– Seek data sharing collaborations
– Negotiate data sharing protocols, in the end the success of
AFSI will depend on how much data is available for users

How the AFSI is contributing to solutions faced in
Intra-regional and extra regional trade
• Countries are prioritising food safety
• AFSI is creating a culture of reporting on food safety as it is embedded in government systems– Therefore easing regional and extra regional trade
– Access to food safety data will enhance how effectively and efficiently countries can fully utilize the AfCFTA
• Countries are able to address their food systems based on gaps identified in the data reported on AFSI– Therefore encouraging continuous improvement of national food
systems
• Prospects of the establishment of a food safety data hub will in future allow for a one stop shop for food safety information on the continent – Therefore, Africa will witness iimprovements in data availability and
quality

We thank our partners in AFSI: