Implementation of Systems Engineering Lifecycle-Tools ...
16
J. Eng. High. Tech., 1(2)1-16,2015 © 2015, TextRoad Publication ISSN 2356-8860 Journal of Engineering and Higher Technology (JEHT) www.textroad.com *Corresponding Author: A. M. El-kamash, 1. Head of Radioactive Waste Management Division, Hot Laboratory, Atomic Energy Authority of Egypt Implementation of Systems Engineering Lifecycle-Tools-Model Framework on large industrial scale A. M. El-kamash 1 , Islam. H. Afefy 2 , Nihal M.A. El-Sayar 3 1. Head of Radioactive Waste Management Division, Hot Laboratory, Atomic Energy Authority of Egypt 2. Assistant professor, Industrial Engineering Dept, Engineering Faculty, Fayoum University, Fayoum, Egypt 3. P.G. Student, Industrial Engineering Dept, Engineering Faculty, Fayoum University, Fayoum, Egypt Received: April 19, 2015 Accepted: August 31, 2015 ABSTRACT Systems engineering lifecycle-tools-model framework (SELTMF) based on integrating ISO/IEC 15288 with seven point of view architecture framework is presented. The developed framework consider service oriented point of view in addition to the common point of views suggested in the British ministry of defense architecture framework. Studied key performance indicators included financial, internal business, quality, innovation learning and integrated measures. The proposed framework is implemented on the Egyptian Company for Development Industries. The results helped in identifying the problems that face the company on different levels including production and administration. After the implementation, it was found that the total production time decreased by 52.1% and the total productivity increased by 28.1%. KEYWORDS: Systems Engineering, Lifecycle analysis, performance indicator, productivity 1. INTRODUCTION The application of systems engineering (SE) tools is considered an important task to reduce risks associated with the establishment of new systems and/or modifying complex systems. These tools are dependent on system lifecycle simulation and evaluation of system performance. The identification and inclusion of performance indicators measures is a critical step to ensure that the system evaluation process is reliable. Overall Equipment Effectiveness is one of the performance evaluation methods that are most common and popular in the production industries [1]. Beilei et.al [2] discussed an evaluation methodology by considering a documentation matrix, which included process flow diagram and value tool documentation to analyze the necessity and redundancy of the process. Ghader et.al [3] identified Key Performance Indicator measure (KPI)s of the equipment and production machinery in Idem Company, Tabriz, Iran. Overall equipment effectiveness is a kind of measurement tool which is used in total productive, repair and maintenance and shows how effectively the machinery functions [4]. This work is a continuations of our previous work in which, the implementation of total productive maintenance and overall equipment effectiveness evaluation was introduced and the presentation of tools-model framework application in industry was tested [5, 6]. These efforts proved that the framework could be used to improve both the productivity and the economy of the production process. In this work, the framework will be applied to large scale industry, to identify the problems that face the establishment then address these problems by proposing changes in the routine work and finally implement the proposed changes on the process. 2. Systems Engineering Applications in Varied Fields The Systems Engineering (SE) is applied to varied fields such as education, lawmaking, energy, human integrations, etc. as it could be presented at industry or service. Applying SE in education describe or discuss (1) issues which need to be addressed for the creation of curricula and professional degree programs in Service Systems Engineering (SSE) at the graduate level; (2) the development of an autonomous litter collecting robot as a vehicle for combining several systems design and engineering tools in a real multidisciplinary student project. Clyde and Yacov [7] investigated the needs, requirements, and challenges associated with the academic and professional certification of systems engineers, given the breadth and depth required of them, and especially the specific domain knowledge and expertise required supplementing their competence in SE. David [8] applied the methodologies of SE to the design of laws of government. The SE approach will bring the knowledge and expertise of investigative science and engineering to bear upon the design, operation, follow up evaluation, and optimization of laws that effectively solve societal problems. The standards have been evolving from the United States (US) Military to international and commercial, with recent standards taking a broader scope. Two capability maturity models have been merged into a third, which is tied to the standards [9, 10]. SE can be applied on all projects: small, large, simple, or complex. The degree of formality and rigor applied to the SE process will vary depending on the complexity of the project. This is called tailoring. All projects need to be 1
Transcript of Implementation of Systems Engineering Lifecycle-Tools ...
J. Eng. High. Tech., 1(2)1-16,2015
© 2015, TextRoad Publication
ISSN 2356-8860
Journal of Engineering and
Higher Technology (JEHT)
www.textroad.com
*Corresponding Author: A. M. El-kamash, 1. Head of Radioactive Waste Management Division, Hot Laboratory, Atomic
Energy Authority of Egypt
Implementation of Systems Engineering Lifecycle-Tools-Model Framework
on large industrial scale
A. M. El-kamash1, Islam. H. Afefy2, Nihal M.A. El-Sayar3
1. Head of Radioactive Waste Management Division, Hot Laboratory, Atomic Energy Authority of Egypt
2. Assistant professor, Industrial Engineering Dept, Engineering Faculty, Fayoum University, Fayoum, Egypt
3. P.G. Student, Industrial Engineering Dept, Engineering Faculty, Fayoum University, Fayoum, Egypt Received: April 19, 2015
Accepted: August 31, 2015
ABSTRACT
Systems engineering lifecycle-tools-model framework (SELTMF) based on integrating ISO/IEC 15288 with seven
point of view architecture framework is presented. The developed framework consider service oriented point of
view in addition to the common point of views suggested in the British ministry of defense architecture framework.
Studied key performance indicators included financial, internal business, quality, innovation learning and integrated
measures. The proposed framework is implemented on the Egyptian Company for Development Industries. The
results helped in identifying the problems that face the company on different levels including production and
administration. After the implementation, it was found that the total production time decreased by 52.1% and the
total productivity increased by 28.1%.
KEYWORDS: Systems Engineering, Lifecycle analysis, performance indicator, productivity
1. INTRODUCTION
The application of systems engineering (SE) tools is considered an important task to reduce risks associated
with the establishment of new systems and/or modifying complex systems. These tools are dependent on system
lifecycle simulation and evaluation of system performance. The identification and inclusion of performance
indicators measures is a critical step to ensure that the system evaluation process is reliable. Overall Equipment
Effectiveness is one of the performance evaluation methods that are most common and popular in the production
industries [1]. Beilei et.al [2] discussed an evaluation methodology by considering a documentation matrix, which
included process flow diagram and value tool documentation to analyze the necessity and redundancy of the
process. Ghader et.al [3] identified Key Performance Indicator measure (KPI)s of the equipment and production
machinery in Idem Company, Tabriz, Iran. Overall equipment effectiveness is a kind of measurement tool which is
used in total productive, repair and maintenance and shows how effectively the machinery functions [4].
This work is a continuations of our previous work in which, the implementation of total productive
maintenance and overall equipment effectiveness evaluation was introduced and the presentation of tools-model
framework application in industry was tested [5, 6]. These efforts proved that the framework could be used to
improve both the productivity and the economy of the production process. In this work, the framework will be
applied to large scale industry, to identify the problems that face the establishment then address these problems by
proposing changes in the routine work and finally implement the proposed changes on the process.
2. Systems Engineering Applications in Varied Fields The Systems Engineering (SE) is applied to varied fields such as education, lawmaking, energy, human
integrations, etc. as it could be presented at industry or service. Applying SE in education describe or discuss (1)
issues which need to be addressed for the creation of curricula and professional degree programs in Service Systems
Engineering (SSE) at the graduate level; (2) the development of an autonomous litter collecting robot as a vehicle
for combining several systems design and engineering tools in a real multidisciplinary student project. Clyde and
Yacov [7] investigated the needs, requirements, and challenges associated with the academic and professional
certification of systems engineers, given the breadth and depth required of them, and especially the specific domain
knowledge and expertise required supplementing their competence in SE. David [8] applied the methodologies of
SE to the design of laws of government. The SE approach will bring the knowledge and expertise of investigative
science and engineering to bear upon the design, operation, follow up evaluation, and optimization of laws that
effectively solve societal problems. The standards have been evolving from the United States (US) Military to
international and commercial, with recent standards taking a broader scope. Two capability maturity models have
been merged into a third, which is tied to the standards [9, 10].
SE can be applied on all projects: small, large, simple, or complex. The degree of formality and rigor applied to
the SE process will vary depending on the complexity of the project. This is called tailoring. All projects need to be
1
El-kamash et al., 2015
assessed for the amount of formal SE processes needed. Projects can be tailored up, more formality, for more
complex projects as well as tailored down for simpler projects. The SE discipline emerged as an effective way to
manage complexity and change. Both complexity and change have escalated in our products, services, and society.
Reducing the risk associated with new systems or modifications to complex systems continues to be a primary goal
of the systems engineer [11, 12].
3. Proposed KPIs
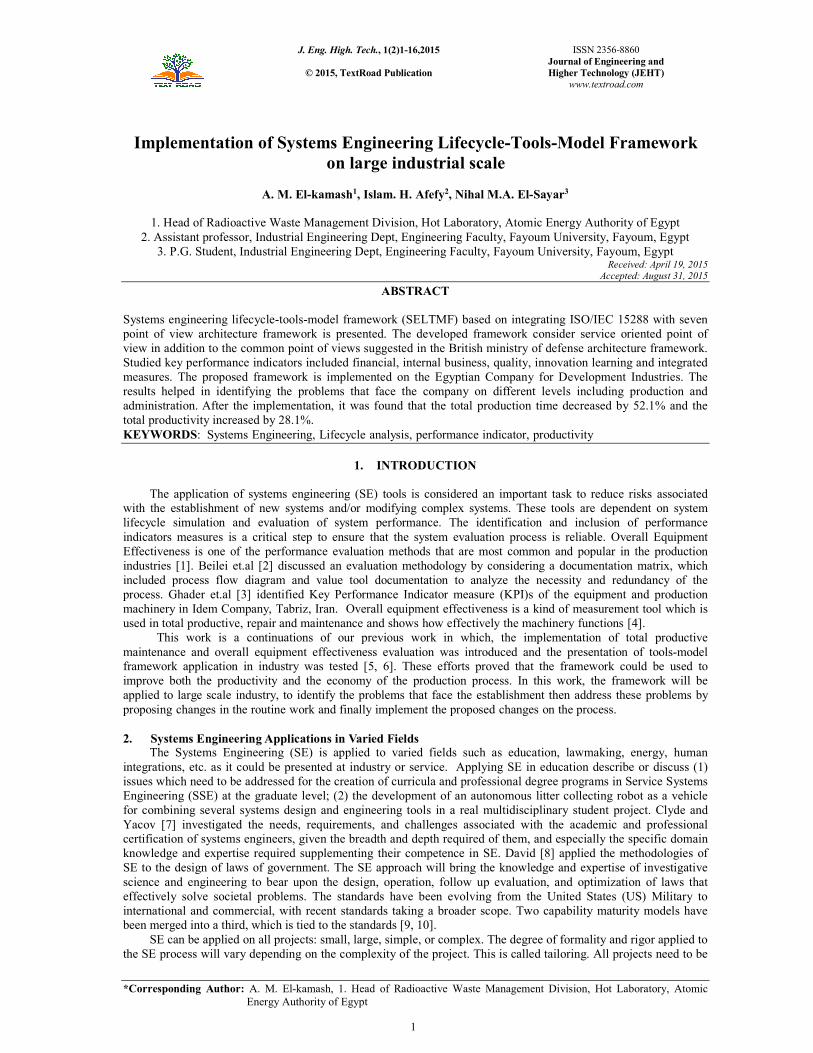
The Proposed KPIs are presented in Figure 1. Evaluate business trend are categorized five class in financial,
internal business, quality, innovation learning and integrated measures. Proposed KPIs are used to assess the system
and compare between the situation before and after applying the systems engineering tools framework (SETF).
These measures are applied to the application firm during two periods one before applying the SELTMF and the
other one is after the application of this proposed model as an assessment method. Each period is three months
means a quarter of the year (Qrt), the first Qrt. presents the firm state before applying proposed SELTMF model and
the second Qrt.
Figure 1: Proposed KPIs.
4. The Proposed SELTMF Model Verification
The proposed model SELTMF presents a framework integrating the main three activities of SE which
contribute to system development in several ways. Simulation of the high level operating concept models can
contribute to a deeper understanding of the big picture and the requirements, this puts on the system of interest
(SOI). Executable models can also serve as a communication tool for different stakeholders to express their needs.
An executable model depicting the big picture can also be used to try out alternative concepts; a prototype can for
example be tested in this virtual operational environment to evaluate to what extent the suggested solutions fulfill
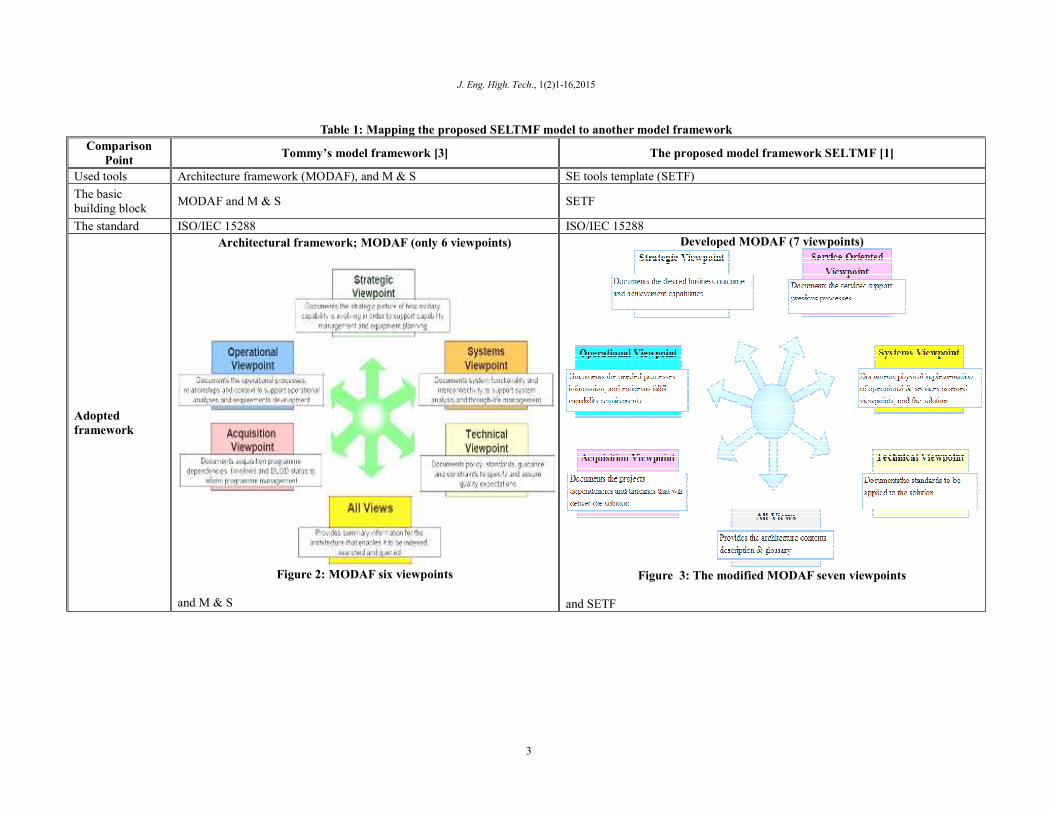
the stakeholders needs. Table 1 illustrates a simple comparison between this theses proposed model framework to
one of the previous models frameworks that is Tommy’s model framework [13, 14, 15, 16] as an example. Tommy,
in his framework, depended on integrating the ISO/IEC 15288 system lifecycle processes and stages as illustrated by
Figure 6. He used the architectural framework represented in British Ministry of Defense Architecture Framework
(MODAF) with six viewpoints as illustrated by Figure 2, as an architectural tool, for the description of all solutions
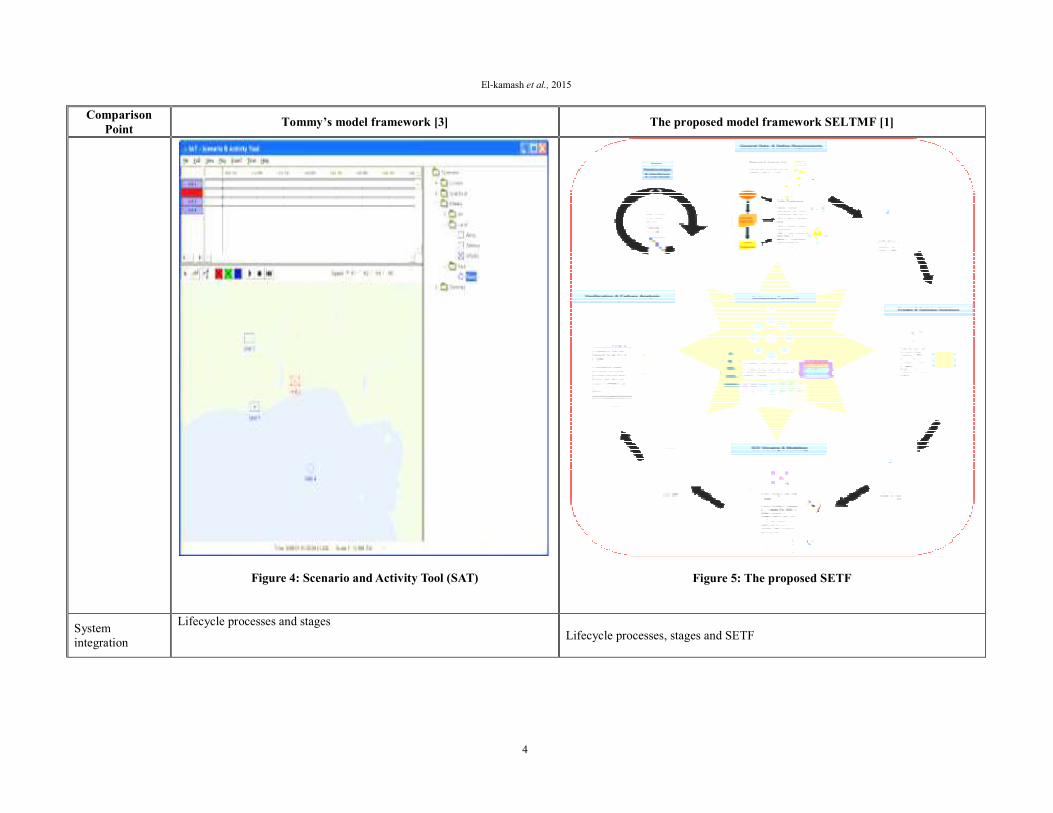
during a systems lifecycle, and M&S that made systems engineering more efficient, as in Figure 4. However the
proposed model, of this research, depends on the integrating ISO/IEC 15288 system lifecycle processes, stages and
SETF as in Figure 7, and used the detailed SETF shown in Figure 5, to serve at each stage and process for any
system lifecycle. Also developed the MODAF tool to the latest version with seven viewpoints as shown in Figure 3,
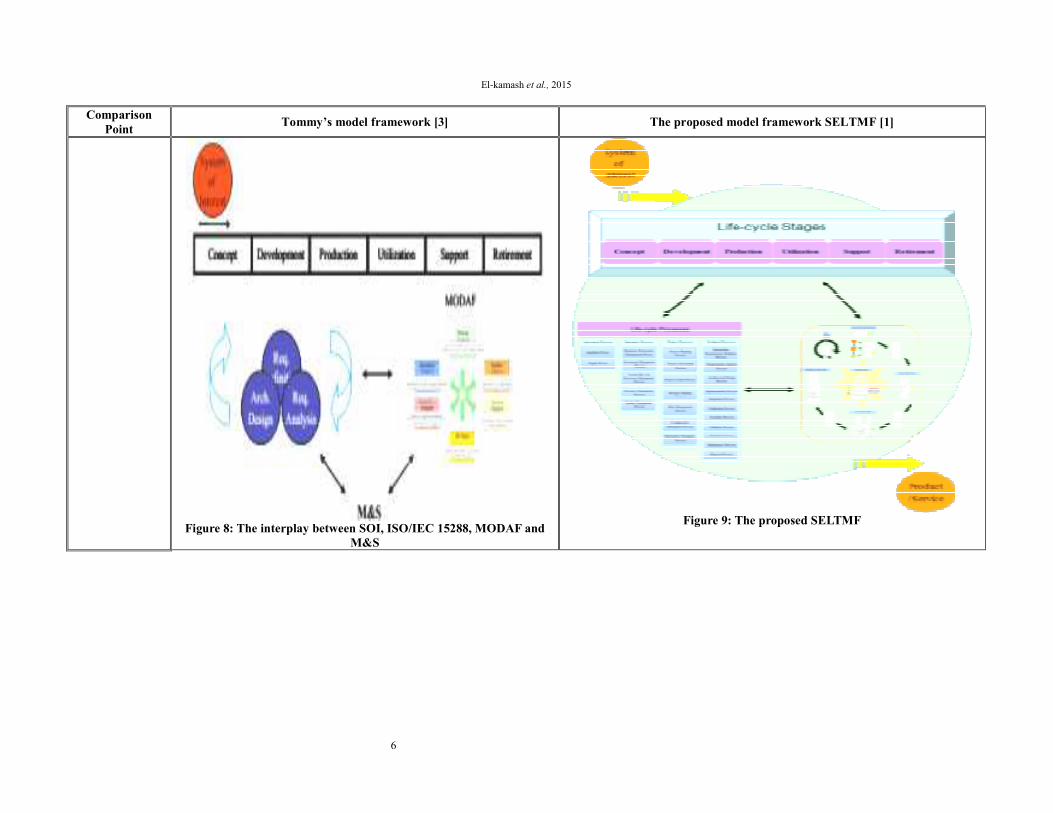
and recommended the proper tools category for any process or stage during the system lifecycle. The two references
made their specific proposed model. Tommy made his model where its pivot is modeling and simulation (M & S) as
shown in Figure 8, where the proposed SELTMF model, of the current research, is based on SETF as shown in
Figure 9.
2
J. Eng. High. Tech., 1(2)1-16,2015
Table 1: Mapping the proposed SELTMF model to another model framework
Comparison
Point Tommy’s model framework [3] The proposed model framework SELTMF [1]
Used tools Architecture framework (MODAF), and M & S SE tools template (SETF)
The basic
building block MODAF and M & S SETF
The standard ISO/IEC 15288 ISO/IEC 15288
Adopted
framework
Architectural framework; MODAF (only 6 viewpoints)
Figure 2: MODAF six viewpoints
and M & S
Developed MODAF (7 viewpoints)
Figure 3: The modified MODAF seven viewpoints
and SETF
3
El-kamash et al., 2015
Comparison
Point Tommy’s model framework [3] The proposed model framework SELTMF [1]
Figure 4: Scenario and Activity Tool (SAT)
Figure 5: The proposed SETF
System
integration
Lifecycle processes and stages
Lifecycle processes, stages and SETF
4

J. Eng. High. Tech., 1(2)1-16,2015
Comparison
Point Tommy’s model framework [3] The proposed model framework SELTMF [1]
Figure 6: An example of the processes in relation to the lifecycle
presented by ISO/IEC 15288
Figure 7: ISO/IEC 15288 lifecycle and SETF integration
The main model
The interplay between SOI, ISO/IEC 15288, MODAF and M&S
SELTMF
5
El-kamash et al., 2015
Comparison
Point Tommy’s model framework [3] The proposed model framework SELTMF [1]
Figure 8: The interplay between SOI, ISO/IEC 15288, MODAF and
M&S
Figure 9: The proposed SELTMF
6

J. Eng. High. Tech., 1(2)1-16,2015
5. RESULT
After applying SELTMF model for 6- months divided into quarter Qrt.1 and Qrt.2 on ECDI
Company, we got the following results. Figure 10 illustrates the average time spent in each main
process in the product life cycle for Qrt.1 that presents the previous situation e.g. before implementing
SELTMF model of this research, while Figure 11 presents the Qrt.2 state e.g. after SELTMF model
implementation. As shown in Figure 12, a significant decrease in process time of each process of the
implemented quarter, Qrt.2, that gives a chance for more system improvement thus finding new
businesses, acquiring new customers, increasing products, and increasing profit.
Figure 10: Time spent in each process - Qrt.1 (current) - for ECDI firm.
Figure 11: Time spent in each process - Qrt.2 (implemented) - for ECDI firm.
7

El-kamash et al., 2015
Figure 12: Comparison of time spent in each process for Qrt.1 to Qrt.2 - for ECDI firm.
This study has been applied on the company system during two quarters (each quarter has three
months) one quarter before applying SE tools-model and the second one is after the application of this
study. Through performance analysis by Table 2 these results are presented. This results show that the
increase of input (cost) with increases of output (revenue) consequently increasing material consuming,
labor hiring, overtime, concerning products quality, decreasing rework, scrap, M/C downtime, and
commitment to delivery time thus fulfillment customer needs and handling its claims properly. As
global result, increasing the number of customers and new products, and definitely increasing the value
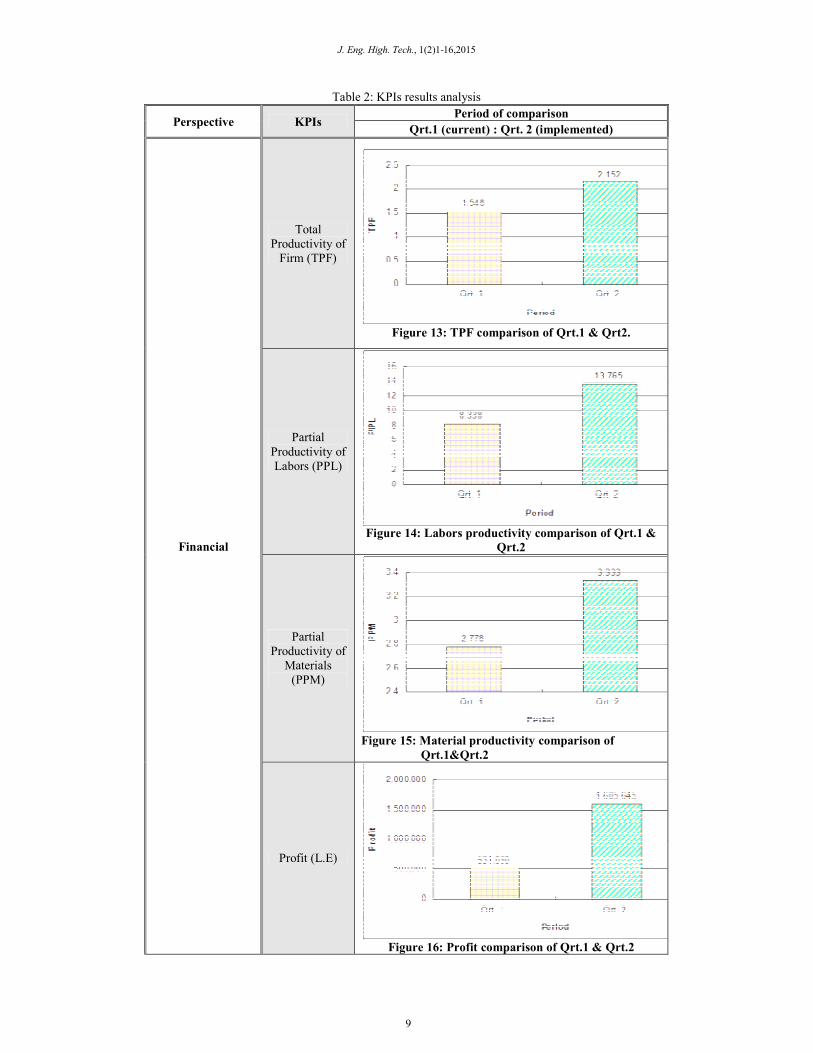
added as illustrated by Figures 13 up to 35. The analysis of the company performance ensures that due
to SELTMF model application, the company started to improve its performance as illustrated by
measures. This is noticed that the increasing of the firm total productivity by 28.1% as shown in Figure
13. From Figure 14, increase of labor partial productivity is 39.4 %.
Moreover, material partial productivity increased by 16.7% as shown in Figure 15. The
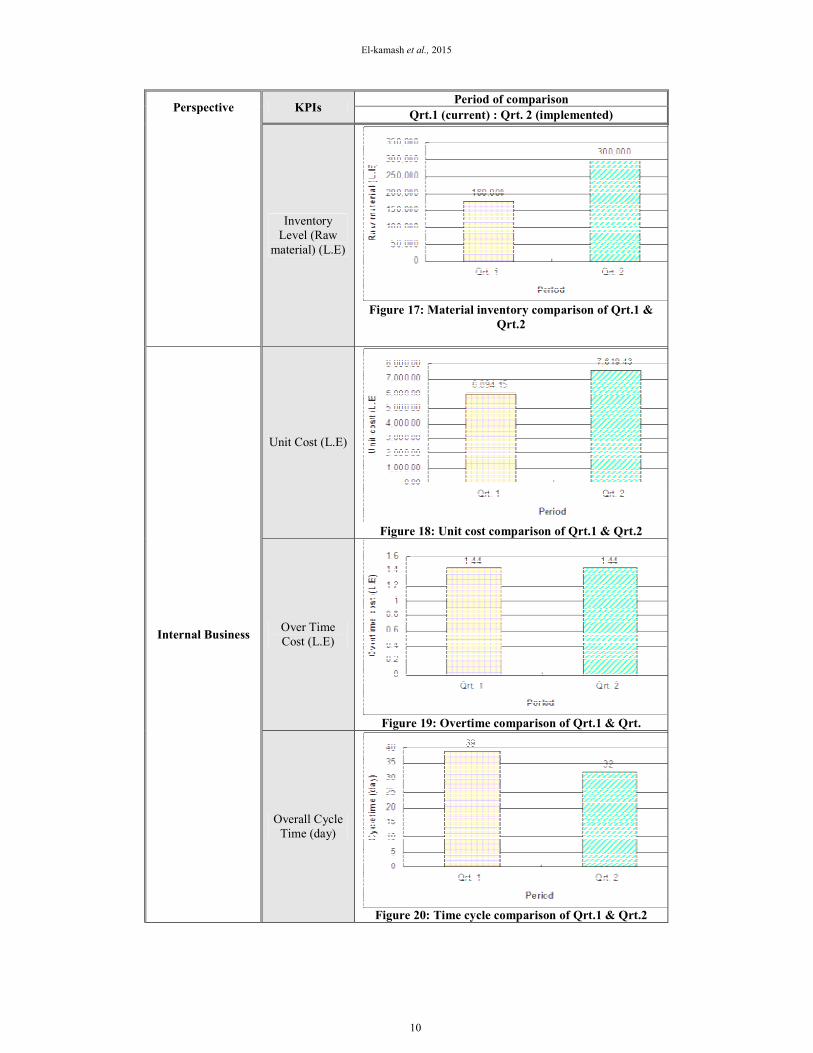
inventory level of raw materials is increased by 40% as shown in Figure 16. Consequently the increase
of profit by 66.9% as illustrated by Figure 17, that is for financial management improvement.
According to internal business improvement, there is an increase by 20% for unit cost, means
increasing its price as shown in Figure 18 and Figure 19 illustrates that overtime is the same, but Figure
20 illustrates the significant positive decrease in overall cycle time of the product lifecycle.
On another side, the machines utilization decreased by 21.88% as shown in Figure 21, while
the stability of downtime introduced by Figure 22. To improve quality, the defective products
percentage decreased as plotted in Figure 23; it must be prevented from the beginning through
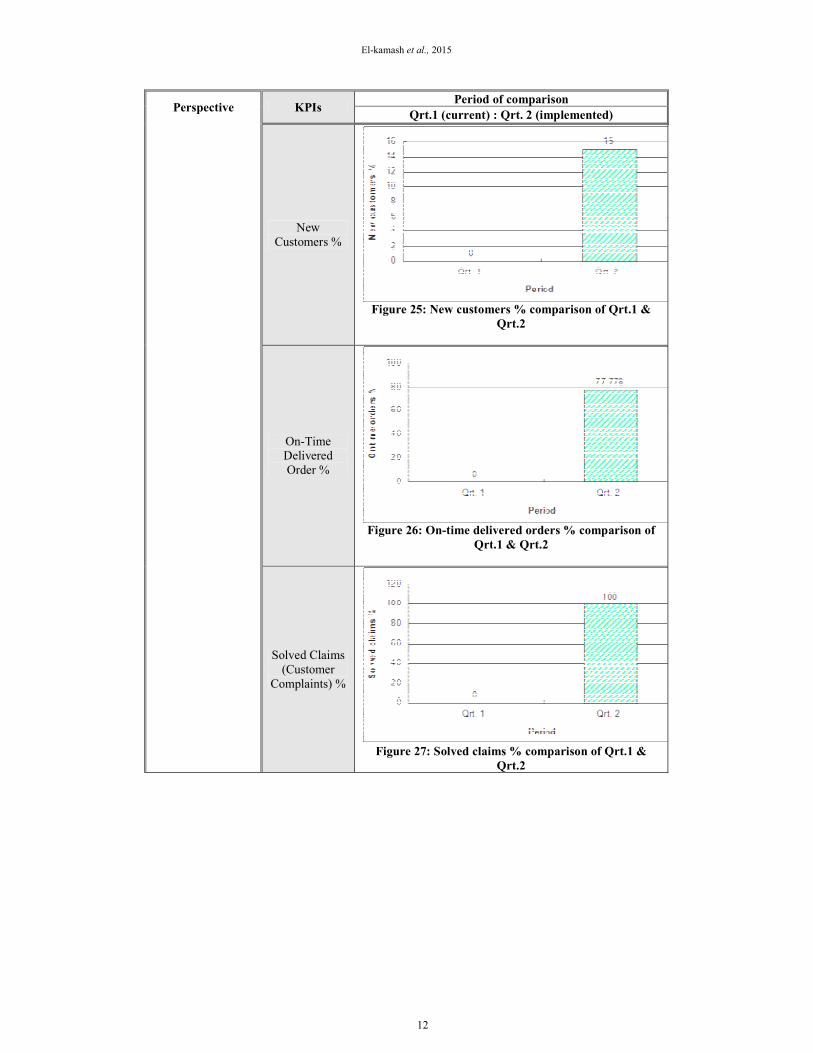
decreasing rework as presented in Figure 24. Due to this improvement, the company acquired new
customers as shown in Figure 25, became deliver orders on time as required as presented in Figure 26,
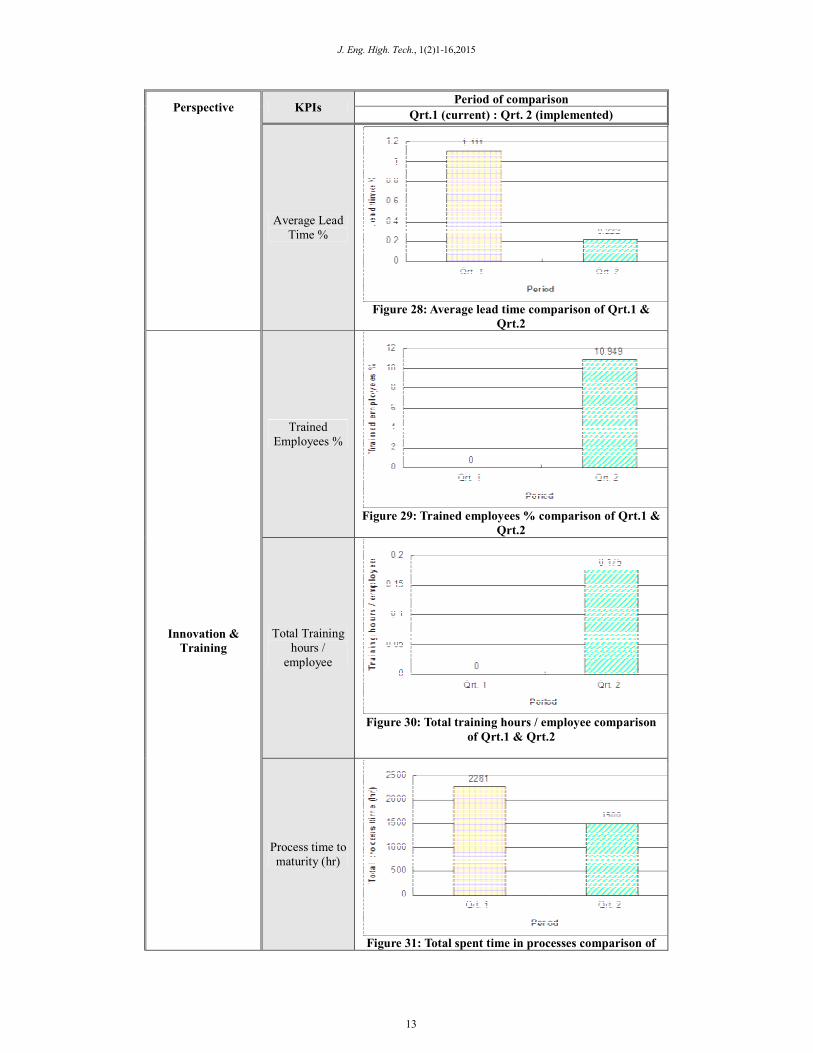
thus lead time has to be decreased as shown in Figure 27. Based on improving quality programs,
customer claims would be, as soon as possible, solved as illustrated by Figure 28. All this exertion
would not be done without human factor so; they should be update get different training programs
through establishing periodic training programs for all employees as shown in Figure 29 and recording
each employee training hours by its own training card as shown in Figure 30. From Figure 31, the total
processing time decreased due to decreasing time spent in each process. They are doing the all work
thus the company gets new products as shown in Figure 32. The overall view is clear by measuring
global indicators for the whole systems. So, measuring quality-productivity index indicates an increase
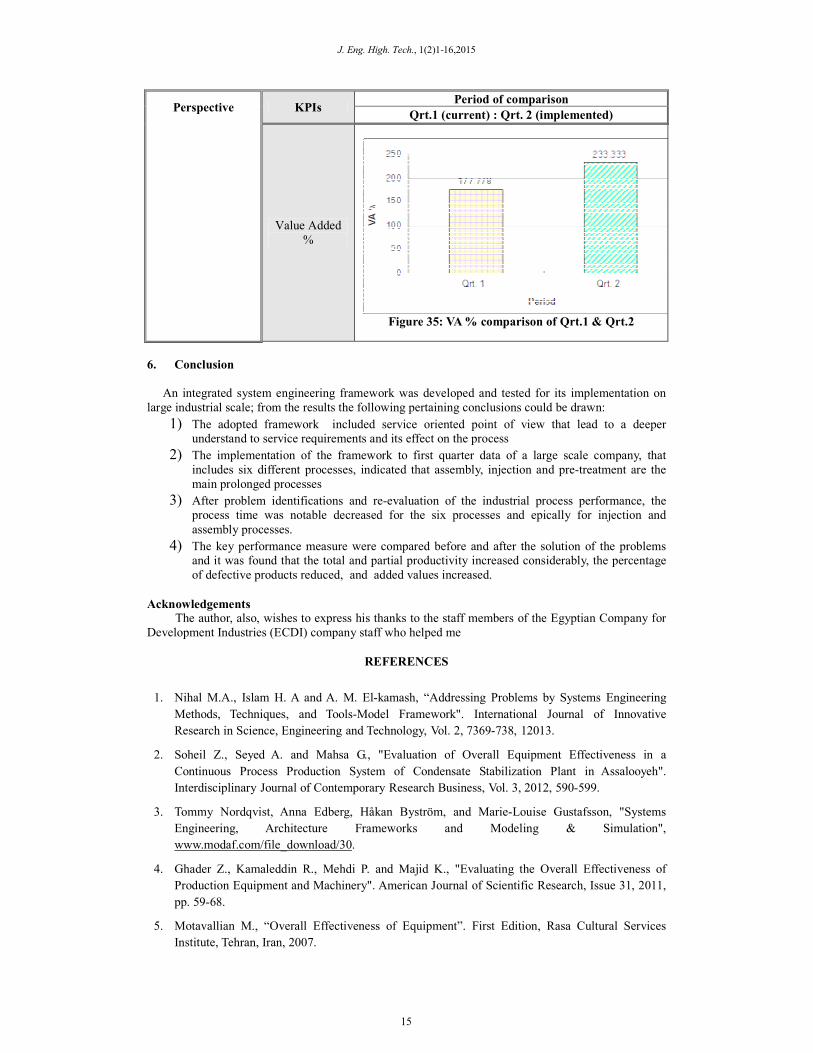
by 27.6% as illustrated by Figure 33. Of-course, after all this effort there must be a value added that
truly increased by 54.3% as shown in Figure 34, and if it compared to the variable costs of material
cost, for example, it indicates to an increase by 23.8% of value added percent as shown in Figure 35.
8
J. Eng. High. Tech., 1(2)1-16,2015
Table 2: KPIs results analysis
Perspective KPIs Period of comparison
Qrt.1 (current) : Qrt. 2 (implemented)
Financial
Total
Productivity of
Firm (TPF)
Figure 13: TPF comparison of Qrt.1 & Qrt2.
Partial
Productivity of
Labors (PPL)
Figure 14: Labors productivity comparison of Qrt.1 &
Qrt.2
Partial
Productivity of
Materials
(PPM)
Figure 15: Material productivity comparison of
Qrt.1&Qrt.2
Profit (L.E)
Figure 16: Profit comparison of Qrt.1 & Qrt.2
9
El-kamash et al., 2015
Perspective KPIs Period of comparison
Qrt.1 (current) : Qrt. 2 (implemented)
Inventory
Level (Raw
material) (L.E)
Figure 17: Material inventory comparison of Qrt.1 &
Qrt.2
Internal Business
Unit Cost (L.E)
Figure 18: Unit cost comparison of Qrt.1 & Qrt.2
Over Time
Cost (L.E)
Figure 19: Overtime comparison of Qrt.1 & Qrt.
Overall Cycle
Time (day)
Figure 20: Time cycle comparison of Qrt.1 & Qrt.2
10

J. Eng. High. Tech., 1(2)1-16,2015
Perspective KPIs Period of comparison
Qrt.1 (current) : Qrt. 2 (implemented)
M/C
Utilization
Figure 21: M/C utilization comparison of Qrt.1 & Qrt.2
M/C Down
Time %
Figure 22: M/C downtime % comparison of Qrt.1 &
Qrt.2
Quality
Defective
products %
Figure 23: Defective products % comparison of Qrt.1 &
Qrt.2
Rework %
Figure 24: Rework % comparison of Qrt.1 & Qrt.2
11
El-kamash et al., 2015
Perspective KPIs Period of comparison
Qrt.1 (current) : Qrt. 2 (implemented)
New
Customers %
Figure 25: New customers % comparison of Qrt.1 &
Qrt.2
On-Time
Delivered
Order %
Figure 26: On-time delivered orders % comparison of
Qrt.1 & Qrt.2
Solved Claims
(Customer
Complaints) %
Figure 27: Solved claims % comparison of Qrt.1 &
Qrt.2
12
J. Eng. High. Tech., 1(2)1-16,2015
Perspective KPIs Period of comparison
Qrt.1 (current) : Qrt. 2 (implemented)
Average Lead
Time %
Figure 28: Average lead time comparison of Qrt.1 &
Qrt.2
Innovation &
Training
Trained
Employees %
Figure 29: Trained employees % comparison of Qrt.1 &
Qrt.2
Total Training
hours /
employee
Figure 30: Total training hours / employee comparison
of Qrt.1 & Qrt.2
Process time to
maturity (hr)
Figure 31: Total spent time in processes comparison of
13

El-kamash et al., 2015
Perspective KPIs Period of comparison
Qrt.1 (current) : Qrt. 2 (implemented)
Qrt. 1 & Qrt. 2
No. of New
Products
Figure 32: No. Of new products comparison of Qrt.1 &
Qrt.2
Integrated
Measures
Quality-
Productivity
Index
Figure 33: Quality-Productivity index comparison of
Qrt.1 & Qrt.2
Value Added
(VA) (L.E)
Figure 34: VA comparison of Qrt.1 & Qrt.2
14
J. Eng. High. Tech., 1(2)1-16,2015
Perspective KPIs Period of comparison
Qrt.1 (current) : Qrt. 2 (implemented)
Value Added
%
Figure 35: VA % comparison of Qrt.1 & Qrt.2
6. Conclusion
An integrated system engineering framework was developed and tested for its implementation on
large industrial scale; from the results the following pertaining conclusions could be drawn:
1) The adopted framework included service oriented point of view that lead to a deeper
understand to service requirements and its effect on the process
2) The implementation of the framework to first quarter data of a large scale company, that
includes six different processes, indicated that assembly, injection and pre-treatment are the
main prolonged processes
3) After problem identifications and re-evaluation of the industrial process performance, the
process time was notable decreased for the six processes and epically for injection and
assembly processes.
4) The key performance measure were compared before and after the solution of the problems
and it was found that the total and partial productivity increased considerably, the percentage
of defective products reduced, and added values increased.
Acknowledgements
The author, also, wishes to express his thanks to the staff members of the Egyptian Company for
Development Industries (ECDI) company staff who helped me
REFERENCES
1. Nihal M.A., Islam H. A and A. M. El-kamash, “Addressing Problems by Systems Engineering
Methods, Techniques, and Tools-Model Framework". International Journal of Innovative
Research in Science, Engineering and Technology, Vol. 2, 7369-738, 12013.
2. Soheil Z., Seyed A. and Mahsa G., "Evaluation of Overall Equipment Effectiveness in a
Continuous Process Production System of Condensate Stabilization Plant in Assalooyeh".
Interdisciplinary Journal of Contemporary Research Business, Vol. 3, 2012, 590-599.
3. Tommy Nordqvist, Anna Edberg, Håkan Byström, and Marie-Louise Gustafsson, "Systems
Engineering, Architecture Frameworks and Modeling & Simulation",
www.modaf.com/file_download/30.
4. Ghader Z., Kamaleddin R., Mehdi P. and Majid K., "Evaluating the Overall Effectiveness of
Production Equipment and Machinery". American Journal of Scientific Research, Issue 31, 2011,
pp. 59-68.
5. Motavallian M., “Overall Effectiveness of Equipment”. First Edition, Rasa Cultural Services
Institute, Tehran, Iran, 2007.
15
El-kamash et al., 2015
6. Islam H. A, “Studied Implementation of Total Productive Maintenance and Overall Equipment
Effectiveness Evaluation". International Journal of Mechanical & Mechatronics Engineering
IJMME-IJENS, Vol.13, 2013, 69-75.
7. Mark S., "Software Engineering and Systems Engineering in the Department of Defense". Journal
of Defense Software Engineering, 1998, 3 – 6.
8. Alice S., Jon W., Bill W., Doug B., Richard R., and Peter D., "Year One of the Systems
Engineering Experience Accelerator", New Challenges in Systems Engineering and Architecting
Conference on Systems Engineering Research (CSER) 2012 – St. Louis, MO Cihan H. Dagli,
Editor in Chief Organized by Missouri University of Science and Technology, Elsevier Ltd.
Selection, Procedia Computer Science Vol.8, 2012, 267 – 272.
9. "Systems Engineering Fundamentals", Supplementary Text Prepared by the Defense Acquisition
University Press Fort Belvoir, Virginia 22060-5565, 2001.
10. David M. C., "Practical Application of Chaos Theory to Systems Engineering". New Challenges
in Systems Engineering and Architecting Conference on Systems Engineering Research (CSER)
2012–St. Louis, MO Cihan H. Dagli, Editor in Chief Organized by Missouri University of
Science and Technology, Elsevier Ltd. Selection, Procedia Computer Science Vol. 8, 2012, 39 –
44.
11. Cecilia Haskins, "Systems Engineering Handbook, a Guide for System Lifecycle Processes and
Activities". INCOSE-TP-2003-002-03, INCOSE Systems Engineering Handbook, version 3,
2006.
12. Albert S., and John K., "Systems Engineering Framework for Integrated Product and Industrial
Design Including Trade Study Optimization". New Challenges in Systems Engineering and
Architecting Conference on Systems Engineering Research (CSER), Missouri University of
Science and Technology, Elsevier Ltd. Selection, Procedia Computer Science Vol. 8, 2012, 413 –
419.
13. Andrew P. S., "Systems Engineering: Purpose, Function, and Structure". John Wiley & Sons, Inc.,
Editorials, 1998, 1 – 3.
14. Andrew P. S. and William B. R., "Handbook of Systems Engineering and Management - An
Introduction to Systems Engineering and Systems Management". John Wiley & Sons, Inc., 1999.
15. Yariv G., and Dov D., "Generating Sys. ML Views from an OPM Model: Design and Evaluation".
Systems Engineering Vol 14, No. 3, Wiley Periodicals, Inc., Regular Paper, and Syst. Eng Vol.
14, 2011, 327–340.
16. Joseph E. K, Conference Co-Chair, "Preface to Part V, Systems Engineering Applications", New
Challenges in Systems Engineering and Architecting Conference on Systems Engineering
Research (CSER) 2012 – St. Louis, MO Cihan H. Dagli, Editor in Chief Organized by Missouri
University of Science and Technology, Elsevier B.V., Procedia Computer Science Vol.8, 2012,
295 – 296.
16