Implementation of Passive Filters for Harmonics …...to design the passive filter and its impact on...
12
International Journal of Advanced Science and Technology Vol.78 (2015), pp.1-12 http://dx.doi.org/10.14257/ijast.2015.78.01 ISSN: 2005-4238 IJAST Copyright ⓒ 2015 SERSC Implementation of Passive Filters for Harmonics Reduction Mandeep Singh 1 and Sheila Mahapatra 2 1, 2 Department of EECE, ITM University, Gurgaon 1 [email protected], 2 [email protected] Abstract In recent years there has been widespread use of power electronics devices and non- linear elements in rectification and switchgear applied to various areas of power system. Power systems contain levels of harmonics which can no longer be ignored by engineers, planners, energy conservationists and economists due to the presence of non-linear loads. A simulated case study of distributed system in IEEE 519 is being used here for harmonic reduction. From the simulated case study, the network was investigated using MiPower software package. The results were compared with IEEE standards 519 and it was found that MiPower software is the preferred package for power system harmonic analysis. The harmonic reduction solution chosen was to design a passive filter to decrease the distortion by shifting the resonance point of the network. This paper includes the method to design the passive filter and its impact on efficiency and energy usage. Keywords: Harmonic analysis, Mi Power software, Total harmonic Distortion (THD), passive filters, Current distortion limits 1. Introduction There is a great emphasis about power quality and in particular the issue of harmonic distortion primarily due to the incorporation of more non-linear loads in a typical industrial plant [1]. Further, power electronic based devices are widely being used for inversion, rectification and other applications. Though these devices are more effective they generate and inject harmonics into the power system. Traditionally, efficiency investigations in power systems consider only distortion-free waveforms, that is, the voltage and current waveforms are assumed to be sinusoidal. A harmonic is a sinusoidal component of a periodic wave having a frequency that is an integral multiple of the fundamental frequency. The main sources of harmonics in power systems has been the static power converter used as rectifiers, adjustable speed drives, switched-mode supplies, frequency changers for induction heating. Since nonlinear loads represent an ever- increasing percentage of the total load of an industrial or commercial power system, harmonic studies have become an important part of overall system design and operation. Fortunately, the available software for harmonic analysis has also grown. Guidelines for the acceptance of harmonic distortion are well-defined in IEEE Standard 519-1992. By modeling power system impedances as a function of frequency, a study can be made to determine the effect of the harmonic contributions from nonlinear loads on the voltages and currents in the power system. The current paper is structured as follows: In Section II, the purpose of harmonic study and its effect are discussed. The test system investigated for harmonic analysis and methods used for harmonic reduction are given in Section III. The implementation of passive filters for harmonic content reduction is given in Section IV. The simulation results are given in Section V & conclusion in Section VI.
Transcript of Implementation of Passive Filters for Harmonics …...to design the passive filter and its impact on...
International Journal of Advanced Science and Technology
Vol.78 (2015), pp.1-12
http://dx.doi.org/10.14257/ijast.2015.78.01
ISSN: 2005-4238 IJAST
Copyright 2015 SERSC
Implementation of Passive Filters for Harmonics Reduction
Mandeep Singh1 and Sheila Mahapatra
2
1, 2Department of EECE, ITM University, Gurgaon
Abstract
In recent years there has been widespread use of power electronics devices and non-
linear elements in rectification and switchgear applied to various areas of power system.
Power systems contain levels of harmonics which can no longer be ignored by engineers,
planners, energy conservationists and economists due to the presence of non-linear loads.
A simulated case study of distributed system in IEEE 519 is being used here for harmonic
reduction. From the simulated case study, the network was investigated using MiPower
software package. The results were compared with IEEE standards 519 and it was found
that MiPower software is the preferred package for power system harmonic analysis. The
harmonic reduction solution chosen was to design a passive filter to decrease the
distortion by shifting the resonance point of the network. This paper includes the method
to design the passive filter and its impact on efficiency and energy usage.
Keywords: Harmonic analysis, Mi Power software, Total harmonic Distortion (THD),
passive filters, Current distortion limits
1. Introduction
There is a great emphasis about power quality and in particular the issue of harmonic
distortion primarily due to the incorporation of more non-linear loads in a typical
industrial plant [1]. Further, power electronic based devices are widely being used for
inversion, rectification and other applications. Though these devices are more effective
they generate and inject harmonics into the power system. Traditionally, efficiency
investigations in power systems consider only distortion-free waveforms, that is, the
voltage and current waveforms are assumed to be sinusoidal. A harmonic is a sinusoidal
component of a periodic wave having a frequency that is an integral multiple of the
fundamental frequency. The main sources of harmonics in power systems has been the
static power converter used as rectifiers, adjustable speed drives, switched-mode supplies,
frequency changers for induction heating. Since nonlinear loads represent an ever-
increasing percentage of the total load of an industrial or commercial power system,
harmonic studies have become an important part of overall system design and operation.
Fortunately, the available software for harmonic analysis has also grown. Guidelines for
the acceptance of harmonic distortion are well-defined in IEEE Standard 519-1992. By
modeling power system impedances as a function of frequency, a study can be made to
determine the effect of the harmonic contributions from nonlinear loads on the voltages
and currents in the power system. The current paper is structured as follows: In Section II,
the purpose of harmonic study and its effect are discussed. The test system investigated
for harmonic analysis and methods used for harmonic reduction are given in Section III.
The implementation of passive filters for harmonic content reduction is given in Section
IV. The simulation results are given in Section V & conclusion in Section VI.
International Journal of Advanced Science and Technology
Vol.78 (2015)
2 Copyright 2015 SERSC
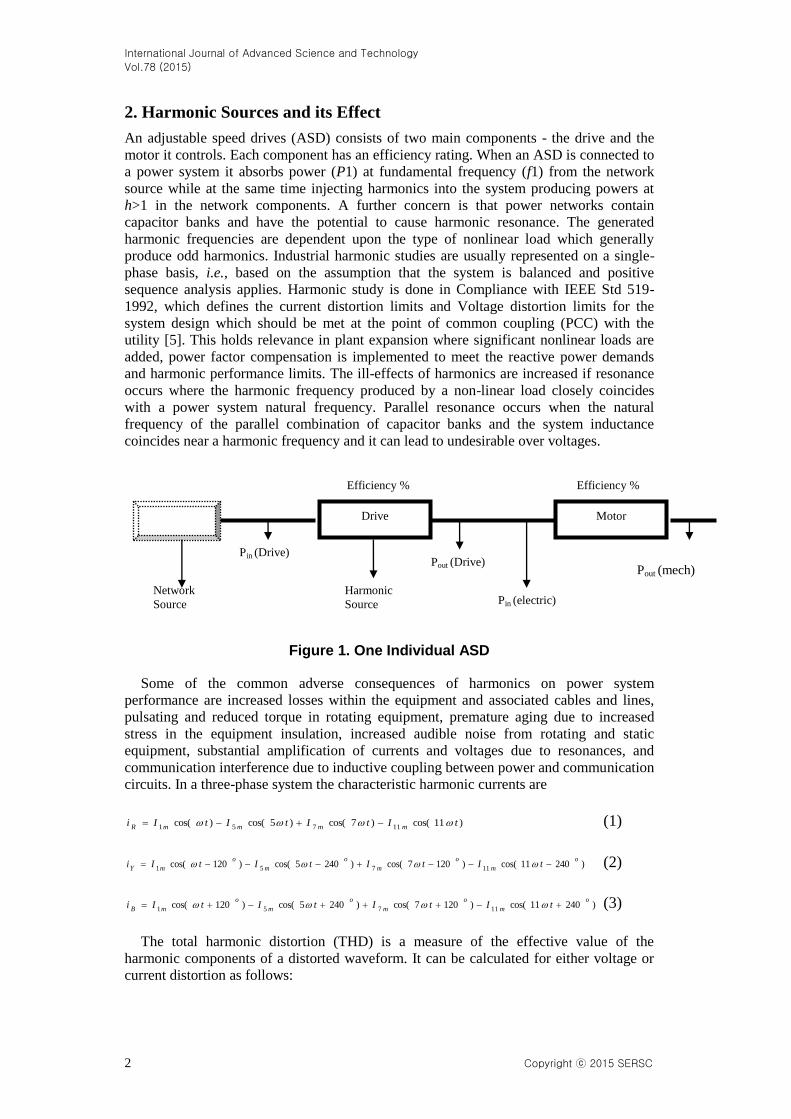
2. Harmonic Sources and its Effect
An adjustable speed drives (ASD) consists of two main components - the drive and the
motor it controls. Each component has an efficiency rating. When an ASD is connected to
a power system it absorbs power (P1) at fundamental frequency (f1) from the network
source while at the same time injecting harmonics into the system producing powers at
h>1 in the network components. A further concern is that power networks contain
capacitor banks and have the potential to cause harmonic resonance. The generated
harmonic frequencies are dependent upon the type of nonlinear load which generally
produce odd harmonics. Industrial harmonic studies are usually represented on a single-
phase basis, i.e., based on the assumption that the system is balanced and positive
sequence analysis applies. Harmonic study is done in Compliance with IEEE Std 519-
1992, which defines the current distortion limits and Voltage distortion limits for the
system design which should be met at the point of common coupling (PCC) with the
utility [5]. This holds relevance in plant expansion where significant nonlinear loads are
added, power factor compensation is implemented to meet the reactive power demands
and harmonic performance limits. The ill-effects of harmonics are increased if resonance
occurs where the harmonic frequency produced by a non-linear load closely coincides
with a power system natural frequency. Parallel resonance occurs when the natural
frequency of the parallel combination of capacitor banks and the system inductance
coincides near a harmonic frequency and it can lead to undesirable over voltages.
Figure 1. One Individual ASD
Some of the common adverse consequences of harmonics on power system
performance are increased losses within the equipment and associated cables and lines,
pulsating and reduced torque in rotating equipment, premature aging due to increased
stress in the equipment insulation, increased audible noise from rotating and static
equipment, substantial amplification of currents and voltages due to resonances, and
communication interference due to inductive coupling between power and communication
circuits. In a three-phase system the characteristic harmonic currents are
)11cos()7cos()5cos()cos(11751
tItItItIimmmmR
(1)
)24011cos()1207cos()2405cos()120cos(11751
o
m
o
m
o
m
o
mYtItItItIi (2)
)24011cos()1207cos()2405cos()120cos(11751
o
m
o
m
o
m
o
mBtItItItIi (3)
The total harmonic distortion (THD) is a measure of the effective value of the
harmonic components of a distorted waveform. It can be calculated for either voltage or
current distortion as follows:
Drive Motor
Network
Source
Pin (Drive)
Harmonic
Source
Pout (Drive)
Pin (electric)
Efficiency % Efficiency %
Pout (mech)
International Journal of Advanced Science and Technology
Vol.78 (2015)
Copyright 2015 SERSC 3
%100%
1
1
2
max
F
F
THD
h
h
h
(4) %100%
1
F
FHD
h (5)
Where Fh is the Rms value of harmonic component h of the quantity F (voltage or
current) and F1 is the magnitude at h=1. The distortion level caused by individual
harmonic components (voltage or current magnitudes) is expressed as a percentage of the
fundamental component magnitude and used as a measure of observing which harmonic
component contributes more to the total harmonic distortion. Therefore, equations above
can be expressed in terms of voltage and current as follows
%100%
1
2
2
V
V
Vh
h
THD (6) %100%
1
2
2
I
I
Ih
h
THD (7)
%100%
1
V
VV
h
HD (8) %100%
1
I
II
h
HD (9)
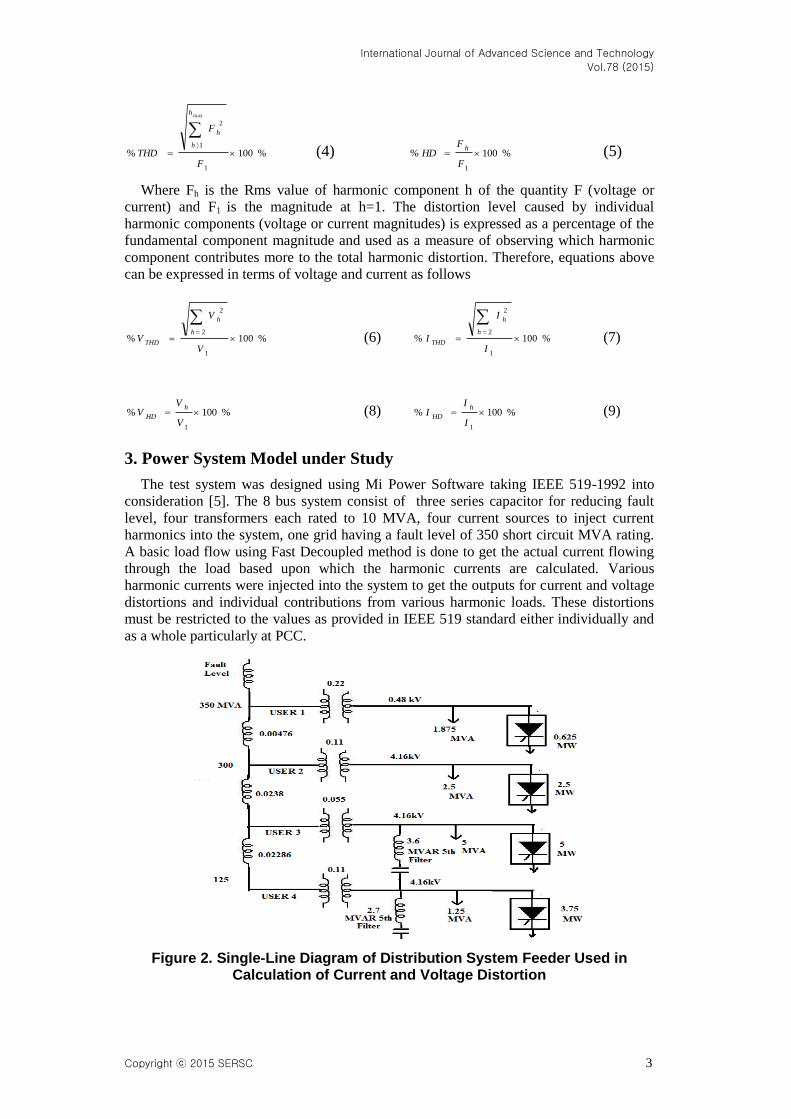
3. Power System Model under Study
The test system was designed using Mi Power Software taking IEEE 519-1992 into
consideration [5]. The 8 bus system consist of three series capacitor for reducing fault
level, four transformers each rated to 10 MVA, four current sources to inject current
harmonics into the system, one grid having a fault level of 350 short circuit MVA rating.
A basic load flow using Fast Decoupled method is done to get the actual current flowing
through the load based upon which the harmonic currents are calculated. Various
harmonic currents were injected into the system to get the outputs for current and voltage
distortions and individual contributions from various harmonic loads. These distortions
must be restricted to the values as provided in IEEE 519 standard either individually and
as a whole particularly at PCC.
Figure 2. Single-Line Diagram of Distribution System Feeder Used in Calculation of Current and Voltage Distortion
International Journal of Advanced Science and Technology
Vol.78 (2015)
4 Copyright 2015 SERSC
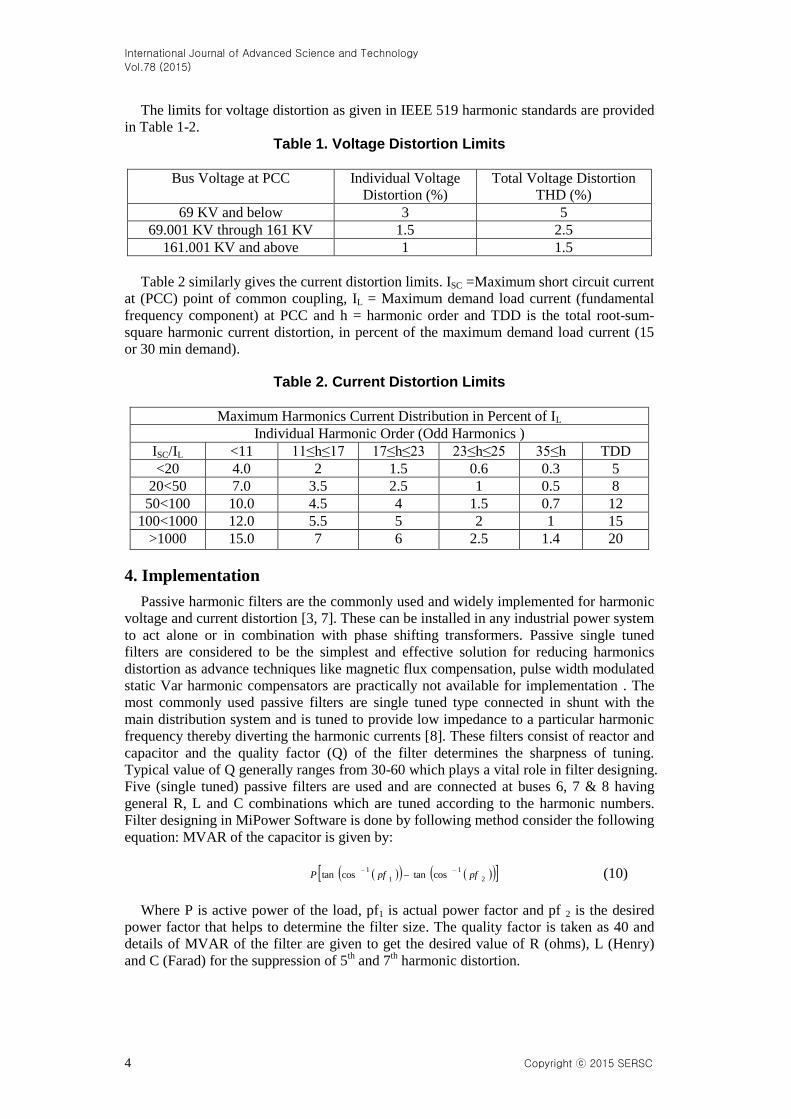
The limits for voltage distortion as given in IEEE 519 harmonic standards are provided
in Table 1-2.
Table 1. Voltage Distortion Limits
Bus Voltage at PCC Individual Voltage
Distortion (%)
Total Voltage Distortion
THD (%)
69 KV and below 3 5
69.001 KV through 161 KV 1.5 2.5
161.001 KV and above 1 1.5
Table 2 similarly gives the current distortion limits. ISC =Maximum short circuit current
at (PCC) point of common coupling, IL = Maximum demand load current (fundamental
frequency component) at PCC and h = harmonic order and TDD is the total root-sum-
square harmonic current distortion, in percent of the maximum demand load current (15
or 30 min demand).
Table 2. Current Distortion Limits
Maximum Harmonics Current Distribution in Percent of IL
Individual Harmonic Order (Odd Harmonics )
ISC/IL <11 11≤h≤17 17≤h≤23 23≤h≤25 35≤h TDD
<20 4.0 2 1.5 0.6 0.3 5
20<50 7.0 3.5 2.5 1 0.5 8
50<100 10.0 4.5 4 1.5 0.7 12
100<1000 12.0 5.5 5 2 1 15
>1000 15.0 7 6 2.5 1.4 20
4. Implementation
Passive harmonic filters are the commonly used and widely implemented for harmonic
voltage and current distortion [3, 7]. These can be installed in any industrial power system
to act alone or in combination with phase shifting transformers. Passive single tuned
filters are considered to be the simplest and effective solution for reducing harmonics
distortion as advance techniques like magnetic flux compensation, pulse width modulated
static Var harmonic compensators are practically not available for implementation . The
most commonly used passive filters are single tuned type connected in shunt with the
main distribution system and is tuned to provide low impedance to a particular harmonic
frequency thereby diverting the harmonic currents [8]. These filters consist of reactor and
capacitor and the quality factor (Q) of the filter determines the sharpness of tuning.
Typical value of Q generally ranges from 30-60 which plays a vital role in filter designing.
Five (single tuned) passive filters are used and are connected at buses 6, 7 & 8 having
general R, L and C combinations which are tuned according to the harmonic numbers.
Filter designing in MiPower Software is done by following method consider the following
equation: MVAR of the capacitor is given by:
2
1
1
1costancostan pfpfP
(10)
Where P is active power of the load, pf1 is actual power factor and pf 2 is the desired
power factor that helps to determine the filter size. The quality factor is taken as 40 and
details of MVAR of the filter are given to get the desired value of R (ohms), L (Henry)
and C (Farad) for the suppression of 5th and 7
th harmonic distortion.
International Journal of Advanced Science and Technology
Vol.78 (2015)
Copyright 2015 SERSC 5
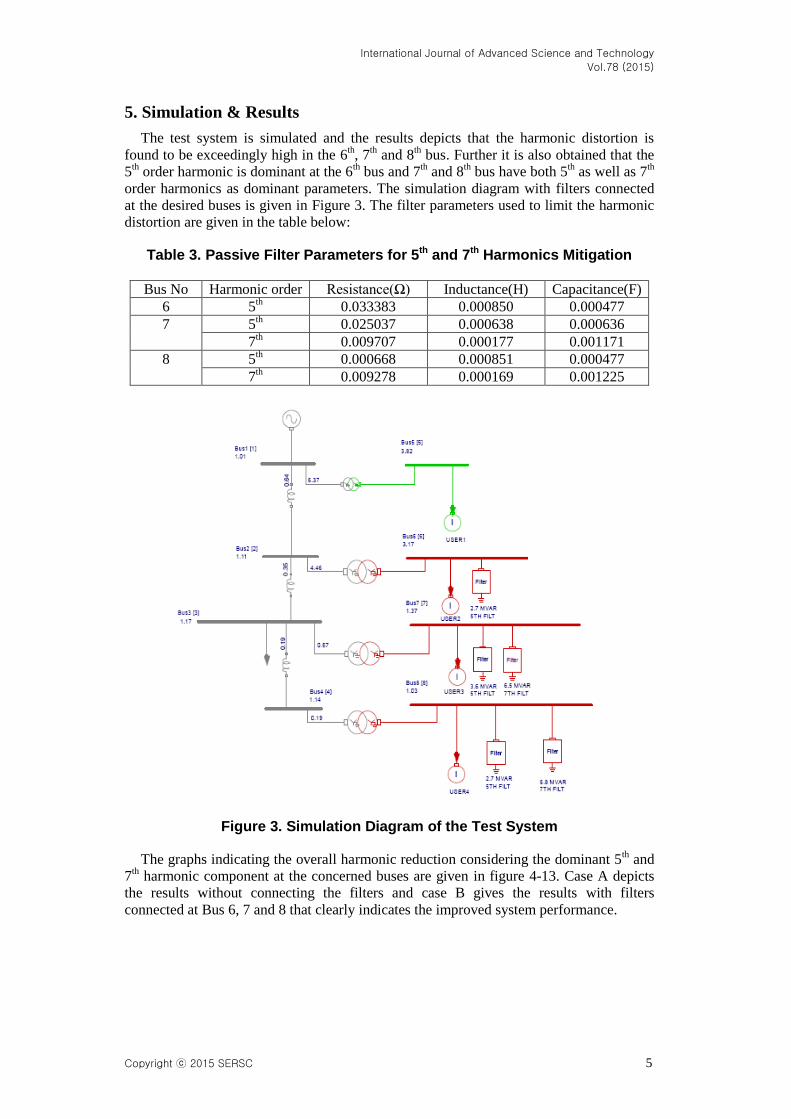
5. Simulation & Results
The test system is simulated and the results depicts that the harmonic distortion is
found to be exceedingly high in the 6th, 7
th and 8
th bus. Further it is also obtained that the
5th order harmonic is dominant at the 6
th bus and 7
th and 8
th bus have both 5
th as well as 7
th
order harmonics as dominant parameters. The simulation diagram with filters connected
at the desired buses is given in Figure 3. The filter parameters used to limit the harmonic
distortion are given in the table below:
Table 3. Passive Filter Parameters for 5th and 7th Harmonics Mitigation
Bus No Harmonic order Resistance(Ω) Inductance(H) Capacitance(F)
6 5th 0.033383 0.000850 0.000477
7 5th 0.025037 0.000638 0.000636
7th 0.009707 0.000177 0.001171
8 5th 0.000668 0.000851 0.000477
7th 0.009278 0.000169 0.001225
Figure 3. Simulation Diagram of the Test System
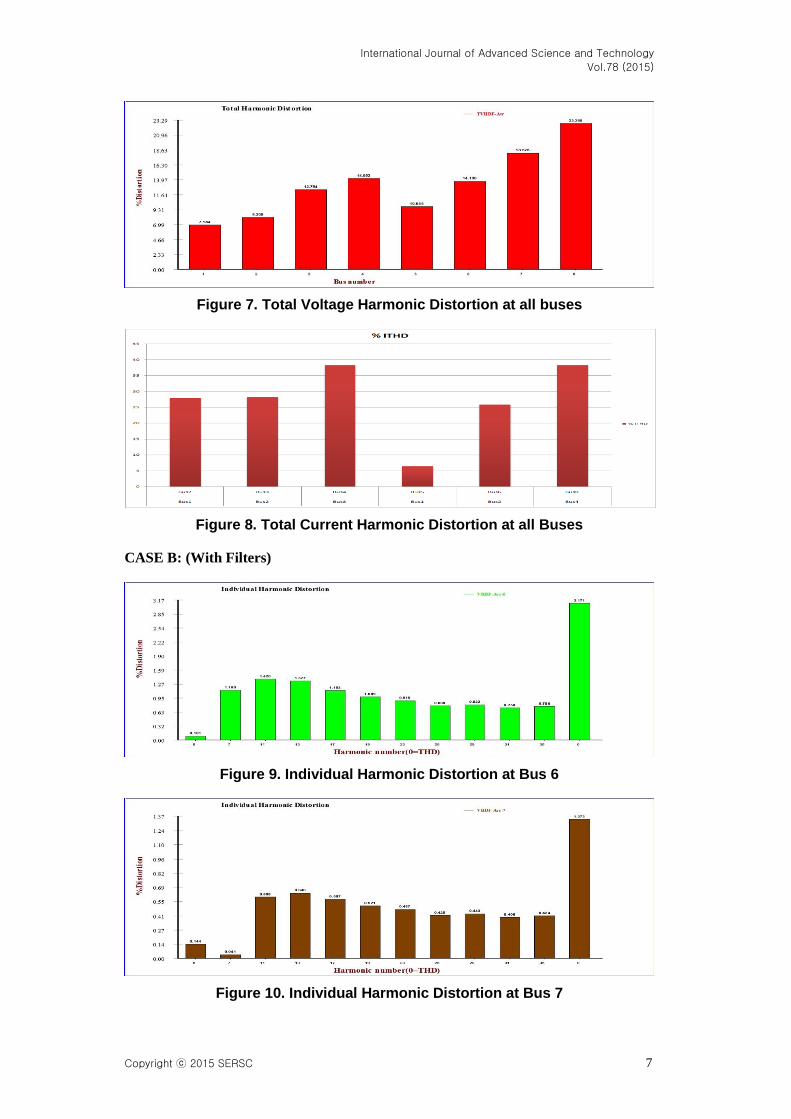
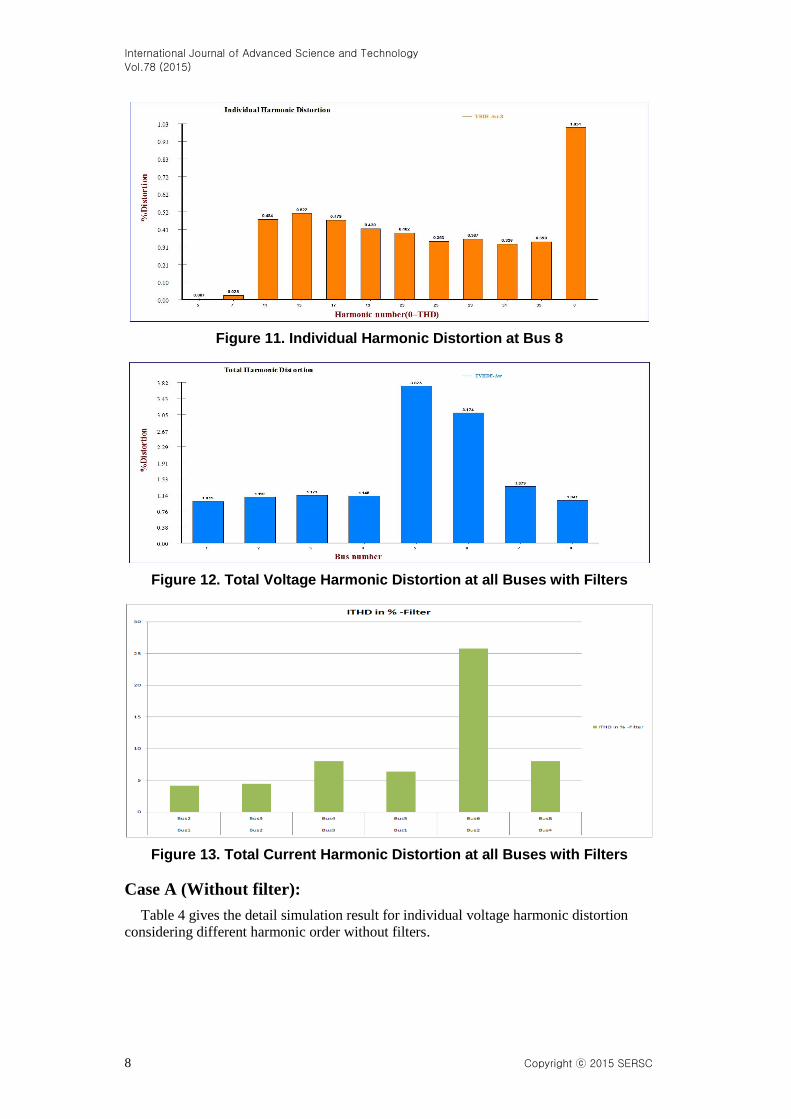
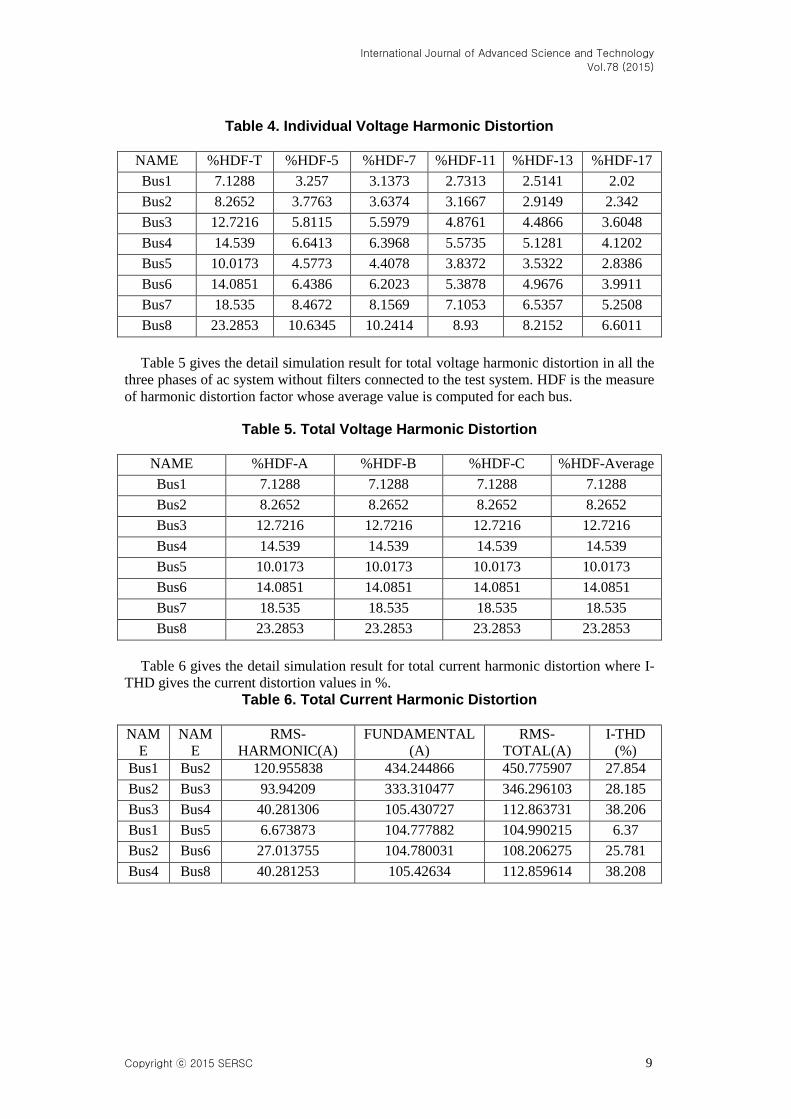
The graphs indicating the overall harmonic reduction considering the dominant 5th and
7th harmonic component at the concerned buses are given in figure 4-13. Case A depicts
the results without connecting the filters and case B gives the results with filters
connected at Bus 6, 7 and 8 that clearly indicates the improved system performance.
International Journal of Advanced Science and Technology
Vol.78 (2015)
6 Copyright 2015 SERSC
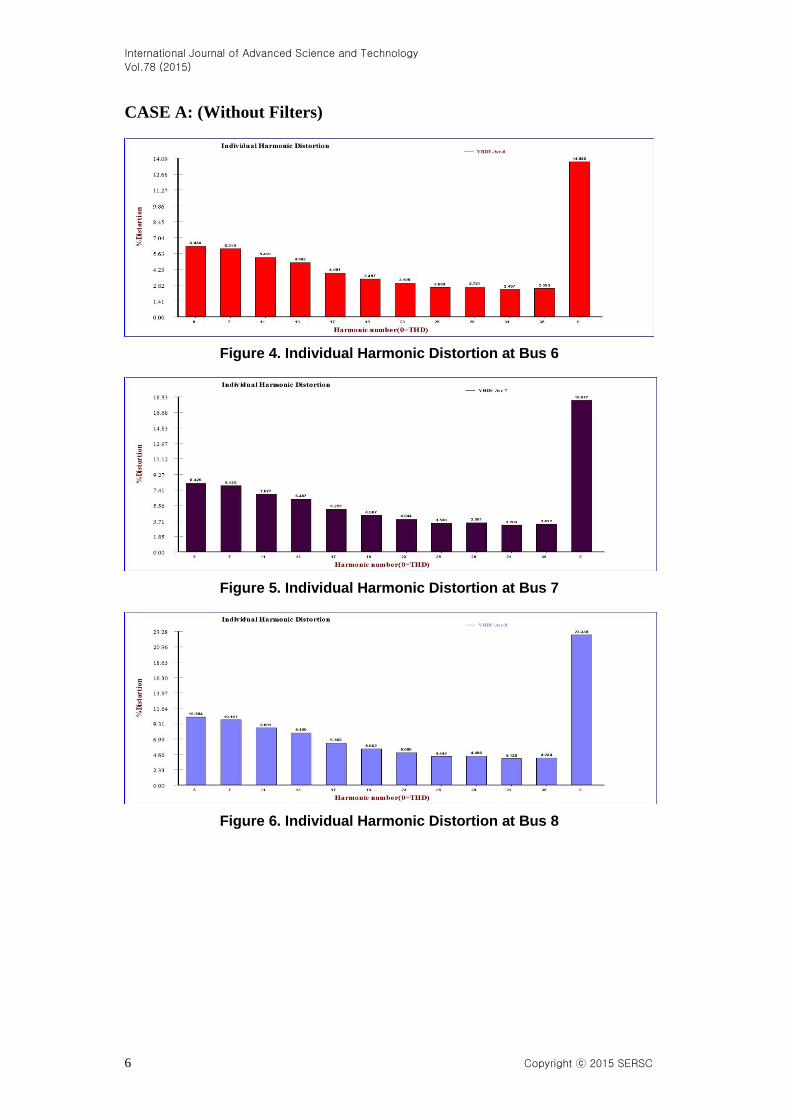
CASE A: (Without Filters)
Figure 4. Individual Harmonic Distortion at Bus 6
Figure 5. Individual Harmonic Distortion at Bus 7
Figure 6. Individual Harmonic Distortion at Bus 8
International Journal of Advanced Science and Technology
Vol.78 (2015)
Copyright 2015 SERSC 7
Figure 7. Total Voltage Harmonic Distortion at all buses
Figure 8. Total Current Harmonic Distortion at all Buses
CASE B: (With Filters)
Figure 9. Individual Harmonic Distortion at Bus 6
Figure 10. Individual Harmonic Distortion at Bus 7
International Journal of Advanced Science and Technology
Vol.78 (2015)
8 Copyright 2015 SERSC
Figure 11. Individual Harmonic Distortion at Bus 8
Figure 12. Total Voltage Harmonic Distortion at all Buses with Filters
Figure 13. Total Current Harmonic Distortion at all Buses with Filters
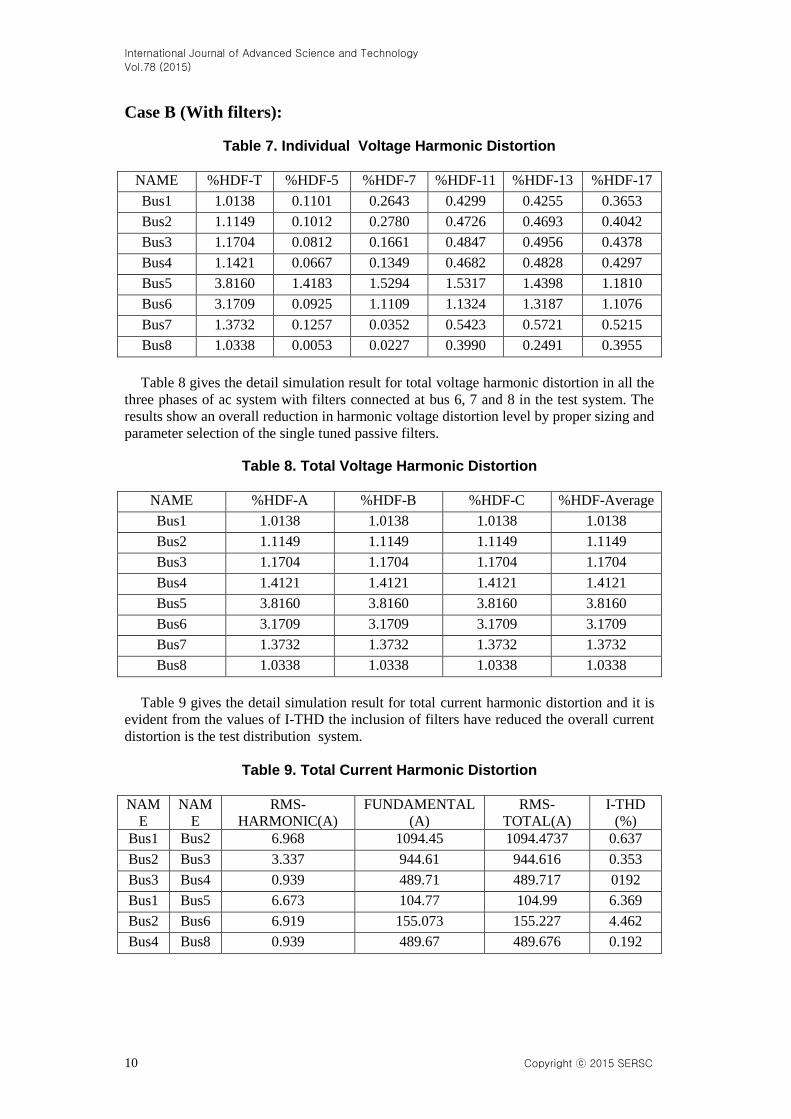
Case A (Without filter):
Table 4 gives the detail simulation result for individual voltage harmonic distortion
considering different harmonic order without filters.
International Journal of Advanced Science and Technology
Vol.78 (2015)
Copyright 2015 SERSC 9
Table 4. Individual Voltage Harmonic Distortion
NAME %HDF-T %HDF-5 %HDF-7 %HDF-11 %HDF-13 %HDF-17
Bus1 7.1288 3.257 3.1373 2.7313 2.5141 2.02
Bus2 8.2652 3.7763 3.6374 3.1667 2.9149 2.342
Bus3 12.7216 5.8115 5.5979 4.8761 4.4866 3.6048
Bus4 14.539 6.6413 6.3968 5.5735 5.1281 4.1202
Bus5 10.0173 4.5773 4.4078 3.8372 3.5322 2.8386
Bus6 14.0851 6.4386 6.2023 5.3878 4.9676 3.9911
Bus7 18.535 8.4672 8.1569 7.1053 6.5357 5.2508
Bus8 23.2853 10.6345 10.2414 8.93 8.2152 6.6011
Table 5 gives the detail simulation result for total voltage harmonic distortion in all the
three phases of ac system without filters connected to the test system. HDF is the measure
of harmonic distortion factor whose average value is computed for each bus.
Table 5. Total Voltage Harmonic Distortion
NAME %HDF-A %HDF-B %HDF-C %HDF-Average
Bus1 7.1288 7.1288 7.1288 7.1288
Bus2 8.2652 8.2652 8.2652 8.2652
Bus3 12.7216 12.7216 12.7216 12.7216
Bus4 14.539 14.539 14.539 14.539
Bus5 10.0173 10.0173 10.0173 10.0173
Bus6 14.0851 14.0851 14.0851 14.0851
Bus7 18.535 18.535 18.535 18.535
Bus8 23.2853 23.2853 23.2853 23.2853
Table 6 gives the detail simulation result for total current harmonic distortion where I-
THD gives the current distortion values in %.
Table 6. Total Current Harmonic Distortion
NAM
E
NAM
E
RMS-
HARMONIC(A)
FUNDAMENTAL
(A)
RMS-
TOTAL(A)
I-THD
(%)
Bus1 Bus2 120.955838 434.244866 450.775907 27.854
Bus2 Bus3 93.94209 333.310477 346.296103 28.185
Bus3 Bus4 40.281306 105.430727 112.863731 38.206
Bus1 Bus5 6.673873 104.777882 104.990215 6.37
Bus2 Bus6 27.013755 104.780031 108.206275 25.781
Bus4 Bus8 40.281253 105.42634 112.859614 38.208
International Journal of Advanced Science and Technology
Vol.78 (2015)
10 Copyright 2015 SERSC
Case B (With filters):
Table 7. Individual Voltage Harmonic Distortion
NAME %HDF-T %HDF-5 %HDF-7 %HDF-11 %HDF-13 %HDF-17
Bus1 1.0138 0.1101 0.2643 0.4299 0.4255 0.3653
Bus2 1.1149 0.1012 0.2780 0.4726 0.4693 0.4042
Bus3 1.1704 0.0812 0.1661 0.4847 0.4956 0.4378
Bus4 1.1421 0.0667 0.1349 0.4682 0.4828 0.4297
Bus5 3.8160 1.4183 1.5294 1.5317 1.4398 1.1810
Bus6 3.1709 0.0925 1.1109 1.1324 1.3187 1.1076
Bus7 1.3732 0.1257 0.0352 0.5423 0.5721 0.5215
Bus8 1.0338 0.0053 0.0227 0.3990 0.2491 0.3955
Table 8 gives the detail simulation result for total voltage harmonic distortion in all the
three phases of ac system with filters connected at bus 6, 7 and 8 in the test system. The
results show an overall reduction in harmonic voltage distortion level by proper sizing and
parameter selection of the single tuned passive filters.
Table 8. Total Voltage Harmonic Distortion
NAME %HDF-A %HDF-B %HDF-C %HDF-Average
Bus1 1.0138 1.0138 1.0138 1.0138
Bus2 1.1149 1.1149 1.1149 1.1149
Bus3 1.1704 1.1704 1.1704 1.1704
Bus4 1.4121 1.4121 1.4121 1.4121
Bus5 3.8160 3.8160 3.8160 3.8160
Bus6 3.1709 3.1709 3.1709 3.1709
Bus7 1.3732 1.3732 1.3732 1.3732
Bus8 1.0338 1.0338 1.0338 1.0338
Table 9 gives the detail simulation result for total current harmonic distortion and it is
evident from the values of I-THD the inclusion of filters have reduced the overall current
distortion is the test distribution system.
Table 9. Total Current Harmonic Distortion
NAM
E
NAM
E
RMS-
HARMONIC(A)
FUNDAMENTAL
(A)
RMS-
TOTAL(A)
I-THD
(%)
Bus1 Bus2 6.968 1094.45 1094.4737 0.637
Bus2 Bus3 3.337 944.61 944.616 0.353
Bus3 Bus4 0.939 489.71 489.717 0192
Bus1 Bus5 6.673 104.77 104.99 6.369
Bus2 Bus6 6.919 155.073 155.227 4.462
Bus4 Bus8 0.939 489.67 489.676 0.192
International Journal of Advanced Science and Technology
Vol.78 (2015)
Copyright 2015 SERSC 11
6. Conclusion
This paper provides a detailed approach to design single tuned passive filters to
mitigate the adverse effect of harmonics. The harmonic level has a great effect on the
performance of system components and this paper presents the proper selection of single
tuned passive filter parameters (R, L and C) and its design to improve system
performance by suppressing the dominant 5th and 7
th order harmonics. The simulation
results depicts that by using passive filters the voltage distortion at main panels-PCC is
reduced from 7.13 to 1.01 and current distortion from 27.85 to 0.64. The software also
helps in selecting the location of passive filters to optimize system performance and also
suggest a detailed filter designing based upon the filter performance. So, it can be
concluded that the model simulated and considered in this study is suitable for performing
harmonic analysis and the results obtained meet the recommended IEEE 519 harmonic
standards.
Appendix
Bus Data:
Bus 1-4 13.8kV, Bus 5 0.48 kV Bus 6-8 4.16 kV. Minimum and maximum voltages at all
buses are 0.95 and 1.05 p.u
Series Reactor Data:
All the reactors are rated at 10MVA
Reactor bus 1-2 X= 0.00476
Reactor bus 2-3 X= 0.0238
Reactor bus 3-4 X=0.02286
Generator Data:
10 MVA, 20 MW, 1 p.u., Xd = 0.02857
References
[1] S. D. Upadhye and Y. R. Atre, “Determination of the Design Parameters of Passive Harmonic Filters
using Non-linear Optimization”, Industrial and commercial power system technical conference, 1998, pp
155-164.
[2] Clyde Gilker, Rory V. Dwyer, Roger C. Dugan, “A Program for Analysis of Power System Harmonics”,
IEEE Computer Applications in Power, (1989).
[3] M. E. Habrouk, M. K. Darwish and P. Mehta, “Active Power Filter; A review”, IEE Proc. Electr. Power
Appl., Vol. 147, no. 5, (2000) September, pp. 403-413.
[4] Y.-S. Cho and H. Cha, “Single-tuned Passive Harmonic Filter Design Considering Variances of Tuning
and Quality Factor”, Journal of International Council on Electrical Engineering, vol. 1, no. 1, (2011), pp.
7-13.
[5] IEEE Std. 519-1992, “IEEE Recommended Practices and Requirements for Harmonic Control in
Electrical Power Systems”, (1992), pp. 77-80.
[6] F. Z. Peng, H. Akagi and A. Nabae, “A New Approach to Harmonic Compensation in Power System a
Combined System of Shunt Passive and Series Active Filter”, IEEE Trans. On Industry Applications,
vol. 27, no. 6, (1990), pp. 983-990.
[7] H. Fujita and H. Akagi, “A Practical Approach to Harmonic Compensation in Power System Series
Connection of Passive and Active Filter”, IEEE Trans. On Industry Applications, vol. 27, no. 6, (1991),
pp. 1020-1025.
[8] Z. Ahmed Memon, M. Uquaili and M. Ali Unar, “Harmonics Mitigation of Industrial Power System
Using Passive Filters”, Mehran University Research Journal of Engineering & Technology, vol. 31, no.
2, (2012) April.
[9] R. C. Dugan, “Electrical Power Systems Quality”, Second Edition, McGraw-Hill, (2002), pp. 264-273.

International Journal of Advanced Science and Technology
Vol.78 (2015)
12 Copyright 2015 SERSC
Authors
Mandeerp Singh, Assistant Professor in the Department of Electrical, Electronics and
Communication Engineering, ITM University, Gurgaon, (Haryana), India. He has
received his M.Tech and B.Tech. from Sant Longowal Institute of Engg. & Tech.,
Longowal, Sangrur (Punjab) in the year of 2008 and 2006 respectively. His main research
interests are in Control systems, Power system optimization techniques and its
engineering application.
Sheila Mahapatra received her B.Tech degree in Electrical Engineering from Utkal
University, Orissa in 2002. She received her Master’s degree in Power System &
Automation from GITAM, Andhra University, Vizag in 2008. Presently she is working
towards PhD in the Department of Electrical & Electronics Engineering, ITM University,
Gurgaon, Haryana. She is a lifetime member of ISTE and has teaching experience of over
9years.