Implementation of Environmental DNA (eDNA) as a Tool for ...
50
National Marine Fisheries Service Northwest Fisheries Science Center Implementation of Environmental DNA (eDNA) as a Tool for Ecosystem- Based Fisheries Management NOAA White Paper NMFS-NWFSC-WP-2020-01 August 2020 https://doi.org/10.25923/e736-vn83 U.S. Department of Commerce | National Oceanic and Atmospheric Administration | National Marine Fisheries Service
Transcript of Implementation of Environmental DNA (eDNA) as a Tool for ...

National Marine Fisheries ServiceNorthwest Fisheries Science Center
Implementation of Environmental DNA (eDNA) as a Tool for Ecosystem-Based Fisheries ManagementNOAA White Paper NMFS-NWFSC-WP-2020-01
August 2020https://doi.org/10.25923/e736-vn83
U.S. Department of Commerce | National Oceanic and Atmospheric Administration | National Marine Fisheries Service

NOAA White Paper Series NMFS-NWFSC
The Northwest Fisheries Science Center of NOAA’s National Marine Fisheries Service uses the NOAA White Paper NMFS-NWFSC series to issue scientific and technical publications that have received thorough internal scientific review and editing. Reviews are transparent collegial reviews, not anonymous peer reviews. Documents within this series represent sound professional work and may be referenced in the formal scientific and technical literature.
NOAA White Papers NMFS-NWFSC are available from the NOAA Institutional Repository, https://repository.library.noaa.gov.
Any mention throughout this document of trade names or commercial companies is for identification purposes only and does not imply endorsement by the National Marine Fisheries Service, NOAA.
Cover photos: Images taken aboard the Norwegian R/V HKH Kronprins Håkon during a UNIG eDNA survey of the mesopelagic (Port Verde to France, 1 May–27 June 2019). People in cruise photos are Luke Thompson (United States) and Lotta Lindblom (Norway). Photographs by: L. Thompson, OAR/AOML.
Reference this document as follows:UNIG (U.S.–Norway Intergovernmental Group on eDNA Implementation for Fisheries Stock Assessments and Management). 2020. Implementation of Environmental DNA (eDNA) as a Tool for Ecosystem-Based Fisheries Management. U.S. Department of Commerce, NOAA White Paper NMFS-NWFSC-WP-2020-01.
https://doi.org/10.25923/e736-vn83
U.S. DEPARTMENT OF COMMERCE
National Oceanic and Atmospheric AdministrationNational Marine Fisheries ServiceNorthwest Fisheries Science Center
Implementation of Environmental DNA (eDNA) as a Tool for Ecosystem-Based Fisheries ManagementU.S.–Norway Intergovernmental Group on eDNA Implementation for Fisheries Stock Assessments and Management (UNIG)
https://doi.org/10.25923/e736-vn83
August 2020
Published by:Northwest Fisheries Science Center2725 Montlake Boulevard EastSeattle, Washington 98112

Authors
U.S.–Norway Intergovernmental Group on eDNA Implementation for Fisheries Stock Assessments and Management (UNIG)
EditorsJessica Louise Ray, Mark S. Strom, Torild Johansen, and Kelly D. Goodwin
National Oceanic and Atmospheric Administration (NOAA)Felipe Arzayus, [email protected] Biologist, NMFS Office of Science and Technology, Silver Spring, Maryland, USA
Kelly D. Goodwin, [email protected], Atlantic Oceanographic and Meterological Laboratory (stationed at the Southwest Fisheries Science Center, La Jolla, California, USA)
Edward J. Gorecki III, [email protected] and Program Analyst, Silver Spring, Maryland, USA
Richard Methot, [email protected] Scientist and Science Advisor for Stock Assessments, Northwest Fisheries Science Center, Seattle, Washington, USA
Thomas Noji, [email protected] of Ecosystems and Aquaculture Division, Northeast Fisheries Science Center, Sandy Hook, New Jersey, USA
Andrew Olaf (Ole) Shelton, [email protected] Fisheries Biologist, Northwest Fisheries Science Center, Seattle, Washington, USA
Mark S. Strom, [email protected] Science and Research Director, Northwest Fisheries Science Center, Seattle, Washington, USA
Cisco Werner, [email protected] of Scientific Programs and Chief Science Advisor, NOAA Fisheries, Silver Spring, Maryland, USA
Daniel Wieczorek, [email protected] Technician, Northeast Fisheries Science Center, Sandy Hook, New Jersey, USA
Norwegian Institute of Marine Research (IMR)Per Arneberg, [email protected] Scientist, Ecosystem Processes, IMR Department Tromsø, Tromsø, Norway
Torild Johansen, [email protected] Scientist, Population Genetics, IMR Department Tromsø, Tromsø, Norway
Claudia Junge, [email protected] Scientist, Deepwater Species & Cartilaginous Fish, IMR Department Tromsø, Tromsø, Norway

Mette Mauritzen, [email protected] Director, Ecosystem Processes, IMR Department Tromsø, Tromsø, Norway
Erik Olsen, [email protected] Director, Demersal Fish, IMR Department Tromsø, Tromsø, Norway
Martina Stiasny, [email protected] Scientist, Pelagic Fishes, IMR Department Bergen, Bergen, Norway
Jon-Ivar Westgaard, [email protected] Scientist, Population Genetics, IMR Department Tromsø, Tromsø, Norway
NORCE Norwegian Research Centre ASThierry Baussant, [email protected] Scientist, NORCE Environment, Marine Ecology Research Group, Stavanger, Norway
Thomas Dahlgren, [email protected] Scientist, NORCE Environment, Molecular Ecology Research Group, Bergen, Norway
Aud Larsen, [email protected] Scientist, NORCE Environment, Molecular Ecology Research Group, Bergen, Norway
Jessica Louise Ray, [email protected] Scientist, NORCE Environment, Molecular Ecology Research Group, Bergen, Norway
UNIG group at the Norwegian Institute of Marine Research, Tromsø, Norway, October 2018. Pictured, from left to right: (back row) Edward J. Gorecki III, Elizabeth A. Allen, Jim Palardy, Per Erik Jorde, Owen S. Wangensteen, Mark S. Strom; (front row) Jessica Louise Ray, Tanja Hanebrekke, Felipe Arzayus, Jon-Ivar Westgaard, Lucillia Giuletti, Kirsten Harper, Kelly D. Goodwin, Laura Gargan, Torild Johansen, Claudia Junge.
ii

The Arctic University of Norway (UiT)Kim Præbel, [email protected] Professor, Norwegian College of Fishery Science, Tromsø, Norway
Owen S. Wangensteen, [email protected] Scientist, Norwegian College of Fishery Science, Tromsø, Norway
Woods Hole Oceanographic Institute (WHOI)Elizabeth A. Allen, [email protected] Investigator, Applied Ocean Physics and Engineering, Bigelow Laboratory, Falmouth, Massachusetts, USA
University of Washington (UW)Ryan Kelly, [email protected] Professor, School of Marine and Environmental Affairs, Seattle, Washington, USA
The Pew Charitable TrustsJim Palardy, [email protected] Director, Science Conservation Program, Washington, D.C., USA
Faroe Marine Research Institute (Havstovan)Ian Salter, [email protected] Researcher, Marine Biochemistry and Molecular Biology, Tórshavn, Faroe Islands
iii

Contents
List of Authors .............................................................................................................................................................................. i
List of Figures .............................................................................................................................................................................vi
List of Tables ..............................................................................................................................................................................vii
Glossary ...................................................................................................................................................................................... viii
Executive Summary ................................................................................................................................................................. xi
Fish Stock Assessment Challenges ............................................................................................................................ xi
eDNA as an EBFM-Compatible Survey Method .................................................................................................... xi
U.S.–Norway Bilateral Working Group .................................................................................................................. xiii
Document Scope ..............................................................................................................................................................xiv
Innovation in Stock Assessment Streams ........................................................................................................................ 1
Modernizing Stock Assessment Streams ................................................................................................................. 1
Potential Benefits of eDNA for EBFM ........................................................................................................................ 2
Capabilities and Limitations of eDNA Applications ............................................................................................ 2
Qualitative or quantitative eDNA analysis? .................................................................................................... 3
Benchmarking eDNA applications ...................................................................................................................... 3
Working group recommendations ..................................................................................................................... 3
Establishment of eDNA Survey Indices .................................................................................................................... 5
eDNA Can Fill in Knowledge Gaps .............................................................................................................................. 5
Multispecies surveys ................................................................................................................................................ 6
Range shifts and invasive species ....................................................................................................................... 6
Data-poor and data-limited species ................................................................................................................... 6
Time series.................................................................................................................................................................... 6
Trophic interactions ................................................................................................................................................. 7
Hindcasts ....................................................................................................................................................................... 7
Road Map for Future Research ............................................................................................................................................. 8
Time Series and Baselines.............................................................................................................................................. 8
Automation ................................................................................................................................................................... 8
Coordination ................................................................................................................................................................ 9
Existing resource utilization ................................................................................................................................. 9
List of References .................................................................................................................................................................... 11
iv

Appendix A: Selected eDNA Case Studies ..................................................................................................................... 16
U.S.–Norway eDNA Initiatives.................................................................................................................................... 16
Norwegian Fjord Transect .......................................................................................................................................... 16
Newport Line Comprehensive Transect (NWFSC) ........................................................................................... 17
Northeast Atlantic Mesopelagic Fisheries Stock Assessment ...................................................................... 17
Data-Limited Caribbean Fish Stocks ....................................................................................................................... 19
Bermuda ..................................................................................................................................................................... 19
Montserrat ................................................................................................................................................................. 19
San Andrés ................................................................................................................................................................. 19
Turks and Caicos Islands ..................................................................................................................................... 19
NOAA Fisheries eDNA Enhancement of Fishery-Independent Monitoring Cruises for EBFM ....... 20
The Joint U.S.–Canada Integrated Ecosystem and Pacific Hake Acoustic-Trawl Survey (NWFSC) ....... 21
List of References ............................................................................................................................................................ 24
Appendix B: Challenges for Implementing eDNA for EBFM ................................................................................. 25
Understanding the Dynamics of eDNA .................................................................................................................. 25
Shedding rate ............................................................................................................................................................ 25
Degradation rate ..................................................................................................................................................... 25
Dilution factor .......................................................................................................................................................... 25
Transport of eDNA in the water column ....................................................................................................... 25
Mixed community eDNA ...................................................................................................................................... 26
Contamination .......................................................................................................................................................... 26
PCR inhibition........................................................................................................................................................... 26
Common sense ......................................................................................................................................................... 26
One “standard” protocol? ..................................................................................................................................... 26
Sharing of samples and IPR ................................................................................................................................ 27
Data analysis ............................................................................................................................................................. 28
Bioinformatics platforms ..................................................................................................................................... 28
Computing infrastructure solutions ............................................................................................................... 29
Machine learning ..................................................................................................................................................... 29
Interlaboratory comparisons (ILCs) ....................................................................................................................... 29
Standardized reference materials (SRMs) ........................................................................................................... 30
List of References ............................................................................................................................................................ 31
v

Figures
UNIG group at the Norwegian Institute of Marine Research, Tromsø, Norway, October 2018 ................ ii
Figure A-1. Stations where water from CTD Niskin bottles was collected from six depths and filtered for eDNA ............................................................................................................................................................. 18
Figure A-2. Acoustic-trawl survey conducted in 2017 by NMFS/NWFSC and DFO ................................... 22
vi

Tables
Table 1. Targeted implementation of eDNA within current stock assessment routines to address various knowledge gaps ................................................................................................................................ 4
vii

Glossary
This list is intended as a nonexhaustive reference guide to the reader. It provides an index of fisheries management and molecular biological terms referred to in the text. Term usage can vary (e.g., see Goodwin et al. 2017).
EcosystemIn the NOAA Fisheries context, the term ecosystem means a geographically specified system of fishery resources, the persons that participate in that system, the environment, and the environmental processes that control that ecosystem’s dynamics (cf. Murawski and Matlock 2006). To be clear, fishermen and fishing communities are understood to be included in the definition.
Ecosystem-based fisheries management (EBFM)Ecosystem-based fisheries management (EBFM) has been proposed as a holistic way of managing fisheries. Full implementation of EBFM is considered to occur when governance, management, science, and institutional systems are taking into account all of the systemic, environmental, interspecific, interfleet, and multivariate and/or cumulative facets beyond a typical single-species approach (Link et al. 2011).
eDNA (environmental DNA)Environmental DNA (eDNA) is DNA (mitochondrial or nuclear) that originates from cells shed by organisms in the form of skin cells or tissue, excrement, mucous, or gametes. The physical association of water-soluble DNA molecules with the cellular matrix from the source material enables the retention of eDNA in the particulate fraction of organic material and thereby facilitates the sampling of eDNA in water by simple particle filtration. It is critical to emphasize the assumption inherent in this sampling method—that eDNA is present in the particulate fraction of any water body. In this way, monitoring efforts require water sampling and filtration capability, rather than capture of the actual target organism. eDNA present in filtered water samples may contain eDNA from the target organism, in addition to eDNA from nontarget organisms and DNA from intact single-celled organisms such as phytoplankton, protists, and prokaryotes. Purified eDNA may be used in any downstream analysis which requires purified DNA as input material.
eDNA metabarcoding (amplicon sequencing)Metabarcoding is a type of qualitative community analysis that entails polymerase chain reaction (PCR, see below) amplification of one specific gene or gene region from an eDNA sample. The resulting PCR products, also called amplicons, are sequenced (see high-throughput sequencing) to provide a genetic “snapshot” of all organisms whose DNA can be detected in a sample. Metabarcoding analysis capitalizes on the DNA sequence diversity present in the targeted gene region in order to assign individual amplicon sequences to source organisms, thereby making an operational identification. This metagenetic
viii

community analysis (sensu Goodwin et al. 2017) identifies the diversity of organisms that were the source of eDNA present in the sample. The choice of target gene determines the subset of biological diversity that will be revealed by eDNA metabarcoding analysis. Metabarcoding analysis of fish diversity, for example, commonly targets the mitochondrial ribosomal RNA 12S gene (Sato et al. 2018). eDNA metabarcoding thus provides an assessment of the metagenetic biodiversity within user-defined (e.g., fish, prokaryotic, eukaryotic, metazoan, microbial) natural assemblages. The same eDNA sample may be subjected to multiple metabarcoding analyses targeting different biological communities.
Fisheries managementAn integrated process—of gathering information, analysis, planning, decision making, allocting resources, and formulating and enforcing fishery regulations—by which the fisheries management authority controls the present and future behaviors of parties interested in the fishery in order to ensure the continued productivity of the living resources.
Fisheries stock assessmentsA fish stock assessment is the process of collecting, analyzing, and reporting demographic information, a) to determine changes in the abundance of fishery stocks in response to fishing, and b) to predict future trends of stock abundance to the extent possible. Specific goals of stock assessments are to measure whether or not a stock has become overfished or is experiencing overfishing. Assessments also provide proactive estimates of future catch levels that would prevent overfishing and attain optimum yield.1
1 https://go.usa.gov/xGNzq
High-throughput sequencing (HTS)High-throughput sequencing (HTS) is a massively parallel sequencing technology which enables rapid sequencing of the base pairs in DNA or RNA samples. This technique is often referred to as next-generation sequencing (NGS). HTS generates thousands to millions of amplicon sequences (see eDNA metabarcoding) per sample, making it a powerful tool for resolving the biological diversity typical of complex environmental samples, including eDNA. Depending on the anticipated magnitude of biological complexity in an eDNA sample, different HTS sequencing platforms may be chosen to provide optimum sequencing depth per sample analyzed. Sequencing depth refers to the number of amplicons generated per unique eDNA sample. Appropriate sequence depth for any eDNA sample may vary with the expected degree of biological diversity at the PCR-amplified genetic locus in that sample.
Polymerase chain reaction (PCR) and quantitative PCR (qPCR)The polymerase chain reaction (PCR) is a molecular biological method by which a target DNA molecule is specifically and exponentially amplified during a controlled enzymatic chain reaction in vitro. The exponential increase in target gene copies enables detection of even minute quantities of target DNA. PCR technologies form the foundation for many types of eDNA analysis, including metabarcoding. In addition, the well studied kinetics
ix

of PCR enables quantitative applications of PCR (e.g., quantitative real-time PCR [qPCR] and droplet digital PCR [ddPCR]) to estimate the number of target DNA copies in an eDNA sample. qPCR technologies are frequently used for species-specific quantitative detection of one target organism in an eDNA sample.
ResilienceWe define resilience as the capacity of a(n) (eco)system to persist or maintain function in the face of exogenous disturbances. That is, the capacity of an ecosystem to tolerate disturbance without collapsing into a different state that is controlled by a different set of processes. This is primarily encapsulated by two elements, resistance to and recovery from pressure.
x

Executive Summary
Fish Stock Assessment Challenges
Traditional fish stock survey methods have not changed much over the last century, urging the need for improvement and innovation. The fish stock assessment field, however, is conservative and consequently reticent to accept new methods for which no vetted standard exists. Despite this, external pressures are forcing the field in new directions that accommodate the reality of reduced survey time, but also the need for new knowledge regarding commercial fish stocks, noncommerical species, untrawlable stocks, multispecies complexes, rare or vulnerable species, spatiotemporal resolution, climate change
dynamics, and new zones of interest (e.g., coastal zone and mesopelagic). Mitigation of habitat destruction associated with bottom trawling is also imperative. The ultimate goal must therefore be to extend beyond surveys and catch data in order to successfully implement ecosystem-based fisheries management (EBFM, see Glossary) programs. In addition, EBFM requires better information about ecosystem functional groups that are currently understudied or underdetermined, such as microorganisms, phytoplankton, mesopelagic species, gelatinous zooplankton, and, in many cases, also krill and the benthos (Link et al. 2011).
eDNA as an EBFM-Compatible Survey Method
The analysis of environmental DNA (eDNA, see Glossary) has been proposed as a cost-effective tool to improve fish stock assessments and to address the knowledge requirements for EBFM. Although extensive validation and benchmarking work remains before eDNA can be integrated into fish stock assessment frameworks, important preliminary eDNA research underscores the potential of eDNA to drive advancement from stock assessments limited to trawl survey and catch data toward the implementation of EBFM. The key challenge moving forward, however, will be establishing an acceptable balance between new knowledge and uncertainty,
particularly regarding false negatives, as well as eDNA degradation and transport rates. Furthermore, eDNA methods are currently unsuitable for resolving fish age estimation errors, maturity status, acoustic interpretations, and life history structures, all of which are critically important for accurate stock assessments. Recent research, however, demonstrates that the immediate potential benefits for eDNA applications to accommodate resource limitations and supplement traditional survey data demand an open and constructive dialog for prompt implementation of eDNA applications within fish stock assessment streams.
xi

Motivation for this White Paper
Fisheries management in Norway is based on the Marine Resources Act of 6 June 2008,2
2 https://www.fiskeridir.no/English/Fisheries/Regulations/The-marine-resources-act
which states that priority shall be granted to an ecosystem (see Glossary) approach to fisheries management that takes into account habitats and biodiversity in the management of living marine resources. In parallel with the development of this act, plans for holistic ecosystem-based management were established for all Norwegian offshore waters (NMCE 2005, 2009, 2013). This calls for the development of an EBFM programme for Norwegian waters (Gullestad et al. 2017). An important step in the development of EBFM is to identify knowledge gaps that hinder the development of multispecies fisheries management. Pursuant to this goal, a recent report was prepared jointly by IMR, the Norwegian Directorate of Fisheries, and the Norwegian Ministry of Trade, Industry and Fisheries, identifying important knowledge gaps for the development of multispecies fisheries management (Huse et al. 2018). Other aspects of EBFM, such as the protection of vulnerable species and habitats from negative impacts of fishing activities, are being followed up through formulation and implementation of ecosystem-based management policy.
Similar to Norway, management of marine fisheries in the United States is governed primarily by the Magnuson–Stevens Fishery Conservation and Management Act (MSA).3
3 https://go.usa.gov/xGNzY
Under the MSA, NOAA Fisheries is responsible for ending overfishing and rebuilding stocks,4
4 https://www.fisheries.noaa.gov/feature-story/status-stocks-2017
which strengthens the value of fisheries to the economy, communities, and marine ecosystems. Like Norway, NOAA Fisheries has long recognized the importance of EBFM. NOAA Fisheries defines EBFM as “a systematic approach to fisheries management in a geographically specified area that contributes to the resilience (see Glossary) and sustainability of the ecosystem; recognizes the physical, biological, economic, and social interactions among the affected fishery-related components of the ecosystem, including humans; and seeks to optimize benefits among a diverse set of societal goals” (NMFS 2016). Under this policy, EBFM includes considerations of interactions among fisheries, protected species, aquaculture, habitats, and other ecosystem components, including the human communities that depend upon them and their associated ecosystem services. EBFM examines the broader suite of factors that impact fisheries, and it considers the potential impacts of fisheries and fished stocks on other parts of the ecosystem. These impacts can include other fish species or marine mammals. “Societal goals” should also consider and include any relevant economic, social, and ecological factors in the context of relating to fisheries and fishery resources. In addition, EBFM is cognizant of both human and ecological considerations.
xii

U.S.–Norway Bilateral Working Group
On 1–2 May 2018, the NOAA Fisheries Office of Science and Technology, the Institute of Marine Research, and the Norwegian Counselor for Science, Technology, and Higher Education convened a U.S.–Norway Science Roundtable, “eDNA analyses: A tool for quantitative assessment of marine ecosystems.” The purpose for this meeting was to bring together bilateral research and fisheries management expertise in order to assess the state of the art for eDNA use in fisheries management, as well as to define areas where further research is clearly needed. The themes for this workshop included:
• Applications of eDNA in management of fisheries and aquacultures.
• Review of existing reference databases and quality appropriateness.
• Achieving quantification of fish stock biomass using eDNA.
• Current protocols and standardized approaches.
This initial workshop was hosted at Woods Hole Oceanographic Institute (WHOI) in the United States, and was attended by representatives from Norway’s Institute of Marine Research (IMR), U.S. and Norwegian academic and non-governmental organizations, and NOAA. A follow-up bilateral meeting was held at IMR in Tromsø, Norway, on 8–11 October 2018, to further discuss needed steps to advance the use of eDNA as a tool for fisheries stock assessments and management. The themes for the second workshop included:
• A metastudy to define the state of the art for eDNA.
• Development of an internal standard for eDNA-based assessments.
• Designing interlaboratory comparisons (ILCs).
• Planning a joint eDNA project aboard the Norwegian icebreaker, the HKH Kronprins Håkon, from 1–28 May 2019, in order to investigate the mesopelagic layer as a potential new fishery in the northeastern Atlantic Ocean.
• Drafting a white paper on eDNA use in fisheries stock assessments.
Finally, a third workshop was hosted at IMR in Bergen, Norway, on 9–10 May 2020, in conjunction with the WHOI–IMR Ocean Outlook conference. The goals of this workshop included:
• Presentation of management-level strategies for eDNA integration at IMR and NOAA.
• Joint development of standard protocols for sampling, analysis, and data management.
• Coordination for sample analysis from the joint eDNA project on mesopelagic fisheries.
• Establishment of time-series sample archives at all institutions.
• Finalization of the eDNA white paper for publication at IMR and NOAA.
This NOAA White Paper is the result of these cumulative efforts.
xiii
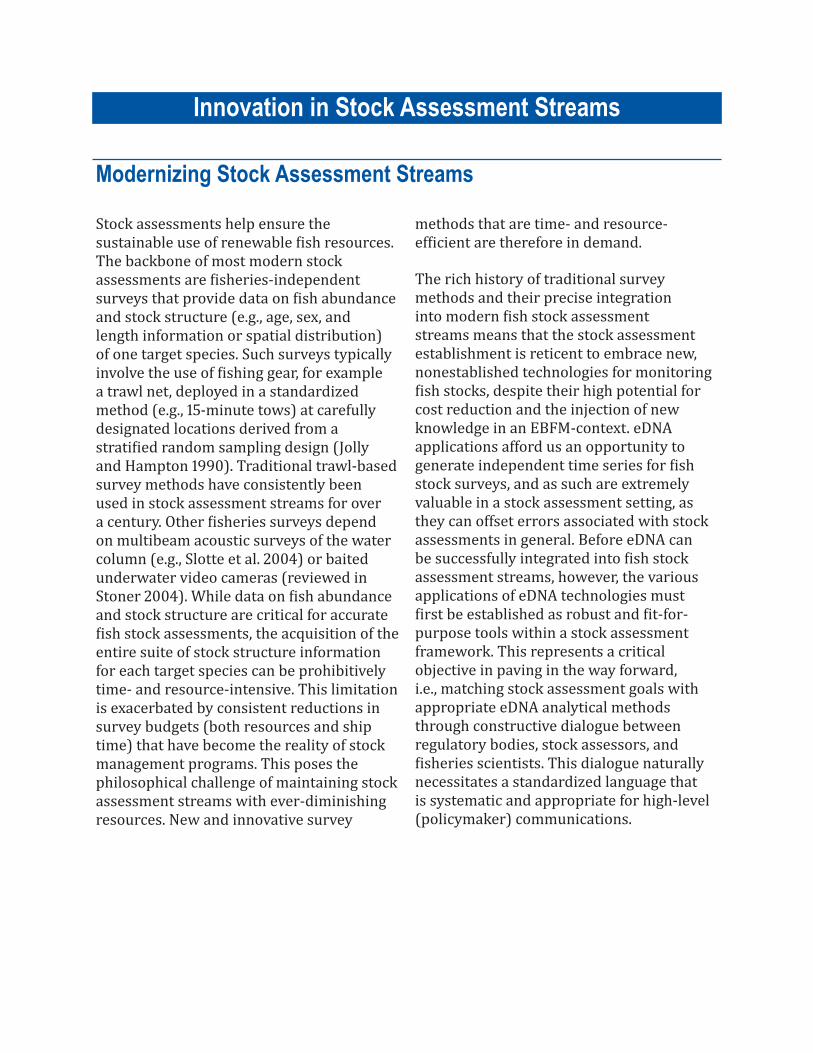
Document Scope
This work is intended as a reference document to serve management at the National Oceanic and Atmospheric Administration (NOAA) and the Institute of Marine Research of Norway (IMR), with the goal of harnessing interagency collaboration to delineate a path forward for environmental DNA (hereafter “eDNA”) practical applications during the next three-to-five years (2020–25). Applications for eDNA are wide-ranging (e.g., Thomsen et al. 2016, Cowart et al. 2018, Parsons et al. 2018, Cordier et al. 2019, Ruppert et al. 2019, Salter et al. 2019, Siegenthaler et al. 2019, Djurhuus et al. 2020). This working group is specifically focused on one of the most ambitious uses, namely, eDNA for fisheries stock assessments and management. This application would create great value for commercial fisheries due to its potential cost–benefit balance. Accommodating both scientific and legislative obligations for an ecosystem-based approach to fisheries management (Link 2002, Pew Oceans Commission 2003,
Pikitch et al. 2004, USCOP 2004, Link 2010, Link et al. 2011, Long et al. 2015, Huse et al. 2018), we aim to provide input not only as to how eDNA can provide supplementary data for stock assessments, but also as to how the eDNA framework can be used to support further development of EBFM. While we note that new knowledge provided by eDNA is also highly relevant for governance of marine ecosystem services in general, we restrict this paper to issues relevant for commercial fisheries management in the interest of focus and clarity. As the pace of change within the field of eDNA is so rapid, this white paper is representative of the date of publication only and should be updated in the future as demand requires. Our desire is to work in conjunction with ongoing fisheries stock assessment activities in order to enhance the applicability of eDNA-based tools, ensure their relevance and utility, address stock assessor uncertainty, and promote ongoing dialogue for appropriate prioritization of research efforts and resources.
xiv
Innovation in Stock Assessment Streams
Modernizing Stock Assessment Streams
Stock assessments help ensure the sustainable use of renewable fish resources. The backbone of most modern stock assessments are fisheries-independent surveys that provide data on fish abundance and stock structure (e.g., age, sex, and length information or spatial distribution) of one target species. Such surveys typically involve the use of fishing gear, for example a trawl net, deployed in a standardized method (e.g., 15-minute tows) at carefully designated locations derived from a stratified random sampling design (Jolly and Hampton 1990). Traditional trawl-based survey methods have consistently been used in stock assessment streams for over a century. Other fisheries surveys depend on multibeam acoustic surveys of the water column (e.g., Slotte et al. 2004) or baited underwater video cameras (reviewed in Stoner 2004). While data on fish abundance and stock structure are critical for accurate fish stock assessments, the acquisition of the entire suite of stock structure information for each target species can be prohibitively time- and resource-intensive. This limitation is exacerbated by consistent reductions in survey budgets (both resources and ship time) that have become the reality of stock management programs. This poses the philosophical challenge of maintaining stock assessment streams with ever-diminishing resources. New and innovative survey
methods that are time- and resource-efficient are therefore in demand.
The rich history of traditional survey methods and their precise integration into modern fish stock assessment streams means that the stock assessment establishment is reticent to embrace new, nonestablished technologies for monitoring fish stocks, despite their high potential for cost reduction and the injection of new knowledge in an EBFM-context. eDNA applications afford us an opportunity to generate independent time series for fish stock surveys, and as such are extremely valuable in a stock assessment setting, as they can offset errors associated with stock assessments in general. Before eDNA can be successfully integrated into fish stock assessment streams, however, the various applications of eDNA technologies must first be established as robust and fit-for-purpose tools within a stock assessment framework. This represents a critical objective in paving in the way forward, i.e., matching stock assessment goals with appropriate eDNA analytical methods through constructive dialogue between regulatory bodies, stock assessors, and fisheries scientists. This dialogue naturally necessitates a standardized language that is systematic and appropriate for high-level (policymaker) communications.

Potential Benefits of eDNA for EBFM
eDNA-based methods show significant potential due to the comparatively low cost and sampling effort required. The analysis (qualitative, descriptive, quantitative) is versatile, providing a variety of ways to integrate the data into fish stock monitoring programs. In particular, we consider the most promising areas for new knowledge gain to be:
1. Information about important rare and invasive species.
2. Information from habitats not conducive to traditional sampling.
3. Increased temporal and spatial resolution.4. Diet analysis.5. Biomass estimations.6. Greater flexibility in the distribution of
samples for processing.7. Facilitating additional sample acquisition
and storage for archive purposes.
Data-poor fish stocks represent a significant knowledge gap that would immediately be aided by eDNA implementation. There are a number of stocks monitored by NOAA in the United States and IMR in Norway for which there is currently little or no
information. Expenses associated with the assessment of some species impose relatively sparse spatial and temporal survey efforts, exacerbating the challenge of assessment and management. One example of a fish stock that is data-poor both in the United States and in Norway is the rockfish multispecies complex, which lives in rocky and largely untrawlable habitats that preclude accurate detection by traditional trawl surveys (Thompson et al. 2016). Optical and acoustic surveys that could safely operate in these habitats are prohibitively expensive to deploy, thus propagating the inability of regulatory authorities to manage these understudied fish stocks in a sustainable way. Other data-poor fish stocks for which there is a paucity of historical survey information (Skjoldal et al. 2004) are bottom-dwelling cartilaginous fishes (sharks, skates, and rays), mesopelagic fisheries, and deep-sea fish. For these fisheries in particular, eDNA analysis represents a promising tool for immediate improvement of sparsely populated knowledge bases.
Capabilities and Limitations of eDNA Applications
No survey method is without bias, a statement which applies as much to traditional survey methods as to more recent eDNA applications. Nonoverlapping bias between different survey methods, however, showcases the large potential for new and innovative combinations of fish stock survey methods to improve knowledge bases through complementarity. As the least-established of survey methods, eDNA
must be sufficiently tested to confirm fit-for-purpose application relative to the overarching stock assessment goals (Hansen et al. 2018, Kelly et al. 2019, Shelton et al. 2019). Quantitative PCR (qPCR and ddPCR) and amplicon sequencing (see Glossary) are two widely used eDNA applications that, respectively, provide specific/quantitative or descriptive/qualitative information about target populations.
2

Qualitative or quantitative eDNA analysis?The appropriateness of any eDNA application depends on the assessment goals and the nature of the investigated target population. Quantitative PCR methods, for example, proffer high detection sensitivity and specificity (Jerde et al. 2011, Wilcox et al. 2016, Tillotson et al. 2018), which are highly relevant attributes for the investigation of rare targets such as new invasives (Ardura 2019), endangered species and habitat usage (Marshall and Stepien 2019, Sawaya et al. 2019, Stepien et al. 2019), and early-warning fish pathogen detection in association with aquaculture (Peters et al. 2018). Amplicon sequencing, on the other hand, provides an exploratory analysis of multispecies communities at a user-defined scale of resolution (Closek et al. 2019, Djurhuus et al. 2020) and is appropriate when descriptive knowledge of the majority of species in a community is needed. Descriptive amplicon sequencing (eDNA metabarcoding analysis) may not, however, be fit-for-purpose for multispecies surveys where indication of rare species occurrence is desired. In the same way that trawl surveys can miss capture of rare fish species, the relatively low proportion of eDNA from the rare species of interest may fall below the effective detection range and generate a false negative result (Kelly et al. 2019). Several studies have nonetheless demonstrated high detection sensitivity of even rare fish species using eDNA metabarcoding analysis (Shaw et al. 2016, Hatzenbuhler et al. 2017). Similarly, amplicon sequencing may be better suited for capturing species diversity, for example, in poorly described multispecies complexes or fish communities where insufficient knowledge exists (e.g., Ivanova et al. 2017) to allow the design and implementation of a species-specific quantitative assay.
Benchmarking eDNA applicationsStock assessment streams often call for eDNA methods to be benchmarked or vetted against traditional survey method results (Hansen et al. 2018). While fish capture remains the gold standard for sampling, eDNA shows considerable promise for resolving spatial and temporal distribution, particularly as the spatial and temporal smoothing of the eDNA signal is less patchy than the occurrence of a single fish (Shelton et al. 2019). Benchmarking studies have furthermore demonstrated remarkably fine spatial resolution of eDNA for fish detection, at distances as low as 60 m (Port et al. 2016) or less than 75 m (O’Donnell et al. 2016). Comparative studies of eDNA applications with traditional survey methods at the local (e.g., Thomsen et al. 2012, Doi et al. 2015, Yamamoto et al. 2016, Knudsen et al. 2019) and regional scale (Salter et al. 2019, Shelton et al. 2019) demonstrated a higher degree of correspondence between different survey methods, including species-specific quantitative PCR amplification, at larger spatial scales. These results show promise for efforts to gain acceptance for eDNA applications in fish stock assessment streams, although the importance of sampling design and sufficient replication is clearly indicated.
Working group recommendationsFor all of the benefits described above, eDNA can be applied in concert with traditional survey tools to create a richer knowledge base as regulatory authorities move toward ecosystem-based fisheries management (EBFM), which requires information about the environmental and ecological context for the fish stocks in question. We outline a range of eDNA applications for EBFM below and in Table 1.
3

Table 1. Targeted implementation of eDNA within current stock assessment routines to address various knowledge gaps (Topic). We also indicate whether the readiness level of eDNA-based monitoring methods is suitable for addressing each specific task at the present time (2020).
TopiceDNA use? Comments
Life history structure N Not possible with eDNA yet.
Gender ID Ya Could be possible for species with published sex-linked genetic markers.
Stock boundaries Yb See review by Adams et al. (2019).
Occurrence Y Several studies have documented that eDNA is suitable for this. Dependent on a curated reference database.
Migration pattern N However, can identify habitat shifts and alteration of species distribution.
Index of abundance Y Relative abundance.
Locations of next stock surveys
Y Can detect distribution, help assess where to target with survey cruises.
Genetic diversity to assess stock health
N However, can be used to detect aquaculture-relevant pathogens.
Identify species, not just species complex
Y Several studies have documented that eDNA is suitable for this. Dependent on a curated reference database.
Long-term time series Y As with traditional assessments, eDNA can be used to detect fluctuations in species composition between seasons/years.
Correct identification Y Taxonomically and/or morphologically verified species that are present in reference database(s).
Assess recruitment N eDNA-based evaluation of aging is currently not reliable.
Identify spawning grounds Y See Bracken et al. (2018). Critical for EBFM rather than stock assessments.
Diet data (gut content) Y Molecular diet analysis has, in recent years, proven to be a valid method for both filter- and raptorial-type predators/grazers.
Relative abundance of species in a mixed catch
Y See Ruppert et al. (2019) and references therein.
a Some species.b Promising.
The wish list of applications for which eDNA can potentially enhance the knowledge base for fisheries management is ambitious. Table 1 presents possible eDNA applications within the next 5–10 years. Although the “readiness level” of eDNA-based methods is sufficient for some of these applications in current stock assessment streams (Table 1), it should be noted that the application of eDNA is not to be a goal in and of itself, but rather an informed choice based on selection of the most appropriate tool(s) for the objectives at hand. Based on the state of the art for eDNA application for fish stock assessments (Hansen et al. 2018),
this panel can currently make the following recommendations for implementing eDNA for fish stock assessments:
1. Goal: Single or few target species. Recommended eDNA application: qPCR or ddPCR .
2. Goal: Multispecies survey, target-agnostic. Recommended eDNA application: amplicon sequencing (eDNA metabarcoding) with general primers.
3. Goal: Multispecies survey with specific targets. Recommended eDNA application: Custom primers and amplicon sequencing.
4

Establishment of eDNA Survey Indices
A general first step toward understanding eDNA and making it useful for management is simply to begin collecting samples for eDNA in a well designed manner with sufficient replication for statistical power. Pairing eDNA sampling with existing traditional surveys to enable basic correlational analyses is desirable, but not required. Until recently, few researchers had attempted to construct an eDNA abundance index in marine systems. Although both net samples and eDNA surveys can provide estimates of target species biomass, it makes statistically little sense to compare the results of the two directly due to multiple, independent sources of error for each method (Shelton et al. 2016, although see Salter et al. 2019). One robust alternative to problematic direct method comparisons is the use of abundance indices calculated from different stock assessment methods—for example, net capture and eDNA detection. Assuming constancy of collection methods in the underlying data series, abundance indices likely behave proportionally with real fish abundance, thereby permitting comparison of stock size estimations across space and over time (Shelton et al. 2019). In the aforementioned study, the authors demonstrated how to construct an eDNA survey index from quantitative PCR results, and further revealed that eDNA-derived estimates of
Pacific salmon in an estuary were similar to both estuary-scale abundance and biomass estimates derived from beach seines during the salmon migration. Interestingly, the estuary-wide abundance indices were highly correlated even though, at the local site-scale, eDNA was only weakly correlated to nearby seine catches, suggesting the two sampling methods revealed different information at the two spatial scales. Indeed, a recent comparison of trawl surveys and quantitative PCR for estimates of Atlantic cod biomass correspondingly demonstrated a high correlation between abundance measures when regional (i.e., multistation) results were considered (Salter et al. 2019), emphasizing the importance of scale. In addition to these field applications of eDNA methods which rely primarily on quantitative PCR methods, recent simulation studies suggest that abundance indices may be possible to construct using eDNA metabarcoding approaches (Kelly et al. 2019). If these results hold in practice, they could open the door for monitoring tens or hundreds of species quantitatively from individual samples at the same time. Given sufficient sampling, we can realistically create indices from eDNA that are likely to provide insight into marine populations. Indeed, such indices form the building blocks of many modern stock assessments (Djurhuus et al. 2020).
eDNA Can Fill in Knowledge Gaps
eDNA methods requiring relatively low-volume water samples (one to tens of liters) can potentially facilitate sampling efforts in otherwise inaccessible areas. Furthermore, as eDNA-based methods do not require animal capture, bias associated with target organism evasion/escape and/or visual taxonomic identification is avoided. The minimal
infrastructure required for water sampling for eDNA-based analysis (a standard CTD rosette) greatly expands the effective size of the stock assessment “fleet,” enabling higher-resolution sampling in both space and time without increasing cost-per-unit-effort (relative to trawl and acoustic surveys). The compact size of eDNA samples, i.e., small filters that
5

can be stored, and stability of eDNA during long-term frozen storage opens the door for replicative sampling, sample archiving, sample sharing, and repeat analyses in parallel with technological development and/or quality assurance routines.
The spatial scale for eDNA detection is likely to be small. Although eDNA-based analyses should be interpreted conservatively with respect to the spatial and temporal origin of the detected signal, the potential for high sampling density with reduced sampling effort facilitates the assessment of stocks that require more frequent and/or more accurate assessment in order to determine annual catch limits (ACL). The reader is referred to Appendix A for detailed information about ongoing U.S.–Norway individual and bilaterial survey initiatives utilizing eDNA to fill in existing knowledge gaps in fisheries stock assessments.
Multispecies surveysIn traditional surveys, the trawl is rigged to capture species of interest. One relevant example is trawl surveys for cod (Gadus morhua) in Norwegian fjords, which may also capture sharks (subclass Elasmobranchii), rockfish (Sebastes spp.), or saithe (Pollachius spp.). Limitations of traditional surveys for multispecies identification can be supplemented by eDNA-based methods. eDNA metabarcoding may reveal relative abundance of eDNA from mixed-aged aggregates and for species of different sizes and behaviors, thus significantly increasing the informational yield from a single survey effort. This includes the ability to resolve multispecies complexes. This is of particular importance when a multispecies complex encompasses both commercially important species as well as protected species. As the trawl configuration is optimized for cod capture, however, the
utility of the capture data for assessing stocks of protected shark species is limited.
Range shifts and invasive speciesAs climatic conditions change, the distribution of affected fish stocks may change in response to temperature and/or prey availability. Fossheim et al. (2015), for example, documented a northward expansion of temperate fish species into the Barents Sea. “Atlantification” of the region north of Svalbard (Randelhoff et al. 2018) has led to demonstrated changes in the microbial communities that underpin Arctic microbial food webs (Fadeev et al. 2018). eDNA may prove to be a powerful method for early detection of range shifts for established fish stocks. Metabarcoding also shows potential as a tool for investigation of invasive species introduction via ship ballast water (e.g., Zaiko et al. 2015).
Data-poor and data-limited speciesNOAA and IMR have both divided species or stocks into species that the institutes collect full information on for management, and other species which are defined as data-poor or data-limited species. This is done either because there is no time or money (or both) to conduct cruises, or because the species are hard to find the right method for in order to trace their distribution/life history. Here, eDNA methods can contribute to create a richer knowledge base of distribution and abundance.
Time seriesSpatial data in ecology can tell us the status of the ecosystems at a given point of time. Temporal data, however, enable us to detect changes in ecosystem structure and make predictions about future patterns and trends in biodiversity (Pace et al. 2015). eDNA has the advantage of providing simultaneous
6

analyses of a wide range of taxonomic groups. Thus, time series based on eDNA data can be utilized in models that need both long timescales and a wide taxonomic coverage (Balint et al. 2018). For fishery-dependent data, where assessments are based purely on landings, eDNA data could be used to inexpensively begin the parallel process of creating a fisheries-independent time series of eDNA signals for that species (see Road Map for Future Research).
Trophic interactionsDetermining the temporal and spatial dynamics of prey communities is possible from the same eDNA samples collected for fish stock assessments. This additional information may form the foundation for a predictive tool for tracking fish stock movements as a function of prey availability. Djurhuus et al. (2020) have used a time series of marine eDNA samples to suggest a set of trophic interactions among hundreds of species in Monterey Bay. This may become particularly important as temporal mismatches in predator–prey interactions increase due to anthropogenic warming, as shown for species in the North Sea (Defriez et al. 2016, Edwards et al. 2016, Clausen et al. 2017). Furthermore, prey DNA abundance in predator fecal material may provide vital
information about predator–prey dynamics in marine habitats (e.g., Su et al. 2018).
HindcastsSparse trawl and acoustic survey data consist of, at most, one data point every 1–3 years. By exploiting the potential to gather eDNA samples through the utilization of both survey and nonsurvey infrastructure (see Existing resource utilization), an archive of biological sample material may be procured at high spatiotemporal resolution and independent of standard survey programmes. As eDNA is stable in frozen storage for several years, archival material may be accessed for retrospective analysis as a supplement to traditional survey methods, or to fill in knowledge gaps in the event of budget reduction for monitoring programs. Capitalizing on the speed, reproducibility, high throughput, and automation potential for eDNA analysis will reduce time lag from sampling to assessment result, the inherent advantages of which are mature for exploration and implementation in an EBFM context. In other words, rapid processing and production of eDNA data make it possible to perform assessments in an EBFM framework quickly enough for operational management decisions to be taken.
7

Road Map for Future Research
The potential for eDNA to fill knowledge gaps, enrich sparse survey data, and ensure survey continuity makes it an attractive tool for EBFM. The rate of technological advancement of DNA-based technologies promises the expansion of eDNA into new applications and continued improvement for current applications. In the short- to mid-term, eDNA should be used in concert with traditional measurements to understand the statistical attributes of eDNA abundance indices relative to current methods. In the future, it is possible that eDNA-derived information could be deemed sufficiently similar to existing surveys and replace them, partially or altogether. However, comparisons between eDNA and fish catch results are, at the moment, not straightforward or easy to interpret, as the two methodologies are different and unlikely to perfectly align.
Time Series and Baselines
The way forward for eDNA implementation should capitalize on cost-efficient, high-frequency sampling for the establishment of time series and species-specific “baselines.” eDNA can make a solid contribution for fish stocks for which little or no information exists. Recently, eDNA and baited remote underwater video systems (BRUVS) have been combined to study diversity in fish (Stat et al. 2018) and sharks (Boussarie et al. 2018), and the combination of these techniques identified 30% more species than either technique alone (Stat et al. 2018), generating valuable baseline data. The relatively consistent effort required for eDNA sample collection allows excess sample collection to ensure archival material without noteworthy additional effort or cost expenditure. Fully automated eDNA solutions for use in marine biodiversity mapping are also showing promise (Yamahara et al. 2019). Finally, collected and preserved eDNA samples can be used in future analyses, with both current analysis tools and technologies as well as new tools and technologies that expand the ability of eDNA applications to address the specific needs of stock assessment streams.
Parallel laboratory efforts to increase understanding of particle transport dynamics and species-specific eDNA behavior (see below and Appendix B) will ensure the development of eDNA as a robust survey tool. Time-series samples can be collected and archived according to recommendations (see Appendix B) such that sample material is available for analysis using current technologies or for reanalysis with future pipelines.
AutomationRecent technological advancements like autonomous underwater vehicles (AUV) have become both interesting and relevant for fish stock assessment streams. These are capable not only of visual observations but also of eDNA sampling through the integration of environmental sample processing (ESP1
1 https://www.mbari.org/science/upper-ocean-systems/ecogenomic-sensing/genomic-sensors-esp/
) units for in situ sample collection and processing (3G ESP2).
2 https://go.usa.gov/xGNzk
Full implementation of AUV-facilitated eDNA analysis would require careful assessment of deployment trajectories and sample coverage in order to define representative and meaningful sample sets.
8

AUV deployment for eDNA capture can, for example, be programmed based on fish stock movement models to direct sampling efforts and reduce both the cost and area covered.
CoordinationFisheries management agencies are resource-limited. The current and future financial situation entails significant budget reductions, with the direct consequence that fish stock survey intensity will be reduced. With so many financial and political elements in swing, fish stock assessments and fisheries management may undergo considerable restructuring within the next 5–10 years. It is therefore critical that all user groups are brought into the discussion at an early stage in order to ensure purposeful, pragmatic, and cost-effective implementation of eDNA in fish stock assessment streams and fisheries management plans. One possible point of action is to create scientific steering committees consisting of fisheries scientists, regulatory agencies, ecosystem and fish stock modellers, and even fishers, to ensure alignment of goals and priorities and to incentivize cooperation. The tangible outcomes of these discussions may include a collaborative cost–benefit evaluation of priority trade-offs in cases where eDNA methods can preserve data acquisition despite budget reductions. For example, what are the costs and benefits of one trawl survey every other year (the current situation) versus the costs and benefits of one trawl survey every fourth year with supplementary eDNA surveys during intervening years? Theoretical assessment of such priority trade-offs (survey frequency and type) are both timely and judicious, as trawl survey capacity has already experienced reduction, necessitating prompt action to preserve survey data series continuity.
Existing resource utilizationThe minimum infrastructure and technical competence required for eDNA sampling significantly expands the potential survey fleet, as nonfisheries vessels, small vessels, and even mooring stations can be recruited in addition to traditional survey vessels. This includes commercial vessels, mooring stations, supply and maintenance vessels, ARGOS floats, nonfisheries research cruises, ferries, small fishing vessels, and underway monitoring equipment. In some cases, nonsurvey vessels may represent a better alternative for eDNA sampling as the risk of historical contamination (traces from previous trawl surveys) is minimal. Such an “eDNA-capable fleet,” in which a relatively small fraction of ship time and resources is appropriated (or purchased) for water sample collection, represents a financially sound, flexible ,and scientifically viable supplement to the patchy data provided by infrequent acoustic and trawl surveys in current stock assessment streams. This model allows for distributed eDNA sampling in a geographic area of interest to achieve high spatial resolution, and accommodates the enlistment of fixed sampling points such as mooring stations or petroleum installations from which repeat eDNA sampling over time (e.g., through the deployment of remotely controlled or semiautomated ESPs) can provide high temporal resolution data. Installation of underwater camera systems on moored or floating structures has already been demonstrated to be both feasible and informative for monitoring fish diversity and abundance (e.g., Brehmer et al. 2019). Capitalizing on existing infrastructure for acquisition and archiving of eDNA samples is thus a low-hanging fruit whose operational endpoint will be a boost toward
9

the creation of time series and dispersal data required to establish, for example, ecological baselines. In the long term, it is conceivable that increasing the quality of fish stock survey information through
implementation of eDNA in stock assessment streams may allow a gradual reduction in the frequency of trawl and/or acoustic surveys. Freed ship capacity could then be used to fill in survey gaps for other fish stocks.
•
10
References
Adams, C. I., M. Knapp, N. J. Gemmell, G. J. Jeunen, M. Bunce, M. D. Lamare, and H. R. Taylor. 2019. Beyond Biodiversity: Can Environmental DNA (eDNA) Cut It as a Population Genetics Tool? Genes 10(3):192.
Ardura, A. 2019. Species-specific markers for early detection of marine invertebrate invaders through eDNA methods: Gaps and priorities in GenBank as database example. Journal for Nature Conservation 47:51–57.
Balint, M., M. Pfenninger, H. P. Grossart, P. Taberlet, M. Vellend, M. A. Leibold, G. Englund, and D. Bowler. 2018. Environmental DNA Time Series in Ecology. Trends in Ecology & Evolution 33(12):945–957.
Boussarie, G., J. Bakker, O. S. Wangensteen, S. Mariani, L. Bonnin, J. B. Juhel, J. J. Kiszka, M. Kulbicki, S. Manel, W. D. Robbins, and L. Vigliola. 2018. Environmental DNA illuminates the dark diversity of sharks. Science Advances 4(5):eaap9661.
Bracken, F. S., S. M. Rooney, M. Kelly-Quinn, J. J. King, and J. Carlsson. 2019. Identifying spawning sites and other critical habitat in lotic systems using eDNA “snapshots”: A case study using the sea lamprey Petromyzon marinus L. Ecology and Evolution 9(1):553–567.
Brehmer, P., G. Sancho, V. Trygonis, D. Itano, J. Dalen, A. Fuchs, A. Faraj, and M. Taquet. 2019. Towards an autonomous pelagic observatory: Experiences from monitoring fish communities around drifting FADs. Thalassas: An International Journal of Marine Sciences 35(1):177–189.
Clausen, L. W., A. Rindorf, M. Van Deurs, M. Dickey-Collas, and N. T. Hintzen. 2018. Shifts in North Sea forage fish productivity and potential fisheries yield. Journal of Applied Ecology 55(3):1092–1101.
Closek, C. J., J. A. Santora, H. A. Starks, I. D. Schroeder, E. A. Andruszkiewicz, K. M. Sakuma, S. J. Bograd, E. L. Hazen, J. C. Field, and A. B. Boehm. 2019. Marine vertebrate biodiversity and distribution within the central California Current using environmental DNA (eDNA) metabarcoding and ecosystem surveys. Frontiers in Marine Science 6:732.
Cordier, T., F. Frontalini, K. Cermakova, L. Apothéloz-Perret-Gentil, M. Treglia, E. Scantamburlo, V. Bonamin, and J. Pawlowski. 2019. Multi-marker eDNA metabarcoding survey to assess the environmental impact of three offshore gas platforms in the North Adriatic Sea (Italy). Marine Environmental Research 146:24–34.
Cowart, D. A., K. G. Breedveld, M. J. Ellis, J. M. Hull, and E. R. Larson. 2018. Environmental DNA (eDNA) applications for the conservation of imperiled crayfish (Decapoda: Astacidea) through monitoring of invasive species barriers and relocated populations. Journal of Crustacean Biology 38(3):257–266.
Defriez, E. J., L. W. Sheppard, P. C. Reid, and D. C. Reuman. 2016. Climate change-related regime shifts have altered spatial synchrony of plankton dynamics in the North Sea. Global Change Biology 22(6):2069–2080.
Djurhuus, A., C. J. Closek, R. P. Kelly, K. J. Pitz, R. P. Michisaki, H. A. Starks, K. R. Walz, E. A. Andruszkiewicz, E. Olesin, K. Hubbard, E. Montes, D. Otis, F. E. Muller-Karger, F. P. Chavez, A. B. Boehm, and M. Breitbart. 2020. Environmental DNA reveals seasonal shifts and potential interactions in a marine community. Nature Communications 11:254. DOI: 10.1038/s41467-019-14105-1
Doi, H., K. Uchii, T. Takahara, S. Matsuhashi, H. Yamanaka, and T. Minamoto. 2015. Use of droplet digital PCR for estimation of fish abundance and biomass in environmental DNA surveys. PLOS One 10(3):e0122763.
11

Edwards, M., P. Helaouet, R. A. Alhaija, S. Batten, G. Beaugrand, S. Chiba, R. R. Horaeb, G. Hosie, A. Mcquatters-Gollop, C. Ostle, A. J. Richardson, W. Rochester, J. Skinner, R. Stern, K. Takahashi, C. Taylor, H. M. Verheye, and M. Wootton. 2016. Global Marine Ecological Status Report: Results from the global CPR Survey 2014/2015. SAHFOS Technical Report 11:1–32. Plymouth, United Kingdom.
Fadeev, E., I. Salter, V. Schourup-Kristensen, E. M. Nöthig, K. Metfies, A. Engel, J. Piontek, A. Boetius, and C. Bienhold. 2018. Microbial communities in the East and West Fram Strait during sea-ice melting season. Frontiers in Marine Science 5:429.
Fossheim, M., R. Primicerio, E. Johannesen, R. B. Ingvaldsen, M. M. Aschan, and A. V. Dolgov. 2015. Recent warming leads to a rapid borealization of fish communities in the Arctic. Nature Climate Change 5(7):673.
Goodwin, K. D., L. R. Thompson, B. Duarte, T. Kahlke, A. R. Thompson, J. C. Marques, and I. Caçador. 2017. DNA sequencing as a tool to monitor marine ecological status. Frontiers in Marine Science 4:107.
Gullestad, P., A. M. Abotnes, G. Bakke, M. Skern-Mauritzen, K. Nedreaas, and G. Søvik. 2017. Towards ecosystem-based fisheries management in Norway—Practical tools for keeping track of relevant issues and prioritising management efforts. Marine Policy 77:104–110.
Hansen, B. K., D. Bekkevold, L. W. Clausen, and E. E. Nielsen. 2018. The sceptical optimist: Challenges and perspectives for the application of environmental DNA in marine fisheries. Fish and Fisheries 19(5):751–768.
Hatzenbuhler, C., J. R. Kelly, J. Martinson, S. Okum, and E. Pilgrim. 2017. Sensitivity and accuracy of high-throughput metabarcoding methods for early detection of invasive fish species. Scientific Reports 7:46393.
Huse, G., M. Skern-Mauritzen, B. Bogstad, P. Sandberg, T. Ottemo, A. K. Veim, E. Sørdahl, and B. Bertelsen. 2018. Muligheter og prioriteringer for flerbestandsforvaltning i norske fiskerier. Fisken og havet 7-2018.
Ivanova, N. V., T. S. Zemlak, R. H. Hanner, and P. D. Hebert. 2007. Universal primer cocktails for fish DNA barcoding. Molecular Ecology Notes 7(4):544–548.
Jerde, C. L., A. R. Mahon, W. L. Chadderton, and D. M. Lodge. 2011. “Sight-unseen” detection of rare aquatic species using enviornmental DNA. Conservatin Letters 4:150–157.
Jolly, G. M., and I. Hampton. 1990. A stratified random transect design for acoustic surveys of fish stocks. Canadian Journal of Fisheries and Aquatic Sciences 47(7):1282–1291.
Kelly, R. P., A. O. Shelton, and R. Gallego. 2019. Understanding PCR Processes to Draw Meaningful Conclusions from Environmental DNA Studies. Scientific Reports 9:12133.
Knudsen, S. W., R. B. Ebert, M. Hesselsøe, F. Kuntke, J. Hassingboe, P. B. Mortensen, P. F. Thomsen, E. E. Sigsgaard, B. K. Hansen, E. E. Nielsen, and P. R. Møller. 2019. Species-specific detection and quantification of environmental DNA from marine fishes in the Baltic Sea. Journal of Experimental Marine Biology and Ecology 510:31–45.
Link, J. S. 2002. Ecological considerations in fisheries management: When does it matter? Fisheries 27(4):10–17.
Link, J. S. 2010. Ecosystem-Based Fisheries Management: Confronting Tradeoffs. Cambridge University Press, United Kingdom.
Link, J. S., A. Bundy, W. J. Overholtz, N. Shackell, J. Manderson, D. Duplisea, J. Hare, M. Koen-Alonso, and K. D. Friedland. 2011. Ecosystem-based fisheries management in the Northwest Atlantic. Fish and Fisheries 12(2):152–170.
Long, R. D., A. Charles, and R. L. Stephenson. 2015. Key principles of marine ecosystem-based management. Marine Policy 57:53–60.
12
Marshall, N., and C. A. Stepien. 2019. Invasion genetics from thousands of larvae and eDNA of zebra and quagga mussels using targeted metabarcode High-Throughput Sequencing. Ecology and Evolution 9(6):3515.
Murawski, S. A., and G. C. Matlock, editors. 2006. Ecosystem Science Capabilities Required to Support NOAA’s Mission in the Year 2020. U.S. Department of Commerce, NOAA Technical Memorandum NMFS-F/SPO-74.
NMCE (Norwegian Ministry of Climate and Environment). 2005. Integrated Management of the Marine Environment of the Barents Sea and the Sea Areas off the Lofoten Islands. Report No. 8 (2005–2006) to the Norwegian Parliament, Oslo, Norway.
NMCE (Norwegian Ministry of Climate and Environment). 2009. Integrated Management of the Marine Environment of the Norwegian Sea. Report No. 37 (2008–2009) to the Norwegian Parliament, Oslo, Norway.
NMCE (Norwegian Ministry of Climate and Environment). 2013. Integrated Management of the Marine Environment of the North Sea and Skagerrak (Management Plan). Report No. 37 (2012–2013) to the Norwegian Parliament, Oslo, Norway.
NMFS (National Marine Fisheries Service). 2016. NOAA Fisheries Ecosystem-Based Fisheries Management Road Map. National Marine Fisheries Service Instruction 01-120-01 (17 November 2016). Silver Spring, Maryland.
O’Donnell, J. L., R. P. Kelly, A. O. Shelton, J. F. Samhouri, N. C. Lowell, and G. D. Williams. 2017. Spatial distribution of environmental DNA in a nearshore marine habitat. PeerJ 5:e3044.
Pace, M. L., S. R. Carpenter, and J. J. Cole. 2015. With and without warning: Managing ecosystems in a changing world. Frontiers in Ecology and the Environment 13(9):460–467.
Parsons, K. M., M. Everett, M. Dahlheim, and L. Park. 2018. Water, water everywhere: Environmental DNA can unlock population structure in elusive marine species. Royal Society Open Science 5(8):180537.
Peters, L., S. Spatharis, M. A. Dario, T. Dwyer, I. J. Roca, A. Kintner, Ø. Kanstad-Hanssen, M. S. Llewellyn, and K. Praebel. 2018. Environmental DNA: A New Low-Cost Monitoring Tool for Pathogens in Salmonid Aquaculture. Frontiers in Microbiology 9:3009.
Pew Oceans Commission. 2003. America’s Living Oceans: Charting a Course for Sea Change. Pew Oceans Commission, Arlington, Virginia.
Pikitch, E. K., C. Santora, E. A. Babcock, A. Bakun, R. Bonfil, D. O. Conover, P. A.O. Dayton, P. Doukakis, D. Fluharty, B. Heneman, and E. D. Houde. 2004. Ecosystem-based fishery management. Science 305(5962):346.
Port, J. A., J. L. O’Donnell, O. C. Romero-Maraccini, P. R. Leary, S. Y. Litvin, K. J. Nickols, K. M. Yamahara, and R. P. Kelly. 2016. Assessing vertebrate biodiversity in a kelp forest ecosystem using environmental DNA. Molecular Ecology 25(2):527–541.
Randelhoff, A., M. Reigstad, M. Chierici, A. Sundfjord, V. Ivanov, M. R. Cape, M. Vernet, J. É. Tremblay, G. Bratbak, and S. Kristiansen. 2018. Seasonality of the physical and biogeochemical hydrography in the inflow to the Arctic Ocean through Fram Strait. Frontiers in Marine Science 5:224.
Ruppert, K. M., R. J. Kline, and M. S. Rahman. 2019. Past, present, and future perspectives of environmental DNA (eDNA) metabarcoding: A systematic review in methods, monitoring, and applications of global eDNA. Global Ecology and Conservation 17:e00547.
Salter, I., M. Joensen, R. Kristiansen, P. Steingrund, and P. Vestergaard. 2019. Environmental DNA concentrations are correlated with regional biomass of Atlantic cod in oceanic waters. Nature Communications Biology 2(1):1–9.
13

Sato, Y., M. Miya, T. Fukunaga, T. Sado, and W. Iwasaki. 2018. MitoFish and MiFish pipeline: A mitochondrial genome database of fish with an analysis pipeline for environmental DNA metabarcoding. Molecular Biology and Evolution 35(6):1553–1555.
Sawaya, N. A., A. Djurhuus, C. J. Closek, M. Hepner, E. Olesin, L. Visser, C. Kelble, K. Hubbard, and M. Breitbart. 2019. Assessing eukaryotic biodiversity in the Florida Keys National Marine Sanctuary through environmental DNA metabarcoding. Ecology and Evolution 9(3):1029–1040.
Shaw, J. L., L. J. Clarke, S. D. Wedderburn, T. C. Barnes, L. S. Weyrich, and A. Cooper. 2016. Comparison of environmental DNA metabarcoding and conventional fish survey methods in a river system. Biological Conservation 197:131–138.
Shelton, A. O., R. P. Kelly, J. L. O’Donnell, L. Park, P. Schwenke, C. Greene, R. A. Henderson, and E. M. Beamer. 2019. Environmental DNA provides quantitative estimates of a threatened salmon species. Biological Conservation 237:383–391.
Shelton, A. O., J. L. O’Donnell, J. F. Samhouri, N. Lowell, G. D. Williams, and R. P. Kelly. 2016. A framework for inferring biological communities from environmental DNA. Ecological Applications 26(6):1645–1659.
Siegenthaler, A., O. S. Wangensteen, C. Benvenuto, J. Campos, and S. Mariani. 2019. DNA metabarcoding unveils multiscale trophic variation in a widespread coastal opportunist. Molecular Ecology 28(2):232–249.
Skjoldal, H. R., and R. Saetre, editors. 2004. The Norwegian Sea Ecosystem. Fagbokforlaget, Bergen, Norway.
Slotte, A., K. Hansen, J. Dalen, and E. Ona. 2004. Acoustic mapping of pelagic fish distribution and abundance in relation to a seismic shooting area off the Norwegian west coast. Fisheries Research 67(2):143–150.
Stat, M., J. John, J. D. DiBattista, S. J. Newman, M. Bunce, and E. S. Harvey. 2018. Combined use of eDNA metabarcoding and video surveillance for the assessment of fish biodiversity. Conservation Biology 33(1):196–205.
Stepien, C. A., M. R. Snyder, and A. E. Elz. 2019. Invasion genetics of the silver carp Hypophthalmichthys molitrix across North America: Differentiation of fronts, introgression, and eDNA metabarcode detection. PLOS One 14(3):e0203012.
Stoner, A. W. 2004. Effects of environmental variables on fish feeding ecology: Implications for the performance of baited fishing gear and stock assessment. Journal of Fish Biology 65(6):1445–1471.
Su, M., H. Liu, X. Liang, L. Gui, and J. Zhang. 2018. Dietary analysis of marine fish species: Enhancing the detection of prey-specific DNA sequences via high-throughput sequencing using blocking primers. Estuaries and Coasts 41(2):560–571.
Thompson, A. R., J. R. Hyde, W. Watson, D. C. Chen, and L. W. Guo. 2016. Rockfish assemblage structure and spawning locations in Southern California identified through larval sampling. Marine Ecology Progress Series 547:177–192.
Thomsen, P. F., J. Kielgast, L. L. Iversen, P. R. Møller, M. Rasmussen, and E. Willerslev. 2012. Detection of a diverse marine fish fauna using environmental DNA from seawater samples. PLOS One 7(8):e41732.
Thomsen, P. F., P. R. Møller, E. E. Sigsgaard, S. W. Knudsen, O. A. Jørgensen, and E. Willerslev. 2016. Environmental DNA from seawater samples correlate with trawl catches of subarctic, deepwater fishes. PLOS One 11(11):e0165252.
USCOP (U. S. Commission on Ocean Policy). 2004. An Ocean Blueprint for the 21st Century. Final Report. Washington, D.C. Available: govinfo.library.unt.edu/oceancommission/documents/full_color_rpt/000_ocean_full_report.pdf (August 2020).
14

Wilcox, T. M., K. S. McKelvey, M. K. Young, A. J. Sepulveda, B. B. Shepard, S. F. Jane, A. R. Whiteley, W. H. Lowe, and M. K. Schwartz. 2016. Understanding environmental DNA detection probabilities: A case study using a stream-dwelling char Salvelinus fontinalis. Biological Conservation 194:209–216.
Yamahara, K. M., C. M. Preston, J. M. Birch, K. R. Walz, R. Marin III, S. Jensen, D. Pargett, B. Roman, Y. Zhang, J. Ryan, and B. Ussler. 2019. In-situ Autonomous Acquisition and Preservation of Marine Environmental DNA Using an Autonomous Underwater Vehicle. Frontiers in Marine Science 6:373.
Yamamoto, S., K. Minami, K. Fukaya, K. Takahashi, H. Sawada, H. Murakami, S. Tsuji, H. Hashizume, S. Kubonaga, T. Horiuchi, M. Hongo, J. Nishida, Y. Okugawa, A. Fujiwara, M. Fukuda, S. Hidaka, K. W. Suzuki, M. Miya, H. Araki, H. Yamanaka, A. Maruyama, K. Miyashita, R. Masuda, T. Minamoto, and M. Kondoh. 2016. Environmental DNA as a ‘Snapshot’of Fish Distribution: A Case Study of Japanese Jack Mackerel in Maizuru Bay, Sea of Japan. PLOS One 11(4):e0153291.
Zaiko, A., J. L. Martinez, J. Schmidt-Petersen, D. Ribicic, A. Samuiloviene, and E. Garcia-Vazquez. 2015. Metabarcoding approach for the ballast water surveillance – An advantageous solution or an awkward challenge? Marine Pollution Bulletin 92(1–2):25–34.
15

Appendix A: Selected eDNA Case Studies
U.S.–Norway eDNA Initiatives
Governmental agencies in both the United States (NOAA) and Norway (IMR) have identified eDNA as a long-term strategic priority for enriching fish stock assessments and thereby facilitating transitions toward
EBFM. Several individual and joint initiatives have been undertaken to explore the utility of eDNA for this purpose. This appendix provides a brief description of selected initiatives.
Norwegian Fjord Transect
Since 1995, IMR has conducted annual acoustic-trawl surveys in the autumn with special focus on monitoring coastal cod (Gadus morhua), saith (Pollachius virens), and shrimp (Pandalus borealis) stocks along the coast of Northern Norway from lat 62˚N to the Russian border (ECOKYST). In addition to acoustic data, fish are sampled using both pelagic and demersal trawls. The biodiversity is mapped from very few trawl hauls in some fjords together with the acoustic estimates. This implies that rare or less-frequent species or species that cannot be caught in our trawls can be missed. The use of eDNA could provide a solution to more effectively monitor fish diversity and abundance in fjords throughout the year at a lower cost than increased trawling in autumn.
IMR has commenced parallel sampling of eDNA during trawl surveys at four stations in one of these fjords, Balsfjorden near
Tromsø. This initiative, the first parallel sampling which took place in October 2018, marks the beginning of a long-term time series which will track changes in the abundance of Atlantic cod (Gadus morhua) and changes in fish biodiversity in the fjord. For cod abundance, the eDNA results will be co-analyzed together with trawl time series collected from the same fjord since 1995 (e.g., Fevolden et al. 2015). The aim of the eDNA time series is to assess and monitor the dynamics (season and annual variation) of the fish community in the fjord. We will assess how eDNA compares with information achieved by trawling, as well as how eDNA might be used to improve fish stock assessments. This project is also part of a joint initiative from IMR to include NOAA, NORCE Norwegian Research Centre, and UiT the Arctic University of Norway for an interlaboratory calibration (ILC) exercise for evaluating the consistency of eDNA results between labs.
16

Newport Line Comprehensive Transect (NWFSC)
The Newport Hydrographic Line (NHL) is a biological and oceanographic ecosystem sampling program located offshore Newport, Oregon (USA), in the northern California Current.1
1 https://www.st.nmfs.noaa.gov/copepod/time-series/us-50501/
The NHL has served as a foundation for studying and understanding the impacts of climate variability and ecosystem response because of its location in a region strongly influenced both by climate variability at the basin scale (as shown by the PDO and ENSO indices2
2 PDO = Pacific Decadal Oscillation; ENSO = El Niño–Southern Oscillation.
) and by variability in local forcing that drives coastal upwelling. The NHL consists of seven stations evenly spaced from one to 25 miles from shore. These stations have been sampled monthly to twice monthly, year-
round, since 1996. At each station, temperature, salinity, dissolved oxygen, primary production, and aragonite saturation (a metric of ocean acidification) are measured throughout the water column; surface water is collected to monitor nutrients, primary production, phytoplankton species composition and abundance, and harmful algal blooms (HABs); and plankton nets are deployed to collect zooplankton, krill, larval fish, and invertebrates (e.g., Dungeness crabs). NWFSC is adding eDNA analyses to these sampling regimes; they will be compared to the long-term data series of the transect (currently entering its 24th year).
Northeast Atlantic Mesopelagic Fisheries Stock Assessment
As part of the U.S.–Norway Intergovernmental Group (UNIG) bilateral effort, eDNA samples were collected during a cruise conducted by IMR in May 2019 (cruise No. 2019703). The survey targeted mesopelagic fish on IMR’s newest research vessel, the HKH Kronprins Håkon. This activity was jointly supported by IMR and NOAA, both of which participated in the cruise and coordinated the sample collection for the eDNA analysis.
The cruise was staffed by Luke Thompson (NOAA) and Lotta Lindblom (IMR). This team collected eDNA to characterize a potential new fishery in the mesopelagic layer. eDNA samples were collected at multiple stations on a transect starting from Cape Verde off the coast of Western Africa and ending near the Bay of Biscay outside of Brest, France.
The objectives were to: 1) identify as many species as possible from the water column using eDNA sequencing, and 2) compare the taxonomic distribution and abundance of fish species in the eDNA data with those from traditional trawl and acoustics data collected on the cruise. The goal was to conduct an eDNA assessment of fish biodiversity in the mesopelagic and to assess the stock size estimate ontained from acoustic trawling.
At each of 15 stations (Figure A-1), 2.5 L of seawater from six depths, collected in Niskin bottles on the CTD, was filtered in duplicate through 0.22-µm Sterivex filters and then frozen at –80°C (180 filtered seawater samples). Depths were chosen to coincide with strong acoustic signatures (scattering layers) at day and/or night. The filtered
17

material contained cellular and other DNA-containing material from fish, invertebrates, diatoms, bacteria, viruses, and so forth. Negative controls (3 Milli-Q water blanks and 1 air blank) were collected before seawater sampling at each station. DNA was extracted and sequencing performed using 12S MiFish primers.
Being mindful of the importance of reference databases in eDNA analysis, fish specimens were also collected for mitochondrial DNA sequencing to expand the reference sequence databases. Fish samples (426) from 122 species were collected and frozen or stored in ethanol for future DNA sequencing, funding permitting.
Figure A-1. Stations where water from CTD Niskin bottles was collected from six depths and filtered for eDNA.
18

Data-Limited Caribbean Fish Stocks
In the Caribbean regions, stock assessment evaluations are challenged by the size and diversity of the resource area, costs of conducting surveys relative to the value of the fisheries, complexities in life history patterns of marine organisms, and difficulties in sampling habitats that are inaccessible and vulnerable to conventional sampling gear such as trawls and traps. The difficulties of managing these subtropical marine resources are further complicated by environmental effects on the marine ecosystems, the diversity of fisheries, and geopolitical challenges across jurisdictional boundaries (Cummings et al. 2015). Furthermore, managers and stockholders have learned to rely on fishery-dependent sampling programs that have been in place for over 30 years, and thus are reticent to embark on new approaches that could threaten the status quo of fishery management in the area.
However, fishery managers understand that a multipronged approach, consisting of enhanced data-limited assessment methods, fishery-dependent data (catch data), and, to the extent possible, fishery-independent information (abundance trends), would provide the best strategy to support the area’s data-limited fishery management plans. To that end, the endpoint of eDNA application would be to support geographic distribution modeling patterns via gene-flow assessments.
Because of the data challenges stated above, it can be assumed that essentially all stock assessments in the region are considered data-limited, and therefore have approximately equal potential to demonstrate the need for eDNA approaches. Based on the Cummings et al. (2015) report, some examples of the challenges include:
BermudaA small but widely dispersed fleet of vessels harvests a valuable commercial black grouper fishery. Because there are no central landing ports, and most of the catch is sold directly to restaurants for local consumption, there is no way to implement a catch limit for this stock.
MontserratA comprehensive database of catch per unit effort and price data is available for the multispecies artisanal fisheries, but without any biological sampling available, there is no understanding on how to determine the long-term sustainability of the stocks.
San AndrésReef fish are the primary fishery in the area. Because of a lack of resources, the number of fishers, size of the fleet, and catch composition are unknown. However, over 200 species compose the stock and the goal is to establish some basic limits on the fishery to ensure sustainability.
Turks and Caicos IslandsSustainable management of the conch fishery includes a 60-year time series of catch data. These data include sexual maturity and some fishery-independent visual surveys. Some model estimates are showing a decline in stock abundance; however, it has not been determined whether this is a result of catch or natural variability.
For each of these unique examples, an eDNA approach, combined with fishery-dependent and -independent data, may provide the necessary information for managers to act.
19

NOAA Fisheries eDNA Enhancement of Fishery-Independent Monitoring Cruises for EBFM
eDNA has shown great promise to improve our ability to understand biodiversity in the world’s oceans. However, there are some ongoing research questions that need to be addressed, and its utility to advance NOAA’s mission must be investigated and demonstrated. eDNA is most applicable to NOAA mission areas where presence/absence data are sufficient to answer specific questions for resource management and where it can be supplemented with complementary quantitative data from proven observational methods. The implementation of EBFM, a stated priority for NOAA Fisheries, is an area where eDNA can provide significant advancements.
NOAA’s Atlantic Oceanographic and Meteorological Laboratory (AOML)and the Southeast Fisheries Science Center (SEFSC) are collaborating to advance our understanding through the use of ‘omics,3
3 For more on ‘omics, see the NOAA ‘Omics Strategy, https://go.usa.gov/xGkya.
with a clear path to transition these results into fishery management plans. This multiyear project aims to test and pilot the utility of eDNA collections on fisheries-independent monitoring cruises to advance EBFM implementation. A key component of the EBFM implementation plan is understanding the dependency of fishery species on lower trophic levels and habitats for incorporation into fisheries ecosystem plans (specifically) and EBFM (writ large). Understanding and quantifying these relationships with traditional techniques is limited by our observational capabilities (e.g., gear selectivity). eDNA provides an opportunity to enhance and broaden these observational capabilities.
We will determine whether genomic measurements of lower trophic levels improve our ability to predict living marine resources, and whether using eDNA in conjunction with habitat and fish observations improves our habitat-occupancy and habitat-richness relationships. An understanding of trophic and habitat interactions is essential to the implementation of EBFM. We will attempt to apply eDNA to advance this understanding in the Gulf of Mexico. This will be done in conjunction with the SouthEast Area Monitoring and Assessment Program’s (SEAMAP) reef fish video (SRFV) survey conducted by NMFS Mississippi Laboratories,and by the Marine Biodiversity Observation Network’s Sanctuaries project, led by the University of South Florida. During this project, eDNA samples are collected aboard the SRFV cruises that occur in the spring of each year in the Gulf of Mexico. The SRFV is a fishery-independent monitoring program that collects data on habitat and fish abundances throughout the Gulf of Mexico, from depths of 30–150 m. We will complement these data by collecting eDNA for invertebrate, lower-trophic-level, and vertebrate fishery species at the same suite of stations. eDNA will be collected via both the filtration and precipitation methods at a subset of these stations.
Specific goals for this project include:
• Comparing how collection method (precipitation versus filtration) affects eDNA results across all trophic levels and taxonomic groups.
20
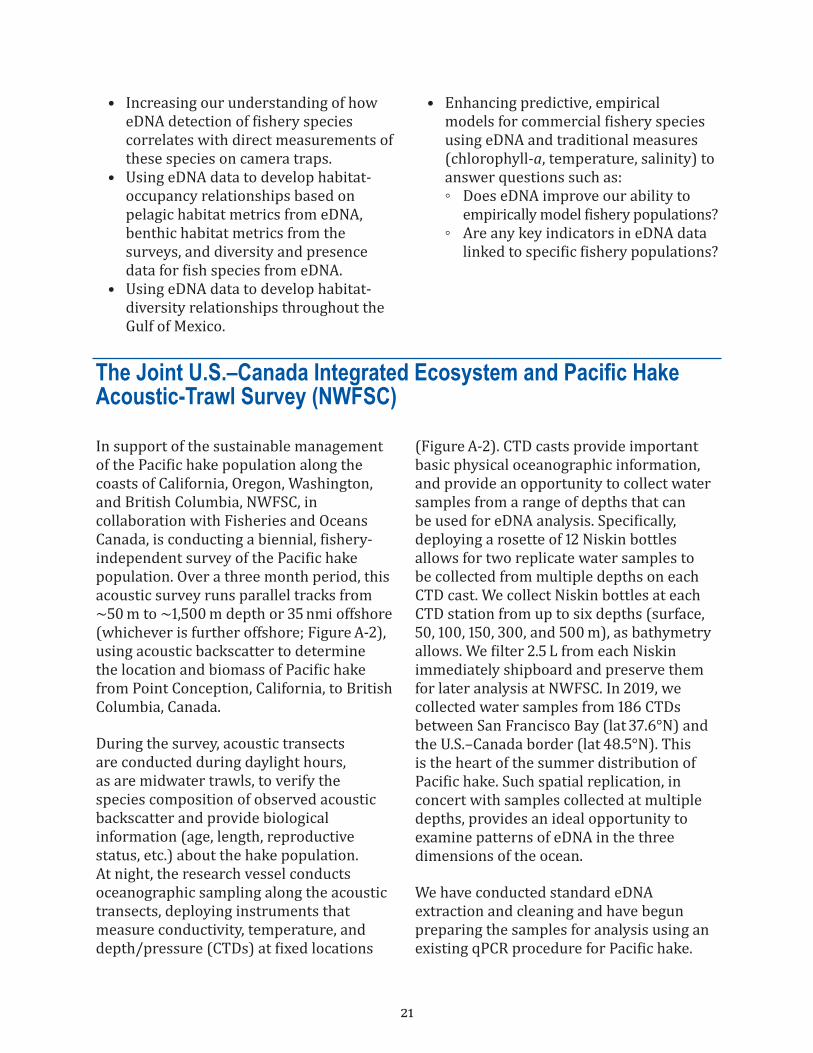
• Increasing our understanding of how eDNA detection of fishery species correlates with direct measurements of these species on camera traps.
• Using eDNA data to develop habitat-occupancy relationships based on pelagic habitat metrics from eDNA, benthic habitat metrics from the surveys, and diversity and presence data for fish species from eDNA.
• Using eDNA data to develop habitat-diversity relationships throughout the Gulf of Mexico.
• Enhancing predictive, empirical models for commercial fishery species using eDNA and traditional measures (chlorophyll-a, temperature, salinity) to answer questions such as: ◦ Does eDNA improve our ability to
empirically model fishery populations? ◦ Are any key indicators in eDNA data
linked to specific fishery populations?
The Joint U.S.–Canada Integrated Ecosystem and Pacific Hake Acoustic-Trawl Survey (NWFSC)
In support of the sustainable management of the Pacific hake population along the coasts of California, Oregon, Washington, and British Columbia, NWFSC, in collaboration with Fisheries and Oceans Canada, is conducting a biennial, fishery-independent survey of the Pacific hake population. Over a three month period, this acoustic survey runs parallel tracks from ~50 m to ~1,500 m depth or 35 nmi offshore (whichever is further offshore; Figure A-2), using acoustic backscatter to determine the location and biomass of Pacific hake from Point Conception, California, to British Columbia, Canada.
During the survey, acoustic transects are conducted during daylight hours, as are midwater trawls, to verify the species composition of observed acoustic backscatter and provide biological information (age, length, reproductive status, etc.) about the hake population. At night, the research vessel conducts oceanographic sampling along the acoustic transects, deploying instruments that measure conductivity, temperature, and depth/pressure (CTDs) at fixed locations
(Figure A-2). CTD casts provide important basic physical oceanographic information, and provide an opportunity to collect water samples from a range of depths that can be used for eDNA analysis. Specifically, deploying a rosette of 12 Niskin bottles allows for two replicate water samples to be collected from multiple depths on each CTD cast. We collect Niskin bottles at each CTD station from up to six depths (surface, 50, 100, 150, 300, and 500 m), as bathymetry allows. We filter 2.5 L from each Niskin immediately shipboard and preserve them for later analysis at NWFSC. In 2019, we collected water samples from 186 CTDs between San Francisco Bay (lat 37.6°N) and the U.S.–Canada border (lat 48.5°N). This is the heart of the summer distribution of Pacific hake. Such spatial replication, in concert with samples collected at multiple depths, provides an ideal opportunity to examine patterns of eDNA in the three dimensions of the ocean.
We have conducted standard eDNA extraction and cleaning and have begun preparing the samples for analysis using an existing qPCR procedure for Pacific hake.
21

Figure A-2. Acoustic-trawl survey conducted in 2017 by NMFS/NWFSC and DFO. Horizontal green lines indicate acoustic transects, with CTD locations noted by ×. For the 2019 survey, eDNA was collected at CTD stations at multiple depths.
22
qPCR allows for the quantification of Pacific hake DNA concentration in each water sample. Once qPCR is complete, our sampling design will be able to assess several important questions about the distribution of eDNA alone and in comparison to the distribution of hake as detected acoustically. Specifically, we can ask the following focal questions that inform our understanding of both the empirical characteristics of eDNA and their potential application for stock assessments:
1. Are there distinct patterns in the depth distribution of hake DNA? If so, do they coincide with the depth distribution of hake from acoustic surveys?
2. Do collected eDNA samples from shallow depths reflect DNA observed in deepwater samples?
3. What are the spatial (latitudinal and longitudinal) patterns of correlation and variability in observed hake DNA concentrations, and do these correlations change with samples collected at different water depths?
4. After integrating qPCR results across all depths and sampling locations, can we generate reasonable regional and coastwide indices of relative abundance for hake?a. Do indices of regional abundance
coincide with parallel results derived from the acoustic survey?
b. Do patterns of spatial correlation and variation in eDNA match with patterns of Pacific hake detected during the acoustic survey?
Three-year work plan goals for this project:
• Shipboard sample collection during the Pacific hake acoustic-trawl survey cruise.
• Laboratory sample processing, including extraction and preparation for qPCR.
• Complete qPCR assays with appropriate replication, positive and negative controls.
• Development and application of appropriate statistical models for Pacific hake qPCR results and for comparison and contrast of qPCR results with acoustics in consultation with the acoustic survey team and Pacific hake stock assessment personnel.
• Complete analysis of qPCR data and publication of results.
• Repeatin the second year of eDNA surveys during the Pacific hake acoustic-trawl survey and starting the extraction and analysis of samples.
We note that while the water samples are collected for specific application to Pacific hake, the samples undoubtedly will contain DNA from additional species. Once extracted and properly preserved, eDNA isolated from water samples does not decay. This means that water-collected samples can be repurposed for different projects in the future. For example, future projects could include analyses using qPCR primers for forage fish (e.g., Pacific sardine, northern anchovy) or nonfish species (such as krill), all of which are abundant, important pelagic species observed during the acoustic-trawl survey. Alternatively, these samples could be assayed using multispecies primers and massively parallel sequencing to understand patterns in space and depth of the full fish community, or the planktonic community underlying ocean productivity.
23

ReferencesCummings, N. J., M. Karnauskas, W. Harford, W. L. Michaels, and A. Acosta, editors. 2015. Report of
a GCFI Workshop: Strategies for Improving Fishery-Dependent Data for Use in Data-Limited Stock Assessments in the Wider Caribbean Region. U.S. Department of Commerce, NOAA Technical Memorandum NMFS-SEFSC-681. DOI: 10.7289/V5BK19BN
Fevolden, S.-E., J.-I. Westgaard, and T. Pedersen. 2015. Extreme male-skewed sex ratios on spawning grounds for Atlantic cod Gadus morhua with typical coastal cod signatures of the Pan I (pantophysin) locus. Sexuality and Early Development in Aquatic Organisms 1(2):133–142. DOI: 10.3354/sedao00013
24

Appendix B: Challenges for Implementing eDNA for EBFM
Understanding the Dynamics of eDNA
Shedding rateThe shedding rate—the amount of DNA released from an organism into the environment—is expected to vary between species and individuals, as well as the environment itself. Individuals may shed more, or less, eDNA depending on developmental stage, health, seasonality, or reproductive activity (spawning). Studies also suggest that factors such as ambient water temperature may impact shedding rates. Although there is yet to be unanimous agreement on the most important factors influencing shedding rate, biomass, diet, stress, water temperature, and life stage (i.e., juvenile versus adult) have been shown to be important (Maruyama et al. 2014, Klymus et al. 2015, Sassoubre et al. 2016, Jo et al. 2019).
Degradation rateHow long is the released eDNA detectable in the environment? Several biotic and abiotic factors influence this, including water temperature and pH, length of fragment, sunlight exposure, and microbial activity in the ambient water (see Collins et al. 2018). Recent studies have pointed toward microbial activity and water temperature as the main drivers for degradation of eDNA (Salter 2018, Andruskiewicz et al. 2019). The degradation rate, in combination with the initial concentration of eDNA, will determine the time of persistence that eDNA can be detected in a water sample. The current bounds of half-lives of eDNA in marine water are from 6.9 hours to 71.1 hours (Sassoubre et al. 2016, Cowart et al. 2018). Constraining uncertainty with regard to interpretation of eDNA applications, for
example when calculating either presence–absence or relative abundance distance matrices from metabarcoding results, may be required as eDNA degradation accumulates (Salter 2018).
Dilution factorIn the marine environment, dilution of eDNA plays a significant role. The question of interest is how the eDNA signal is diluted to a nondetectable level in space and time from the point at which an organism sheds eDNA. Preliminary work has begun to use numerical ocean models in order to understand the dilution of eDNA in marine water (Takayama et al. 2017). Disentangling dilution factor from degradation rate is a key element which requires further study.
Transport of eDNA in the water columnThe small DNA fragments floating in the water column have a planktonic behavior; thus, understanding eDNA dispersal rates is necessary for increasing the spatial accuracy of eDNA-based stock estimates. In field samples, eDNA shows a surprisingly high degree of spatial resolution (Port et al. 2016, O’Donnell et al. 2017). However, transport mechanisms such as advection, mixing, and settling are critical components of any tracking model and are expected to influence eDNA transport. Further eDNA modeling work is necessary to understand eDNA transport, particularly in how the location of sampling relates to the location of shedding, and how particle size distributions vary between different eDNA-shedding organisms.
25

Mixed community eDNAVery rare organisms may still be difficult to detect by eDNA due to the correlation between organism abundance and eDNA signal in the immediate environment. Because rare organisms are less abundant than other organisms in a given environment, it may be assumed that the majority of eDNA present in a water sample originates from nontarget organisms. However, inherent biases in laboratory methods (i.e., primer bias and sequencing bias) will impact the relative abundance of target eDNA (Ficetola et al. 2014). Additional work where species composition is known (“mock communities,” Kelly et al. 2019) is important to test the limits of detection for the diversity of managed species.
ContaminationControlling for contamination when eDNA water sampling takes place during fisheries operations can be difficult, as there is a requirement for “clean” laboratory facilities for eDNA sampling aboard fisheries survey ships. One main benefit of eDNA sampling is that it can be safely and inexpensively conducted on nonsurvey ships (physical or chemical oceanography, seismic, etc.) whose wet laboratory facilities have no historical eDNA contamination from fish stock survey activities (see Existing resource utilization). This decoupling from standard fisheries operations reduces contamination risk and expands the available fleet for eDNA sampling at little or no additional cost in ship time. If nonsurvey vessels are unavailable, the sampling protocol for eDNA can easily be added onto the work plan of previously scheduled sampling efforts such as trawls (e.g., water samples for eDNA taken every other point on the sampling grid). Negative controls are required at each stage of the processing workflow in order to consistently monitor for contamination.
PCR inhibitionThe processing of eDNA samples requires PCR amplification, inhibition of which can be an issue in highly productive or coastal waters. Studies have started to investigate how to account for these technical limitations and improve the utility and repeatability of eDNA surveys (Ushio et al. 2017). Future work is required to move eDNA methods forward to a more quantitative and reliable approach.
Common senseBecause surveying organisms by eDNA does not require visual identification of the organism itself, some basic questions remain that are important for understanding how to interpret results indicating the presence of an organism from eDNA in a water sample. For example, is eDNA distributed vertically in the water column in a way that makes sense in terms of the ecology of the organisms detected? Or, does measured concentration of eDNA reflect the ecological abundance of the species? These larger questions are functions of all of the previously mentioned processes that need to be considered (i.e., shedding rates, degradation rates, dilution, transport, laboratory processing, etc.). Several studies have commented on questions such as these (e.g., Iversen et al. 2015, Andruskiewicz et al. 2019), but more research is needed in the future.
One “standard” protocol?Many international research groups are actively engaged in basic research projects to assess the dynamics of eDNA in the marine environment and optimize processing technologies for eDNA signal capture and detection. Due to the inherent variability in eDNA dynamics for different fish stocks, there currently exists no single
26

“standard” protocol for eDNA sampling, processing, and analysis, nor is it relevant or advisable to impose a standard start-to-finish protocol upon all eDNA applications for fish stock assessments. Rather, we here provide some recommendations for, e.g., standardized sample collection (Sterivex filters), storage (–20°C in individual plastic bags), processing (DNA extraction using QIAGEN DNeasy Blood & Tissue Kits), and analysis (MiFish amplicon sequencing). Protocols must be easy, safe, and practical, the latter requirement as a concession to the probable lack of personnel with eDNA competence aboard the vessels performing sampling for eDNA analysis.
In consultation with the extensive body of published literature, we have considered potential points of failure with regard to detection sensitivity and contamination for eDNA applications; here we provide guidelines to contain these risks, as well as recommendations for future research. For example, one of the major challenges for eDNA sampling and analysis is the inherent stochasticity for detection of extremely low-concentration target eDNA molecules in a complex environmental sample. Stochasticity is often contrary to reproducibility; thus, sufficient replication in combination with rigorous contamination controls offer a way forward for ensuring information value from eDNA samples. Other solutions include interlaboratory comparisons (see ILCs), blind tests in which sample and target identity are unknown to the analyst, or double-blind controls in order to benchmark different analysis methods and thereby determine protocols that are fit-for-purpose with regard to survey objectives. Consistent implementation of biological and technical replicates, where possible, will also help
to limit the potentially negative impacts of variability in DNA extraction efficiency and PCR amplification bias, both within the same laboratory but also between different laboratories. In summary, these recommendations represent the best compromise between practicality, contamination reduction, and detection sensitivity at the time of writing (Q1–Q2 2020); however, they should be regularly revised in order to ensure that methods keep pace with technological developments. Careful application of these guidelines will also assist in tracking labor and consumables expenses, which can be funnelled back into priority trade-off calculations (see above).
Sharing of samples and IPRBecause fish stocks and their boundaries are politically ambivalent, the joint management of fish stocks that travel between areas within and beyond national jurisdictions presents a novel challenge with regard to eDNA. Marine genetic resources (MGR), to which it is likely that eDNA collected for fish stock assessments may be assigned, are not covered by the United Nations Convention on the Law of the Sea (UNCLOS; Article 62, Utilization of the living resources). There is ongoing debate regarding the legal treatment and MGR in areas beyond national jurisdiction (Drankier et al. 2012, Thambisetty 2018), one aspect of which is whether MGR should fall under a regulatory structure similar to that provided for plants and agricultural products by the Food and Agriculture Organization of the United Nations’ (FAO) International Treaty on Plant Genetic Resources.1
1 http://www.fao.org/plant-treaty/en/
It is therefore not inconceivable that the collection and exchange of eDNA within a fish stock assessment context may become subject
27

to international law governing intellectual property rights (IPR) and sharing of genetic resources, either when fisheries scientists combine resources to assess a shared stock, or when scientific groups combine resources for, e.g., independent assessment of proprietary fish stocks. This creates uncertainty regarding ownership of samples, import/export restrictions, or commercialization potential of harvested genetic material with potential utility as standardized reference material (see SRMs). This applies not only to nations with robust commercial fisheries (the United States, Norway), but also to developing countries where all fish stocks are relatively data-poor due to limited resources, and where eDNA may become an important, cost-effective method to create sustainable stock assessment streams. A relevant point of contact for these issues is the International Council for the Exploration of the Sea (ICES) Working Group on the Application of Genetics in Fisheries and Aquaculture (WGAGFA).
Data analysisAs a novel fish stock assessment tool, eDNA is not beholden to best-practice survey designs for acoustic or trawl survey methods, nor may traditional survey designs be appropriate for eDNA implementation within a specific fish stock assessment stream. This opens up alternative sampling designs that make use of the strengths of eDNA (see Road Map for Future Research), but also use sound survey design principles that cover the range of the stock to the extent feasible and take into account the technical limitations of eDNA as an analytic tool (this Appendix). It is therefore critical that molecular ecological, bioinformatic, and statistical expertise are included in discussions of eDNA-specific sampling
design. This is analogous to the informed discourse by which optimal designs are planned and tested for trawl- or acoustic-based surveys. In addition, it is absolutely critical that a framework is in place for associating eDNA data with metadata from sampling efforts. This will be necessary for the successful implementation of time-series data that capitalize on high-frequency or high-spatial-resolution eDNA sampling to supplement traditional survey data.
Bioinformatics platformsFurthermore, the informatic and statistical treatment of eDNA data from fish stock assessments, whether qualitative or quantitative, requires considerable resources and competence. Fortunately, the recent explosion in studies utilizing high-throughput sequencing for ecological investigation has fostered the rapid democratization of computational requirements and analysis pipelines for data processing. The data analysis dimension can aptly be described as a range of tools from fully “plug-and-play” to fully manual data analysis, the latter of which facilitates quality control at every processing step. These tools include:
• CyVerse (Merchant et al. 2016), which now includes Bruce Nash’s DNA Subway (Marizzi et al. 2018).2
2 https://dnasubway.cyverse.org/
• Multiplex Barcode Research and Visualization Environment (mBRAVE),3
3 http://www.mbrave.net/
developed by the University of Guelph, Ontario, Canada, with main application for COI metabarcoding. mBRAVE utilizes a plug-and-play solution.
• MiFish and MitoFish (Sato et al. 2018).4
4 http://mitofish.aori.u-tokyo.ac.jp/mifish
• The Washington State University eDNA toolbox.5
28
5 https://labs.wsu.edu/edna/

Computing infrastructure solutionsThere are different models for acquisition of computing resources to perform efficient and user-defined bioinformatic analysis of eDNA data. In many cases, online and free analysis platforms circumvent the need for expensive and resource-greedy local computing infrastructure and the informatic expertise required for administration and maintenance. In-house informatic and bioinformatic competence, however, is superior with regard to speed and custom tailoring of solutions to address the specific needs of individual datasets (e.g., reference databases, clustering algorithms, multiple alignment software, etc.). The computing infrastructure models we have identified include:
• Collaborative. On a per-project basis and based on agreement between the collaborating partners.
• National platforms. Subsidized national computing and storage infrastructure that is available for all nationally funded research data. Technical support is often included.
• Personal computers. Fully customizable with regard to configuration, but requires considerable technical savvy.Limited technical support.
• Cloud computing. Fully customizable with regard to configuration, but requires considerable technical savvy. Technical support available.
• Local (i.e., university or research center) clusters. Very local but generally without technical support.
Machine learningMachine learning is a promising classification method that can either be supervised (“trained” to detect patterns based on a training dataset) or unsupervised (not trained using existing data). Although we concluded that the application of machine learning to quantitative estimates of fish stocks may not be suitable at this time, it may assist with optimising sampling designs or assessing ecosystem status (e.g., healthy versus poor; Cordier et al. 2017). Additional applications of machine learning that may be relevant for eDNA applications include the generation of decision trees on reduced dimensionality data, which requires considerably less computing resources while retaining discriminatory information from the data. Bayesian models are computationally intensive and somewhat complicated to employ, but they provide good estimates of confidence when eDNA results are “noisy.”
Interlaboratory comparisons (ILCs)
The advancement of eDNA as a common monitoring technology requires robust quality assurance, not only to imbue confidence in the analytical power of the tool, but also to ensure that sufficient continuity between samples and stocks will allow the successful creation of contiguous time series. It is currently unclear what level of quality assurance is relevant for eDNA applications in fisheries stock assessment
streams. Assuming that no single sampling, processing, or analysis method can (or should) be universally implemented, ILCs represent a promising means to constrain the uncertainty of results generated in different laboratories, with the express goal of increasing the comparability of independent studies. ILCs serve two purposes: proficiency testing and methods validation. According to the International
29
Organization for Standardization (ISO),6
6 https://www.iso.org/home.html
“Proficiency testing involves use of interlaboratory comparisons in the determination of a laboratory’s performance and, more specifically, in its on-going competence.” The second element, methods validation, ensures that an “analytic method performs well and is fit for its intended purpose” (EU Science Hub).7
7 https://ec.europa.eu/jrc/en
The use of ILCs to identify “plausible bounds” of uncertainty (Lahoz-Montfort et al. 2015) will increase the feasibility of using eDNA to
identify spatiotemporal trends in multiple datasets, a task that would otherwise be unachievable by individual laboratories or research institutes. There are some protocol commonalities among the research groups in this consortium (seawater sampling for eDNA capture, DNA extraction kits, etc.) that can be taken advantage of to initiate ILC activities in the very near future (<6 months), one of which is described above (see Appendix A).
Standardized reference materials (SRMs)
Standardized reference materials help “develop accurate methods of analysis” and “ensure the long-term adequacy and integrity” of measurements.8
8 https://www.nist.gov/srm/srm-definitions
Although certification may be neither necessary nor relevant for quality assurance of eDNA application in fish stock assessment streams, the ability to trace the efficiency of sample processing and analysis is nonetheless desirable, particularly for integrated analysis of time-series data or data generated by different laboratories. We suggest that the development of SRMs for the validation of eDNA extraction and PCR amplification protocols would be a reasonable means to identify intra- and interlaboratory variability in eDNA sample processing. For eDNA analyses that, for example, employ amplicon sequencing to target
a broad diversity of marine fish, an SRM might consist of a standardized amount or number of artificially cultured, lyophilized cells from a non-native fish species. In this scenario, the SRM would be added to filters containing eDNA sample material prior to DNA extraction. Quantitative comparison of SRM input with SRM recovery after DNA extraction allows a direct measure of DNA extraction efficiency. Furthermore, the inclusion of an SRM of fish origin will also act as an internal control for target amplification by PCR. The implementation of SRMs in standard operating procedures for eDNA analyses can also provide a means of comparing different processing methods (methods validation), variability between laboratories (ILCs), or between sample processing runs within the same laboratory.
30

ReferencesAndruszkiewicz, E. A., J. R. Koseff, O. B. Fringer, N. T. Ouellette, A. B. Lowe, C. A. Edwards, and A. B.
Boehm. 2019. Modeling environmental DNA transport in the coastal ocean using Lagrangian particle tracking. Frontiers in Marine Science 6:477.
Collins, R. A., O. S. Wangensteen, E. J. O’Gorman, S. Mariani, D. W. Sims, and M. J. Genner. 2018. Persistence of environmental DNA in marine systems. Nature Communications Biology 1(1):185.
Cordier, T., P. Esling, F. Lejzerowicz, J. Visco, A. Ouadahi, C. Martins, T. Cedhagen, and J. Pawlowski. 2017. Predicting the ecological quality status of marine environments from eDNA metabarcoding data using supervised machine learning. Environmental Science & Technology 51(16):9118–9126.
Cowart, D. A., K. R. Murphy, and C. H. C. Cheng. 2018. Metagenomic sequencing of environmental DNA reveals marine faunal assemblages from the West Antarctic Peninsula. Marine Genomics 37:148–160.
Drankier, P., A. G. O. Elferink, B. Visser, and T. Takács. 2012. Marine genetic resources in areas beyond national jurisdiction: Access and benefit-sharing. The International Journal of Marine and Coastal Law 27(2):375–433.
Ficetola, G. F., J. Pansu, A. Bonin, E. Coissac, C. Giguet-Covex, M. De Barba, L. Gielly, C. M. Lopes, F. Boyer, F. Pompanon, and G. Rayé. 2015. Replication levels, false presences and the estimation of the presence/absence from eDNA metabarcoding data. Molecular Ecology Resources 15(3):543–556.
Iversen, L. L., J. Kielgast, and K. Sand-Jensen. 2015. Monitoring of animal abundance by environmental DNA—An increasingly obscure perspective: A reply to Klymus et al., 2015. Biological Conservation 100(192):479–480.
Jo, T., H. Murakami, S. Yamamoto, R. Masuda, and T. Minamoto. 2019. Effect of water temperature and fish biomass on environmental DNA shedding, degradation, and size distribution. Ecology and Evolution 9(3):1135–1146.
Kelly R. P., A. O. Shelton, and R. Gallego. 2019. Understanding PCR Processes to Draw Meaningful Conclusions from Environmental DNA Studies. Scientific Reports 9:12133.
Klymus, K. E., C. A. Richter, D. C. Chapman, and C. Paukert. 2015. Quantification of eDNA shedding rates from invasive bighead carp Hypophthalmichthys nobilis and silver carp Hypophthalmichthys molitrix. Biological Conservation 183:77–84.
Lahoz-Monfort, J. J., G. Guillera-Arroita, and R. Tingley. 2016. Statistical approaches to account for false-positive errors in environmental DNA samples. Molecular Ecology Resources 16(3):673–685.
Marizzi, C., A. Florio, M. Lee, M. Khalfan, C. Ghiban, B. Nash, J. Dorey, S. McKenzie, C. Mazza, F. Cellini, and C. Baria. 2018. DNA barcoding Brooklyn (New York): A first assessment of biodiversity in Marine Park by citizen scientists. PLOS One 13(7):e0199015.
Maruyama, A., K. Nakamura, H. Yamanaka, M. Kondoh, and T. Minamoto. 2014. The release rate of environmental DNA from juvenile and adult fish. PLOS One 9(12):e114639.
Merchant, N., E. Lyons, S. Goff, M. Vaughn, D. Ware, D. Micklos, and P. Antin. 2016. The iPlant collaborative: Cyberinfrastructure for enabling data to discovery for the life sciences. PLOS Biology 14(1):e1002342.
O’Donnell, J. L., R. P. Kelly, A. O. Shelton, J. F. Samhouri, N. C. Lowell, and G. D. Williams. 2017. Spatial distribution of environmental DNA in a nearshore marine habitat. PeerJ f:e3044.
Port, J. A., J. L. O’Donnell, O. C. Romero-Maraccini, P. R. Leary, S. Y. Litvin, K. J. Nickols, K. M. Yamahara, and R. P. Kelly. 2016. Assessing vertebrate biodiversity in a kelp forest ecosystem using environmental DNA. Molecular Ecology 25:527-541.
31

Salter, I. 2018. Seasonal variability in the persistence of dissolved environmental DNA (eDNA) in a marine system: The role of microbial nutrient limitation. PLOS One 13(2):e0192409.
Sassoubre, L. M., K. M. Yamahara, L. D. Gardner, B. A. Block, and A. B. Boehm. 2016. Quantification of environmental DNA (eDNA) shedding and decay rates for three marine fish. Environmental Science & Technology 50(19):10456–10464.
Sato, Y., M. Miya, T. Fukunaga, T. Sado, and W. Iwasaki. 2018. MitoFish and MiFish pipeline: A mitochondrial genome database of fish with an analysis pipeline for environmental DNA metabarcoding. Molecular Biology and Evolution 35(6):1553–1555.
Takayama, Y., M. Akatsuka, and K. Ito. 2017. A study on environmental DNA and tidal current analysis for seagrass beds. JSCE Proceedings B2 (Coastal Engineering) 73(2):I_1267–I_1272.
Thambisetty, S. 2018. Marine Genetic Resources Beyond National Jurisdiction: Elements of a New International Legally Binding Instrument. LSE Law - Policy Briefing Paper No. 32. DOI: 10.2139/ssrn.3219995
Ushio, M., H. Murakami, R. Masuda, T. Sado, M. Miya, S. Sakurai, H. Yamanaka, T. Minamoto, and M. Kondoh. 2018. Quantitative monitoring of multi-species fish environmental DNA using high-throughput sequencing. Metabarcoding and Metagenomics 2:e23297.
32

U.S. Secretary of Commerce
Wilbur L. Ross, Jr.
Acting Under Secretary of Commerce for Oceans and Atmosphere
Dr. Neil Jacobs
Assistant Administrator for Fisheries
Chris Oliver
August 2020
fisheries.noaa.gov
OFFICIAL BUSINESS
National Marine Fisheries ServiceNorthwest Fisheries Science Center2725 Montlake Boulevard East Seattle, Washington 98112