IMPLEMENTATION EVALUATION OF THE ...pmg-assets.s3-website-eu-west-1.amazonaws.com/150204dpme.pdfAn...
36
i Prepared by: Business Enterprises at University of Pretoria (Pty) Ltd Prepared for: Date: 18 October 2013 POLICY SUMMARY, EXECUTIVE SUMMARY & OUTLINE: IMPLEMENTATION EVALUATION OF THE RECAPITALISATION AND DEVELOPMENT PROGRAMME (FROM ITS INCEPTION IN 2010 TO JUNE 2012) PO Box 14679 Hatfield 0028 Enterprise Building, 140 Lunnon Road, Hillcrest, 0083 T: +27 (12) 420 4245 F: +27 (12) 362 5270 [email protected] www.be.up.ac.za
Transcript of IMPLEMENTATION EVALUATION OF THE ...pmg-assets.s3-website-eu-west-1.amazonaws.com/150204dpme.pdfAn...

i
Prepared by:
Business Enterprises at University of Pretoria (Pty) Ltd
Prepared for:
Date: 18 October 2013
POLICY SUMMARY, EXECUTIVE SUMMARY &
OUTLINE:
IMPLEMENTATION EVALUATION OF
THE RECAPITALISATION AND
DEVELOPMENT PROGRAMME (FROM
ITS INCEPTION IN 2010 TO JUNE
2012)
PO Box 14679
Hatfield 0028
Enterprise Building,
140 Lunnon Road,
Hillcrest,
0083
T: +27 (12) 420 4245
F: +27 (12) 362 5270
[email protected] www.be.up.ac.za
i
TABLE OF CONTENTS
........................................................................................................................................................................................... i
ABBREVIATIONS AND ACRONYMS ........................................................................................................................ iv
Policy Summary ...................................................................................................................................................... v
Executive Summary ............................................................................................................................................. vi
1. Introduction .................................................................................................................................................. 1
1.1 Background on the Recapitalisation and Development Programme ....................... 1
Objectives and focus of the RECAP ............................................................................................................... 1
Operation of RECAP ............................................................................................................................................ 1
1.2 Purpose and scope of the implementation evaluation .................................................... 2
Aims and objectives of the evaluation ........................................................................................................... 2
2. Methods and procedures .............................................................................................................................. 3
2.1 Data collection instruments ............................................................................................................. 3
2.2 Project selection ..................................................................................................................................... 3
3. Results of the evaluation ............................................................................................................................. 4
3.1 Programme design .............................................................................................................................. 45
3.2 Understanding of RECAP .................................................................................................................... 5
3.3 Selection criteria for participation in RECAP: beneficiaries and projects ............ 5
3.4 Strategic interventions: strategic partners and mentors .............................................. 6
3.5 Business plan development and implementation ............................................................... 7
3.6 Capacity building for beneficiaries .............................................................................................. 8
3.7 RECAP funding and spending .......................................................................................................... 9
3.7.1 Funding of RECAP ........................................................................................................................... 9
3.7.2 Spending of RECAP funds ........................................................................................................ 12
3.7.3 Management and expenditure of RECAP project funds ......................................... 13
3.7.4 Timing of project fund allocation in relation to farming operations ............. 14
3.8 Impact on RECAP objectives ......................................................................................................... 14
3.9 Progress towards targets ................................................................................................................ 18
3.10 Monitoring and evaluation .......................................................................................................... 19
4. Summary of findings, conclusions and recommendations .................................................... 20
ii
4.1 Common understanding of RECAP ............................................................................................. 20
4.2 Appropriateness of RECAP design .............................................................................................. 20
4.3 Alignment of RECAP project cycle to farming operations ............................................ 21
4.4 Effectiveness of strategic interventions ................................................................................. 22
4.5 Effectiveness of RECAP in building capacity to participate in commercial
production ............................................................................................................................................................ 22
4.6 Reaching of targeted beneficiaries ............................................................................................ 23
4.7 Achievement of intended objectives ........................................................................................ 23
4.8 Resource use efficiency and value for money .................................................................... 24
4.9 Recommendations ............................................................................................................................... 24
References ................................................................................................................................................................ 27
iii
LIST OF TABLES
Table 1: RECAP projects by land reform type and province ................................................................................... 3
Table 2: Projects selected and visited by province ................................................................................................... 4
Table 3: RECAP spending per province for 2009 to 2013, excluding land acquisition (Rand) ........................ 10
Table 4: RECAP spending per project by province, excluding amounts for land acquisition ........................... 10
Table 5: RECAP expenditure per programme/grant type for financial years 2009/10-2012/13 by province (R
million) ............................................................................................................................................................................ 11
Table 6: Number of RECAP projects funded by province and funding category for 2009-2013 (excluding
amounts for land acquisition)...................................................................................................................................... 11
Table 7: RECAP funds requested according to business plan by province ........................................................ 12
Table 8: RECAP funds received per project by province (n=48) .......................................................................... 13
Table 9: Person or entity managing RECAP funds – beneficiary perspective (number and proportion of
beneficiaries) (n=98) .................................................................................................................................................... 13
Table 10: Person or entity making decisions on RECAP fund spending – beneficiary perspective (number
and proportion of beneficiaries) (n=98) ..................................................................................................................... 14
Table 11: Timely arrival of funds according to business plan/farming activities (n=98) .................................... 14
iv
ABBREVIATIONS AND ACRONYMS
BEE : Black Economic Empowerment
CRDP : Comprehensive Rural Development Programme
DAFF : Department of Agriculture, Forestry and Fisheries
DRDLR : Department of Rural Development and Land reform
EC : Eastern Cape Province
FS : Free State Province
GP : Gauteng Province
IRRIG : Irrigation
KZN : KwaZulu-Natal Province
LP : Limpopo Province
LRAD : Land Redistribution for Agricultural Development
MP : Mpumalanga Province
NC : Northern Cape Province
NW : North West Province
PLAS : Proactive Land Acquisition Strategy
RADP : Recapitalisation and Development Programme
RECAP : Recapitalisation and Development Programme
SLAG : Settlement Land Acquisition Grant
SPLAG : Settlement Production and Land Acquisition Grant
WC : Western Cape Province

v
Policy Summary
An implementation evaluation of the Recapitalisation and Development Programme (RADP, henceforth abbreviated as RECAP) was commissioned by the Department of Performance Monitoring and Evaluation (DPME). The main purpose of the evaluation was to establish whether RECAP is on track to achieve its intended objectives and to advise on what needs to be done to ensure better implementation of the programme.
Key policy findings are as follows:
RECAP has made some progress towards achieving its intended objectives, but there is room for significant improvement. About 540 additional jobs were created (111 full-time and 429 part-time) on the 98 farms included in the evaluation after RECAP was implemented. However, the number of jobs created is too small to justify the amount of investment in RECAP. There does not seem to be sufficient emphasis on job creation within RECAP. Most RECAP stakeholders interviewed believe that food security has improved after RECAP. As regards agricultural production, it is on-going on 70% of the projects included in the evaluation. Furthermore, both crop and livestock production increased after RECAP. An area in which RECAP does not seem to have made much progress is facilitation of market access for farmers.
RECAP objectives are too ambitious and involve aspects that are normally outside the control of the programme. Furthermore, key terms used in the objectives are not clearly defined, resulting in possible misinterpretation by those implementing the programme.
There are varying degrees of understanding of what RECAP is all about among RECAP stakeholders.
There is no clarity on the selection criteria for beneficiaries and farms to participate in RECAP. This has resulted in the inclusion of beneficiaries that did not deserve to be assisted.
The grant funding approach in RECAP is not sustainable given the limited resources available and it promotes dependency on state funding among beneficiaries. Furthermore, the approach limits the coverage of the programme in terms of the number of farmers that may be assisted.
Prior to making recommendations to strengthen RECAP, we wish to emphasise that strengthening RECAP is a second-best solution. In our view, the best and lasting solution would entail a redesign and overhaul of all public agricultural support programmes and doing away with existing silos of funding agricultural support services. This would entail the establishment of an all-inclusive fund to support land acquisition, extension and mentorship, agricultural finance and market access. As our second best solution, we recommend that RECAP should continue in the interim. Hence, the following key recommendations are meant to strengthen RECAP whilst a lasting solution is sought:
o Review the objectives of RECAP to make them more clear and specific. This should include defining the meanings of key terms used in the programme (e.g. distressed farms, recapitalisation, development, commercial farmer, etc.).
o Ensure a common understanding of RECAP among its stakeholders by engaging in an all-inclusive
process to discuss the nature, operation, purpose and objectives of the programme.
o Develop clear and specific selection criteria for beneficiaries and land reform farms for recapitalisation and development in line with the objectives of RECAP. The criteria should be developed to ensure that only deserving land reform farms and beneficiaries are selected for participation in RECAP.
o Replace the current RECAP grant funding with loan funding. Changing to loan funding would increase the coverage of RECAP in terms of the number of beneficiaries assisted as the money paid back would become available for on-lending to more beneficiaries.
o Establish guidelines to limit the amount of RECAP funding per project in order to widen the coverage of the programme and ensure that the funding model is adapted to the various agricultural production systems.

vi
Executive Summary
Background
The Recapitalisation and Development Programme (RADP, henceforth abbreviated as RECAP) was launched in 2010 with the following objectives: (a) to increase agricultural production; (b) to guarantee food security; (c) to graduate small farmers into commercial farmers; (d) to create employment opportunities in the agricultural sector; and (e) to establish rural development monitors (rangers). The programme was designed to focus on struggling land reform farms acquired since 1994 that have received little or no support, but have potential to become successful, if assisted. These distressed farms were supposed to receive both technical and financial support from government (Department of Rural Development and Land Reform). Two strategic interventions, namely, strategic partnership and mentorship, have been adopted under the RECAP to ensure sustainability of assisted projects/farms.
An implementation evaluation of the programme was undertaken during November 2012 to July 2013 in six provinces: Eastern Cape, Free State, Gauteng, KwaZulu-Natal, Limpopo and North West. This report is based on the outcome of the implementation evaluation in the six provinces. Data were gathered from land reform beneficiaries, government officials (project, provincial and national levels) and strategic partners/mentors by means of a structured question (for beneficiaries managing the farms) and checklists (for government officials, groups of beneficiaries, and strategic partners/mentors). A total of 98 farms/projects in the six provinces mentioned above were included in the implementation evaluation
Main findings There are varying degrees of understanding among RECAP stakeholders of what RECAP is all about. The funding component of RECAP is emphasised most by stakeholders. For example, beneficiaries associate RECAP with funding/capital to be injected into struggling farms to revitalise them. The other components of RECAP dealing with capacity-building and establishing market linkages do not seem to receive much attention. Even among government officials, there seems to be no common understanding of RECAP, its objectives and operation. Some attribute this lack of common understanding to the „ever-changing‟ RECAP policy and procedures. Other government officials do not understand RECAP largely due to their lack of interest in the programme as they consider it to be an added responsibility. RECAP is not appropriately designed to achieve its intended objectives. The objectives are too ambitious, with most of them not directly linked to the programme. Appropriate structures and procedures were not put in place in the provinces to ensure proper implementation of the programme. RECAP does not have a well-defined organisational structure and a structured monitoring and evaluation system. In addition, there are no clear selection criteria for projects, beneficiaries and strategic partners/mentors. The strategic interventions are not resulting in a broad-based capacitation of the beneficiaries. The effectiveness of strategic interventions seems to vary from province to province. Of the six provinces included in the evaluation, the interventions seem to work better in Eastern Cape and Gauteng. Beneficiaries in North West and, particularly in the Free State, are the most dissatisfied with their strategic partners/mentors -- there appears to be serious problems with the transfer of management and technical skills to beneficiaries and establishment of market linkages, raising questions about the effective empowerment of beneficiaries. There are also many problems with regard to the management of RECAP funds, with beneficiaries having little control over the funds. Despite these major shortcomings, RECAP has made some progress towards achieving its intended objectives, but there is room for a significant improvement in many areas.
Market access for farmers/beneficiaries is rarely improved One of the lowest positive impacts assessed relates to RECAP‟s (output and input) market access facilitation. About 47% of the respondents benefiting directly from the programme (only 39% of the total number of beneficiaries interviewed) note that their market access has improved. Market access development through RECAP has mainly occurred in KwaZulu-Natal (70%) and the least in Gauteng.
Employment creation, both direct and indirect, has been positive, although weak. The RECAP projects and business plans have not focused on activities and investments that are labour intensive. Employment on the farms has increased in 58% of the cases that benefited effectively from RECAP funding, representing a mere 43% of all the RECAP cases interviewed.

vii
The input procurement processes employed by some strategic partners often do not lead to benefits for local communities and business. Inputs are often sourced from external suppliers, sometimes outside the province in which RECAP farms are located. In addition, local skills are not considered as outsiders are hired to perform simple tasks like fencing. This goes against one of the objectives of RECAP of creating employment opportunities.
Capacitation of farmers/beneficiaries remains low, as skills transfer by strategic partners is not effective.
About 44% of the benefiting beneficiaries noted that RECAP had positive impacts in terms of skills transfer; this represents 34% of the total RECAP cases included in this evaluation. This result is rather disappointing as skills transfer is one of the key elements of RECAP.
The economic situation of the farmers/beneficiaries is considered to have improved, although the improvements remain small in absolute terms. About 72% of the people benefiting effectively from RECAP mentioned that their economic situation had improved. This translates to 57% of all the respondents included in the sample.
The social status of farmers/beneficiaries is also considered to have improved, although its sustainability is questionable. RECAP has impacted positively on the social status of about 70% of those benefiting effectively from RECAP, which is about 55% of the total number of beneficiaries interviewed. However, the latter is not unexpected, as through the significant amount of funds injected in the projects, beneficiaries are directly benefiting materially (e.g. acquisition of bakkies) and socially (higher status in the community). In some cases, expenses on non-productive assets (e.g. cars) seem to have been prioritised, making the sustainability of the projects and social status of the beneficiaries questionable.
RECAP spending per project is relatively high, questioning the financial sustainability of RECAP itself and of its overall efficiency. The RECAP budget amounts to 25% of DRDLR‟s baseline land redistribution and restitution of land rights budget and was about R3.3 billion for the 2012/13 financial year. Considering the 98 projects included in the evaluation, the efficiency of the RECAP programme, measured in terms of investment expenditure against results, is low. This is the case when spending per project is considered. On average, R2.9 million is spent per project in the six provinces included in the evaluation. However, only 70% of the RECAP projects were generating income from farming at the time of the evaluation, with a few of these projects showing potential to be sustainable. This result is particularly weak for the Free State, where more than R3.9 million is spent per project, with only 55% of the recapitalised projects generating income from farming.
As RECAP benefits a relatively small number of beneficiaries, spending per beneficiary and per job created is
relatively high.
On average, R463 284 is spent per beneficiary or R588 284 is spent to create one job in the six provinces included in the evaluation. One of the largest expenditures is in the Free State, where R1.02 million is spent per beneficiary and where RECAP spending has not been associated with the creation of a single additional full-time job.
Policy Recommendations
Prior to presenting recommendations for strengthening RECAP, we wish to point out that the recommendations should be considered as a „second best solution‟. In our view, the best and lasting solution would entail a redesign and overhaul of all public agricultural support programmes and doing away with existing silos of funding agricultural support services, including post-settlement support. This would entail the establishment of an all-inclusive fund to support land acquisition, extension and mentorship, agricultural finance and market access. Implementing our proposed „best solution‟ would render RECAP and similar programmes unnecessary as they would be subsumed under a single programme for agricultural support.
The soundness of our proposal (i.e. the „best solution‟) will be appreciated if it is considered that the basis for RECAP‟s existence is the absence of alignment and coordination between agricultural support programmes and land reform processes. In an ideal situation, the provision of adequate and quality agricultural support services (inputs, finance, extension, market information, etc.) would have been in place upon the transfer of land to beneficiaries. However, because the delivery of these services has been unsatisfactory, essential agricultural support services for
viii
land reform beneficiaries are not in place. Hence, the implementation of RECAP, which is essentially providing support services that should be provided by DAFF and the relevant provincial departments of agriculture.
With the realisation that the provision of adequate agricultural support services for land reform beneficiaries is not possible in the foreseeable future without programmes such as RECAP, there is justification for the programme to continue in the interim (i.e. until the best and lasting solution is found). Hence, the following main recommendations are meant to strengthen RECAP whilst a lasting solution is sought:
Review the objectives of RECAP to make them more clear and specific. This should include defining the meanings of key terms used in the programme (e.g. distressed farms, recapitalisation, development, commercial farmer, etc.).
Ensure a common understanding of RECAP among its stakeholders by engaging in an all-inclusive process to discuss the nature, operation, purpose and objectives of the programme.
Establish a separate organisational structure for RECAP and ensure that the programme has its own full-time staff and do away with the current arrangement of seconding staff from other units of DRDLR to work for RECAP part-time. A separate organisational structure would also help to address the current problems experienced related to reporting arrangements between provincial and national RECAP offices.
Provide additional and appropriately qualified personnel dedicated to RECAP to improve its administrative and functional efficiency. This will address the problem of understaffing in RECAP and lack of skills, especially among project officers.
Develop clear and specific selection criteria for beneficiaries and land reform farms for recapitalisation and development in line with the objectives of RECAP. The criteria should be developed to ensure that only deserving land reform farms and beneficiaries are selected for participation in RECAP.
Review selection criteria for strategic partners and mentors to ensure that only those that are competent and committed to RECAP objectives are selected.
The requirement to have a strategic partner or mentor to qualify for participation in RECAP should be applied selectively to exempt beneficiaries with adequate experience and capacity to manage their farms. This will require conducting skills and needs assessment to determine the readiness of beneficiaries to carry out farming activities without a mentor/strategic partner.
Replace the current RECAP grant funding with loan funding. RECAP funding should differentiate recapitalisation needs from farm development or growth needs, with a view to encourage beneficiaries to take responsibility for their enterprise/farm growth. Changing to loan funding would also increase the coverage of RECAP in terms of the number of beneficiaries assisted as the money paid back would become available for on-lending to more beneficiaries.
1
1. Introduction
An implementation evaluation of the Recapitalisation and Development Programme (RADP, henceforth abbreviated as RECAP) was commissioned by the Department of Performance Monitoring and Evaluation during 2012. The evaluation was undertaken by Business Enterprises at University of Pretoria (Pty) Ltd in November 2012 to July 2013. In implementing the evaluation, data were collected from land reform beneficiaries, government officials, strategic partners and mentors in six provinces: Eastern Cape, Free State, Gauteng, KwaZulu-Natal, Limpopo and North West. The results of the evaluation should be useful in informing policy processes on land reform, especially what needs to be done to ensure that the implementation of RECAP is improved.
1.1 Background on the Recapitalisation and Development
Programme
Land reform is an important priority for the South African government and constitutes a critical component of the Comprehensive Rural Development Programme (CRDP). The land reform programme was intended to contribute to the CRDP's main objective of deracialising the rural economy, ensuring democratic, equitable land allocation and sustainable production discipline for food security. Although the land reform programme has achieved some success, in terms of improving access to land and contributing to improved livelihood for beneficiaries, its sustainability has been questioned, both within and outside government circles. In particular, some of the transferred farms have not reached the desired levels of productivity while others are not operational at all. It was partially as a result of the above that the Recapitalisation and Development Programme (RECAP) was implemented in 2010 (DRDLR, 2011a; DRDLR, 2012b) Objectives and focus of the RECAP At the time of undertaking the implementation evaluation, the objectives of the RECAP were to: a) increase agricultural production; b) guarantee food security; c) graduate small farmers into commercial farmers; d) create employment opportunities within the agricultural sector; and e) establish rural development monitors. These objectives are meant to contribute to the achievement of Outcome 7: Vibrant, equitable and sustainable rural communities and food security for all. RECAP also contributes to the achievement of Outcomes 4 and 10: Creation of decent employment opportunities through economic growth and ensuring sustainable natural resource management, respectively (DRDLR, 2011a). Operation of RECAP RECAP was designed to focus on land reform farms acquired since 1994 that have received little or no support, but have a potential to be sustainable. These farms, considered to be in distress, are offered technical and financial support. About 1807 distressed farms have been targeted for recapitalisation and development by 2014. The number of farms recapitalised from the inception of RECAP up to June 2012 was 640 and this is universe from which the sample for the implementation evaluation was selected. According to DRDLR (2013b), 1269 farms had been recapitalised by the end of the 2012/13 financial year. Two strategic interventions have been adopted under RECAP to ensure the sustainability of land reform projects. These interventions are strategic partnership and mentorship.
At the inception, RECAP projects were funded based on a five-year funding model and no request for assistance is supposed to be approved without a comprehensive business plan as follows (DRDLR, 2011a): a) Year 1: 100% funding for infrastructure and operational costs; b) Year 2: 80% funding for development needs; c) Year 3: 60% funding for development needs; d) Year 4: 40% funding for development needs; and e) Year 5: 20% funding for development needs. In terms of this initial funding model, profits from the operations of the previous year are to contribute towards 20% of the business plan needs for the following year. However, to take into consideration the differences in agricultural enterprises in terms of their nature and incubation periods, the model was changed from a five-year cycle to five development phases. Phase one was then to focus on the infrastructure and operational needs whilst phases two to five focused on value change developments. In terms of the DRDLR guidelines for RECAP implementation, as

2
approved by the Acting Deputy Director General for Land Reform on 24 January 2012, the new RECAP funding model is as follows (DRDLR, 2012a): Phase 1: 100% funding The funding in this phase covers 100% of the developmental needs (i.e. Infrastructural and operational inputs) identified in the business plan to turn around the deficiencies of the farm under RECAP on the primary value chain (e.g. on livestock production adopting Weiner production systems, all infrastructural and production inputs,(including animals, should be funded). Phase 2: 80% funding The application of phase 2 should be guided by the business plan and be applicable to value adding developments (e.g. development of the feedlot). In this case, RECAP funding should cover 80% of the development needs. The remaining 20% should be derived from the proceeds of the primary chain (phase 1 proceeds). Phase 3: 60% funding Funding in phase 3 should be applicable to value adding developments (e.g. development of an abattoir). In this case, RECAP funding should cover 60% of the development needs. The remaining 40% should be funded from the proceeds of the previous developments (phases 1 and phase 2). Phase 4: 40% funding RECAP funding in phase 4 is value adding developments (e.g. development of a meat processing plant). Only 40% of the development needs should be covered by RECAP. The remaining 60% should be covered from the proceeds of the previous developments (phases 1, 2 and 3). Phase 5: 20% funding In phase 5, RECAP funding covers 20% of the value adding development (e.g. development of a meat outlet). The remaining 80% of the development needs should be funded from the proceeds of the previous developments (phases 1, 2, 3 and 4). The total area of the 640 farms that were placed under RECAP at the time of conducting the implementation evaluation was 530 934 ha. Of these farms, 264 attached to strategic partners and 117 to mentors
1. Most of the
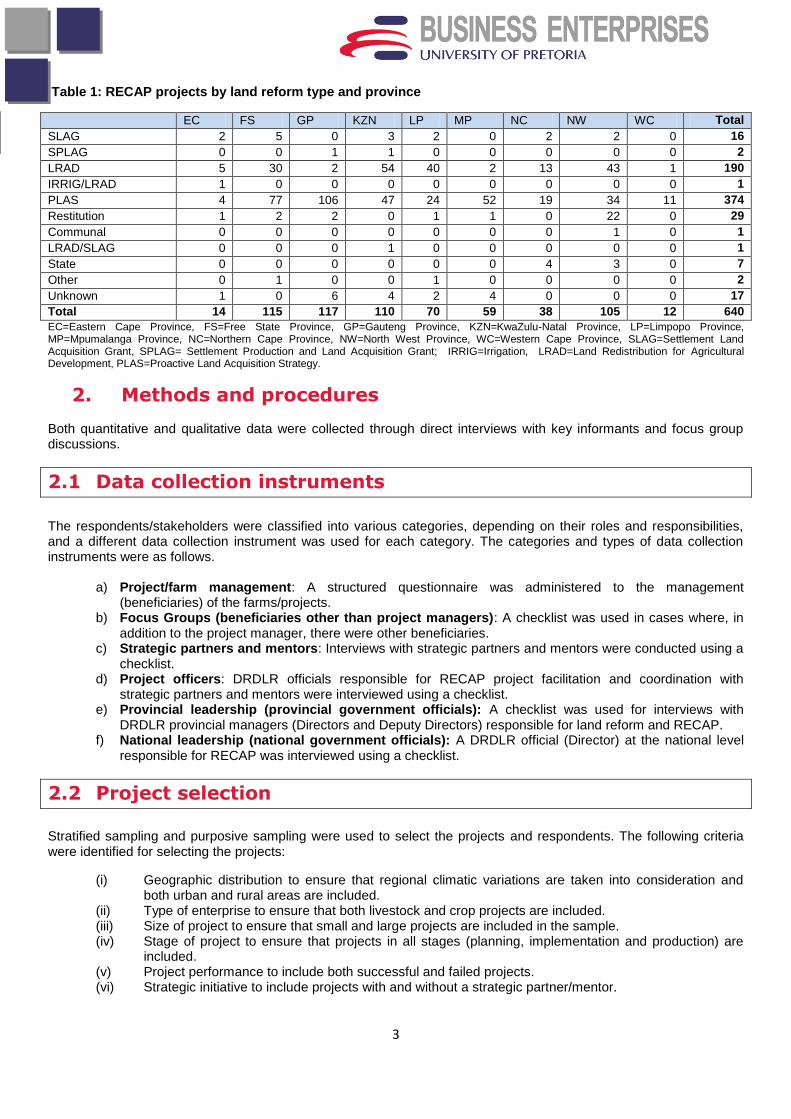
remaining 259 farms were being considered for direct sourcing as there were no interested strategic partners. About 38 strategic partners and 50 mentors had been appointed (DRDLR, 2011b). Table 1 provides information on the RECAP projects by land reform type and province. Most of the projects are PLAS and LRAD farms. SLAG and restitution projects are few, although many such projects would be described as financially struggling and thus qualify for RECAP support. This reflects clear preference on the part of DRDLR to work with projects other than SLAG and restitution projects. This may be considered as a weakness of RECAP in that it seems to avoid SLAG and restitution projects which often require more assistance than PLAS and LRAD projects. It is also worth noting that RECAP support seems to be limited to land reform projects to the exclusion of other types of projects/farms that may be considered to be financially struggling.
1.2 Purpose and scope of the implementation evaluation
Aims and objectives of the evaluation
The evaluation was designed to provide the Department of Rural Development and Land Reform (DRDLR) and the intended beneficiaries of RECAP with information and recommendations on how to improve the implementation of RECAP in line with its targets and objectives. The evaluation covers the implementation process of the RECAP from its inception in 2010 until June 2012.
1 According to DRDLR, a mentor or strategic partner is “a person or juristic person appointed by DRDLR to provide
services in accordance to the RADP policy”.
3
Table 1: RECAP projects by land reform type and province
EC FS GP KZN LP MP NC NW WC Total
SLAG 2 5 0 3 2 0 2 2 0 16
SPLAG 0 0 1 1 0 0 0 0 0 2
LRAD 5 30 2 54 40 2 13 43 1 190
IRRIG/LRAD 1 0 0 0 0 0 0 0 0 1
PLAS 4 77 106 47 24 52 19 34 11 374
Restitution 1 2 2 0 1 1 0 22 0 29
Communal 0 0 0 0 0 0 0 1 0 1
LRAD/SLAG 0 0 0 1 0 0 0 0 0 1
State 0 0 0 0 0 0 4 3 0 7
Other 0 1 0 0 1 0 0 0 0 2
Unknown 1 0 6 4 2 4 0 0 0 17
Total 14 115 117 110 70 59 38 105 12 640
EC=Eastern Cape Province, FS=Free State Province, GP=Gauteng Province, KZN=KwaZulu-Natal Province, LP=Limpopo Province, MP=Mpumalanga Province, NC=Northern Cape Province, NW=North West Province, WC=Western Cape Province, SLAG=Settlement Land Acquisition Grant, SPLAG= Settlement Production and Land Acquisition Grant; IRRIG=Irrigation, LRAD=Land Redistribution for Agricultural Development, PLAS=Proactive Land Acquisition Strategy.
2. Methods and procedures
Both quantitative and qualitative data were collected through direct interviews with key informants and focus group discussions.
2.1 Data collection instruments
The respondents/stakeholders were classified into various categories, depending on their roles and responsibilities, and a different data collection instrument was used for each category. The categories and types of data collection instruments were as follows.
a) Project/farm management: A structured questionnaire was administered to the management (beneficiaries) of the farms/projects.
b) Focus Groups (beneficiaries other than project managers): A checklist was used in cases where, in addition to the project manager, there were other beneficiaries.
c) Strategic partners and mentors: Interviews with strategic partners and mentors were conducted using a checklist.
d) Project officers: DRDLR officials responsible for RECAP project facilitation and coordination with strategic partners and mentors were interviewed using a checklist.
e) Provincial leadership (provincial government officials): A checklist was used for interviews with DRDLR provincial managers (Directors and Deputy Directors) responsible for land reform and RECAP.
f) National leadership (national government officials): A DRDLR official (Director) at the national level responsible for RECAP was interviewed using a checklist.
2.2 Project selection
Stratified sampling and purposive sampling were used to select the projects and respondents. The following criteria were identified for selecting the projects:
(i) Geographic distribution to ensure that regional climatic variations are taken into consideration and both urban and rural areas are included.
(ii) Type of enterprise to ensure that both livestock and crop projects are included. (iii) Size of project to ensure that small and large projects are included in the sample. (iv) Stage of project to ensure that projects in all stages (planning, implementation and production) are
included. (v) Project performance to include both successful and failed projects. (vi) Strategic initiative to include projects with and without a strategic partner/mentor.
4
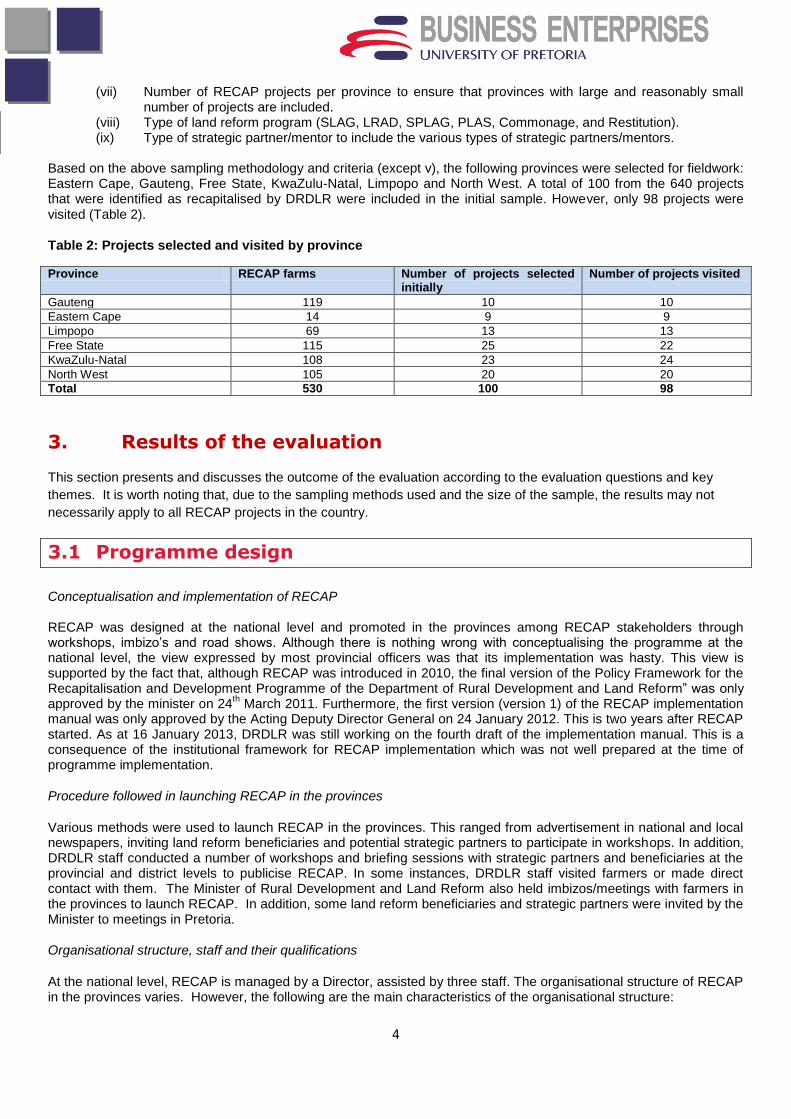
(vii) Number of RECAP projects per province to ensure that provinces with large and reasonably small number of projects are included.
(viii) Type of land reform program (SLAG, LRAD, SPLAG, PLAS, Commonage, and Restitution). (ix) Type of strategic partner/mentor to include the various types of strategic partners/mentors.
Based on the above sampling methodology and criteria (except v), the following provinces were selected for fieldwork: Eastern Cape, Gauteng, Free State, KwaZulu-Natal, Limpopo and North West. A total of 100 from the 640 projects that were identified as recapitalised by DRDLR were included in the initial sample. However, only 98 projects were visited (Table 2).
Table 2: Projects selected and visited by province
Province RECAP farms Number of projects selected initially
Number of projects visited
Gauteng 119 10 10
Eastern Cape 14 9 9
Limpopo 69 13 13
Free State 115 25 22
KwaZulu-Natal 108 23 24
North West 105 20 20
Total 530 100 98
3. Results of the evaluation
This section presents and discusses the outcome of the evaluation according to the evaluation questions and key
themes. It is worth noting that, due to the sampling methods used and the size of the sample, the results may not
necessarily apply to all RECAP projects in the country.
3.1 Programme design
Conceptualisation and implementation of RECAP RECAP was designed at the national level and promoted in the provinces among RECAP stakeholders through workshops, imbizo‟s and road shows. Although there is nothing wrong with conceptualising the programme at the national level, the view expressed by most provincial officers was that its implementation was hasty. This view is supported by the fact that, although RECAP was introduced in 2010, the final version of the Policy Framework for the Recapitalisation and Development Programme of the Department of Rural Development and Land Reform” was only approved by the minister on 24
th March 2011. Furthermore, the first version (version 1) of the RECAP implementation
manual was only approved by the Acting Deputy Director General on 24 January 2012. This is two years after RECAP started. As at 16 January 2013, DRDLR was still working on the fourth draft of the implementation manual. This is a consequence of the institutional framework for RECAP implementation which was not well prepared at the time of programme implementation.
Procedure followed in launching RECAP in the provinces
Various methods were used to launch RECAP in the provinces. This ranged from advertisement in national and local newspapers, inviting land reform beneficiaries and potential strategic partners to participate in workshops. In addition, DRDLR staff conducted a number of workshops and briefing sessions with strategic partners and beneficiaries at the provincial and district levels to publicise RECAP. In some instances, DRDLR staff visited farmers or made direct contact with them. The Minister of Rural Development and Land Reform also held imbizos/meetings with farmers in the provinces to launch RECAP. In addition, some land reform beneficiaries and strategic partners were invited by the Minister to meetings in Pretoria.
Organisational structure, staff and their qualifications
At the national level, RECAP is managed by a Director, assisted by three staff. The organisational structure of RECAP in the provinces varies. However, the following are the main characteristics of the organisational structure:

5
RECAP does not have a separate delivery structure with its own staff, but relies on staff from other units within DRDLR.
All staff dealing with RECAP in the provinces are accountable to the Director for Land Reform in the relevant province. The Provincial Land Reform Director is responsible for overall implementation of RECAP. He/she is assisted by a RECAP Manager and/or RECAP Coordinators or District Project Officers.
In most provinces, there is a RECAP Manager, reporting directly to the Director for Land Reform in the province. The RECAP Manager is often assisted by a few RECAP Coordinators. In some provinces, he/she is assisted by District Project Officers, who are responsible for RECAP coordination at the district level.
The RECAP staff complement ranges from three to 20, but a maximum of about three persons are employed on a full-time basis to implement RECAP – the rest have other responsibilities besides those of RECAP.
The reporting line between provincial RECAP staff and the national RECAP director is not clear. The provincial person responsible for RECAP officially reports to the Director for Land Reform in the province but also has reporting responsibilities to the national RECAP office.
The Monitoring and Evaluation Directorate at the national level is responsible for monitoring and evaluation of RECAP among other programmes.
The academic qualifications of the staff dealing with RECAP at the provincial level range from matric plus an additional professional qualification (e.g. diploma or short course) to a master‟s degree. Areas of specialisation include agriculture (agricultural economics, animal science, plant science, rural development and environmental science), social sciences (humanities, public administration, development economics) and statistics. It is our view that some of the officers, especially those responsible for RECAP at district level, have neither the relevant qualification nor the experience to carry out their responsibilities satisfactorily.
3.2 Understanding of RECAP
Overall, government officials interviewed are of the view that there is no common understanding of RECAP and its objectives among all stakeholders. They argue that DRDLR is the cause of the misunderstanding as RECAP requirements/instructions are always changed and project officers find themselves having to always go back to beneficiaries to explain and/or update them. Some of the confusion regarding RECAP among its stakeholders may be attributed to failure in the design of the programme to clearly specify the meanings of key concepts used in official documents on RECAP. These include terms like „farms in distress‟, „recapitalisation‟, „development‟, „commercial farmer‟, etc.
Most beneficiaries indicated that they understood RECAP and its funding model. Overall, 78% of all beneficiaries indicated that they understood RECAP and 74% of them stated that they also understood the RECAP funding model. The responses of beneficiaries varied from province to province, with Eastern Cape recording 89% of beneficiaries who indicated that they understood RECAP and North West recording 63%. The proportion of beneficiaries who indicated that they understood the RECAP funding model varied from 56%, in the Eastern Cape, to 87%, in KwaZulu-Natal. Although most beneficiaries stated that they understood RECAP and its funding model, their responses to specific questions, meant to assess their understanding of RECAP and its funding model, indicated that there is little understanding of these issues.
As regards strategic partners and mentors, they seem to have a good understanding of RECAP.
3.3 Selection criteria for participation in RECAP: beneficiaries and
projects
The RECAP policy document states that the programme will apply to all emerging farmers needing and deserving support. However, the document does not specify who qualifies for support, except to state that no project where there is internal conflict will be funded. Therefore, the implication is that all land reform farms qualify and the only selection criterion is whether there is conflict or not. Secondly, it is precisely projects that have experienced conflict that often collapse and, therefore, they are the ones needing the greatest support. Hence, it may be argued that RECAP is avoiding dealing with one of the greatest challenges for land reform in the country.
The lack of clear-cut selection criteria for projects and beneficiaries is one of the major weaknesses in the RECAP design. Having identified this fundamental design flaw in the RECAP, our fieldwork proceeded to understand how government officials in the various provinces operationalised the rather vague selection criteria. The questions related

6
to selection and funding criteria were not only posed to the provincial leadership of DRDLR, but also to strategic partners and beneficiaries.
Government officials in most of the provinces included in the study were of the view that there were no clear-cut selection and funding criteria for beneficiaries and farms to participate in RECAP.
Although the majority of the strategic partners/mentors thought the selection of beneficiaries and farms was done according to specific criteria, only a few could list these criteria and the responses were, in any case, not consistent. According to the beneficiaries, the most important selection criterion for farms and beneficiaries was the financial state of the farm and the potential to become successful, if assisted financially. This accounted for 26% of the beneficiaries interviewed. It is important to mention that there is a large number (45%) of beneficiaries that indicated that they either did not know the selection criteria or believed such criteria did not exist. This suggests that, for a significant number of respondents, the selection process for projects to participate in RECAP remains unclear.
3.4 Strategic interventions: strategic partners and mentors
In contrast to the selection criteria for beneficiaries/farms, the RECAP guideline document was much more specific as to the criteria and the process of selecting and appointing strategic partners. The document highlights a number of steps and procedures for appointing strategic partners and mentors, which are all fairly clear, to the point and practical. However, the procedures were applied differently in the various provinces. These may be summarised as follows:
Potential strategic partners were invited to apply and those who passed the screening process were appointed and given a list of farms to manage.
Strategic partners were selected on the basis of their financial ability and experience in the agricultural sector or in managing a big business.
The process of becoming a strategic partner was done through a formal tender process.
In some instances, strategic partners were referred to or just walked into DRDLR offices and submitted applications.
DRDLR initially followed the normal government procurement process, but was unable to get strategic partners and mentors. DRDLR then resorted to direct sourcing where potential strategic partners were approached.
Mentors were identified by beneficiaries, through farmer associations and by DRDLR officials. Names of those selected were also forwarded to the national office for accreditation.
Most mentors or strategic partners were those people who developed the business plans for the selected farms.
Beneficiaries identified their potential strategic partner or mentor and submitted the name to the DRDLR for appointment.
The response by beneficiaries to the question on how strategic partners/mentors were appointed confirmed that a large majority of respondents were of the view that the mentor/strategic partner was „imposed‟ by the DRDLR and that the beneficiaries did not have a choice. This was the case for a majority of the respondents in four of the six provinces: 79% in KwaZulu-Natal, 59% in Free State, 54% in Limpopo and 50% in North West. It was also mentioned that, in these provinces, the process of appointing mentors/strategic partners was not transparent. It is worth noting that, when RECAP started, strategic partners/mentors were recruited through tenders and their appointment was done by DRDLR, without the involvement of the beneficiaries. This could explain the relatively high percentage of respondents, in some provinces, indicating that strategic partners/mentors were „imposed‟ by DRDLR. Currently, beneficiaries participate in the selection and appointment process for strategic partners/mentors.
In Gauteng and Eastern Cape, the process of appointing the strategic partner/mentor appeared to be more open. In the Eastern Cape, 77% of the respondents indicated that the appointment of strategic partners/mentors was their own responsibility. In Gauteng, 60% noted that it was their own responsibility, and 40% emphasized that it was a joint exercise between them and the DRDLR. Based on these responses, there seems to be a problem related to the transparency of the selection process for strategic partners/mentors in some of the provinces. For example, about 50% of the strategic partners and mentors in North West did not know how they were selected.

7
As regards the qualifications and experience of strategic partners and mentors, the RECAP policy and guideline documents are not specific. The evaluation established that some of the strategic partners/mentors had a good track record and relevant farming experience, including supporting new black farmers. However, there were many with limited farming experience and with hardly any agricultural qualifications – for example, one of the strategic partners was a dentist, with neither farming experience nor agricultural qualification. Although about a quarter of the beneficiaries considered their relationship with the mentor/strategic partners as equal (this is mainly the case in Limpopo and Gauteng), about a quarter of the projects‟ beneficiaries emphasised that it was a very hierarchical one, comparing it to an employer-employee relationship. The relationship between strategic partners and beneficiaries can be described in many ways and depends, to a large extent, on the specific case and context. Beneficiaries cited cases where they were consulted during the development of business plans in terms of identifying their needs, but afterwards, during the implementation phase, the relationship between strategic partners and beneficiaries tended to be strained and mistrustful in most cases. The relationship with mentors appointed by strategic partners, in most cases, was cordial, friendly, social and informal. The level of satisfaction of the beneficiaries regarding the present mentors and strategic partners is rather low. On average, only 46% of the beneficiaries are satisfied with their strategic partners/mentors. Beneficiaries were also asked to indicate their level of satisfaction with regard to the roles played by strategic partners and mentors. Overall, the level of satisfaction is low: 67% of the beneficiaries were satisfied with the role played by strategic partners and mentors. There is, however, a high degree of variability between the provinces regarding the satisfaction of beneficiaries with the role of mentors/strategic partners. An analysis of the responses of beneficiaries to the question of whether they were satisfied with the role of strategic partners and mentors with regard to specific roles (e.g. funding, provision of markets, etc.), shows that they were least satisfied with the role of mentors and strategic partners in providing input markets.
As regards the roles and responsibilities of strategic partners and mentors, interviews with provincial government officials established that the roles and responsibilities included assisting farmers in decision making, day-to-day operation of farms, fund managements and transfer of technical skills. Other roles include transfer of financial expertise, disease control, performance monitoring and providing advice. They view the role of strategic partners/mentors as important as they have to capacitate the beneficiaries with skills and knowledge. Although the role of strategic partners/mentors is appreciated, the officials do acknowledge that some of the strategic partners/mentors do not deliver on this role as expected. In contrast to the positive views of government officials, most of the project officers felt that the role of the strategic partners and mentors was not important as many of them do not have enough experience and basically serve only as procurement agents. It was clear that, in some cases, the beneficiaries were more knowledgeable than their strategic partners and mentors. Again, this reflects a failure in selecting the correct mentor or strategic partner. In reality, some of the strategic partners have been identified as the source of many complaints and are also not coming up with any strategic contribution. Strategic partners/mentors believe that their role is important to the success of RECAP. They believe that their role is to guide the beneficiaries to grow and become independent farmers. They believe that their role is important, especially because beneficiaries do not have the necessary knowledge and would not be able to manage RECAP funds. Strategic partners/mentors identify the following as their roles and responsibilities: implementation of RECAP according to business plans, capital investment through contribution of own resources, linking farmers to markets, provide access to commercial best practices (technology transfer), empower beneficiaries through technical skills transfer, monitor expenditure according to business plans and ensure sustainability of the farms.
The above indicates that provincial RECAP officials and project officers hold contrasting views about the role of strategic partners. Although this may not be the case in all provinces included in the study, it indicates that there are problems with the roles played by some strategic partners. Their contribution does not seem to be appreciated by some of the project officers and beneficiaries. However, strategic partners themselves and some provincial government officials believe that strategic partners play an important role.
3.5 Business plan development and implementation
There are varying approaches to the development of business plans, from full participation by the beneficiary to complete dominance by mentors or strategic partners. Business plans are generally prepared by strategic partners or mentors. In some cases, beneficiaries are involved in the development of business while they are completely left out
8
in other cases. Sometimes, the level of consultation was limited to the farmer being asked about his/her farm needs. In some instances, strategic partners just developed proposals for the farmers without involving them. Some farmers couldn‟t tell how much they had been awarded or what they had requested in the proposal as they had not been part of the process. There are situations in which the business plan development process was a consultative process between the beneficiaries and strategic partners/mentors.
The quality of the business plans approved by DRDLR leaves much to be desired. A review of the business plans approved for funding of the “recapitalised” projects or farms revealed glaring omissions. Almost all business plans approved did not meet the minimum requirements expected of a funding business plan, and it is not clear how, and the basis on which funding was approved. Most of the approved business plans do not have implementation schedules or GANTT charts, which is a serious omission. Furthermore, the business plans do not differentiate recapitalisation funding requirements from development and growth funding requirements. This situation creates a high risk for either under-capitalisation or over-capitalisation of projects and possible wasteful expenditure.
3.6 Capacity building for beneficiaries
Technical (farming) knowledge and skills
Most of the skills transferred to beneficiaries were technical. In the Eastern Cape, technical skills transferred were in citrus, maize, tomato, cattle and small stock farming. Also transferred were financial management skills. In the Free State, the technical skills transferred to beneficiaries were in both livestock and crop production. Other skills transferred included daily planning, stock count and income and expenditure capturing. Mentors also played advisory roles advising farmers on their financial expenditure. In terms of farm management, the majority of project officers in Limpopo province feel that mentors have not made a significant improvement as the level of skills transfer is low. The provincial government officials are also of the view that impact on farm management is not good enough, although there is a continuous transfer of skills, albeit to a lesser level. However the mentors believe that there has been an improvement, although not everything went according to plan. They maintain that beneficiaries are beginning to realise that they must also get involved. The enhancement of ownership, enabling the small-scale emerging black farmer to compete with established white commercial farmers as well as enabling control over funds by the beneficiaries, together with the mentor, has been identified by the mentors as the unique contribution of RECAP compared to the preceding land reform process.
There is a unanimous agreement amongst the North West provincial government officials, that beneficiaries have had their technical farming skills improved. It has been indicated that most of the farms which were lying fallow have now come into production whilst committed beneficiaries have increased agricultural productivity.
Marketing knowledge and skills
Beneficiaries received practical skills in buying and selling, including record keeping. In some cases, they accompanied strategic partners to auctions and acquired negotiation skills. In Gauteng, provincial government officials were of the opinion that little had taken place in terms of integrating the beneficiaries into the value chain. Maize farmers/beneficiaries were cited as only delivering their produce to Senwes and, thereafter, they are no longer getting involved in further processing. On the other hand, most project officers in Gauteng believe that, albeit to a lesser extent, beneficiaries have access to markets for their products and are also being integrated into the value chain. Provincial government officials in Limpopo are of the view that beneficiaries of RECAP have succeeded in having their products integrated into the value chain, although the access was limited. Project officers had varying views. Some officers felt that integration of beneficiaries‟ products into the value chain was still low. Others stated that integration had not yet been realised, although some beneficiaries were preparing to enter the dried fruit market. Other project officers were of the view that integration had taken place to a greater extent as some broiler farmers are already delivering to Rainbow Chickens, although the mentors are the ones who are collaborating and integrating with the markets.
9
Provincial government officials in North West indicated that none of the beneficiaries has so far had access to markets for their products to be integrated into the value chain as these beneficiaries are still at the primary production level.
Involvement in decision making
The level of beneficiary participation in decision making varies according to province, type of partnership and activity. In the Eastern Cape, some strategic partners (e.g. Bono) make all decisions regarding production and financial management. Beneficiaries are farm workers who receive a salary and are, therefore, not consulted or involved in decision making. For example, in the case of Bono, even though two of the beneficiaries are members of the management board, they are not involved in the day-to-day decision making. However, there are cases where beneficiaries are consulted by strategic partners on production matters, although there is little consultation on financial issues (e.g. Imbumba Beef Production Company). Mentors in the Eastern Cape involve beneficiaries in decision making on both production and financial issues. Farmers were involved in crop and animal production decisions in the Free State. However, financial decisions remained the domain of the strategic partners. There were cases where strategic partners acknowledged the expertise of the beneficiaries and mandated them to work independently, such as purchasing of cattle. There is a divided opinion among mentors in Limpopo as regards collaboration and participation in activity planning among DRDLR, partners and beneficiaries. The majority of mentors are of the opinion that activity planning is both participative and collaborative, whereas a minority view exists to the effect that there is too much hurry to spend on the part of DRDLR. Although there is common understanding that the RECAP has achieved an average to high level of participation and collaboration among DRDLR, partners and beneficiaries, there is also an acknowledgement that there is still room for improvement as cases of some beneficiaries complaining that there was no participation have been reported in North West. The beneficiaries who participated in focus group discussions in North West indicated that they do participate in decision making. They participated in decisions regarding financial expenses, execution of tasks on the farm, as well as the leasing of the farm to other users. But the beneficiaries indicated that there was no participatory and collaborative process in activity planning, especially with regard to getting quotations for purchases, and that they were only expected to sign invoices.
3.7 RECAP funding and spending
3.7.1 Funding of RECAP
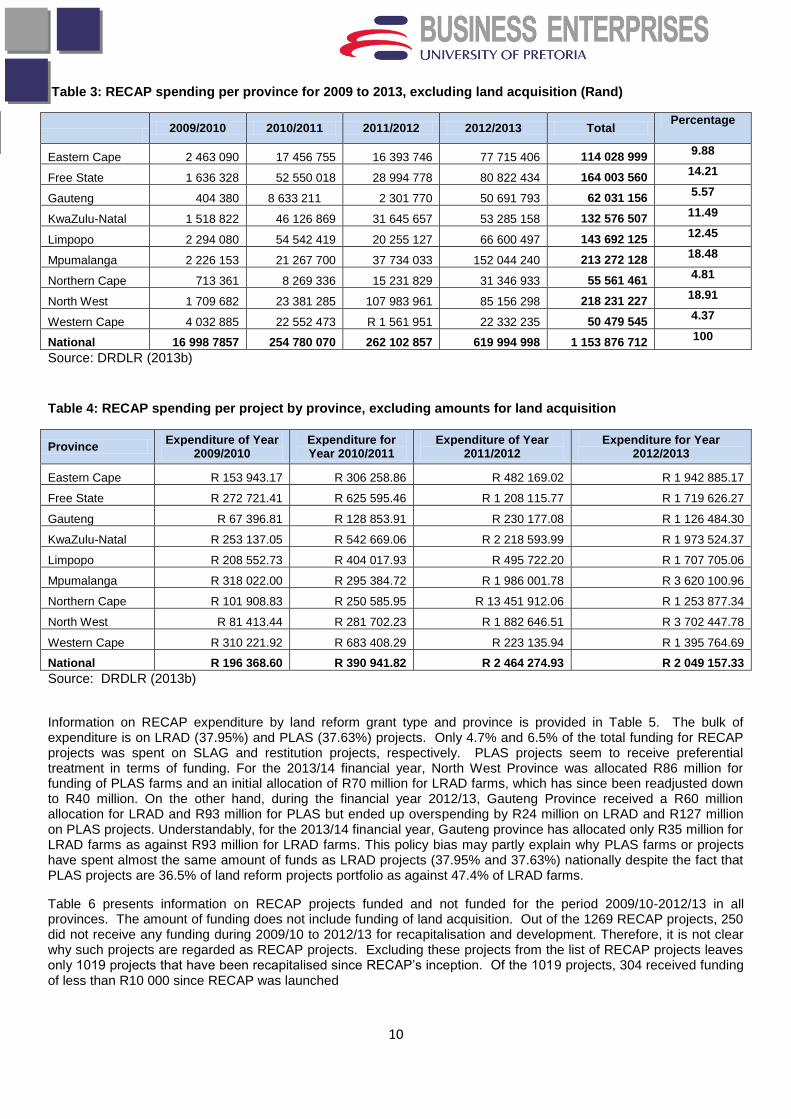
The annual budget for RECAP is equivalent to 25% of DRDLR‟s baseline land redistribution and restitution of land rights budget (DRDLR, 2013a). During the 2012/13 financial year, the RECAP budget amounted to R821 038 million (i.e. 25% of R3 284 152 million). Information on RECAP spending per province, excluding the amount for land acquisition, for 2009 to 2013 is presented in Table 3. The largest proportion (19%) of the total RECAP spending between 2009 and 2013 was on projects in North West, followed by Mpumalanga (18.5%), Free State (14%) and KwaZulu-Natal (11.5%). Western Cape had the smallest share (4.4%) of total RECAP spending during 2009-2013. The average spending per project for all RECAP projects since 2009/10 is outlined in Table 4. Average spending per project, nationally, was about R2 million for 2012/13, increasing from about R390 000 in 2010/11. Average spending per project for 2012/13 was highest in Mpumalanga (R3.6 million) and lowest in Gauteng (R1.1 million). The amount spent per project has been rising since 2009/10 for most provinces and the increase was particularly significant between 2011/12 and 2012/13.
10
Table 3: RECAP spending per province for 2009 to 2013, excluding land acquisition (Rand)
2009/2010 2010/2011 2011/2012 2012/2013 Total
Percentage
Eastern Cape 2 463 090 17 456 755 16 393 746 77 715 406 114 028 999 9.88
Free State 1 636 328 52 550 018 28 994 778 80 822 434 164 003 560 14.21
Gauteng 404 380 8 633 211 2 301 770 50 691 793 62 031 156 5.57
KwaZulu-Natal 1 518 822 46 126 869 31 645 657 53 285 158 132 576 507 11.49
Limpopo 2 294 080 54 542 419 20 255 127 66 600 497 143 692 125 12.45
Mpumalanga 2 226 153 21 267 700 37 734 033 152 044 240 213 272 128 18.48
Northern Cape 713 361 8 269 336 15 231 829 31 346 933 55 561 461 4.81
North West 1 709 682 23 381 285 107 983 961 85 156 298 218 231 227 18.91
Western Cape 4 032 885 22 552 473 R 1 561 951 22 332 235 50 479 545 4.37
National 16 998 7857 254 780 070 262 102 857 619 994 998 1 153 876 712 100
Source: DRDLR (2013b)
Table 4: RECAP spending per project by province, excluding amounts for land acquisition
Province Expenditure of Year
2009/2010 Expenditure for Year 2010/2011
Expenditure of Year 2011/2012
Expenditure for Year 2012/2013
Eastern Cape R 153 943.17 R 306 258.86 R 482 169.02 R 1 942 885.17
Free State R 272 721.41 R 625 595.46 R 1 208 115.77 R 1 719 626.27
Gauteng R 67 396.81 R 128 853.91 R 230 177.08 R 1 126 484.30
KwaZulu-Natal R 253 137.05 R 542 669.06 R 2 218 593.99 R 1 973 524.37
Limpopo R 208 552.73 R 404 017.93 R 495 722.20 R 1 707 705.06
Mpumalanga R 318 022.00 R 295 384.72 R 1 986 001.78 R 3 620 100.96
Northern Cape R 101 908.83 R 250 585.95 R 13 451 912.06 R 1 253 877.34
North West R 81 413.44 R 281 702.23 R 1 882 646.51 R 3 702 447.78
Western Cape R 310 221.92 R 683 408.29 R 223 135.94 R 1 395 764.69
National R 196 368.60 R 390 941.82 R 2 464 274.93 R 2 049 157.33
Source: DRDLR (2013b)
Information on RECAP expenditure by land reform grant type and province is provided in Table 5. The bulk of expenditure is on LRAD (37.95%) and PLAS (37.63%) projects. Only 4.7% and 6.5% of the total funding for RECAP projects was spent on SLAG and restitution projects, respectively. PLAS projects seem to receive preferential treatment in terms of funding. For the 2013/14 financial year, North West Province was allocated R86 million for funding of PLAS farms and an initial allocation of R70 million for LRAD farms, which has since been readjusted down to R40 million. On the other hand, during the financial year 2012/13, Gauteng Province received a R60 million allocation for LRAD and R93 million for PLAS but ended up overspending by R24 million on LRAD and R127 million on PLAS projects. Understandably, for the 2013/14 financial year, Gauteng province has allocated only R35 million for LRAD farms as against R93 million for LRAD farms. This policy bias may partly explain why PLAS farms or projects have spent almost the same amount of funds as LRAD projects (37.95% and 37.63%) nationally despite the fact that PLAS projects are 36.5% of land reform projects portfolio as against 47.4% of LRAD farms.
Table 6 presents information on RECAP projects funded and not funded for the period 2009/10-2012/13 in all provinces. The amount of funding does not include funding of land acquisition. Out of the 1269 RECAP projects, 250 did not receive any funding during 2009/10 to 2012/13 for recapitalisation and development. Therefore, it is not clear why such projects are regarded as RECAP projects. Excluding these projects from the list of RECAP projects leaves only 1019 projects that have been recapitalised since RECAP‟s inception. Of the 1019 projects, 304 received funding of less than R10 000 since RECAP was launched

11
Table 5: RECAP expenditure per programme/grant type for financial years 2009/10-2012/13 by province (R million)
Programme or grant type
Eastern
Cape
Free
State
Gauteng KwaZulu-
Natal
Limpopo Mpumal-
anga
Northern
Cape
North
West
Western
Cape
National %
LRAD 25.84 36.28 10.75 45.19 107.54 25.27 27.16 128.92 30.90 437.89 37.95
PLAS 39.05 107.77 46.80 57.17 19.54 98.18 20.57 25.73 19.36 434.21 37.63
Commonage 3.30 1.52 15.00 19.82 1.72
State land 0 4.72 0 4.72 0.41
Irrigation schemes 33.24 2.01 2.78 0 38.04 3.30
LRAD/SLAG 2.50 4.05 0 6.56 0.57
LASS .43 0 .43 0.04
Private .23 0 .23 0.02
PG .42 0 .42 0.04
SPLAG .17 1.55 5.98 .47 8.18 0.71
SLAG .94 8.15 .38 3.79 36.83 3.09 .97 .21 54.39 4.71
Restitution 11.00 10.29 6.51 46.70 0 74.52 6.46
TBC .04 1.48 .01 13.92 7.02 4.74 47.11 0 74.36 6.44
Total 114.02 164.00 62.03 132.57 143.63 213.27 55.56 218.23 50.47 1153.82 100
% 9.88 14.21 5.38 11.49 12.45 18.48 4.82 18.91 4.37 100
Source: Compiled based on DRDLR (2013b)
Table 6: Number of RECAP projects funded by province and funding category for 2009-2013 (excluding amounts for land acquisition)
Funding category (R)
Eastern Cape
Free State
Gauteng
KwaZulu- Natal
Limpopo
Mpumalanga
Northern Cape
North West
Western Cape
Total
0 14 43 30 24 15 49 13 55 7 250
1 - 99 999 37 41 40 31 33 25 27 55 15 304
100000 – 200000 15 26 20 7 18 20 4 17 5 132
200001 – 500000 18 27 9 36 53 18 10 18 5 194
500001 – 1000000 19 3 10 28 33 16 2 11 11 133
1000001 – 2000000 15 11 11 12 8 19 5 7 6 94
2000001 – 5000000 9 19 9 11 12 12 12 23 7 114
5000001 – 10000000 2 3 1 4 5 7 1 5 1 29
10000000 plus 2 3 0 3 1 6 0 4 0 19
Total 131 176 130 156 178 172 74 195 57 1269
Source: Compiled based on DRDLR (2013b)

12
In the case of RECAP projects included in our sample, the average amount requested from DRDLR per project as per the business plans is R6.153 million (Table 7). A total of R406 million was requested for the farms in the sample. However, the average amount requested per project varies widely among the six provinces included in the evaluation. This reflects significant differences in how the funds are managed or the type of enterprises that are being focused on in the provinces. The six provinces can be divided into three categories on the basis of the average amount requested per project: (1) Eastern Cape and KwaZulu-Natal have requested the smallest amount per project (between R1.5 and R2.9 million, on average per project, respectively); (2) Limpopo and North West requested amounts close to the overall average of R6.79 and R7.08 million per project, respectively; and (3) Gauteng and Free State have requested between R7.92 million and R8.43 million, on average, per project, respectively. This means that, on average, a project in the Free State requested about six times (i.e. 600%) more than one in the Eastern Cape.
Also important to note is the maximum amount of funding requested per project in each of the six provinces. This varies between R3.2 million in the Eastern Cape (lowest) and R48 million in North West (highest) per project. These amounts are relatively large and need to be evaluated against the activities undertaken and the returns on investment achieved.
3.7.2 Spending of RECAP funds
In comparison to the funds requested in the framework of RECAP, the funds actually disbursed for farm assets and production inputs are much lower. These figures have to be considered cautiously as (1) few beneficiaries (23 in total), had complete information on expenses incurred in the framework of RECAP (in many cases, as has been described above, decision making power and fund management lies with the mentor/strategic partner); and 2) expenses covered are mainly related to farm assets and production inputs present on the project (other costs, such as rent, and costs related to mentor/strategic partner, etc. are not taken into consideration) (Table 7).
Table 7: RECAP funds requested according to business plan by province
Eastern Cape
Free State Gauteng KwaZulu-Natal Limpopo North West Total
Total respondents 9 22 10 24 13
20
98
No. of respondents requested funds 3 12 9 16 10 16 66
Average amount requested per project (R) 1 566 667 8 426 444 7 922 222 2 983 399 6 788 000 7 084 205 6 152 711
Minimum amount requested per project (R) 600 000 1 400 500 1 300 000 1 000 000 900 000 1 200 000 600 000
Maximum amount requested per project (R)
3 200 000 33 200 000 27 000 000
7 500 000 30 000000
48 000 000
48 000 000
Beneficiaries without information 4 8 0 6 0 0 18
Beneficiaries not responded 2 2 1 2 3 4 14
The average amount per project actually disbursed through RECAP is R2.9 million (i.e. only for the projects that received funding in the sample) (Table 8). This is about 52% lower than the average amount requested per project in the framework of RECAP. The average amount disbursed per project varies significantly by province. The province receiving the lowest funding, on average per project, is Limpopo (R1.98 million per project on average). North West is the province with the highest amount received per project (i.e. R4.08 million per project on average). As regards the maximum amount of funds disbursed per project in the six provinces included in the evaluation, this varies from R3.2 million in the Eastern Cape to R16 million in North West.
Table 8: RECAP funds received per project by province (n=48)
Eastern Cape
Free State Gauteng KwaZulu-
Natal Limpopo
North West Total
Number of projects 3 11 4 15 7 8 48
Total amount received (R) 6 400 000 42 720
000 15 000
000 30 562 059 13 833
000 32 700
000 141 215
059
Average amount received per project (R) 2 133 333 3 883 636 3 750 000 2 037 471 1 976 143 4 087 500 2 941 980
Maximum amount per project (R) 3 200 000 9 000 000 10 000
000 7 500 000 3 600 000 16 000
000 16 000 000
13
3.7.3 Management and expenditure of RECAP project funds
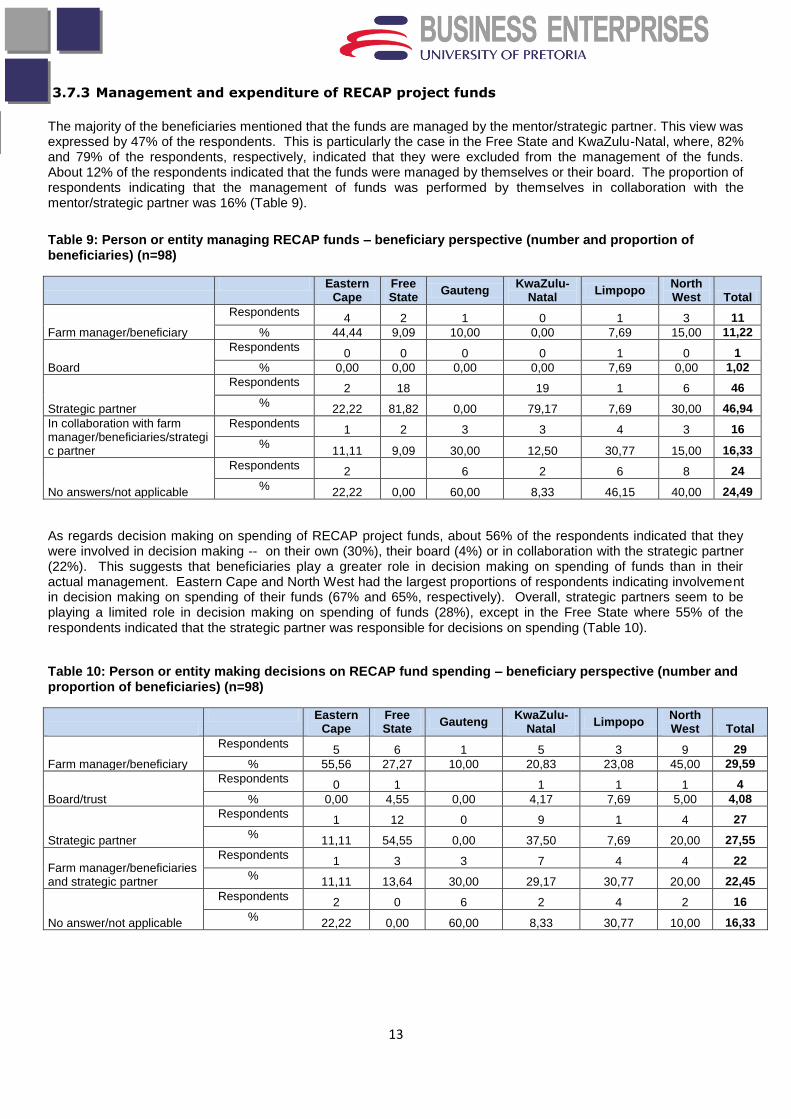
The majority of the beneficiaries mentioned that the funds are managed by the mentor/strategic partner. This view was expressed by 47% of the respondents. This is particularly the case in the Free State and KwaZulu-Natal, where, 82% and 79% of the respondents, respectively, indicated that they were excluded from the management of the funds. About 12% of the respondents indicated that the funds were managed by themselves or their board. The proportion of respondents indicating that the management of funds was performed by themselves in collaboration with the mentor/strategic partner was 16% (Table 9).
Table 9: Person or entity managing RECAP funds – beneficiary perspective (number and proportion of beneficiaries) (n=98)
Eastern
Cape Free State
Gauteng KwaZulu-
Natal Limpopo
North West Total
Farm manager/beneficiary
Respondents 4 2 1 0 1 3 11
% 44,44 9,09 10,00 0,00 7,69 15,00 11,22
Board
Respondents 0 0 0 0 1 0 1
% 0,00 0,00 0,00 0,00 7,69 0,00 1,02
Strategic partner
Respondents 2 18
19 1 6 46
% 22,22 81,82 0,00 79,17 7,69 30,00 46,94
In collaboration with farm manager/beneficiaries/strategic partner
Respondents 1 2 3 3 4 3 16
% 11,11 9,09 30,00 12,50 30,77 15,00 16,33
No answers/not applicable
Respondents 2
6 2 6 8 24
% 22,22 0,00 60,00 8,33 46,15 40,00 24,49
As regards decision making on spending of RECAP project funds, about 56% of the respondents indicated that they were involved in decision making -- on their own (30%), their board (4%) or in collaboration with the strategic partner (22%). This suggests that beneficiaries play a greater role in decision making on spending of funds than in their actual management. Eastern Cape and North West had the largest proportions of respondents indicating involvement in decision making on spending of their funds (67% and 65%, respectively). Overall, strategic partners seem to be playing a limited role in decision making on spending of funds (28%), except in the Free State where 55% of the respondents indicated that the strategic partner was responsible for decisions on spending (Table 10).
Table 10: Person or entity making decisions on RECAP fund spending – beneficiary perspective (number and proportion of beneficiaries) (n=98)
Eastern
Cape Free State
Gauteng KwaZulu-
Natal Limpopo
North West Total
Farm manager/beneficiary
Respondents 5 6 1 5 3 9 29
% 55,56 27,27 10,00 20,83 23,08 45,00 29,59
Board/trust
Respondents 0 1
1 1 1 4
% 0,00 4,55 0,00 4,17 7,69 5,00 4,08
Strategic partner
Respondents 1 12 0 9 1 4 27
% 11,11 54,55 0,00 37,50 7,69 20,00 27,55
Farm manager/beneficiaries and strategic partner
Respondents 1 3 3 7 4 4 22
% 11,11 13,64 30,00 29,17 30,77 20,00 22,45
No answer/not applicable
Respondents 2 0 6 2 4 2 16
% 22,22 0,00 60,00 8,33 30,77 10,00 16,33

14
3.7.4 Timing of project fund allocation in relation to farming operations
The administrative process of RECAP regarding allocation of funds to projects is described as rather lengthy and non-transparent. This has resulted in long delays in undertaking important farming operations and, in some cases, abandonment of projects.
Only 22% of the beneficiaries considered the arrival of funds as timely, in relation to the timing of agricultural activities (Table 11). The back and forth process between the beneficiaries and DRDLR leads, on average, to a time lapse of 5.4 months between the time the agreement between the beneficiaries and DRDLR was signed and the disbursement of funds. This time lapse between disbursement of funds and the start of the farming cycle is seven months. The longer time lapse between disbursement of funds and the start of the farming activities results mainly from the fact that funds arrive out-of-season. This often necessitates waiting for the next season before the funds can be spent (e.g. dryland farming). These delays occur in all the provinces, with the Free State doing slightly better.
Table 11: Timely arrival of funds according to business plan/farming activities (n=98)
Eastern Cape Free State Gauteng KwaZulu-Natal Limpopo North West Total
Proportion of respondents receiving funds on time (%)
33,33 33,33 0,00 15,00 12,50 33,33 22,03
Time lapse between agreement and disbursement (months)
5,60 4,33 2,00 7,43 6,56 3,50 5,42
Time lapse between disbursement and agricultural activities (months)
7,00 3,33 5,75 8,54 6,71 6,50 6,95
The longest delay occurred in KwaZulu-Natal and Limpopo. This is largely attributable to a lack of budget for the number of RECAP projects to be serviced. Indeed, particularly in Limpopo, several projects were assessed which had their business plans approved, but which never received the planned funding. The reason given to the potential beneficiaries relates to the lack of funding available to RECAP for a particular financial year. The potential beneficiaries are then requested to wait until the following financial year. In the process, they are often also required to lower their financial requests in the business plan, jeopardizing the economic and financial feasibility of the project.
In one case assessed in Limpopo, after being retransferred a second time to the next financial year, the beneficiary pulled out. The project is now being re-advertised. The farmer noted that after two years and three different business plans (with the requested amount decreasing significantly from R1.5 million to R875 000), he got not only frustrated with the process, but more importantly questioned the feasibility and legitimacy of the RECAP as he started investing in the infrastructure needed, using his own funds. He did this without getting reassurance from the DRDLR that his lease would be renewed or that he would be reimbursed if it was not.
3.8 Impact on RECAP objectives
This section provides an indication of whether RECAP is meeting its various objectives, namely, to increase agricultural production, guarantee food security, graduating small farmers into commercial farmers and creating employment within the agricultural sector.
Prior to addressing the question of whether RECAP is meeting its stated objectives, it is worth examining the objectives themselves. We are of the opinion that most of the objectives are too ambitious and secondary in nature and involve aspects that are normally outside the control of the programme. The overall objective of RECAP should have been stated simply as “to help distressed or financially struggling land reform farms to reach their full production capacity and become commercially viable”. This objective should be pursued in a manner that ensures that the projects contribute to employment creation, food security and rural livelihoods.
The current RECAP objective of “graduating small farmers into commercial farmers” ignores the fact that nearly all the farms being assisted or intended to be assisted through RECAP are independent commercial farming units that used to be farmed as family farms to their fullest commercial and production potential. These farms are all of substantial sizes and are much larger than any smallholding in the former homeland areas. The challenge is thus not to graduate small scale farmers to commercial farmers but rather to “graduate” the new occupants/owners of the farms to a
15
position where they can farm independently on a commercially viable scale. Providing the necessary financial means, farming/technical and management skills are essential for this graduation process to be accomplished.
Agricultural production
Choice of enterprise
The largest RECAP investment is on field crops, which account for 55% of the disbursed funds. The predominance of field crops applies in most provinces, with the exception of Free State and Gauteng. About 91% of all RECAP investment in KwaZulu-Natal is on field crops, mainly sugar cane. In Free State, investment in cattle production exceeds crop production investments. Gauteng‟s RECAP investment is more diversified, with horticultural and piggery production being the most important ones. Poultry is also an important enterprise within RECAP (12% of total expenses), particularly in the North West Province and, to a lesser degree, in Limpopo.
The choice of enterprise in which RECAP funds are invested is questionable in some of the provinces, especially in view of the poor quality of some of the business plans. The following factors seem to be the most influential in the choice of an enterprise:
Number of projects covered by a single mentor/strategic partner. Mentors/strategic partners often prefer an enterprise within their field of expertise. Hence, such enterprises are often selected without questioning or taking into consideration the suitability of the farm or other factors, such as preferences of the beneficiaries, previous farm activities, etc.
The development process of the business plans. In cases where business plan development was outsourced to a company or done by the mentor/strategic partner, projects covered by the same entity/person will often be based on similar business plans.
Production levels before and after RECAP
A positive aspect regarding the RECAP farms covered in the six provinces is that, except for two farms (one where the beneficiary pulled out in Limpopo Province and one where the farmer is not willing to continue in North West), there are on-going productive agricultural activities on all the farms. As per the objective of RECAP, agricultural production is also the main activity focused on in the majority of the cases. This is particularly the case for the projects where the beneficiaries (or, at least, one of them) are residing on the project (i.e. 67% of the cases). The production income on the RECAP farms covered in the study is, on average, R1.45 million when all RECAP beneficiaries are considered. The average income increases to R2.05 million per project when only producing farms are considered. Gauteng farms have the lowest income of R188 120 per project overall or R268 743 when only producing farms are considered. North West has the highest income of R2.40 million per project or R3.92 million for producing farms. However, for both provinces, this relatively high average income is mainly due to two relatively bigger and well-functioning farms (one in each province). However, it is important to note that 30 out of the 98 projects (30.6%) still have an income of zero. This is largely due to the fact that the majority of these projects are in a development (growing) phase. In addition to production income, some of the farms are generating income from non-farm activities (e.g. ecotourism). About nine percent of the 98 farms included in the evaluation are engaged in on-farm non-agricultural activities from which income of R4114 per project per year is generated. Overall, agricultural production, both crop and livestock, has increased on the RECAP farms covered in the study, compared to the production levels when the farms were acquired and before RECAP was implemented. For livestock, the increase in herd size has continued after acquisition of the farms, with RECAP adding to the already increasing stock numbers (many of the beneficiaries already had livestock, mainly on communal land). Crop production, on the other hand, experienced a slow-down (a drop in some provinces, such as the Free State) soon after acquisition of the farms. This decreasing trend has been addressed through RECAP, resulting in significant increases in production in later years.
Trends in the different provinces are similar, with two exceptions. Firstly, regarding livestock, the Free State shows a more pronounced increase. This is related to the emphasis being put in this province on livestock (which added to the beneficiaries‟ already existing livestock herd). Secondly, regarding crop production, it is KwaZulu-Natal that shows a continuous growth (without a slow-down or a drop as in the other provinces). This is also related to the already existing sugar cane production and the RECAP‟s emphasis on sugar cane production.

16
The above clearly suggests that both crop and livestock production increased after RECAP was implemented.
Employment (direct and indirect)
Direct - Beneficiaries
The total number of beneficiaries directly benefiting from the land reform projects that have received RECAP funding is relatively low. In total, based on the 98 projects evaluated, 670 people are benefiting from RECAP. This is less than seven direct beneficiaries per project. Out of these 670 beneficiaries, 42% are full-time and 58% are part-time. On average, per project, three beneficiaries are full-time and four are part-time. These figures do not take into consideration the dependents of these beneficiaries.
North West‟s results regarding beneficiaries are proportionally higher than the other provinces (250 beneficiaries, 12.5 beneficiaries per project on average). This is related to one project in the province. This project is a CPA and has 160 people (more than 10 times the average of all the other projects). Without this project, the total number of beneficiaries declines to 90, i.e. 4.5 per project – which is in line with the average of the other provinces.
Although the above are realistic when farm structures and populations are considered for the agricultural sector, the number of RECAP beneficiaries is relatively low. This is the case when compared to the initial benefits related to the same projects. Indeed, the projects initially benefited 1604 people, which represents, on average, 16 people per project (representing a decrease of 58%). This is mainly a consequence of the PLAS programme (to which RECAP is strongly related), that limited the number of beneficiaries (in order to increase the economic feasibility of the projects).
As mentioned previously, RECAP impacted on employment. In total 540 jobs have been created through RECAP on the projects covered in the evaluation. These are mainly part-time jobs: 111 full-time and 429 part-time jobs. This represents an increase of 53% over the previous employment figures on these farms. On average, RECAP seems to have added 4.51 jobs (1 full-time and 4 part-time) per project, increasing the number of jobs from 10.40 to 15.91, on average, per project. Although the above is a positive outcome, the numbers remain low in relation to the amounts of RECAP funding for the projects.
The increase in employment on the RECAP farms covered in the evaluation is significant in the Eastern Cape (168%) and Limpopo (234%). However, there was a slight decline in the Free State (1%). This is strongly related to the type of agricultural activity (livestock in Free State) in the different provinces. On average, RECAP farms in the Eastern Cape employ 7.5 people (comapred to 2.8 before RECAP). In Limpopo, 9.41 people are employed (compared to 2.58 before RECAP). In all provinces, the increase in the number of people employed is largely in temporary labour.
Indirect - Communities
There is a general agreement from project officers, beneficiaries, as well as DRDLR provincial leadership that, although to a lesser extent, RECAP has created jobs in the beneficiary communities. In Gauteng Province, 40% of the project officers are of the opinion that RECAP has not contributed towards the creation of jobs in the beneficiary communities at all, whilst 60% are of the opinion that RECAP that the programme‟s contribution towards job creation has been very little to average. It has been argued that, in most cases, the beneficiaries prefer to hire foreigners to work on their farms. All project officers believe that the jobs created are not sustainable. The provincial leadership in Gauteng Province is, however, of the view that, in some cases, beneficiaries are employing people from their own communities, although they are not sure of the sustainability of these jobs as the programme is still in its early stages. They also believe that some indirect jobs have been created in the beneficiary communities, especially during construction phases and the harvesting season.
The mentors also believe that some jobs have been created in the beneficiary communities. One mentor claimed to have assisted beneficiaries to create 40 permanent jobs and 100 seasonal jobs in the seven projects he was responsible for.
All project officers in Limpopo Province share the view that RECAP projects are creating jobs to a limited extent, if any, in the beneficiary communities, with very few of them being permanent.
Provincial government officials share the same opinion that RECAP has created jobs in the beneficiary communities and some indirect jobs have being created as well in the form of bakkie trade, spaza shops and fruit stalls. They, however, do contend that very few of these jobs are sustainable as they tend to be seasonal in nature, mainly linked to harvesting seasons.

17
Similarly, the mentors in Limpopo Province share the view that RECAP has created jobs in the beneficiary communities, and further believe that these jobs are sustainable.
There is a general consensus amongst the provincial government officials in North West Province that RECAP has
contributed directly to the creation of jobs in the beneficiary communities, although the sustainability of these jobs is
questionable. This is due to the seasonal and contractual nature of some of these jobs.
Commercialisation
The assessment of RECAP‟s impact on commercialisation relies heavily on the views expressed by the various stakeholders to determine progress towards achieving the RECAP objective of graduating small-scale farmers to commercial farmers. The views are outlined below by province. Other aspects of commercialisation, such market access are analysed in the section on Economic and Social Impact of RECAP.
According to provincial government officials and strategic partners in the Free State, small-scale farmers are on the way to becoming commercial farmers as they have economic units running, making profits, employing and paying taxes. Out of seven farmers under Bloemfontein Abattoir, four could be classified as commercial farmers and the strategic partner was confident that five small-scale farmers would be commercial meat farmers by the end of the five-year RECAP cycle. Some of the small-scale farmers were winning trophies within their categories, suggesting that they will soon become established commercial farmers.
Provincial government officials in Gauteng generally share the view that RECAP has not yet produced a commercial farmer. They also agree that there is little or no collaboration at all between beneficiaries and established farmers as the beneficiaries are keeping to their mentors only. There is also agreement that beneficiaries have very little access to markets, if any, for their products to be integrated into the value chain.
The opinion of mentors in Gauteng Province is that RECAP has succeeded in graduating beneficiaries into commercial farmers, and that linkages with markets have been established. Apart from the fact that there were no value-adding activities on the projects, no challenges have been faced with regards to the marketing of products.
Provincial government officials in Limpopo agree that RECAP has not as yet graduated any beneficiaries to commercial farmers, although progress is being made in that regard. They also agree that the level of collaboration with established farmers is still low. The beneficiaries interviewed indicated that there was virtually no collaboration with established commercial farmers as they were interacting only with their mentors.
Mentors were evenly divided on the issue of whether RECAP was on track to helping beneficiaries to graduate into commercial farmers. Half of them were of the opinion that there has not been any progress towards achieving this goal, whereas the other half were of the view that there has been some progress. The fact that one of the RECAP farms, Kopano Disabled Project, won the prize for the best operated farm in Limpopo Province was cited as a case in point. All mentors in Limpopo Province were linked to the markets and were also not facing any challenges with regards to marketing of produce from RECAP farms. However, there were no value-adding activities on the projects.
Food security
This section outlines the views of RECAP stakeholders on the impact of RECAP on food security. Some further analysis of the impact of RECAP on food security based on interviews with project managers (beneficiaries) is presented under the section Economic and Social Impact below.
The farmers in the Free State are contributing to the food chain through increased production (availability). Salaried employments on the farms and economic empowerment of beneficiaries have all contributed to food security.
In Gauteng Province, 80% of project officers feel that RECAP has improved food security for the beneficiaries and 40% of them believe that food variety has increased within the beneficiary communities. Food security is considered to have improved in terms of access, availability and utilization.
Provincial government officials in Gauteng were however of the opinion that it was still too early to provide an informed observation of RECAP impact on food security, both in terms of access, availability as well as food variety. The mentorship did however had the opinion that food security as well as variety has improved through RECAP.
The view that food security has been improved through RECAP has also been echoed by mentors in Limpopo who also share that food variety has increased as well.

18
Provincial government officials in Limpopo also felt that RECAP has done well in terms of food security with special reference to access to food availability, utilization and food variety as beneficiaries are now producing a wider range of crops or products than before. They are also of the opinion that food variety has also improved in the beneficiary communities due to the increase in the bakkie trade.
Economic and social impact
Market access
Of the 98 farmers interviewed, 39% indicated that their access to markets (output and inputs) improved after RECAP. This represents 47% of all farmers benefiting in one way or another from RECAP. The proportion of farmers indicating that market access improved after RECAP varied between zero in Gauteng and 70% in KwaZulu-Natal.
Employment creation (includes direct beneficiaries and employment creation)
About 43% of all respondents indicated that employment on the farms increased due to RECAP. This is equivalent to 58% of all farmers who have benefited from RECAP. The proportion of beneficiaries indicating that employment on the farms increased after RECAP varied from 20% in Gauteng to 67% in Eastern Cape. Free State and Gauteng had the lowest proportion of farmers indicating an increase in employment due to RECAP (32% and 20%, respectively). When considering the proportion of all farmers who benefited from RECAP, Free State had the lowest proportion of only 33%.
Skills transfer
About 34% of all farmers interviewed indicated that they had benefited from RECAP through skills transfer. This represents about 44% of all farmers who benefited from RECAP. These figures are the lowest of all percentages of RECAP farmers benefiting in various ways from RECAP, suggesting that RECAP has performed poorly in terms of skills transfer. This is particularly the case in Gauteng, KwaZulu-Natal and North West.
Economic situation
The proportion of all farmers interviewed and indicating an improvement in their economic situation is 57%, representing 72% of all farmers benefiting effectively from RECAP. This is the highest proportion of all percentages of farmers who indicated that they had benefited from RECAP. Therefore, RECAP‟s greatest impact seems to have been economic.
Social status
RECAP had a relatively large impact on the social status of farmers – about 55% of all farmers interviewed indicated that their social status improved due to RECAP. Of all farmers who benefited from RECAP, 70% of them indicated that they had benefited from RECAP through its impact on their social status. This is not surprising because, through the significant amount of funds injected into the projects, farmers benefit materially (e.g. acquisition of bakkies, etc.) and socially (higher status in the community).
Food security and diet
About 47% of all farmers interviewed noted that RECAP had impacted positively on their diet (mainly on the quantity, but also on the quality and diversification of their diet). This represents about 59% of all farmers who indicated that RECAP benefited them in one way or another.
3.9 Progress towards targets
Number of farms/projects targeted vs. number recapitalised
As a programme, RECAP targeted to recapitalise 1807 projects/farms nationally over a five-year period from 2010/11 to 2014/15. For this target to be achieved, this would require an average recapitalisation rate of about 201 projects per province or 41 projects per province annually over the five-year period. While the varying geographic sizes and agricultural endowments or potential of each province are appreciated, each province should have recapitalised an average of 123 projects for the period 2010/11 to 2012/13. For the six provinces included in the evaluation, this translates to a total of 738 for the period 2010/11 to 2012/13 or 984 for the period 2010/11 to 2013/14.
19
To reach the target of 1807 nationally, RECAP will need to recapitalise 1107 projects/farms for the period 2010/11 to 2012/13 or 1476 projects for the period 2011/12-2013/14. The number of recapitalised projects (461 projects, equivalent to about 62% of the target) falls short of the estimated number of projects that should have been recapitalised by 2012/13 of 738 in the six provinces to reach the target of 1807 projects.
According to the national office of DRDLR, a total of 1269 projects/farms had been recapitalised as at June 2013. An analysis of the 1269 “recapitalised projects” was conducted and the funding levels were determined. Of the 1269 “recapitalised projects” 250 had not received any RECAP funding by June 2013 other than funds for land acquisition expenditure (which cannot be described as recapitalisation funds). A further 122 projects received funding not exceeding R25000 whilst 80 projects were funded for between R25000 and R50000. A total of 59 projects were funded for amounts between R50000 and R75000, with only 44 projects funded for amounts between R75000 to and R100000. Thus, a total of 305 projects were funded for not more than R100000. Projects that have been funded for amounts between R500000 and R10 million were 370, with 18 projects funded for over R10 million.
From the list of RECAP projects provided by DRDLR, it would seem that any project that has received funding, regardless of the purpose and amount of funding is a „recapitalised‟ project. For example, many projects that are listed as RECAP projects have only received funding for land acquisition. Other farms have received amounts less than R1000 over and above land acquisition funding and they are considered to have been recapitalised.
Number of beneficiaries targeted/Number targeted for employment vs. number
reached/number employed
A major shortcoming of the RECAP programme is the lack of precise targets with regards to (i) the number of beneficiaries targeted; and (ii) the number targeted for employment. This is the case at national as well as provincial levels. This leads to the impossibility of monitoring progress or results regarding the number of beneficiaries or number of people employed in the framework of RECAP. Indeed, even if the number of beneficiaries (670 for the six provinces) and number of people employed (540 for the six provinces) are relatively low, it is not possible to relate it to a certain target or to evaluate its progress or satisfaction.
3.10 Monitoring and evaluation There was evidence of sporadic and uncoordinated monitoring of the programme in the provinces. In the Free State, systems were not in place at the time of implementation and, therefore, RECAP was implemented through trial and error. The DRDLR noted that the lessons learnt have not been incorporated into the implementation. RECAP remains understaffed and relies on the M&E unit to monitor implementation even though this unit is also understaffed throughout the provinces. In KwaZulu-Natal, the government officials were in agreement that monitoring and evaluation was not integrated in RECAP programme design, hence there is no structured monitoring and evaluation. Compliance monitoring is done by KPMG while the M&E unit (DRDLR) does the programme monitoring on monthly basis through development committees where the farmers, millers and the DRDLR meet to discuss progress and address challenges. These meetings are also forums for identifying projects that need RECAP. However the evaluation would not establish how this monitoring feeds into the national system and if the information is used to shape programming. While monthly reports are produced by regions, there is no standardised way of reporting. The provincial leadership and project officers felt that these visits by KPMG and the M&E unit fall short as the information is not used to shape the programme. In addition, they can‟t action whenever they find other issues on the farms that need urgent follow-up (e.g. legal issues). The strategic partners are also not monitored and, hence, farmers are left at their mercy. There are no means of enforcing grant conditions. In one instance, the strategic partner transferred R1 million into the joint account and transferred the same amount back into their own account two weeks later to invest the money without the consent of the DRDLR and beneficiaries. There are cases of intimidation from strategic partners which are not known to the DRDLR. The models of developing farmers should, therefore, be improved. There are processes being undertaken to improve monitoring and evaluation. The RECAP policy is being reviewed by the policy unit and a RECAP implementation manual is being developed.

20
4. Summary of findings, conclusions and recommendations
The evaluation is aimed at providing the Department of Rural Development and Land Reform (DRDLR) and the intended beneficiaries of the RECAP with information and recommendations on how to improve the implementation of the RECAP in line with its targets and objectives. The evaluation is supposed to address the following issues: (a) determine whether there is common understanding of RECAP among all stakeholders; (b) establish whether RECAP is designed appropriately to achieve its objectives; (c) determine whether the RECAP project cycle is aligned to farming operations; (d) assess the effectiveness of strategic interventions in developing RECAP projects; (e) determine whether RECAP is effectively developing the intended beneficiaries to participate in commercial production; (f) establish whether RECAP is reaching its targeted beneficiaries; (g) determine whether RECAP is achieving or likely to achieve its intended objectives; (h) determine whether resources are used efficiently; (i) identify RECAP‟s strengths and weaknesses; and (j) make recommendations to strengthen RECAP.
4.1 Common understanding of RECAP
There are varying degrees of understanding among RECAP stakeholders of what RECAP is all about. RECAP stakeholders do not have a common understanding of the nature, operation and purpose of the programme. Of all the components of RECAP, the funding component of is emphasised most by most stakeholders. For example, beneficiaries associate RECAP with funding/capital to be injected into struggling farms to revitalise them. The other components of RECAP dealing with capacity building and establishing market linkages do not seem to receive much attention. Even among government officials, there seems to be no common understanding of RECAP, its objectives and operation. The understanding of RECAP does not only differ between national and provincial officials but also between officials within provinces. Some government officials attribute the lack of common understanding to the „ever-changing‟ RECAP policy and procedures. Other government officials do not understand RECAP largely due to their lack of interest in the programme as they consider it to be an added responsibility. Of utmost importance is the absence of clear definitions of key concepts used in RECAP, which has contributed greatly to the lack of common understanding of RECAP. Concepts such as „recapitalisation‟, „development‟, „distressed farm‟, are used in official documents without any explanation of their meanings. This does not only lead to possible misinterpretation of the meanings of these key terms but also makes it difficult to measure any progress achieved. This problem is exacerbated by the absence of clearly defined programme milestones/targets (w.r.t. skills transfer, number of jobs created, etc.).
4.2 Appropriateness of RECAP design
RECAP is not appropriately designed to achieve its intended objectives.
Objectives are too ambitious, with most of them not directly linked to the programme design and purpose. For example, one of the objectives of RECAP is to “guarantee food security”. This cannot be achieved through RECAP alone and, therefore, should not be made a specific objective of the programme. Another objective of RECAP is to “establish rural development monitors”. The relevance of this „objective‟ to the purpose of RECAP is unclear.
There are no clear selection criteria for projects and beneficiaries.
This leads to a questionable selection of farms and beneficiaries for participation in RECAP.
RECAP lacks a clear and structured programme monitoring and evaluation system.
Hence, monitoring and evaluation of projects, in cases where it is undertaken, does not happen in an orderly and coordinated fashion. Furthermore, monitoring and evaluation of projects is not undertaken on a regular basis.
RECAP does not have a well-defined organisational structure, both at national and provincial levels, with the necessary level of authority and staff to ensure effective execution of its mandate.

21
The absence of an organisational structure is one of the reasons RECAP does not have its own full-time staff. There is a general shortage of RECAP staff fully dedicated to the programme across all provinces. The majority of RECAP-related staff, especially at the project officers‟ level, are not suitably qualified. In nearly all the provinces, most of the staff perform their RECAP duties over and above the other duties in their permanent/full-time positions. Hence, RECAP is considered as an additional responsibility.
The RECAP funding model is a one-size-fits-all and does not take into consideration the varying characteristics of farm enterprises and agro-ecological contexts
RECAP funding is based on the sole financial model of a multi-year injection of capital. Although such models might be relevant for certain farm enterprises (for example, crop farming, where a continuous growth pattern is advisable), they might not be adapted to others (e.g. poultry houses, where reaching a certain threshold once-off is necessary for the sustainability of the project).
The requirement for farmers to have a strategic partner/mentor to qualify for RECAP support, regardless of their farming background, leads to wastage of valuable resources, in some instances.
Some of the farmers whose farms were recapitalised had the necessary skills and experience to run their farms without the strategic partners/mentors. However, because it is a requirement for RECAP support to have a strategic partner/mentor, a strategic partner/mentor may be paid for services that are neither rendered nor needed on the farm.
The RECAP grant funding approach is not sustainable in view of limited resources.
The RECAP grant funding approach requires limited commitment from the farmers/beneficiaries in terms of additional investment and creates some form of dependency on state funding, which is an unintended objective of the programme. The programme encourages an entitlement mentality on the part of the beneficiaries. Hence, in some cases, budgets are inflated by strategic partners/mentors and beneficiaries in the development of business plans.
The RECAP design does not promote collaboration with the Department of Agriculture, Forestry and Fisheries in the implementation of the programme.
RECAP ventures directly into the domain of agricultural support and one would have expected closer collaboration between the two departments (i.e. DRDLR and Agriculture) in the implementation of the programme. Such collaboration is important especially when it is considered that it is the failure of agricultural support programmes that has contributed to many of the land reform projects being in distress.
The RECAP design promotes centralisation of decision making with respect to approval of funding applications. The absence of delegation of authority to the provinces to approve funding applications leads to delays in approval of funding applications and disbursements of funds, resulting in loss of production on the farms.
4.3 Alignment of RECAP project cycle to farming operations
The RECAP project cycle is not aligned to the farming operations.
Beneficiaries have indicated that the approval process for RECAP funding is lengthy and bureaucratic. Furthermore, the average time between funding approval and disbursement of funds was more than five months. This has resulted in delays in undertaking farm operations and, in some cases, abandonment of projects. Often, funding for projects is approved but the actual disbursement of funds is delayed by one or more years due budget constraints. Although all provinces are affected by this, the problem was more serious in Limpopo.

22
4.4 Effectiveness of strategic interventions
The strategic interventions are not resulting in a broad-based capacitation of the beneficiaries/farmers.
Overall, RECAP effectiveness in capacitating the farmers/beneficiaries is not satisfactory, with different results for the different capacitating roles
Overall, RECAP effectiveness in capacitating the farmers/beneficiaries is estimated at 67%. A breakdown of RECAP effectiveness in terms of specific capacity building activities is as follows: Technical expertise (66%), farm management (71%), funding (76%), output markets (88%), input markets (62%), and other tasks, such as monitoring, etc. (25%). The evaluation of the effectiveness of RECAP and the strategic partners and mentors with regard to specific capacitating roles is least positive in providing input markets.
The strategic interventions of partnership and mentorship are not equally effective in all projects and provinces.
In some projects and provinces, the interventions seem to work well while in others there are serious problems between beneficiaries and strategic partners/mentors. The transfer of technical and management skills does not seem to be proceeding as planned.
RECAP lacks a well-defined and dedicated training and skills transfer plan with a well-defined budget.
The lack of a well-defined and dedicated training and skills transfer plan with a well-defined budget has hampered efforts to transfer skills to beneficiaries. The strategic partners and mentors have not been able to provide the required funding or properly identify training needs. Hence, the adoption of a haphazard and uncoordinated skills transfer approach. In addition, an assumption has been made that all strategic partners and mentors will necessarily be good trainers and this has not always been the case. In many instances, the development of entrepreneurial skills is limited because farmers have little decision making power and control over production.
In some instances, inexperienced persons are appointed as strategic partners.
Such strategic partners do not contribute to the desired capacity building of beneficiaries and, therefore, contribute to the failure of RECAP to achieve its objectives. There is an instance where a dentist without any farming background was appointed as a strategic partner.
There seems to be an assumption within RECAP that experienced commercial farmers necessarily make good managers and businessmen.
The fact that a strategic partner is an experienced commercial farmer does not necessarily mean that he will be a good manager and professionally minded person who fully understands practical farm management.
Although RECAP provides for strategic partners to contribute financial and infrastructural resources, very few strategic partners are doing so.
The limited resource contribution on the part of strategic partners may be partly attributed to a lack of built-in mechanisms to secure the investment of strategic partners in the projects/farms. The short-term nature of the lease period for the farms and uncertainty regarding compensation for possible losses due to factors beyond the strategic partner‟s control (e.g. natural disasters) discourage strategic partners from making their resource contribution.
4.5 Effectiveness of RECAP in building capacity to participate in commercial production
The effectiveness of RECAP in capacitating beneficiaries to produce for the market is limited.

23
The effectiveness of RECAP in developing beneficiaries to participate in commercial production can be assessed in terms of the number of beneficiaries/farms ready to participate or already participating in commercial production. In all provinces, there was a general consensus among government officials that, although RECAP had not yet produced commercial farmers, many of the beneficiaries were on their way to becoming commercial farmers.
4.6 Reaching of targeted beneficiaries
The issue of whether RECAP is reaching the targeted beneficiaries is complicated by lack of consensus
among government officials on the number of targeted beneficiaries in each province.
Within provinces, project officers and provincial government officials responsible for RECAP do not seem to agree on the number of projects/beneficiaries targeted for recapitalisation. This difference of opinion on the number of targeted beneficiaries also exists between provincial and national government officials. It is our view that this difference of opinion is largely attributable to the confusion around the meaning of „recapitalised‟ projects. .
RECAP design has resulted in the inclusion of beneficiaries/farms that did not really need to be assisted, partly because of lack of clarity on the selection criteria for beneficiaries/projects and possible political interference.
There were instances where it was difficult to understand how some farms came to be included in RECAP because the owners seemed to be financially strong and could afford to provide their own funds. In some provinces, it was reported that some farmers by-passed provincial government officials and contacted senior politicians to have their farms prioritised for recapitalisation.
4.7 Achievement of intended objectives
RECAP has made some progress towards achieving its intended objectives, but there is room for a significant improvement in many areas.
Market access for farmers/beneficiaries is rarely improved One of the lowest impacts assessed relates to RECAP‟s (output and input) market access facilitation. About 47% of the respondents benefiting directly from the programme (only 39% of the total number of beneficiaries interviewed) note that their market access has improved.
Employment creation, both direct and indirect, has been positive, although weak
The RECAP projects and business plans have not focused on activities and investments that are labour intensive. Employment on the farms has increased in 58% of the cases who benefited effectively from RECAP funding, representing a mere 43% of all the RECAP cases interviewed.
The input procurement processes employed by some strategic partners often do not lead to benefits for local communities and business. Inputs are often sourced from external suppliers, sometimes outside the province in which RECAP farms are located. In addition, local skills are not considered as outsiders are hired to perform simple tasks like fencing. This goes against one of the objectives of RECAP of creating employment opportunities.
Capacitation of farmers/beneficiaries remains low, as skills transfer by strategic partners is not effective. About 44% of the beneficiaries effectively benefiting from RECAP noted that the programme had positive impacts in terms of skills transfer; this represents 34% of the total RECAP cases included in this evaluation. This is the lowest impact rate assessed and is of great concern as skills transfer is one of the key elements of RECAP.
The economic situation of the farmers/beneficiaries is considered to have improved, although the improvements remain small in absolute terms. Economic impact has been rated the highest overall: About 72% of the people benefiting effectively from RECAP mentioned that their economic situation had improved. This accounts for 57% of all the respondents included in the sample.
24
The social status of farmers/beneficiaries has also improved, although its sustainability is questionable. As in the case of economic impact, the social impact of RECAP is considered to be among the greatest. About 70% of those effectively benefiting from RECAP and 55% of the total number of beneficiaries included in the evaluation stated that the programme had positive impacts on their social status. This was not unexpected as significant amounts of funds have been injected in the projects, resulting in beneficiaries directly benefiting materially (e.g. acquisition of bakkies) and socially (higher status in the community). In some cases, expenses on non-productive assets (e.g. cars) seem to have been prioritised, making the sustainability of the projects and social status of the beneficiaries questionable.
Food security of farmers/beneficiaries is considered to have improved. About 59% of those benefiting effectively from RECAP noted that RECAP had impacted on their diet (mainly on quantity, but also on the quality and diversification of their diet). However, if all beneficiaries included in the evaluation are considered, the proportion falls to 47%.
4.8 Resource use efficiency and value for money
RECAP spending per project is relatively high, questioning the financial sustainability of RECAP itself and of
its efficiency overall. As stated previously, the RECAP budget amounts to 25% of DRDLR‟s baseline land redistribution and restitution of land rights budget and was about R3.3 billion for the 2012/13 financial year. Therefore, it is worth finding out whether there is value for money. Considering the 98 projects included in the evaluation, the efficiency of the RECAP programme, measured in terms of investment expenditure against results, is low. This is the case when spending per project is considered. On average, R2.9 million is spent per project in the six provinces included in the evaluation. However, only 70% of the RECAP projects were generating income from agricultural production at the time of the evaluation, with a few of these projects not showing any potential to be sustainable.
As RECAP benefits a relatively small number of beneficiaries, spending per beneficiary and per job created is relatively high.
On average, R463 284 is spent per beneficiary or R588 284 is spent to create one job in the six provinces included in the evaluation. One of the highest expenditures is in the Free State where R1.02 million is spent per beneficiary and where RECAP spending has not been associated with the creation of a single additional full-time job.
RECAP has contributed to the achievement of objectives such as employment creation. However, the number of employment opportunities created is too small to justify the investment.
The figures reported earlier provide a partial answer to the question of whether there is value for money in RECAP. A thorough financial analysis would be required to provide a full answer. However, the absence of established and precise targets/thresholds, lack of continuous monitoring and evaluation, lack of baseline data, etc. will make it difficult to evaluate the efficiency of RECAP.
4.9 Recommendations Prior to presenting recommendations for strengthening RECAP, we wish to point out that the recommendations should be considered as a „second best solution‟. In our view, the best and lasting solution would entail a redesign and overhaul of all public agricultural support programmes and doing away with existing silos of funding agricultural support services, including post-settlement support. This would entail the establishment of an all-inclusive fund to support land acquisition, extension and mentorship, agricultural finance and market access. Implementing our proposed „best solution‟ would render RECAP and similar programmes unnecessary as they would be subsumed under a single programme for agricultural support.
The soundness of our proposal (i.e. the „best solution‟) will be appreciated if it is considered that the basis for RECAP‟s existence is the absence of alignment and coordination between agricultural support programmes and land reform processes. In an ideal situation, the provision of adequate and quality agricultural support services (inputs, finance, extension, market information, etc.) would have been in place upon the transfer of land to beneficiaries. However, because the delivery of these services has been unsatisfactory, essential agricultural support services for

25
land reform beneficiaries are not in place. Hence, the implementation of RECAP, which is essentially providing support services that should be provided by DAFF and the relevant provincial departments of agriculture.
With the realisation that the provision of adequate agricultural support services for land reform beneficiaries is not possible in the foreseeable future without programmes such as RECAP, there is justification for the programme to continue in the interim (i.e. until the best and lasting solution is found). Hence, the following recommendations are meant to strengthen RECAP whilst a lasting solution is sought:
Review the objectives of RECAP to make them more clear and specific. This should include defining the meanings of key terms used in the programme (e.g. distressed farms, recapitalisation, development, commercial farmer, etc.). (Please refer to our suggested main objective of RECAP in this report).
Ensure a common understanding of RECAP among its stakeholders by engaging in an all-inclusive process to discuss the nature, operation, purpose and objectives of the programme.
Establish a separate organisational structure for RECAP and ensure that the programme has its own full-time staff and do away with the current arrangement of seconding staff from other units of DRDLR to work for RECAP part-time. A separate organisational structure would also help to address the current problems experienced related to reporting arrangements between provincial and national RECAP offices. The lifespan of the proposed organisational structure will be dependent on how long it takes to implement the „best solution‟ proposed above.
Provide additional and appropriately qualified personnel dedicated to RECAP to improve its administrative and functional efficiency. This will address the problem of understaffing in RECAP and lack of skills, especially among project officers. Inappropriately qualified personnel could be retrained rather than replaced.
The Monitoring and Evaluation Unit of DRDLR should establish a structured and systematic monitoring and evaluation programme for RECAP. This will ensure a systematic and regular monitoring and evaluation of RECAP rather than the current uncoordinated and sporadic monitoring and evaluation of projects.
Review the proposed RECAP theory of change for future use. This should ideally be accomplished through a workshop with those who developed the theory of change.
Develop clear and specific selection criteria for beneficiaries and land reform farms for recapitalisation and development in line with the objectives of RECAP. The criteria should be developed to ensure that only deserving land reform farms and beneficiaries are selected for participation in RECAP.
Review selection criteria for strategic partners and mentors to ensure that only those that are competent and committed to RECAP objectives are selected.
The requirement to have a strategic partner or mentor to qualify for participation in RECAP should be applied selectively to exempt beneficiaries with adequate experience and capacity to manage their farms. This will require conducting skills and needs assessment to determine the readiness of beneficiaries to carry out farming activities without a mentor/strategic partner. For beneficiaries requiring the assistance of strategic partners/mentors, it is important to ensure that such assistance is not provided even after the beneficiaries have acquired the skills and experience to operate their farms successfully.
Establish delegations of authority to decentralise decision making and delegate provinces to approve applications for RECAP support within delegated amounts (e.g. R1 million per project). This may require upgrading the agricultural economics capacity of RECAP staff in the provinces. Implementation of this recommendation would help shorten the process of approving applications and disbursement of RECAP funds.
Review the funding model to make it more flexible and adjustable to the enterprise production cycle and the identified funding needs. A funding model based on phases along the value chain rather than fixed periods (e.g. years) would be more appropriate.
Replace the current RECAP grant funding with loan funding. RECAP funding should differentiate recapitalisation needs from farm development or growth needs, with a view to encourage beneficiaries to take responsibility for their enterprise/farm growth. Changing to loan funding would also increase the coverage of RECAP in terms of the number of beneficiaries assisted as the money paid back would become available for on-lending to more beneficiaries. Loan funding would also ensure proper appraisal of the farms/projects and beneficiaries, especially if the loans are channelled through a financial institution.
26
DRDLR should investigate the possibility of delegating or handing over the responsibility of handling RECAP funds to an entity that is non-bureaucratic. This is to ensure the needed flexibility, responsiveness and a business-minded approach to farm financing.
Establish guidelines to limit the amount of RECAP funding per project in order to widen the coverage of the programme and ensure that the funding model is adapted to the various agricultural production systems.
The lease period for land reform farms should be reviewed in relation to the varying characteristics of enterprises to encourage farmers and strategic partners to invest in the farm. In addition, the project cycle should depend on the condition of the farm, farm needs and type of enterprise.
Improve on the quality of business plans by preparing clear guidelines and building enough agricultural economics capacity within DRDLR with specific reference to RECAP.
Increase the focus on capacitation of beneficiaries/farmers to ensure effective skills transfer.
a. Establish a training budget, conduct training needs assessment for beneficiaries and develop a structured skills transfer programme.
b. Develop a capacity building plan to ensure empowerment of farmers/beneficiaries.
c. Establish a monitoring and evaluation system to monitor and evaluate skills transfer processes on a regular basis.
Improve coordination with the Department of Agriculture, Forestry and Fisheries with respect to the provision of technical support to beneficiaries to ensure long-term project sustainability.
Increase the focus on local development and employment creation for RECAP, in order to increase its overall intended multiplier benefits for the local community.
a. Increase the focus on activities that are labour intensive, at programme and project levels.
b. Introduce measures to encourage local sourcing of inputs for development of farm infrastructure as well as the supply of production inputs in order to maximise project benefits for the local economy.
In future, DRDLR should give greater attention to the design of an institutional framework before any programme launch. That is, appropriate programme policies, implementation manuals, organisational structures, delegations of authority, etc. should be in place before programme launch. This will ensure a smooth, effective and efficient programme implementation.
27
References
Department of Rural Development and Land Reform. 2011(a). Policy framework for Recapitalisation and Development Programme of the Department of Rural Development and Land Reform. Pretoria.
Department of Rural Development and Land Reform. 2011(b). Unpublished documents. Pretoria. Department of Rural Development and Land Reform. 2012(a). Guidelines for implementation of Recapitalisation and Development Programme. Pretoria.
Department of Rural Development and Land Reform. 2012(b). Mid-term review of the Department of Rural Development and Land Reform. Pretoria.
Department of Rural Development and Land Reform. 2013(a). Policy for the Recapitalisation and Development Programme of the Department of Rural Development and Land Reform. Pretoria.
Department of Rural Development and Land Reform. 2013(b). Unpublished documents. Pretoria.