IMPLEMEMENTATION OF THE AGENDA 2030 FOR … · Kenya has been at the center and a top advocate of...
68
qwertylzxcvbnmrtyuiopasdfghjk lzxcvbnmqwertyuiopasdfghjklzx cvbnmqwertyuiopasdfghjklzxcvb nmqwertyuiopasdfghjklzxcvbnm qwertyuiopasdfghjklzxcvbnmqw ertyuiopasdfghjklzxcvbnmqwert yuiopasdfghjklzxcvbnmqwertyui opasdfghjklzxcvbnmqwertyuiopa sdfghjklzxcvbnmqwertyuiopasdf ghjklzxcvbnmqwertyuiopasdfghj klzxcvbnmqwertyuiopasdfghjklz xcvbnmqwertyuiopasdfghjklzxcv bnmrtyuiopasdfghjklzxcvbnmqw ertyuiopasdfghjklzxcvbnmqwert yuiopasdfghjklzxcvbnmqwertyui opasdfghjklzxcvbnmqwertyuiopa sdfghjklzxcvbnmqwertyuiopasdf IMPLEMEMENTATION OF THE AGENDA 2030 FOR SUSTAINABLE DEVELOPMENT IN KENYA June, 2017
Transcript of IMPLEMEMENTATION OF THE AGENDA 2030 FOR … · Kenya has been at the center and a top advocate of...
0
qwertylzxcvbnmrtyuiopasdfghjk
lzxcvbnmqwertyuiopasdfghjklzx
cvbnmqwertyuiopasdfghjklzxcvb
nmqwertyuiopasdfghjklzxcvbnm
qwertyuiopasdfghjklzxcvbnmqw
ertyuiopasdfghjklzxcvbnmqwert
yuiopasdfghjklzxcvbnmqwertyui
opasdfghjklzxcvbnmqwertyuiopa
sdfghjklzxcvbnmqwertyuiopasdf
ghjklzxcvbnmqwertyuiopasdfghj
klzxcvbnmqwertyuiopasdfghjklz
xcvbnmqwertyuiopasdfghjklzxcv
bnmrtyuiopasdfghjklzxcvbnmqw
ertyuiopasdfghjklzxcvbnmqwert
yuiopasdfghjklzxcvbnmqwertyui
opasdfghjklzxcvbnmqwertyuiopa
sdfghjklzxcvbnmqwertyuiopasdf
IMPLEMEMENTATION OF THE AGENDA 2030
FOR SUSTAINABLE DEVELOPMENT IN KENYA
June, 2017
1
LIST OF ACRONYMS
ASAL Arid and Semi-Arid Lands
ASTII Africa Science Innovation Indicators
ATMs Automated Teller Machines
CIDPs County Integrated Development Programme
COG Council of Governors
COTU Organization of Trade Unions
DaO Delivering as One
DLP Digital Literacy Programme
DRR Disaster Risk Reduction
EAC East Africa Community
EASA East Africa School of Aviation
ECDE Early Childhood Development Education
EDE End Drought Emergencies EmONC Emergency Obstetric and Newborn Care
FBO Faith Based Organization
FGM/C Female Genital Mutilation/Cut
FKE Federation of Kenya Employers
FPE Free Primary Education
GBV Gender Based Violence
GCAP Global Coalition for Action Against Poverty
GDP Gross Domestic Product
GER Gross Enrolment Rate
HISP Health Insurance Subsidy Programme
HSNP Hunger Safety Net Cast Transfer
ICMS Integration Custom Management System
IEC Information Education and Communication
2
JKIA Jomo Kenyatta International Airport
KALRO Kenya Agricultural and Livestock Research Organization
KAM Kenya Association of Manufacturers
KDHS Kenya Demographic and Health Survey
KENIA Kenya National Innovation Agency
KEPH Kenya Essential Package for Health
KEPSA Kenya Private Sector Alliance
KICD Kenya Institute of Curriculums Development
KNBS Kenya National Bureau of Statistics
KNCCI Kenya National Chamber of Commerce and Industry
KYEP Kenya Youth Empowerment Programme
LAPSET Lamu Port Southern Sudan - Ethiopia Transport
LLIM Long Lasting Insecticide Mosquito Nets
LTWP Late Turkana Wind Power
MDAs Ministries, Departments and Agencies
MDGs Millennium Development Goals
MoDP Ministry of Devolution and Planning
MTEF Medium Term Expenditure Framework
MTPSWGs Medium Term Sector Working Groups
MW Mega Watts
NACOSTI National Commission for Science, Technology and Innovation
NCDs Non Communicable Diseases
NCIC National Cohesion and Integration Commission
NCMM National Coordination Mechanism on Migration
NDMA National Drought Management Authority
NEPAD New Partnership for Africa Development
NER Net Enrolment Rate
NGAAF National Government Affirmative Action Fund

3
NG-CDF National Government Constituency Development Fund
NGO Non Governmental Organization
NIMES National Integrated Monitoring and Evaluation System (NIMES
NRF National Research Fund
NSI National Systems of l Innovation
NSNP National Social Safety Net Programme
NSO National Statistical Office
NTDs Neglected Tropical Diseases
NYC National Youth Council
OP-CT Older Persons Cash Transfers
OSBP One Stop Border Post
OVC-CT Orphans and Vulnerable Children Cash Transfers
PHSL Philips Health Care Services Limited
PPP Public Private Partnership
PWSD CT Persons with Severe Disability Cast Transfer
R&D Research and Development
RMNCAH Reproductive Maternal Newborn Child Adolescence Health
RTMS Real Time Monitoring System
SDGs Sustainable Development Goals
SEZ Special Economic Zone
SGR Standard Gauge Railway
SIM Sustainable Inclusive Business
SLO Sustainable Development Goals Liaison Office
STI Science Technology and Innovation
TOT Training Of Trainers
TVET Technical and Vocational Education and Training
UHC Universal Health Care
UNDP United Nation Development Programme

4
UNICEF United Nations Children's Fund
UPE Upper Primary Education
WEF Women Enterprise Fund
WHO World Health Organization
YEF Youth Enterprise Fund

1
TABLE OF CONTENTS
LIST OF ACRONYMS..................................................................................................................................... 1
1.0 OPENING STATEMENT .................................................................................................................. 3
2.0 SUMMARY ............................................................................................................................................ 5
1.0 INTRODUCTION AND BACKGROUND ..................................................................................... 8
2.0 METHODOLOGY AND PROCESS FOR PREPARATION OF THE REVIEW ............... 11
3.0 POLICY AND ENABLING ENVIRONMENT .................................................................................. 13
3.1 CREATING OWNERSHIP OF THE SUSTAINABLE DEVELOPMENT GOALS ....................................... 13
3.2 INCORPORATION OF THE SUSTAINABLE DEVELOPMENT GOALS IN NATIONAL FRAMEWORKS
16
3.4 INTEGRATION OF ECONOMIC, SOCIAL AND ENVIRONMENTAL DIMENSIONS .............................. 18
4.0 LEAVE NO ONE BEHIND ....................................................................................................................... 20
5.0 PROGRESS MADE IN THE IMPLEMENTATION OF THE SUSTAINABLE
DEVELOPMENT ............................................................................... GOALS AND TARGETS IN KENYA
22
Goal 1: End Poverty in all its Forms Everywhere .............................................................................................. 22
Goal 2: End Hunger, Achieve Food Security and Improved Nutrition and Promote Sustainable Agriculture ...... 23
Goal 3: Ensure Healthy Lives and Promote Well-being for all at all Ages ........................................................... 25 Goal 4: Ensure Inclusive and Equitable Quality Education and Promote Lifelong Learning Opportunities for all
27
Goal 5: Achieve Gender Equality and empower all Women and Girls .................................................................. 29
Goal 6: Ensure Availability and Sustainable Management of Water and Sanitation for all ............................... 31
Goal 7: Ensure Access to Affordable, Reliable, Sustainable and Modern Energy for all ...................................... 32 Goal 8: Promote Sustained, Inclusive and Sustainable Economic Growth, Full and Productive Employment and
Decent Work for all .............................................................................................................................. 33 Goal 9: Build Resilient Infrastructure, Promote Inclusive and Sustainable Industrialization and Foster Innovation
34
Goal 10: Reduce Inequalities within and among countries ..................................................................................... 36
Goal 11: Make Cities and Human Settlements Inclusive, Safe Resilient and ......................................... 36 Sustainable
36
Goal 12: Ensure Sustainable Consumption and Production Patterns ..................................................................... 37
Goal 13: Take Urgent Action to Combat Climate Change and its Impacts .............................................................. 38
Goal 14: Conserve and sustainably use the Oceans, Seas and Marine Resources for Sustainable Development ........... 39 Goal 16: Promote Peaceful and Inclusive Societies for Sustainable Development, Provide Access to Justice for all and
Build Effective, Accountable and Inclusive Institutions at all levels........................................................... 41
Goal 17: Strengthen Means of Implementation and Revitalize the Global .............................................................. 43
Partnership for Sustainable Development ............................................................................................... 43 6.0 NATIONAL MECHANISMS FOR MONITORING PROGRESS AND REPORTING ON
IMPLEMENTATION OF THE ACHIEVEMENT OF SDGS .............................................................. 45
7.0 MEANS OF IMPLEMENTATION ......................................................................................................... 45
8.0 NEXT STEPS ........................................................................................................................................... 46
9.0 CONCLUSION .......................................................................................................................................... 47
ANNEX I: SDG INDICATOR FRAMEWORK FOR KENYA ........................................................................ 48

2
ANNEX II: SDG AT A GLANCE ..................................................................................................................... 49

3
1.0 Opening Statement
Kenya has been a committed and loyal member of the United Nations. The country hosts the global headquarters of UN Environment and the UN Human Settlements Programme (UN Habitat) and continues to be a leading diplomatic and economic hub for Africa and the World. The country was at the forefront of the Millennium Campaign that sought debt forgiveness for developing countries at the dawn of the new millennium. After the adoption of the Millennium Development Goals (MDGs) the country was one of the 10 countries selected by the UN Secretary General to act as a reference for best practices. During the Millennium Development Goals (MDGs) period the country undertook a needs assessment and costing study to determine the resource requirements for the successful attainment of the goals. It consistently prepared biennial MDGs Status reports until 2016 when it produced the End Term Review of the MDGs covering the period 2000-2015. In the same period, the country created excellent collaboration networks among development stakeholders among them Civil Society Organizations and the Private Sector which contributed to the good progress made towards the achievement of the MDGs. The MDGs era has helped the country to open a new front of development cooperation where development stakeholders share a common guide and outlook. Kenya has been at the center and a top advocate of the Agenda 2030. Kenya was a member of the High Level Panel of Eminent Persons to advise the United Nations Secretary General on the global development framework beyond 2015. The Permanent Representative of Kenya to the UN Ambassador Macharia Kamau co-chaired the Open Working Group on Sustainable Development Goals(SDGs) mandated to develop a set of sustainable development goals. Towards the end of 2013 the country joined the international community in efforts to determine the global development framework that would succeed the MDGs. It carried out nationwide consultations among stakeholders culminating in the Kenya National Common Position on the Post 2015 Agenda. The Common position was shared at the regional and continental level and was integrated into the Common Africa Position for the Post 2015 Development Agenda. Therefore Kenya finds the SDGs more consultative than the previous development framework. They are more comprehensive, ambitious and with a wider reach to encompass the developed world and have assisted humanity to share in a common and collective undertaking.
Lessons learned from the MDGs implementation process in Kenya have shown that the achievement of critical objectives and challenges of the Agenda 2030 will also depend on strong local action and leadership embedded in a coordinated and effective multi-level governance system. It is therefore critical to identify various specific mechanisms, tools, and processes to effectively translate the SDGs into practices at the local level and monitor them. The Government also recognizes the role of stakeholders including but not limited NGOs, CSOs and private sector.
Since the adoption of the SDGs, Kenya has managed to make some strides to place the country on a firm path of implementation. The country developed an elaborate Road Map to guide the implementation of the SDGs and targets in the country. The Road Map offers a programmatic guide for all development stakeholders for the next three years. The MDGs End Term Report

4
covering the period 2000-2015 was undertaken which focused on assessing the progress made in achievements of the MDGs, documents the experiences, challenges and lessons learnt. This greatly provides the foundation for the implementation of the agenda 2030.
The country held a national official launch of the SDGs where all development actors came together to begin the process of domesticating the agenda 2030. In addition to the launch, the country also mapped out all SDGs targets and indicators against the mandates of the various development actors and assigned goals and targets accordingly. The government directed all Government Ministries, Department and Agencies to mainstream the SDGs into policy, planning, budgeting as well as monitoring and evaluation systems and processes. An Inter Agency Technical Committee drawing membership from the private sector, civil society, Development Partners, Faith Based Organizations and the Youth has been established. Going by the above measures, Kenya will continue to embrace the principal of ensuring no one is left behind in development while ensuring the balanced integration of all the three dimensions of sustainable development; economic, social and environmental in national policy making and planning. The country commits to continue to build a just, cohesive and peaceful society and recognizes the need for equality and equity within and among nations in order to have a fairer world. Kenya subscribes to the philosophy of peaceful cooperation and peaceful coexistence among nations. It also recommits itself to the United Nations charter and will spare no effort in its quest to attain all SDGs goals and targets as a way to improve the condition of all its people.

5
2.0 Summary
The preparation of this Voluntary Review Report was coordinated by the Ministry of Devolution and Planning, which is mandated to coordinate the implementation and monitoring of the SDGs in Kenya. The SDGs coordinating department, within the Ministry of Devolution and Planning is the focal point and was supported by the SDGs Inter-Agency Technical Committee (IATC), comprising of officers from key government Ministries, Departments, Agencies (MDAs), United Nations Agencies, Civil Society and the Private Sector. To ensure wider consultation, umbrella bodies held consultations with their members, received inputs and prepared reports which formed the basis of this report. The report benefited from internal reviews from the Ministry of Devolution and Planning and subjected to stakeholder validation. The 2030 Agenda finds Kenya at vantage point as it builds on the lessons learnt and foundations laid by the MDGs. Further to this, the agenda was adopted while Kenya is implementing its long-term economic blueprint for accelerating transformation of the country into a rapidly industrializing middle-income nation by the year 2030. A closer look indicates that the Kenya Vision 2030 is well aligned to the global development framework and its implementation is directly linked towards achieving the SDGs. The time frame of the Vision coincides with the timeframe for the SDGs. To hit the road running, the country developed the SDGs road map which spells out how stakeholder engagement, awareness creation, resource mobilization, capacity building, domestication and localization should be carried out. Towards domestication and of localization SDGs, in addition to the SDGs road map, Kenya has undertaken a number of initiatives which includes Mapping the SDGs with Vision 2030, undertaking MDGs End Term Report, setting up institutional framework, Capacity Building, Advocacy and awareness creation, mainstreaming SDGs in policy and planning and undertaken an indicator mapping among others. This has been done with engagement of the stakeholders. Kenya has also set the baseline data for most of the indicators to be between 2009 and 2014, depending on the frequency of data collection. However, inadequate baseline data on some of the indicators has proved a challenge in measuring progress on implementation of the SDGs.
Since the adoption of the SDGs, Kenya has made progress in the implementation of the SDGs. From January 2016, Kenya has realized several milestones towards ending hunger and poverty in all its forms. Poverty levels in Kenya is currently 45.2 percent and several poverty alleviation initiatives are being undertaken and therefore the rate is likely to have dropped when the next estimation is conducted. Ensuring healthy lives and wellbeing for all at all ages is one of the goals that form part of the unfinished business of the MDGs. The three key indicators, Maternal Mortality Rate, Infant Mortality Rate and Neonatal Mortality Rate have remained off track. To assist in tracking these targets, new innovative initiatives approaches such as Beyond Zero campaign and the new equipment leasing strategy, mother waiting homes and commodity exchange programmes among others are being undertaken and are expected to increase the capabilities of public hospitals to reduce the rates of mortality. In the education sector, Kenya has embarked on the embracing various policies, strategies, guidelines and programmes geared towards the goal which has resulted in commendable progress in a number of areas. The primary schools enrolment and completion rate has

6
increased and the transition rate from primary to secondary schools has also gone up. The government has recognized that women empowerment is critical in effectively combating poverty, hunger and disease in the country and also a way to stimulate development and achievement of the other SDGs In pursuit of this goal, the government has undertaken initiatives aimed at promoting gender equality and empowerment of women with the aim of ensuring equal access, control and resource distribution to improve livelihood for the marginalized categories of people, including women, people with disability (PWDs) and other vulnerable groups. In Kenya access to safe, adequate and reliable water supply is one of the central indicators of socio-economic development. The percentage of population using safely managed drinking water services was 66.9 percent as at 2014 which implies that a large proportion of Kenya’s have no access to sources of drinking water which are safe and reliable. Some of the initiatives in this area include construction and expansion of water supply schemes in urban and rural areas and; devolution of water provision services to the county government to improve on efficiency and effectiveness. The Nairobi Water and Sewerage Company has installed water ATMs enabling city residents living in informal settlements to access quality water cheaply. The ATMs use AQtap technology and the residents pay for water using mobile technology. This has reduced the cost of water to the community as well as improved revenue collection by the company. Development of the energy sector is critical if Kenya is to achieve the Kenya Vision 2030 and become a newly industrializing, middle income country. Kenya is building the largest wind farm in Africa, the Lake Turkana Wind Power Consortium (LTWP). It aims to provide 300 MW of low-cost electrical power. Kenya recognizes the critical role of infrastructure, industrialization and innovation in the achievement of the Kenya vision 2030. To enhance connectivity, trade and security in South Sudan and Ethiopia, Kenya is currently developing the northern trade route. The Lamu Port South Sudan Ethiopia Transport (LAPSSET) Corridor Project is the largest integrated transformative infrastructure project in Africa. The Project aims at opening up northern Kenya and providing a reliable transport corridor to Ethiopia, South Sudan and to some extent Uganda The acreage under Government forest plantation expanded slightly while the total mineral output increased by 9.5 per cent in 2016. On building resilient infrastructure to promote inclusive and sustainable industrialization, passenger and freight volumes have continued to increase since 2014. Likewise the proportion of population covered by mobile network has continued to increase and is among the highest in the developing world. Kenya has also been active at the regional level to address the SDGs. Kenya has participated in Somalia Peace Keeping Missions; signed treaties on cultural exchange programmes with 51 countries hosting Kenya Missions and is the chair of Inter-Country Quality Nodes on peace education in Africa Lessons learnt from MDGs implementation have shown that strong partnerships and collaboration amongst stakeholders are critical in the successful implementation of the SDGs.

7
Given the universality of the SDGs all relevant stakeholders will be involved in the implementation of the SDGs at the national and county levels in Kenya. One important step that we have undertaken is the mapping of all relevant stakeholders who will be involved in the implementation of the SDGs. This has proved important in translating 17 SDGs into action. In the process of implementing the goals, Kenya faces a number of challenges which include inadequate disaggregated data, high stakeholder expectations and inadequate funding for SDGs. Moving forward, a number of activities will be undertaken including intensified awareness creation and capacity building, Mainstreaming of SDGs into the third MTP (MTP III), second generation County Integrated Development Plans and public institutions strategic plans; Review the National Statistical System (NSS) in light of the SDGs, Enhancing multi- stakeholder participation in the SDGs process and enhanced Resource mobilization In conclusion, building on the gains of the MDGs period, the lessons learnt and the experience gained over the time, there is renewed confidence among stakeholders and citizens on the preparedness of the country to tackle the SDGs. The overwhelming interest by the Private Sector has given a shot in the arm to the SDGs campaign and put the country firmly on track to attain the targets and the indicators.

8
1.0 INTRODUCTION AND BACKGROUND In September 2015, at the United Nations General Assembly (UNGA) Sustainable Development Summit, member states adopted the 2030 Agenda including 17 SDGs and 169 targets. These SDGs redefine international development cooperation for the next 15 years, beginning 1st January 2016. The SDGs are action oriented, global in nature and universally applicable. They take into account different national realities, capacities and levels of development and respect for national policies and priorities. They build on the lessons learnt and foundations laid by the MDGs, seek to complete the unfinished business of the MDGs, and respond to new and emerging development challenges. The SDGs and targets integrate economic, social and environmental aspects and recognize their inter-linkages in achieving sustainable development in all its dimensions. Kenya being a member of the United Nations participated in the SDGs processes at national, regional and global levels including during the adoption of the SDGs agenda. Since adoption of the Agenda 2030, the Kenya Government, non-state actors and development partners have committed to the implementation, monitoring and evaluation of the agenda. The agenda was adopted when Kenya was already implementing its long term Economic blueprint for accelerating transformation of the country into a rapidly industrializing middle income nation by the year 2030. The Vision comprising of three key pillars; Economic, Social and Political provides the frameworks for the integration of the three dimensions of sustainable development. The Economic Pillar aims to achieve and sustain an average economic growth rate of 10 percent per annum until 2030. The Social Pillar seeks to build a just and cohesive society with social equity in a clean and secure environment. The Political Pillar aims to realize a democratic political system founded on issue-based politics that respects the rule of law, and protects the rights and freedoms of every individual in Kenyan society. The Pillars are anchored on enablers and macro or the foundations. The enablers consist of Infrastructure; Information and Communications Technology (ICT); Science, Technology and Innovation (STI); Land Reforms; Public Sector Reforms; Labour and Employment; National Values and Ethics; Ending Drought Emergencies (EDE); Security; Peace Building and Conflict Resolution. The Vision outlines flagship projects in each sector. To enhance value addition and move the economy along the value chain, as outlined in the Vision 2030, Kenya is focusing on the following seven key sectors with potential to deliver 10% economic growth per annum: Tourism; Agriculture (Agro-processing); Wholesale & Retail trade; Manufacturing; IT enabled services/Business Process Outsourcing; Financial Services and Oil, Gas & Mineral resources. For social development and to meet the basic needs of its people Kenya is investing in its people by undertaking transformation in 6 key social sectors: Education and Training; Health; Water and Sanitation; Environment; Housing and Urbanization; Gender, Youth and Vulnerable groups while Political Pillar is focussed on Moving to the Future as one Nation.
To start the implementation of the SDGs in Kenya, it was found necessary to establish the extent to which the SDGs converge with Kenya’s own development objectives as set out in the
9
Kenya Vision 2030 and therefore identify which SDGs that are relevant to Kenya’s development context. This was done by mapping each of the 17 goals with Vision 2030 within the second Medium Term Plan. The mapping indicates that the Kenya Vision 2030 is well aligned to the global development framework and its implementation is directly linked towards achieving both Vision 2030 and SDGs and is indeed a progressive process with goals and milestones that will be achieved over time.
The time-frame of the Vision coincides with the timeframe for the SDGs. This is an opportunity for Kenya as progress towards the national priorities as spelt out in the Vision could be matched with progress towards the SDGs. The vision is implemented at both the national and county levels through a five year Medium Term Plan and County Integrated Development Plans respectively. The SDGs will be mainstreamed at these two levels. As a way forward, Kenya has aligned itself to the global development agenda. It is notable that there is already a commitment to sustainable development in Kenya from various stakeholders which makes this alignment relatively easier. For success, the country will go beyond the current sectoral approach to development and follow an integrated approach, and also ensure that local-national linkages are harmonized to ensure that the SDGs are operationalized at all levels.
The outcome document of the United Nations Summit for the Sustainable development (paragraph 79) encourages member states to “conduct regular and inclusive reviews of progress at the national and sub-national levels which are country-led and country-driven. Such reviews should draw on contributions from indigenous people, civil society, the private sector and other stakeholders, in line with national circumstances, policies and priorities”. The objectives of these reviews are to facilitate the sharing of experiences, successes, challenges and lessons learned, with a view to accelerating the implementation of the 2030 Agenda; strengthen policies and institutions of governments; and mobilize multi-stakeholder support and partnerships for the implementation of the Sustainable Development Goals.
These reviews provide an opportunity for countries to assess the progress they have made in the implementation of the Sustainable Development Goals within their jurisdiction for purpose of continued policy planning and implementation. In so doing, countries will be in a position to better understand the problems and shortcomings encountered in the realization of agenda 2030.
Kenya has volunteered to participate in the 2017 High Level Political Forum and present its Voluntary National Reviews (VNRs) in order to share Kenya’s experience in the implementation of the SDGs two years after adoption. The objectives of this review are; share experiences in the transition from the MDGs to SDGs, to review progress and status on SDGs implementation; highlight progress and initiatives related to eradicating poverty and promoting prosperity to ensure no one is left behind;; identify best practices, lessons learnt, emerging issues and areas that would need support in the implementation of the SDGs; identify challenges and actions being undertaken to address the gaps and challenges.
The report has addressed the main components of the Secretary-General’s proposed voluntary common reporting guidelines while at the same time adapting them according to our national preferences and to the early stage of implementation of the 2030 Agenda. It is organized into

10
the following sections. Section II present the methodology that was used to prepare the report Section III discusses the enabling environment covering the actions taken to create ownership of the SDGs, incorporation of the SDGs into our planning frameworks, and the institutional framework for domestication of the SDGs. The initiatives in place targeting the poor and vulnerable are covered in section IV The progress in the implementation of the SDGs is covered in section V while section VI cover highlights the monitoring and evaluation mechanisms. Section VII highlights key challenges and finally the next steps are covered in section VIII. The last part of the report is the annex.
11
2.0 METHODOLOGY AND PROCESS FOR PREPARATION OF THE REVIEW The coordination of the review was done by the Ministry of Devolution and Planning which is mandated to coordinate the implementation and monitoring of the SDGs in Kenya. The SDGs Coordination Department within the Ministry of Devolution is the focal point and was supported by an Inter-Agency Technical Committee (IATC), comprising of officers from key government Ministries, Departments, Agencies (MDAs, civil society organizations and private sector. The review mainly covers the early action undertaken to domesticate the SDGs, progress made in the implementation of all the 17 SDGs, challenges and the next steps. It drew heavily from inputs prepared by different stakeholders, based on their relevant goals and targets. These inputs focused on specific areas as guided by the SDGs coordinating department but not limited to;
i. The extent of ownership creation on the SDGs; ii. The extent to which Kenya’s planning frameworks have incorporated the SDGs;
iii. The level of inclusion of economic, social and environmental dimensions in SDGs implementation;
iv. Progress and status on SDGs targets and indicators; v. Best practices, lessons learned and emerging issues;
vi. Challenges facing the country in implementing the SDGs; and vii. Any other relevant information relating to SDGs
Recognizing the critical role played by the stakeholders in the SDGs process, the review was highly consultative involving government Ministries, Departments, Agencies (MDAs); county governments; development partners; Civil Society Organizations (CSOs); special groups including youth and persons with disabilities, and the private sector in order to increase ownership in the process. This involved the engagement of representatives from these stakeholders and integration of their inputs to form the Voluntary National Report (VNR) for Kenya. The inputs from these stakeholders were consolidated to produce this report. The first critical step involved the preparation of key timelines and deliverables towards the Voluntary National Report (VNR). This was followed by the preparation of data/information collection templates/tools, targeting specific stakeholders based on goals, targets and their relevance to each stakeholder. The preparation of the tools drew heavily from the Voluntary Common Reporting Guidelines, as contained in the Secretary General’s Report. This was spearheaded by an internal committee within the Ministry of Devolution and Planning. The committee comprised of three departments namely the SDGs Coordinating Department, Monitoring and Evaluation Department and Kenya National Bureau of Statistics. The tools were then shared with stakeholders with a deadline on submission. It should be noted that the entry point for the private sector, CSOs, county governments, youth and persons with disabilities was their umbrella bodies for ownership and ease of follow-up. These included Kenya Private Sector Alliance (KEPSA), SDGs Kenya Forum, the Council of Governors (CoG), National Youth Council and Association of Persons Living with Disability. The umbrella

12
bodies held consultations with their members, and prepared reports which formed the basis for this report. A drafting team comprising of the SDGs Coordinating Department, Inter Agency Technical Committee, Kenya National Bureau of Statistics (KNBS), United Nations Country Team on SDGs, representatives from the civil society, consolidated the inputs from various stakeholders to produce a first draft. The report benefited from internal reviews from the Ministry of Devolution and Planning which was later shared with stakeholders for their inputs. A validation workshop was held involving various stakeholders. All the comment received in these processes, were incorporated to form the final report. The review process was spearheaded by the government with both financial and technical support from the UN country office and civil society organizations. The UN country office collaborated with the government in organizing working retreats to prepare the report while the civil society supported the printing of the report. The following limitations were identified during review process;
i. Absence of baseline data for some of the indicators affected monitoring their progress; ii. Inadequate capacity on SDGs implementation, monitoring and reporting affected the
adequacy of stakeholder submissions; iii. Engagement of all the stakeholders in the process; and iv. Consolidation of the inputs from different stakeholders into one report
13
3.0 POLICY AND ENABLING ENVIRONMENT
3.1 Creating Ownership of the Sustainable Development Goals Kenya has been at the center of the Agenda 2030 process. Before the expiry of the MDGs period, there was considerable interest in assessing the goals and considering the future of development goals after 2015. This resulted in consultations at International, National and sub-national levels to discuss the future development framework. Kenya held consultations both national and sub-national levels which were intended to foster an inclusive multi-stakeholder process and advocate for a Post-2015 development agenda informed by national and local priorities.
The stakeholders were drawn from Government, Civil Society Organizations, Non-Governmental Organizations, private sector and academia. At the county levels the forum included opinion leaders, elected leaders, community based organizations and representatives of the private sector. Finally a national consultation forum on the Post 2015 Development Agenda was held to synthesize the various suggestions and recommendation realized from the various forums. The government through the ministry of Planning continued to hold internal consultations in order to take stock of the MDGs process create awareness on the new agenda and map out strategies on how to push the new agenda forward.
The second national conference was held in February 2015, and aimed at discussing on how to move the agenda forward. The conference involved key stakeholders that included government ministries, the private sector, parastatals, civil society organizations, academia, foundations, research institutions, development partners and various experts from different sectors The objectives of the forum was; to get a highlight of where Kenya is in the Post 2015 Development Agenda process; to share experiences in the implementation of the MDGs including lessons learnt to guide the new development agenda; and to discuss the challenges ahead as we move to the new agenda on Sustainable Development Goals. The expected outcomes included; strategies on how to move the agenda forward; and also come up with concrete actions that can be implemented. The conference came up with recommendations that included; the need to put in place a synergistic framework of means of implementation, including financing, technology and investments in sustainable development capacities. It also recommended the need for embracing a culture of shared responsibilities in order to ensure promises are turned into actions as well as having a monitoring system that include all stakeholders and which is based on enhanced statistical capacities and tapping into potential of new and non-traditional data sources.
This was followed by a CSOs forum organized by the government in September 2015. The main objective of the workshop was to share experiences on implementation of MDGs and sensitize stakeholders on the Post 2015 Development Agenda. The forum also discussed the role of stakeholders in implementation of SDGs and, financing modalities. The participants comprised Civil Society Organizations, Development Partners and Government Ministries. The forum emphasized the need to ensure that all stakeholders are sensitized using appropriate communication channels as well as ensuring involvement of the parliament. It also recommended the need to minimize time taken in publicity and awareness creation so as to leave room for interventions. These consultations culminated into a National Kenyans Position

14
on the Post 2015, which was presented to both the African Union Commission and the United Nations. In order to ensure that the 2030 agenda benefits from the experience gained during the MDGs period, the Government undertook a study covering the period 2000-2015 to assess the progress made in achievements of the MDGs, document the experiences, challenges and lessons learnt during the implementation as well as assessing the impact created since they were adopted by the Government of Kenya in 2002. In addition, the study also mapped out strategies on how best to proceed to ensure a successful implementation of the lagging MDGs and transitioning to the SDGs, including identifying risks, challenges mitigation measures and provide the foundation for the implementation of the agenda 2030. The report was disseminated to the stakeholders. Based on the recommendations of the stakeholders’ fora and the study report, the SDGs road map was prepared through a consultative process involving all key stakeholders which contributed to awareness creation. The purpose of this strategy is to identify in advance the actions that require to be undertaken to position the country to take the fastest and most reliable trajectory possible to achieve the SDGs. The road map focuses on milestones crucial to the successful take off of the SDGs and effective transition from MDGs to SDGs. The strategy focuses on the following seven broad areas that will guide the transition process in Kenya; mapping of stakeholders and establishing partnerships, advocacy and sensitization, domestication/localization, mainstreaming and accelerating implementation, resource mobilization, and capacity building. The road map has been shared with the stakeholders as it will guide them in the implementation of the SDGs. The launch of the SDGs in Kenya on 14th September 2016 was aimed at awareness creation and rallies the stakeholders behind the implementation of the agenda. The launch drew participants from all stakeholders including those from the National and devolved units. The road map has also been shared widely. Since the adoption of the SDGs, the government has placed emphasis on advocacy and awareness creation. The government has sensitized senior management in the civil service. At the same time all the six Regional Development Authorities have been sensitized on the SDGs. The expectation was that since these Authorities are based in the rural areas and therefore in close contact with the communities they will take the SDGs messages to the lower levels. The coalition of civil society on SDGs in collaboration with the government has been undertaking community outreach programmes at the community level to sensitize them on the agenda 2030. The government has also been invited to forums organized by various institutions including Universities, Faith Based Organizations and civil society organization to sensitize them on the SDGs. The government has also been producing and disseminating IEC materials on SDGs. This has been done in collaboration with UNDP country office and the civil society. There has been the operationalization of Social media communication platforms which include Facebook, Twitter, email, WhatsApp which act as means of dissemination of SDGs to the public to enhance publicity and support. This is a continuous activity.
To support the rolling out of the activities spelt out in the road map, an Inter Agency Technical Working Group was established in early 2015. This committee comprise of key

15
ministries in the implementation of the SDGs, Kenya National Bureau of Statistics and National Council for Population and Development, civil society and the private sector. The main mandates of this committee are to spearhead the implementation of the SDGs in the country and in their respective sectors; ensure that the SDGs are mainstreamed in the development planning documents and; track and report on progress on SDGs. The committee has been sensitized on the SDGs and the strategies to localize the SDGs in Kenya. The Council of Governors is also involved in capacity building of SDGs at the devolved level in collaboration with the National Government. Emphasis is given to the Training of Trainers (TOTs) who will train others in their respective institutions. As result of the importance the government is placing on the implementation of the agenda 2030, all Ministries, Department and Agencies have been directed to mainstream the SDGs into policy, planning, budgeting as well as monitoring and evaluation systems and processes. This is a demonstration of the firm commitment by the leadership of this country to sustainable development As follow up on this, the country mapped out all SDGs targets and indicators against the mandates of the MDAs and assigned the SDGs to the respective development actors. To ensure that MDAs play their respective roles, the ministry responsible for coordinating the implementation, monitoring and reporting on SDGs in the country has reviewed the 4th cycle Strategic Plan guidelines to ensure that the SDGs are mainstreamed in MDAs’ Strategic Plans. The SDGs have also been mainstreamed in the Performance Contracting and MDAs are expected to be reporting to the ministry on a quarterly basis on the progress made in the implementation of the SDGs. One of the areas to report on is the awareness creation on SDGs among their staff members as well as the stakeholders in their respective sectors.
The experience with the implementation of the MDGs in the country showed that progress in the implementation of SDGs will depend on a effective partnership for sustainable development with the active engagement of all stakeholders including governments, civil society, parliaments, the private sector, and the United Nations system among others. Therefore the government has continued to engage stakeholders in the SDGs process. The preparation of this report is a good example of how the government is engaging other stakeholders.
In addition, the country under the leadership of the Kenya National Bureau of Statistics(KNBS) has mapped out 128 indicators whose data can be available within the short run and work is going on to increase the number of indicators within the next five years. The indicators have already been discussed within the national government and plans are underway to share them with the county governments for their inputs and ownership across government. The indicators will be shared with other stakeholders before finalization. The KNBS has identified the period 2009-2014 as the base period for the SDGs. This is based on data availability and the priorities of the country. The indicators will be used to track and report on the process and progress of the implementation.
The preparation of the MTP III will be through involvement of all stakeholders who will be represented in the National MTP Coordination Forum and the Medium Term Sector Working Groups (MTPSWGs). The grassroots and County consultative forums and National Consultative fora will serve as avenues to obtain consensus on the MTP III priorities, strategies, programmes and projects. The budgeting process through the MTEF process

16
follows almost a similar pattern. The preparation of the County Integrated Development Plans is also consultative and therefore creating ownership.
3.2 Incorporation of the Sustainable Development Goals in National Frameworks
The Vision 2030 is the national long-term development policy that aims to transform Kenya into a newly industrializing, middle-income country providing a high quality of life to all its citizens in a clean and secure environment by 2030. Whereas the country prepared the Vision 2030 by 2008, it was anchored on sustainable development of the country. The vision is implemented at both the national and county levels through a five year Medium Term Plan and County Integrated Development plans respectively. The SDGs will be mainstreamed at these two levels. The first MTP was implemented between 2008 and 2012 and the second MTP is from 2013 to 2017 and the two plans mainstreamed the MDGs. The third and fourth MTPs will be implemented 2018 to 2022 and 2023 to 2028, respectively. The Medium Term Plans identify priority projects and programmes to be implemented in each five years cycle and each is expected to incorporate new and emerging issues. When Kenya embarked on the preparation of the MTPII, the Post 2015 Agenda was still under deliberation and the next goals far from being finalized. By the time the SDGs were adopted MTP II was in third year of implementation. However, the consultations that were held brought on board some of the SDGs issues that were captured in MTP II 2013-2017 as they were already a priority for the country at the time. This means that Kenya is already implementing some of the SDGs as well as continues with the unfinished business of the MDGs. This Plan is scheduled to end this year (2017) and preparations for MTP III is underway. Some of the emerging issues already identified to be taken on board are the regional and international commitments that would ensure the mainstreaming of the 2030 Agenda for Sustainable Development and Africa Agenda 2063. The National Government through consultations with the Council of Governors prepares and disseminates the guidelines for the preparation of the County Integrated Development Plans (CIDPs) which county government should follow to ensure policy and developmental coherence. The CIDPs mirror the priorities of the MTPs at the county level and therefore will ensure the SDGs and Africa Agenda 2063 re mainstreamed at the county level. With the advent of the constitution, County governments are now tackling SDGs targets at the grass root level hence more targeted interventions and strategies. These are expected to fast track the achievement of all the targets as well as reduce or eliminate existing regional disparities. The Kenya Constitution provides citizens with the right to participate in the decision-making process and further directs the national and county legislatures respectively to "facilitate public participation" in their work. Therefore the preparation of the development plans and all the strategies are guided by the Constitution and are required to be participatory by involving all stakeholders. The Medium Term Plans are prepared through consultative processes which help in ownership and awareness creation and involve the following; County consultation forums; Sector Working Groups- which consist of Ministries, Departments, Agencies, development partners, academia, women , youth, People With Disabilities, Media, private sector, and CSOs.

17
Alongside the MTPs are the Sector Plans (five year cycle) which highlights in detail programmes, projects and policies for implementation during the medium term period. One of the most effective tools in public sector delivery has been the use of Performance Contracting. Following the recent review of the performance contracting framework for Ministries, Departments and Agencies (MDAs) all public institutions are expected to mainstream SDGs into their plans, programmes and policies and consequently report to the Ministry of Devolution and Planning on progress of SDGs implementation. In the same vein the second generation Revenue Allocation Formula was reviewed to prioritize the Poverty Index among resource sharing criteria. The Equalization Fund further allocates more public resources to counties with high poverty indices as a way to fast track the reduction of poverty that is critical to the attainment of the SDGs. Other stakeholders have also integrated SDGs in their core business/mandate including leading private sector companies and Civil Society Organizations’. The private sector in Kenya is fairly well developed by Sub Saharan and regional standards and therefore has a huge potential of the realization of the global goals due to its influence on Government policy. Private sector has taken a keen interest on the implementation of the goals in the country. The United Nations Country Team has further embarked on integrating its programmmes into national priorities under the framework of Delivering as One (DAO). The mainstreaming of SDGs in policy, planning and budgeting and programmes is likely to face some challenges some of which include;
i. Inadequate linkages/coordination between the County and National governments; ii. High political turnover/ change of regimes;
iii. Poor coordination between development partners; and iv. Bureaucracies in communication and information dissemination.
3.3 Institutional Framework
The lessons learnt during the implementation of the MDGs are that successful implementation of the SDGs hinges upon a robust institutional framework with distinct but complimentary roles, responsibilities and accountability mechanisms. The selection of institutions, mandates and relationships that are tasked with coordinating, planning, implementing and monitoring actions towards the SDGs and ensuring a strong institutional framework will be critical. The increased coverage of the SDGs including new sectors and specifying the means of implementation requires new modes of institutional collaboration. The Ministry of Devolution and Planning is responsible for the overall management and coordination of the implementation, monitoring and reporting of SDGs process in Kenya. However, the day to day management and operations of the implementation process is delegated to the SDGs coordinating department which is responsible for planning and overall management of the process; reporting and accounting, monitoring and evaluation of all the SDGs activities. This arrangement is what existed during the MDGs period.

18
During the MDGs implementation, a number of institutional structures were put in place. In light of the achievements of these institutions, they will be continued and strengthened where necessary while others will be established to incorporate the broader scope of the SDGs. In particular the MDGS Project Implementation Unit was upgraded to a fully fledged Department and will continue to be the focal point for coordination of SDGs in the country. The Inter-Agency Technical Working Group that consists of officers from the key MDGs implementing Ministries is one of the partnerships arrangements that has been retained and strengthened. The committee provides strategic oversight on SDGs programme design and implementation as well as making decisions on strategic programme choices at the national level. The group is responsible for delivering specific goals and targets and is mandated to meet and agree on a coordinated delivery schedule of programmes and ensure effective implementation and reporting. It is also charged with the responsibility of ensuring that various MDAs implement the SDGs and report on the implementation progress in a timely manner. It also acts as a forum to share information where necessary. Following the Intergovernmental Relations Act 2012 and the structures created thereof, the Government will take advantage of structures that exist. The Summit and the Inter-Ministerial Forum will provide critical linkage with the County Governments. Furthermore, to ensure proper coordination and implementation of the SDGs at the national and county levels and between the two levels of Governments, the county governments have been facilitated to establish within the Secretariat of the Council of Governors a SDGs Liaison Office (SLO) which work closely with the 47 county governments and the SDGs coordination Department. The private sector SDGs Forum is being planned to bring together key stakeholders such as Kenya Private Sector Alliance (KEPSA), Kenya National Chamber of Commerce and Industry (KNCCI), Kenya Association of Manufacturers (KAM), Federation of Kenya Employers (FKE) and the Central Organization of Trade Unions (COTU) so as to have a coordinated mechanism for the private sector. The Civil Society Organizations are critical stakeholders in the SDGs. During the MDGs period they were organized under the Global Coalition for Action against Poverty (GCAP). They are now organized under the SDGs Kenya Forum, which is the national focal point for Non State actors to collaborate on the SDGs agenda. The forum is already active and is also incorporated into the Inter Agency Committee on the Sustainable Development Goals. A youth caucus is its early stages of formation and is drawing membership from the National Youth Council while a Parliamentary SDGs Caucus will also be formed after the formation of the new government. Other institutions will be set up on a need basis.
3.4 Integration of Economic, Social and Environmental Dimensions The Kenya Vision 2030 Vision comprises of three key pillars; Economic, Social and Political. Within the Economic Pillar, Kenya aims to increase annual GDP growth rates to 10% and to maintain that average till 2030. The attainment of the 10% requires macro-economic stability as well as focus on key sectors namely; tourism; value addition in agriculture; wholesaling and retail manufacturing; Business Process Off shoring, and augmentation of financial services Oil, Gas and Minerals. All of which are expected to be the drivers of economic growth

19
Under the Social Pillar, Kenya’s journey towards prosperity also involves the building of a just and cohesive society, enjoying equitable social development in a clean and secure environment. This quest is the basis for transformation in eight key social sectors; Education and Training; Health; Water and Sanitation; the Environment; Housing and Urbanization; as well as in Gender, Youth Sports and Culture, Equity and Poverty Reduction. It also makes special provisions for Kenyans with various disabilities and previously marginalized communities. These policies (and those in the Economic Pillar) will be founded on all-round adoption of Science, Technology and Innovation (STI) as an implementation tool. The National Spatial Plan 2015-2045 launched in March 2017 provides a framework to optimize the utilization of the national territory by reorganizing and adjusting the way land is used to achieve overall efficiency and sustainability. The strategy allocates land to different activities rationally by putting into consideration the land capacities and potentials and by addressing concerns arising from the need to protect and conserve the environment. To underscore the great importance of the Environmental considerations, implementation of projects and programmes can only be undertaken after Environmental Impact Assessment has been undertaken and results shared and validated. There are programmes to ensure protection and conservation of water sources and ecosystems.

20
4.0 LEAVE NO ONE BEHIND In the past there has been inordinate focus on economic growth. It was expected then that the benefits of economic growth would automatically translate into shared and equitable development for all. It is now apparent that this growth has not been inclusive and in some developing countries and regions the rapid growth has not reduced poverty and neither has it created jobs for the burgeoning youthful population. Though economic growth has been mixed in many countries especially in Africa, it is generally agreed that the benefits of this growth has not been felt in many sections of the population.
Although Kenya has experienced mixed economic growth (GDP) since 1960s ranging from as low as 1% to as high as 10%, the high growth has not translated into significant reduction in poverty especially among the poor. Many continue to be excluded from basic social and economic benefits and opportunities for sustainable livelihoods. Inequality still persists and an estimated 45.96% of the population lives below poverty line with regional disparities.
For the growth to be inclusive, there is need to provide enabling support to those who can work and develop mechanisms for supporting the vulnerable through social protection. Specific interventions, targeting the most vulnerable sectors of the population, are increasingly considered necessary complements to more traditional pro-growth policies, especially in the face of unstable global socio-economic scenarios. It is for this reason that Social Protection programmes are well articulated and incorporated in the second Medium Term Plan of Kenya Vision 2030. . The focus of the current Medium Term Development Plan (2013 -2017)) is Transforming Kenya: Pathway to devolution, socio – economic development, equity and national unity.
All the Sectors in the Social Pillar of the Plan are either directly or indirectly addressing Social Protection interventions. Addressing the inequality will require good statistical information to inform specific intervention strategies. In Kenya, social protection policy advances have in the past been accompanied by increasing investments in social protection programmes.
The primary goal of the Kenya constitution 2010 is to move Kenya towards a more equitable and inclusive future. In particular, Article 43 of the Bill of Rights guarantees all Kenyans economic, social and cultural rights including basic right to health, education, food and descent livelihoods. The constitution asserts the right of every person to social security and binds the state to provide appropriate social security to persons who are unable to support themselves and their dependents. This was the rationale for developing the Social Protection Policy; 2011.
The Policy is an important effort by the Government to reduce poverty and the vulnerability of the population to economic, social and natural shocks. It plays an important role in increasing access to social welfare services, not only for those with no predictable income but also for those in employment and the self-employed who require financial cushions against future risks such as loss of employment, injury at work, loss of assets, or sickness. It builds on Kenya’s commitment to poverty reduction as articulated in various policy documents and development plans including Kenya Vision 2030 and its first and second Medium Term Plans.
In an attempt to address the anomaly and ensure that no one is left behind, the Government has been and will continue to implement a number of social protection (SP) programmes. In Kenya, social protection interventions are implemented by different stakeholders that include Government ministries and agencies, the private sector, communities, households, and other

21
non-state actors. The Equalization Fund, which was created to correct the disadvantage of the marginalized areas, has ensured that regions with more development challenges receive more public resources as a way to move towards equality and equality. Similarly the provision of free primary school education and tuition free secondary school as well the expansion of Technical and Vocational Educational Training (TVET) institutions to the village level, the Government of Kenya endeavors to ensure that children and pupils from poor background attain a decent education and life skills that equip them to compete with those from privileged backgrounds. Other programmes include Hunger and Safety Net Programme, Women Enterprise Fund, Youth Enterprise Development Fund, UWEZO (Ability) Fund, Procurement Preferences and Reservations (30 per cent affirmative action policy for women, youth and persons with disabilities) in public procurement National Youth Services Capacity Building Initiatives and the Kenya Youth Empowerment Project (KYEP). Citizen participation is embedded in the Kenya Constitution 2010. As indicated in Article 232, participation of the public in the exercise of the powers of the state and in making decisions through indirect and direct involvement of the people in the process of policy making is now a key value and principle of the Public Service. As such citizen involvement in the prioritization, planning, ownership and, sustainability of county and national development is an imperative with no choice. Further, the Constitution in Article 201 (a) requires openness and unlimited accountability. As part of these processes the vulnerable and the poor should be fully and effectively involved in the country’s development agenda. Citizen participation is crucial in ensuring the protection of rights, transparency, accountability, equity, self-determination, influencing decision making, effective democratic citizenship and meaningful dialogue.
Kenya adopted a devolved system of government in 2010. Kenya was thus divided into 47 counties. These lower governments are now responsible for certain functions in such areas as agriculture, track regulations, health, education (nursery), and public works. Part of the national revenue is being transferred to the country governments, while certain local taxes can be collected by them. These major changes have presented numerous opportunities through its ability to catalyze local economic development and focus on public service delivery. Devolution is expected to support local economic development in the counties, which has also helped ease population pressures on the capital.

22
5.0 PROGRESS MADE IN THE IMPLEMENTATION OF THE SUSTAINABLE DEVELOPMENT GOALS AND TARGETS IN KENYA As has already been mentioned, some of the SDGs are already mainstreamed in the MTP II and the first generation County Integrated Development Plans and the remaining will be mainstreamed in the MTP III and the second generation CIDPs. Kenya has made progress in the implementation of the SDGs as indicated below,
Goal 1: End Poverty in all its Forms Everywhere Poverty is a multi-dimensional indicator of the lack of well- being, reflected in the lack of access to basic necessities such as food, clothing and shelter. With the proportion of people living below the national poverty line in 2014 estimated at 45.2% constituting 50.2% in the rural areas and 33.5% in urban area it means that about half of the country’s population in Kenya lives below the poverty line.
The agricultural sector remains important for alleviation of poverty and stimulation of economic growth and development. Therefore the battle for eradication of extreme poverty and hunger and indeed for the achievement of goal calls total transformation of the agriculture sector. The agricultural sector’s importance in poverty reduction in Kenya is as a result of the fact that about 60% of the population earns their livelihood from the sector which also contributes over 50% of the gross domestic product (GDP),about 65% of the export earnings and 18% of the formal employment(Economic survey, 2015). Efforts must also be made to ensure that its people are engaged in productive economic activities.
The Kenya National Bureau of Statistics (KNBS), has undertaken an integrated household budget survey which is expected to inform the measure of people living on less than $1.25 per day, poverty coping mechanisms, among others and which will establish the current poverty levels.
Several interventions have been undertaken towards ending poverty in all its forms in Kenya and in ending hunger, achieving food security, improving nutrition and promoting sustainable agriculture as outlined below.
The National Social Safety Net programme (NSNP) whose objective is to improve the well-being of and increase resilience among specific vulnerable groups in Kenya is one of the major government initiatives to help meet the SDGs. The programme targets the vulnerable groups who are faced with multiple challenges in their daily life such as poverty and various forms of deprivation. The NSNP comprises of four cash transfer programmes namely: Hunger Safety Net Programme Cash Transfers (HSNP-CT); Orphans and Vulnerable Children- Cash Transfers (OVC-CT), Older Persons- Cash Transfers (OP-CT) and Persons with Severe Disability- Cash Transfers (PWSD-CT). Data available show that the government’s budgetary allocation for social protection has increased over time. For example, the budget allocation for the elderly increased from Kshs. 3.2 billion ($32 million) in 2013/14 to Kshs. 5.1 billion ($51 million) in 2014/15, a 59.4 per cent increase (KNBS, 2015). In addition, direct cash disbursement to the elderly increased substantially from Kshs. 2.9 billion ($29 million) in 2013/14 to Kshs. 4.9 billion ($49 million) in 2014/15 whilst the direct cash disbursement to

23
Orphans and Vulnerable Children (OVC) increased from Kshs. 4.55 billion ($45.5 million) in 2013/14 to Kshs. 5.8 billion ($55 million) in 2014/15, a 27.5 per cent increase. The number of deaths, missing persons and persons affected by disaster per 100,000 people was 1 in 2014 and increased to 2 in 2015 before declining to 1 in 2016.
The proportion of population without access to essential services (education, health and social protection) has been declining over time. In 2014, it stood at 21.2 percent, before declining to 20.4 percent in 2015 and further to 20.2 in 2016. The proportion of total government allocation on education, health and social protection for 2016/2017 Financial year was 23.1 Per cent of total revenues
To address the plight of the less disadvantaged in society, combat poverty, and promote equity, the social protection safety net in form of cash transfers was enhanced in 2016/17 as follows: Kshs. 7.9 billion for Orphans and Vulnerable Children (OVC); Kshs. 7.3 billion for elderly persons; Kshs. 1.5 billion for those with disabilities; Kshs. 0.4 billion for street families rehabilitation; and Kshs. 0.4 billion for Children Welfare Society. Other interventions include: Equalization Fund and National Government Constituencies Development Fund (CDF). In 2016/2017 Financial year the government allocated Kshs 68.7 Billion (Usd 65Million) about 4.4% Per cent of total revenues for direct poverty reduction programmes. The country has also reviewed its legal framework to facilitate actions towards poverty reduction. For example the Sessional Paper No. 2 of 2016 on National Slum Upgrading and Prevention Policy that provide for legal and institutional framework for effective slum upgrading and prevention on a sustainable basis, adoption of the mining and mineral policy that stipulates a mineral royalty sharing regime; where 10 per cent of the revenue goes to community, 20 per cent to County Government and 70 per cent to National Government. Kenya has developed a National Disaster Reduction Strategy and Policy, and National Disaster Preparedness and Response Strategies.
Challenges
1. Inadequate investments that would translate to huge job creation. 2. Rural and urban dimensions of poverty 3. Regional disparities within the country and regions 4. Socio cultural practices that impede re-orientation of production systems
Goal 2: End Hunger, Achieve Food Security and Improved Nutrition and Promote Sustainable Agriculture
Across Kenya, households are highly dependent on buying their food and therefore market integration and food prices are key determinants of household food security. The indicator of food price anomalies was 5.66% in 2014 before decreasing to 3.5% in 2016. Rural households purchase around 76 percent of their food consumption days, while the pastoralist communities in Kenya’s poorest and most ASAL areas have to buy all commodities apart from livestock products and milk. As a result, they have high levels of low dietary diversity. Food security levels would quickly drop in the likely event of a drought that would make their animals less productive or die and in the event of food price rises.

24
Over the years, the proportion of people who suffer from hunger in the country has been fluctuating. Kenya also faces malnutrition especially in area with poor intake of adequate and nutritious food in children leading to stunting, wastage, immune-compromise, high morbidity incidences with poor health outcomes among children. Prevalence of stunting among children under 5 years of age is 26 percent down from 35.3 percent (KDHS 2008). However, there is a marked urban/rural difference whereby the prevalence rises to 29.1 percent in rural areas compared to 19.8 percent in urban areas. Prevalence of malnutrition among children under 5 is 4.1 percent, considered acceptable by WHO cut-offs, a marked improvement from 6.7 percent in 2008. However, levels are high for children in the poorest households, in households with poor food consumption, and in households with high coping strategies. This, however, is likely to change drastically with increased devolved funding. During the period under review, the share of agricultural in total public expenditure as a ration of share of agriculture in GDP, measured using the Agricultural Orientation Index (AOI), was 0.09 percent in 2014 and 0.05 percent in 2015. This means that expenditure in agriculture declined in 2015.
In order to ensure progress in the attainment of this goal, the country needs to fast track interventions to enhance high quality and quantity food production, access and availability through increased agricultural productivity as a way of ensuring increased household access to food in sufficient quantity, quality and surplus for sale. Towards this, the government has been implementing irrigation projects like the Galana Kulalu Irrigation Project, interventions to transform agriculture from subsistence to productive commercial farming and subsidizing fertilizer and seeds, distribution of drought tolerant crops, strengthening the PPPs framework; implementation of livestock and livelihood support projects, construction and renovation of fresh-produce markets; provision of extension services to improve horticultural and livestock farming.
During the period under review period, the government strengthened research and development through revamping and restructuring the Kenya Agricultural Research Institute (KARI) by putting together all agriculture and livestock related research institutes1 to form the Kenya Agricultural and Livestock Research Organization (KALRO). This is expected to diversify seeds, cultivated plants, farmed and domesticated animals and their related wild species.
Efforts by non-state actors to support the implementation of this goal including providing ready market to small holder farmers in ASAL areas, piloting the fertilizer to establish suitability of local soil and crop requirements, providing micronutrient powder (MNP) to children aged 6-59 months, offerings peer-to-peer service that helps farmers share information with each other via SMS or through internet helping farmers get market information and improve their agriculture productivity and providing up-to-date market information linking farmers to buyers through our marketplace and current agriculture-trends.
Challenges
i. The adverse effects of climate change leading to severe droughts, crop diseases and pests resulting in lower agricultural productivity;
1 merged with KARI, Coffee Research Foundation, Tea Research Foundation and the Kenya Sugar
Research Foundation and has oversight of 18 research institutes

25
ii. Inappropriate agronomic methods and practices; iii. High population growth rates exerting pressure onto the limited productive arable land
leading to land fragmentation into unviable farming units. This has led to declining trends in agricultural productivity and food insecurity.
iv. Emergence and re-emergence of both crop and livestock diseases and pests exacerbated as well as cross-border livestock diseases;
v. Inadequate marketing strategies and systems for agricultural products; and vi. Low uptake and adoption of modern technology, especially in the agricultural, livestock
and fisheries sector.
Goal 3: Ensure Healthy Lives and Promote Well-being for all at all Ages In Kenya, despite of the initiatives implemented during the MDGs period, maternal mortality ratio, infant and under five mortality remains unacceptably high at 362/100,000, 39 per 1000 live births and 52 per 1000 live births respectively. Malaria incidence per 1,000 population is 225. The proportion of births attended by skilled health personnel is 61.8 which is an increase from 43 percent in 2011.Tuberculosis incidence per 1,000 population was 90 in 2015. Death rate due to road traffic injuries per 100,000 population was 11 in 2014 before increasing to 12 in 2015 and declining to 11 in 2016.
This calls for innovative ways to ensure health lives and well being for Kenyans.The health sector has been rolling out several initiatives aimed at promoting prosperity. They include: Comprehensive and Expanded Immunization programme that includes pneumococcal vaccine for children to cover emerging diseases and ailments which has led to a reduction in Infant and Child Mortality. Exclusive breast feeding campaigns and introduction of supplemental foods is geared towards reducing mortality rates. Mass distribution of Long Lasting Insecticidal Mosquito nets has reduced the incidence of Malaria especially among Lake Region communities. The increase on the proportions of birth assisted by skilled health providers during delivery, health facilities deliveries and post natal care are also cited as factors that lowered both Child and Infant Mortality. Health Insurance Subsidy Programme (HISP), is an initiative aimed at contributing to better quality of life, poverty alleviation and human development through meeting population health needs; removal of financial barriers to health care and reduce incidences of catastrophic health expenditures. This will be realized by consolidating and expanding social health subsidy mechanisms with view to achieving Universal Health Coverage (UHC). This project targets about 21,530 households of which 17,612 households have been registered to access health services from the hospital of their choice. The Managed Equipment Service has allowed Medical facilities to acquire vital hardware as a way to improve access to comprehensive Kenya Essential Package for Health (KEPH) services by different constituents of Kenya’s population. Specifically, the project is set to contribute towards acquisition of the requisite infrastructure and equipment to about 100 current level 4 county hospitals to the accepted norms and standards. Further these facilities will enable them to provide a wide range of comprehensive health care services and provide prompt diagnosis of non- communicable conditions. The government is also upgrading of health facilities in slum areas to increase access of slum dwellers to vital heath care services through is project that uses mobile devices to reach deep into the slum areas.

26
The Beyond Zero Campaign is an initiative by H.E. First Lady, Mrs. Margaret Kenyatta which seeks to accelerate economic and social development in Kenya through the health facet. The achievements of the campaign include delivery of mobile clinics to all county referral hospitals in the country. By bringing health delivery closer to Kenya’s citizens, the mobile clinics have been able to treat mothers and children who would otherwise have been obliged to walk miles to seek treatment. In addition to the above initiatives, health worker density and distribution per 100,000 populations has improved from 21 doctors and 165 nurses in 2014 and increased to 23 doctors and 230 nurses in 2016 which support these initiatives. At the county level, there are a number of innovative initiatives to address health at the community level. These include; Mother waiting home (KIROR): An initiative of West Pokot County Government. This is a home outside their home and a home outside the health facility. Expectant mothers move to KIROR near a health facility a few days to their expected day of delivery and are monitored during labour by the health personnel at the health facility thereby reducing congestion at the health facility while at the same time getting prompt services of a qualified personnel during delivery. The county Government of Embu has introduced the commodity exchange programme. This starts with the formation of a county commodity security/Exchange team on WhatsApp social platform. This commodity group has seen a lot of action since its inception. Sub county pharmacists are always busy facilitating the collection of commodities and transferring them to needy sites. It has become much easier to source commodities for sites that run out of essential items and Priority program commodities.
Garissa County Health Management Team adapted the provision of MAMA kits to pregnant mothers and incentives to Traditional Birth Attendants (TBAs) to improve skilled deliveries. Reproductive Maternal Newborn, Child and Adolescent Health (RMNCAH) Project is a six county initiative that focuses on improving maternal and newborn outcomes in six high burden maternal mortality counties in Kenya2.The select counties contribute about 50% of maternal deaths nationally. In those counties, a total of 507 additional health care facilities received Managed NH equipment and are now providing Emergency Obstetric and New born care (EmONC) services. The private sector has also made contribution to this goal as outlined below. The private sector contribution towards improving health care outcomes include a KEPSA/UNICEF project aimed at improving maternal and infant nutrition through sensitizing members of the private sector on the need to promote exclusive breastfeeding for children by providing working mothers with a conducive working environment as well as providing breaks for them to breastfeed their children. The project encourages businesses to
2 Mandera, Wajir, Turkana, Marsabit, Isiolo, Lamu, and Migori counties

27
create mother and baby friendly spaces which includes the creation of a lactation station for lactating mothers. Mtiba- is a mobile health wallet for healthcare savings, payments and bonus schemes developed by the private It allows individuals and organizations to distribute funds for healthcare to people who rely on them. They can be sure that those funds will be used for healthcare only. And they know that their dependents are being treated at clinics that charge fair prices and follow internationally recognized quality standards. Private sector has also created the Pampers Mobile Clinic Program, providing free basic health checks, health talks and products to mothers and their babies. The Pampers vaccine program eliminates neonatal tetanus, a preventable disease that claims the life of 58,000 babies in developing countries each year. Another initiative involve offering a one-stop shop across six distinct healthcare services namely: medical equipment supply, installation and after-sales service; construction of new medical facilities or upgrade of existing facilities infrastructure; mobile clinics fabrication and deployment; medical applications training; turnkey healthcare programs implementation (PMO); and hospital information systems (HIS) and healthcare information technology (HCIT) deployment Challenges
1. Skewed distribution of skilled health workers with some areas of the country facing significant gaps while others have optimum/surplus numbers;
2. Health financing and purchasing of health care services still has a serious implication on access and quality of health care;
3. Childbirth related conditions continue to pose significant challenges, especially inadequacy of emergency services for delivery, under-utilization of existing antenatal services and inadequate skills and competences of health workers;
4. Communicable diseases still account for the highest proportion of disease burden in the sector;
5. Non-communicable diseases (NCDs) are exerting pressure to the health system. Despite the awareness on the risk factors of NCDs, there has been no significant change on the lifestyle amongst the general population. Cancer, hypertension, heart disease and diabetes are rising and emerging as major health problems. Cancer alone is estimated to cause 21,000 deaths annually;
6. Injuries from road traffic accidents contribute 50-70% of bed occupancy in hospitals; 7. Childbirth related conditions continue to pose significant challenges, especially
inadequacy of emergency services for delivery, under-utilization of existing antenatal services and inadequate skills and competences of health workers in this area; and
8. Data unavailability especially on neglected tropical diseases (NTDs), cancer and outbreak diseases.
Goal 4: Ensure Inclusive and Equitable Quality Education and Promote Lifelong Learning Opportunities for all

28
During the MDGs period, Kenya made commendable progress in the implementation on the goals on education which was mainly as a result of the introduction of free primary education (FPE) in 2003 which led to significant increase in both GER and NER. It is also as result of the fact that the push for attainment of UPE is enshrined and protected under the Bill of Rights in the Constitution of Kenya, 2010. Education is one of the most critical factors of empowering and driving positive economic development and social progression in any country and therefore has positive ramification in all the other SDGS and their respective targets and indicators.
In response, Kenya has embarked on the development and embracing of various policies, strategies, guidelines and programmes geared toward the goal which has resulted in progress in the following areas; Participation rate in organized learning increased from 70.2 to 74.6 to 74.9 percent in 2014, 2015 and 2016 respectively.
In tandem with the sharp increase in the number of children attending early learning centers, the proportion of teachers for pre-primary who had received at least the minimum organized teacher training increased from 84.1 percent in 2014 to 86.7 in 2015 and to 88.2 in 2016. The enrolment at Technical and Vocational Education Training (TVET) increased from 147,821 (75,105 – Male and 49,454 - Female) in 2014 and to 153,314 (79,846 – Male and 52,927- Female) in 2015 before increasing to 202,556 (91,209 – Male and 74,432 - Female) in 2016. Adult education enrollment was 330,340 (113,552 – Male and 216,788 - Female) in 2014 before decreasing to 306,228 (102,076 – Male and 204,152- Female) in 2015 and to 271,769 (85,575 – Male and 186,194 - Female) in 2016. This is as a result of the initiatives being implemented in this sector which includes;
The implementation of the Digital Literacy Programme (ICT Integration in Primary Education) whose main aim is the integration of ICT into teaching and learning for pupils in primary schools. The components of this project include: improvement of ICT infrastructure; development of digital content; capacity building of teachers and implementers; and procurement of ICT devices.
The inclusion of ECDE into the primary school education programme which has led to the increase in number of trained ECDE teachers by 9.8 per cent for the period 2013 to 2015 in tandem with the sharp increase in the number of children attending early learning centers. .Other programmes includes; continued implementation of the Free Primary Education (FPE) programme which has greatly contributed to an increase in primary school education enrolment over the years. The government has enforced the re-entry policy to address dropout cases of young mothers who conceived while in school; sanitary towels programme which enhance girls’ participation in learning;. Bursary Scheme to assist selected secondary school students to meet other education expenses not catered for by Free Day Secondary Education and provision of Grants to ASAL and Pockets of Poverty. The total number of public secondary school teachers increased from 65,494 in 2013 to 85,438 in 2015. Towards enhancing inclusivity, Special Needs Education is being provided at special schools, integrated schools and special units attached to regular schools. Currently enrolment stands at 102, 749. Since January 2016, 184 special boarding schools (167 primary schools, 8 secondary schools and 6 technical /vocational institutions) received capitation grants. The expansion of TVET institutions has resulted to an increase in enrolment by 4.7 in the period under review.

29
Private sector has also made contribution towards this goal with some examples including internet for Schools programme which provides free 3G Internet for Schools to both primary and secondary across Kenya. Through the project, 322 schools have been connected, impacting the lives of over 200,000 students in 33 counties out of the 47 counties in Kenya. More than 100 schools have been provided with tablet devices that will capture data about students and the facilities. From the information acquired, leaders will have a better understanding of current progress and challenges as well as be able to offer recommendations for improvement. Challenges
i. High cost of sustaining the financing of Free Primary Education (FPE) and free tuition education for secondary education;
ii. Overcrowding in schools in general and in classrooms, especially in areas with high population densities, especially in the urban slums;
iii. Perennial droughts in most parts of the country coupled with the resultant hunger especially. in the ASAL regions exacerbates the already high rates of school dropouts of children; and
iv. Existing regional disparities which continue to negatively impact on the country’s commitment to attain education for all and universal primary education.
Goal 5: Achieve Gender Equality and empower all Women and Girls
The government has recognized that women empowerment is critical in effectively combating poverty, hunger and disease in the country and also a way to stimulate development and achievement of the other SDGs. For a long period of time now, the government has undertaken initiatives aimed at promoting gender equality and empowerment of women with the aim of ensuring equal access, control and resource distribution to improve livelihood for the marginalized categories of people, including women, people with disability (PWDs) and other vulnerable groups.
The Constitution of Kenya, under the Bill of Rights, obligates the State to address the needs of the vulnerable persons in the society with emphasis on protection of the marginalized persons in the society among them women and, persons with disability (PWDs). Kenya Constitution and Kenya Laws protect women inheritance of their father’s and or spouse’s land and the laws over ride customary laws and considerations. The constitution also created the National Gender and Equality Commission whose mandate is to promote gender equality and freedom from discrimination. There has been mixed progress in the achievement of this goal and its targets. The table below shows the proportion of women in managerial positions
Table 5-1: Women in Decision Making Positions
2014 2016
F M Total % F M Total %
Categories
Cabinet Secretaries 6 12 18 33.3 5 15 20 25.0
Principal Secretaries 7 19 26 26.9 15 26 41 36.6
Diplomatic Corps 15 48 63 23.8 18 46 64 28.1

30
2014 2016
F M Total % F M Total %
County Commissioners 18 29 47 38.3 18 29 47 38.3
Sub-County Commissioners 32 262 294 10.9 40 255 295 13.6
Deputy Secretaries 58 137 195 29.7 66 149 215 30.7
Supreme Court Judges 2 5 7 28.6 2 5 7 28.6
Court of Appeal Judge 9 21 30 30.0 7 18 25 28
High Court Judge 37 60 97 38.1 37 59 96 38.5
Magistrates 219 239 458 47.8 216 222 438 49.3
Kadhis 0 35 35 0.0 0 56 56 0.0
Chiefs 101 2489 2590 3.9 126 2464 2590 4.9
Assistant Chiefs 473 5413 5886 8.0 489 5397 5886 8.3
Practicing Lawyers 2581 4193 6774 38.1 2738 4347 7085 38.7
Source: Various The table above shows that representation of women in various leadership and political levels is still below the Constitutional provision of not more than 2/3rd in elective and appointive position. In pursuit of this goal, the government has undertaken and continues to undertake a number of initiatives. Various policy and legal frameworks have been developed/enacted to promote, enforce and monitor equality and non-discrimination. To ensure women aged 15- 49 years have access to sexual and reproductive health care, information and education, Kenya has developed eight (8) policies.
To improve on representation of women in leadership position, the government is undertaking an aggressive capacity building programme targeting the 2017 election women aspirants and leaders both at National and County levels. The Country is also in process of enacting a law to implement the not more than 2/3rd gender principle in the Constitution. Further, a strategy for the empowerment of women to enhance their participation in elective bodies has also been prepared. Kenya has also been producing gender datasheet to guide Policy formulation and planning. Status of women report 2015 which provides information on the status of women across various sectors has also been prepared Further, the Government is undertaking capacity building on gender statistics for Statistical officers, planning officers and gender officers both at National and County levels to enhance collection, collation and analysis of sex disaggregated data. Tracking of Budgetary allocation towards women empowerment endeavors including women enterprise. Kenya has GBV Helpline 1195 that supports GBV survivors to break the silence and quickly access GBV services including referral after violation. It is a 24 hour toll-free hotline that responds to sexual and gender based violence in Kenya. The goal of GBV hotline and the call up centre is to involve community members and survivors in the fight against all forms of violence that is meted on women and children within the recommended 72 hour window period. The Government is also implementing various affirmative action programmes for empowerment of women, Youth and PWDs. These include: Women Enterprise Fund,
31
UWEZO Fund, National Government Affirmative Action Fund and the Youth Enterprise Fund. Kenya is implementing the Access to Government Procurement Opportunity (AGPO) which reserves 30% of all public procurement to women, youth and persons with disabilities. This is implemented at both the National and County Government. Challenges
i. Harmful and prohibitive socio-cultural traditional practices and beliefs such as female genital mutilation/cutting (FGM/C) in some communities;
ii. High level of unawareness on Gender Based Violence in community, persisting cultural practices and social norms on GBV thus significantly impairing prevention of GBV; and
iii. Continued existence of gender inequalities with regard to access and control of resources, economic opportunities, political as well as power.
Goal 6: Ensure Availability and Sustainable Management of Water and Sanitation for all In Kenya like in other countries, access to safe, adequate and reliable water supply is one of the central indicators of socio-economic development (KNBS, Economic Survey, 2014).The percentage of population using safely managed drinking water services was 66.9 percent as at 2014 which implies that a large proportion of Kenyans have no access to sources of drinking water which are safe and reliable. Since 2014, an additional 3.3 million people had access to clean and safe drinking water as a result of the construction and expansion of water supply schemes in urban and rural areas. The percentage of rural households with access to clean and safe Water increased from 45 percent in 2013 to 50.2 percent in 2015. Some of the initiatives in this area include construction and expansion of water supply schemes in urban and rural areas and; Devolution of water provision services to the county government to improve on efficiency and effectiveness. The Nairobi Water and Sewerage Company has installed water ATMs enabling city residents living in informal settlements to access quality water cheaply. The ATMs use AQtap technology and the residents pay for water using mobile technology. This has reduced the cost of water to the community as well as improved revenue collection by the company. The water of Life Programme is a private sector initiative that has invested in 78 different water and sanitation projects in Kenya, impacting over 3 million people. The programme is dedicated to devising new approaches that will solve water-related challenges locally and sustainably manage water use within businesses. The “Citizen Field Engineer” project in Nairobi, is another innovative initiative that uses sensors to monitor water quality and supply which enables community residents to govern, maintain, and repair the physical infrastructure for water delivery. In exchange for their monitoring, residents receive mobile credits, thereby providing a financial incentive to continue with their water management. Challenges

32
i. Weak data collection and management practice in some of the water sector institutions and in the counties limits the availability and accuracy of data;
ii. Insufficient institutional, human, financial and technological capacity continues to hamper adequate development in the water resources sector;
iii. Climate change impacts on the quality, quantity, timing, form and intensity of precipitation leading to decreased water resources.
iv. The investment in water supply and sewerage is not coping with population growth and the demand for services;
v. Administrative challenges in the implementation of multi-purpose water projects between counties and national government; and
vi. Water pollution
Goal 7: Ensure Access to Affordable, Reliable, Sustainable and Modern Energy for all Development of the energy sector is critical if Kenya is to achieve the Kenya Vision 2030 and become a newly industrializing, middle income country. Kenya possess significant potential sources for power generation in geothermal, wind and biomass energy. Kenya’s electricity installed capacity stands at 2,334MW as at 2015. In the medium term, the target is to increase installed electricity capacity by 5,538MW to slightly over 6,700MW by 2017. Overall, 61 percent of the total power generation capacity is expected to come from renewable sources. As at November 2015, approximately 86 percent of power generation capacity was from renewable sources: hydro, geothermal and wind. As at 2015, the percentage of population with access to electricity stood at 36 percent while the percentage of population with primary reliance on clean fuels and technology was 11.9 percent in 2014. At the same time, the renewable energy share in the total final energy consumption stood at 12.4 percent in 2014 before decreasing slightly to 11.8 percent in 2016. Kenya is building the largest wind farm in Africa, the Lake Turkana Wind Power Consortium (LTWP). It aims to provide 300 MW of low-cost electrical power. Once operational, it will allow the country to eliminate its thermal generating plants, saving Kshs. 15.6 billion (US $180 million) per year on imported fuel. Geothermal power has the potential to provide reliable, cost-competitive, base load power with a small carbon footprint, and reduces vulnerability to climate by diversifying power supply away from hydropower, which currently provides the majority of Kenya’s electricity. Kenya currently has 636 MW of installed geothermal capacity and aims to have 5,530 MW of geothermal power or 26% of total capacity by 2030. This will make it Kenya's largest source of electricity clean energy by 2030. Geothermal power plants have a prominent place in Kenya’s overarching development plans. The private sector contribution to this goal includes the Mkopa product that aims at enabling off-grid communities to leap from using unreliable non-renewable energy to affordable and sustainable practices, without the process of excessive polluting in between. Others include the development of a Carbon Action Plan, with the aim of increasing the use of energy from renewable sources with dedicated projects. Some of these includes (photovoltaic power plants, cogeneration plant powered by vegetable oil, biomass plant for steam generation

33
and supply of electricity from wind power Households have also been supported to invest in improved cook stoves and to access small solar systems for lighting and basic electricity services. Challenges
i. The high cost and long lead time in the development of energy generation projects; and; ii. Poor road network in some regions making it difficult to transport materials to site
Goal 8: Promote Sustained, Inclusive and Sustainable Economic Growth, Full and Productive Employment and Decent Work for all The Kenya Vision 2030 envisions an economy growing at 10% annually with certain key flagship projects that are expected to create many decent jobs and lead to growth of micro, small and medium size enterprises. Kenya has made progress in a number of areas. The country’s economic growth rate has been gradual ranging from 5.7% in 2015 to 5.8% in 2016. The annual growth rate of real GDP per capita is at 3.12% while the annual growth rate of real GDP per employed person was -0.55% in 2014 and increased to 0.33 in 2016. A number of initiatives have been implemented to promote Sustainable Economic Growth and address the issue of unemployment as outlined below. The government through the Ministry of Education initiated a programme to construct Technical Institutes in every constituency to bolster the capacity of the existing ones to increase the number of youths with skills and enhance employability. The Government continues to expand social cash transfers to additional households as part of its National Safety Net Program for Results. The country has strong laws prohibiting child labour and has a vibrant Child Labour Division which monitors enforcement and coordinates activities to eliminate child labour. The judiciary has a specialized Children’s Court that listen to cases involving abuse of children in Kenya. The Banking Act 2016 is the culmination of numerous attempts to ensure increase in access and affordability of credit from financial institutions. At present, interest rates are capped at about 14% for all formal bank loans. On the same vain the treasury directed all importers of goods to purchase maritime insurance from local insurance company as a way to increase growth of local insurance companies. A good number of major corporations in Kenya have adopted and are domesticating the UN Guiding Principles on Business and Human Rights, adopted by UN Human Rights Council in 2011 which have become a benchmark for their policies and programmes related to workplace and human rights. The Kenya Private Sector Alliance is also spearheading the Sustainable Inclusive Business (SIB) which has assisted businesses to measure and report on sustainability with a focus on the Sustainable Development Goals. It also brings knowledge, networks, studies, publications, trainings and expertise together and makes them accessible for the business community. There is an emerging trend among the business community to engage is economic activities that have a social and environmental consideration as it deals with an enlightened public.

34
Challenges
1. Although the country envisions an annual growth rate of 10% annually, it has been affected by constrained global trade aggravated by subdued investments at the global level due to rising policy uncertainties; and
2. The effects of climate change and the continuing drought and unfavourable weather have affected agriculture and agro based industries as well as the manufacturing sector. In addition, tourism share of GDP has remained low due to effects of transnational crimes and global terrorism.
Goal 9: Build Resilient Infrastructure, Promote Inclusive and Sustainable Industrialization and Foster Innovation Kenya recognizes the critical role of infrastructure, industrialization and innovation in the achievement of the Kenya vision 2030. Efforts towards the development of these sectors have resulted in good progress towards these goals. The development of rural roads has seen the proportion of the rural population who live within 2 km of an all-season road increase to 30% translating to 13.2 million people as at 2015. Passenger and freight volumes, by mode of transport (000 tonnes) performed as follows: Railway freight increased from 1509 in 2014 to 1575 in 2015 before decreasing to 1429 in 2016; Air freight decreased from 279.9 to 263.6 in 2015 then to 250 in 2016; Water freight increased from 24875 to 26732 in 2015 and to 27364 in 2016; Passenger numbers (000 No.) were as follows: Railway decreased from 3845 to 2359 in 2015 and then to 2186 in 2016; Air increased from 8882 to 8993 in 2015 and to 10043 in 2016. The manufacturing value added as a percentage of GDP was estimated at 10.3 percent in 2014 but declined to 9.4 percent in 2015 and to 9.2 percent in 2016. Manufacturing value added per capita stood at 0.013 in 2014 and increased to 0.014 in 2016. The people employed in the manufacturing sector as a percentage of total employment was estimated at 11.9 percent in 2015 before decreasing slightly to 11.8 percent in 2016 while the proportion of population covered by mobile network, by technology was 94 in 2015 and increased slightly to 95 percent in 2016.The government has put in place a number of initiatives as outlined below. In Aviation, Kenya continued the expansion and modernization of aviation facilities. These include: uupgrading of Air Navigation Systems purchase of 3D Air Traffic Control Training Simulator at the East Africa School of Aviation (EASA); ongoing upgradingairports; and the development and improvement of airstrips.
Kenya endeavors to improve port efficiency by implementation of the Electronic Single Window System and the operationalization of the 24-hour port operations. The Kenya Tradenet System, an electronic single window system, has been launched. The System allows clients to lodge port clearance documents electronically through the System to the multiple government agencies involved in clearing cargo at the comfort of their offices. The System seamlessly integrates with the Integrated Customs Management System (ICMS) and Real Time Monitoring System (RTMS) which automates the One Stop Border Post (OSBP) processes for efficient and faster clearance of cargo at Kenyan Borders. The System reduces

35
delays and lowers the costs of clearing goods at the Port and Kenyan borders. Kenya has also initiated improvement of maritime facilities including dredging and widening of Mombasa Port and development of container Berth No 19 Construction of Standard Gauge Railway (SGR) phase I covering 500 Kms (Mombasa – Nairobi) is complete and is operational. The SGR system is slated to reduce the travel time between the two destinations from 12 to 4 hours and the cost of doing business in the region using rail is 40% cheaper than road transport. Construction of SGR phase 2 is in progress. To reduce traffic congestion within Nairobi, the Government has embarked on improvement of rail transport including upgrading of Commuter Rail System and construction of a railway station at Syokimau and Imara Daima; To enhance connectivity, trade and security in South Sudan and Ethiopia, Kenya is currently developing the northern trade route. The Lamu Port South Sudan Ethiopia Transport (LAPSSET) Corridor Project is the largest integrated transformative infrastructure project in Africa. The Project aims at opening up northern Kenya and providing a reliable transport corridor to Ethiopia, South Sudan and to some extent Uganda. The components of the Project are being implemented through PPP arrangements. In manufacturing sector, the Government has initiated efforts to enhance growth of SMEs through infrastructure development and financial support. During the period under review Kenya established the first leather park in Machakos County which aims at creating 35,000 jobs and generate USD 250 million to the GDP. In addition, the devolution of the industrial development function to county governments has greatly enhanced opportunities for increased industrial growth at the county level To increase R&D workers and R&D spending as a proportion of the GDP, Kenya has put a number of measures in place. The enactment of the ST&I Act of 2013 has created three agencies namely: the National Commission for Science Technology and Innovation (NACOSTI), the Kenya National Innovation Agency (KENIA) and the National Research Fund (NRF) to streamline and enhance the effectiveness and efficiency of the National System of Innovation (NSI) through clearly defined functions for each agency. KENIA is charged with managing the NSI to enhance linkages within the system among the government, academia and industry while the National Research Fund is charged with funding national research both in terms of supporting the performance of R&D in all sectors of the economy as well as providing infrastructure support to Universities and research institutions to upgrade their technological capabilities and enhance performance of R&D. The freeing up of valuable portions of the TV broadcast spectrum that emanated from the successful completion of the digital migration facilitated significant growth of digital TV stations from 36 in 2014 to 66 in 2016. This has benefited the consumers through more options, better sound and picture quality. The government has been undertaking regular measurement of Research and Experimental Development (R&D) and Innovation indicators since 2009 under the African Union NEPAD-led African Science Technology and Innovation Indicators (ASTII) Initiative. Under the ASTII initiative, R&D and Innovation indicators surveys are carried out biennially and triennially respectively. During the period under review national R&D indicators survey and innovation survey were was carried out in 2015/2016

36
Challenges
i. Inadequate funding for maintenance, rehabilitation and construction of new infrastructure;
ii. Inadequate human resource capacity and equipment iii. High cost of road construction; iv. High land acquisition costs and encroachment of road and railway reserves; and v. Rapid urbanization resulting in increased traffic volume, high cost/delays in relocation
of utilities and services along and across road reserves.
Goal 10: Reduce Inequalities within and among countries Kenya has made progress in the following areas; Kenya has produced a Migration Profile and a draft Migration Policy; Total resource flows for development (in Kshs. millions), was 28,117 in 2014 and increased to 51,470 in 2016. However, labour share of GDP, comprising wages and social protection transfers was about 31.1 percent in 2014 and decreased to 28.8 per cent in 2016. To fast track this goal, the government and the private sector are undertaking a number of initiatives.
The completion of the Kenya External Resources Policy has provided adequate guidelines for the cooperation with development partners hence the possibility on increased external resources into the Country. Kenya, under the Intergovernmental Authority for Development Regional Migration Policy Framework has established and operationalized the National Coordination Mechanism on Migration (NCMM). The NCMM is a platform for all government ministries, state departments and agencies to address migration related challenges in the country. In addition the Border Control Unit is expected to be institutionalized within the next five years and hence combine Customs and Immigration. A number of private sector companies are providing income generating ventures such as direct farming contracts to youths and women groups. Others have highly resourced scholarship programmes that target needy and bright students for higher education. In the financial sector some companies have increased access to credit including where farmers can offer their animals as collateral and which is securitized through an insurance policy. Challenges
1. Kenya as a developing country still encounters resource constraints in its desire to expand its social protection transfers; and
2. The country has neighbors who have been unstable for a long time leading to illegal immigration as well as trafficking in persons and illegal fire arms which pose perpetual security concern in the country.
Goal 11: Make Cities and Human Settlements Inclusive, Safe Resilient and Sustainable

37
The proportion of urban population living in slums, informal settlements or inadequate housing stood at 7.9 percent in 2014. The total expenditure per capita (in Kshs.) spent on the preservation, protection and conservation of all cultural and natural heritage, by type of heritage level of government type of expenditure and type of private funding stood at 0.01.The number of deaths, missing persons and persons affected by disaster per 100,000 people was 1 in 2014 before increasing to 2 in 2015 and then decreasing to 1 in 2016. The proportion of urban solid waste regularly collected and with adequate final discharge out of total urban solid waste generated, by cities was 44 percent in 2014. Kenya has undertaken measures to ensure sustainable cities and communities which include formulation and legislation of various policies and laws. The policy and legal frameworks are aimed at improving the sustainability of cities and urban settlements in line with the aspirations of Kenya Vision 2030. The government has also been constructing houses to improve on the living conditions of the police under annuity financing model. In 2006, National Disaster Reduction Strategy & Policy and National Disaster Preparedness and Response Strategies was adopted. The Government developed the National Solid Waste Management Strategy in 2015 as part of the efforts to promote environmental sustainability in our cities and other urban settlements. Other interventions include enhanced implementation of the National Climate Change Action Plan 2013-2017 through mainstreaming climate change into development of port facilities, roads, railways and bridges to account for rising sea levels and the increased occurrence of extreme weather events and flooding. The establishment of mass transit system for the Greater Nairobi in the form of bus rapid transit corridors, development of the Standard Gauge Rail is among low carbon transport options which will shift significant amount of freight from road to rail, improve passenger and freight vehicle efficiency. The Government made an investment of Kshs. 7.6 billion in 2016 in street lighting in all major towns in Kenya including all county headquarters. The programme is aimed at increasing security in major towns as well as creating employment opportunities and facilitates the realization of a 24-hr economy in these towns, urban and trading centres within the country. For ease of sustainability of the programme, the national government has implemented a 61.3 percent tariff reduction in charges to county government. In addition, CCTVs cameras have been installed in Nairobi and Mombasa to help towards enhancing security and prevent crime. Similar projects are planned for implementation in other cities. The private sector contributes towards making cities and communities sustainable through the construction of more than 20,000 houses for both government and non-government employees through public private partnership model which, commenced in October 2016. Challenges
i. High population growth rate; ii. Rapid urbanization; and
iii. High cost of financing housing development, amongst others.
Goal 12: Ensure Sustainable Consumption and Production Patterns

38
In order to enhance efficiency in the use of natural resources and energy, the industrial sector has embraced cleaner production technologies through technical assistance by the Kenya National Cleaner Production Centre. The Centre has built capacity of industries in improving efficiency in the status of production systems/equipment in order to reduce wastage of raw materials and energy aimed at minimizing waste generation at source. The country has also pioneered the Green Economy Strategy initiatives that aim to support development efforts towards addressing key challenges such as poverty, unemployment, inequality, environmental degradation, climate change and variability, infrastructure gaps and food insecurity. A green growth path results in faster growth, a cleaner environment and high productivity. The enactment of Mining Act 2016 and the development of 14 regulations necessary to operationalize this Act are in their final stages. In addition the Mining Policy 2016 has put sustainable mining at the core of all extractive industries. The private sector in Kenya is also championing sustainable consumption and production under the SWITCH Africa Green Project. Several companies have mainstreamed use of biodegradable materials in their production and consumption. On the other hand responsible consumption especially of habit-forming goods such as alcohol is being championed by the very same producers. Challenges
i. Inadequate physical and social infrastructure in slums and informal settlements; ii. Rapid urbanization;
iii. Rapid population growth; and iv. Proliferation of informal settlements.
Goal 13: Take Urgent Action to Combat Climate Change and its Impacts Climate change is considered one of the serious threats to sustainable development globally. Climate is a major driving factor for most of Kenya’s economic activities and therefore high priority has been to climate change and its impacts on livelihood and economic development. During the period under review, Kenya developed the National Disaster Reduction Strategy and Policy and National Disaster Preparedness and Response Strategies in 2016. This has resulted in maintaining the low number of deaths, missing persons and persons affected by disaster per 100,000 people was 1 in 2014 before increasing to 2 in 2015 and then decreasing to 1 in 2016. Efforts that have been put in place by the Government on Strategies for disaster risk reduction (DRR) include: Establishment of National Drought Management Authority (NDMA) which is created through the Enactment of the National Drought Management Authority Act, 2016.The Climate Change Act 2016 establishes the Climate Change Council which comprises stakeholders from National Government, County Governments, the private sector, civil society, communities and academia. The Act highlights the climate change response measures and actions, the roles of each of the stakeholders in mitigating effects of climate change and how to
39
engage the public. Kenya also ratified the Paris Agreement on Climate Change which took effect on 27th January 2017. The Forest Conservation and Management Act, 2016 provides for the conservation and management of public, community and private forests and, areas of forest land that require special protection. Forest play a critical role as CO2 sink as well as building resilience to climate change. In support of the East Africa Community (EAC) Polythene Materials Control Bill, 2016 which proposes a total ban of plastic bags in the EAC countries. Kenya has already placed a total BAN on plastic bags with effect from August 2017. The Government is in the process of integrating climate change into the curriculum for primary and secondary levels of education. This is geared towards taking advantage of the current education curriculum review that is being undertaken by the Kenya Institute of Curriculums Development (KICD). Climate change will be mainstreamed in the current subjects and topics and not as a standalone topic. The Kenya School of Government has also developed a climate change curriculum and training manual that will be used to build capacity of both government and private sector on climate change mitigation, adaptation and finance T private sector has set up, an incubation programme that supports the development and deployment of technologies that help communities to either mitigate against or adapt to climate change. So far, 138 enterprises have been incubated, 52 of which are now businesses that came in as ideas, and created 1,163 jobs through these businesses. Ecotourism Kenya is involved in Climate Change issues primarily through the Ecorating Certification Scheme, a voluntary scheme that covers accommodation facilities and basically advocates for the sustainable use of resources to reduce negative impacts on the environment and to use the dwindling resources in a more equitable manner. Challenges
i. Lack of reliable and adequate data on climate issues ii. Lack of baseline data to measure the progress on implementation of the SDGs in the
environment sector.
Goal 14: Conserve and sustainably use the Oceans, Seas and Marine Resources for Sustainable Development
During the period under review, progress was made in the following areas; the proportion of fish stocks (in tonnes) within biologically sustainable levels decreased from 168,413 in 2014 to 144,325 in 2015 and further to 128,645 in 2016. The coverage of protected areas in relation to marine areas was 10% in 2014.the government has undertaken various measures to fast track this goal Government efforts to protect the forest which are the major water towers resulted into increased water volumes especially in the rift valley lakes leading to increase in fish stocks especially in Lake Naivasha

40
Three mini fish processing and cold storage facilities which provide diverse services including cold storage, value addition and marketing of farmed fish have been constructed. In addition, ten aquaculture products marketing outlets in various parts of the country have been established in collaboration with private fish vendors. The establishment of a fish quality laboratory is expected to facilitate the capacity to conduct the full spectrum of fish tests required to access the European and other high quality markets. Promotion of local deep sea companies through joint ventures, reflagging of foreign fishing vessels and chartered fishing vessels is one of the country’s strategies in developing the EEZ. Towards this end, a deep sea fishing fleet development plan for a total of 73 deep sea fishing vessels have been developed and lodged with the Indian Ocean Tuna Commission. To facilitate the landing of the catch by the deep sea fishing vessels on the Kenyan soil, the Government has identified three berths designated for the fish port under the Lamu Port Southern Sudan - Ethiopia Transport (LAPSSET) corridor Flagship Project. The Government enacted Fisheries Management and Development Act 2016 and also continue to enforce controls for exploitation of fisheries resources. The Act provides for the conservation, management and development of fisheries and other aquatic resources and seeks to enhance the livelihood of communities that depend on fishing. The Act gives guidance on importation and exportation of fish and fish products, fish quality and safety. Challenges
i. Lack of baseline data on marine life and environment management; and ii. Evasive and alien species that threaten indigenous species by way of predation,
alteration of habitat or disruption of ecosystem processes. The prevention, control and elimination of these species is a big challenge in environmental management efforts; In adequate resources.
Goal 15: Protect, Restore and Promote Sustainable use of Terrestrial Ecosystems, Sustainably Manage Forests, Combat Desertification, and Halt and Reverse Land Degradation and Halt Biodiversity Loss The Government enacted the Forest Conservation and Management Act 2016 to guide the sustainable exploitation of forest resources. In addition, a number of initiatives were undertaken, and include: Natural forest conservation through rehabilitation of 600,000 ha of the five major water towers. Tree planting was carried out on 403,034 ha of farms and dry lands. In addition, 21,031.6 ha of industrial forest plantations and 40,987 ha of commercial forest woodlots were established during the period. Further, 150,000 ha of farm and private commercial forestry and 2,649 ha of nature based enterprises (non-wood forest products) were established to increase forest cover. The proportion of forest area in the total land area was 5.96 percent in 2015. In forestry research and development, six high value on-farm tree species were identified; four new commercial tree products were produced and seasonal tree species were distributed to all counties. Green Schools and Commercial Tree Growing for a Green Economy programme was

41
established. The Bamboo Development and Commercialization Strategy (2014-2017), Green Economy Assessment Report and Sustainable Environmental and Restoration Programme were launched. Several initiatives were further undertaken to reclaim the degraded land. Among the initiatives include: Reclamation of the 50,000 ha by county governments. A total of 1,331 ha. of degraded land was reclaimed in Turkana, West Pokot and Garissa counties. As a result of the construction of 3,700 water conservation and harvesting structures, an additional 5,200ha were reclaimed during the period under review. The private sector contribution towards this goal includes a programme that encourages and enables schools to participate in environmental activities by developing small forests and woodlots within their compounds for multiple benefits. Review of regulations on EMCA Act, Forest conservation and Management 2016 and, Wildlife Conservation and Management 2016 sets the best implementation methodology. Development of eighteen wildlife regulations forms a long term solution to benefit sharing and corridors ownership. Challenges
i. Inadequate institutional capacities; ii. Lack of participatory coordination frameworks in land and forestry management which
allow joint planning, monitoring and reporting by key stakeholders, iii. Insufficient funding; iv. Illegal logging, charcoal burning and opening up of lands for farming; v. Low sewerage coverage and insufficient treatment of effluent; and
vi. Natural calamities and resource based conflicts.
Goal 16: Promote Peaceful and Inclusive Societies for Sustainable
Development, Provide Access to Justice for all and Build Effective, Accountable and Inclusive Institutions at all levels
Progress has been made in the following areas; the number of victims of intentional homicide per 100,000 population was 6 by 2014. In 2016, the total number of homicide cases stood at 2,751while.the unsentenced detainees as a proportion of overall prison population stood at 55.9% in 2014 and increased to 60.5% in 2016.The proportion of seized small arms and light weapons that are recorded and traced, in accordance with international standards and legal instruments was 392 in 2014 and declined to 331 in 2015. In 2016, total firearms recovered stood at 444 while the number of rounds of ammunition of recovered and surrendered were 4,711. As part of adopting and implementing constitutional, statutory and/or policy guarantees for public access to information, Kenya is implementing the 2010 Constitution. According to Article 35 of the constitution, every citizen has the right of access to information held by the State and by another person and required for the exercise or protection of any right or fundamental freedom. The country also adopted the Paris Principles and formed Kenya

42
National Human Rights and Equality Commissions which are independent national human rights institutions, enshrined in the Constitution of Kenya. The Government continued to implement various institutional reforms to improve Governance in 2016. The reforms included: vetting of police officers, installation of a national secure communication network and surveillance system for the National Police Service (NPS) in Nairobi and Mombasa, and introduction of a ‘Roadmap Toolkit’ to guide training of police officers. During the same period, additional armored vehicles as well as transport trucks were procured to enhance capacity of the police to respond to emerging security threats. The country has made progress in promotion of peace nationally, regionally and internationally by establishing institutional bodies like National Cohesion and Integration Commission (NCIC), Ethics and Anti-Corruption Commission (EACC), Kenya National Human Rights and Equality Commission, Kenya National Gender and Equality Commission. Regionally, Kenya has participated in various peace keeping missions like Somalia Peace Keeping Missions. In August 2016, Kenya passed Access to Information (ATI) legislation aimed at fostering transparency in government and underlines the Government’s willingness to enhance citizen engagement, transparency and accountability. The Government has also put in place mechanisms to foster peace among warring communities through initiatives like joint Cultural Festivals, signed treaties on cultural exchange programmes with 51 countries hosting Kenya Missions. The treaties focus on promotion of cultural tourism, peace and human understanding among others. Kenya is the chair of Inter-Country Quality Nodes on peace education in Africa. Kenya seeks to establish effective peace and conflict structures throughout the country. During the review period, Kenya implemented a number of initiatives to achieve this goal which include: Sessional Paper No. 5 of 2014 on Peace building and Conflict Management in Kenya. It was adopted by the National Assembly in August 2015; Peace structures have been set up at all levels within government and communities to coordinate peace building and conflict management initiatives, develop and implement intervention strategies; Engagement with the political leadership has been sustained to seek their support in the peace agenda; Both National and County governments are supporting the implementation of the KNAP on UNSCR 1325 on Women, Peace building and Security through engendering peace processes. To promote partnerships and mutual cooperation, Kenya is participating in cross-border meetings and other tripartite arrangements such as EAC, IGAD/CEWARN and bilateral, cross-border peace dialogues with neighbouring countries are held regularly to address conflict issues. The Government with the support of development partners is implementing peace dividend projects to support peace initiatives geared towards weaning communities from violence and enabling them use their energies in building peace. The private sector initiated a peace campaign project meant to foster peaceful coexistence and peace for economic growth and prosperity in the country. This initiative is spearheaded by Kenya Private Sector Alliance (KEPSA) bringing together the Private Sector, Civil Society, Religious Leaders, Political Leaders, Student Leaders and Governments.
43
The Mkenya Daima initiative is designed to have positive impact on peace in the country especially during and after elections. It will ensure immediate positives impact on economic growth of the country as businesses are not interrupted every time there is an election. Challenges
i. Local, regional and international terrorism threats; ii. Inadequate resources;
iii. High number of refugees due to regional conflicts; iv. Radicalization of the youth; v. Cyber-crime;
vi. High youth unemployment breeding crime; and vii. Transnational and trans-border crime and networks.
Goal 17: Strengthen Means of Implementation and Revitalize the Global Partnership for Sustainable Development
In 2016, the total government revenue as a proportion of GDP was 23.4% while the proportion of domestic budget funded by domestic taxes was 60.7%. The volume of remittances (in USD) as a proportion of total GDP accounted for 2.47% in 2016. In the same year, the debt service as a proportion of exports of goods and services stood contributed 7.5%.The Fixed internet broadband subscription per 100 inhabitants was 64.9%; the proportion of individuals using the internet stood at 86.7%. In order to ensure quality and adequate data on SDGs, Kenya is focusing on strengthening national statistical office, the Kenya National Bureau of Statistics. The policy priority of the Kenya Government is to strengthen the National Statistical System to support planning, and monitoring and evaluation of government policies and programmes. The Kenya National Bureau of Statistics (KNBS) is therefore, expected to generate official statistics that are comprehensive, reliable, timely and disaggregated up to the county level. Towards this end, the Bureau has established offices in each of the 47 counties to coordinate statistical capacity building programmes at the county level and ensure that international standards are applied in the production and dissemination of county statistics The government is also rolling out National Integrated Monitoring and Evaluation System (NIMES) and fast-tracking implementation of electronic Project Monitoring Information System (e-promis) to provide a non-stop information portal where information is easily and readily available. Kenya has over the recent years undertaken multiple reforms to enhance the trade and international cooperation. This is also well reflected in the Kenya Vision 2030 which recognizes the central role played by the global trade to Kenya. These reforms include: enhancing wholesale hubs retail markets and; exploration of new markets to enhance Kenya trade portfolio among others.. Kenya is on record in leading calls for the eliminations of non-tariff trade barriers which act as key hurdles in the growth of exports from developing countries. Kenya has also hosted a number of international conventions aimed at strengthening global partnerships such as the HLFM2, Tokyo International Conference on Africa Development(TICAD) IV conference, the United Nations Conference on Trade And

44
Development 14 conference, the regional consultations on the Sustainable Development Goals (SDGs) and Africa’s Agenda 2063 amongst others.

45
6.0 NATIONAL MECHANISMS FOR MONITORING PROGRESS AND REPORTING ON IMPLEMENTATION OF THE ACHIEVEMENT OF SDGS Monitoring and evaluation is important during implementation of the SDGs. The SDGs being considerably larger than the MDGs implies that assessing progress towards the SDGs will rely on an even more elaborate system of measurement, covering more sectors and more indicators. Therefore there is need to put in place a robust SDGs monitoring and evaluation framework which will cover all the activities that contribute to the achievements of the SDGs. This framework should be inclusive and provide for multi stakeholder participation from local through to national levels. It should also have coordinated interventions to strengthen statistical capacities to collect collate and analyze national and sub national data.
In Kenya, the government is responsible for follow up and reviews of the SDGs. This will be done at both the national and county levels. At the national level, monitoring and evaluation of policies, projects and programmes outlined in MTP is done through National Integrated Monitoring and Evaluation System (NIMES) which was established in 2004. It employs a result based monitoring framework and provides important feedback to policy makers and the general public on the national government’s performance.
At county level, tracking progress towards the achievement of the policies, projects and programmes outlined in each CIDP will be undertaken through the County Integrated Monitoring and Evaluation System (CIMES). The ministry of devolution and planning has developed guidelines to provide basic principles for designing a clear CIMES for county level monitoring. This multi level monitoring and evaluation system will be used for monitoring the SDGs in the country. For effective monitoring of the SDGs, the National Integrated Monitoring and Evaluation System (NIMES) will be aligned with SDGs and the second National Indicator handbook for monitoring MTP II will be expanded to cover all relevant SDGs indicators. The SDGs indicators will also be integrated in regular surveys. It will also ensure engagement of stakeholders. Emphasis will be paid to building capacity of the national Statistical System to ensure data availability.
7.0 MEANS OF IMPLEMENTATION
The Constitution of Kenya that was promulgated in 2010 requires public participation in key governance and policy formulation processes. By providing for public participation, it demonstrates the need for citizens to be aware of their roles and responsibilities to enable them to participate in deciding on their destiny. Lessons learnt from MDGs implementation indicate that it is not enough to acknowledge inability or ability to attain set targets but call for deepening dialogue, candid actions and bold steps on resource mobilization, allocation and utilization geared towards the identified initiatives. The lessons will form the foundation for the SDGs implementation if any development challenges are to be surmounted. More importantly, it has to include a renegotiation of the roles and relationships between national, county governments, between Government and Development Partners, members of legislative assemblies (national and county) and between state and non-state actors among others. Therefore, strong partnerships and collaboration amongst stakeholders is critical in the successful implementation of the

46
SDGs. A strong collaboration will ensure creation of synergies which are necessary in implementation of the SDGs. Given the universality of the SDGs, it is critical that all relevant stakeholders are involved in the implementation of the SDGs at the national and county levels in Kenya. Therefore, one important first step that Kenya has undertaken is the mapping of all relevant stakeholders who will be involved in the implementation of the SDGs. This is important for translating 17 SDGs into action. On data and statistics knowledge-sharing, technology and partnerships, the Kenya National Bureau of Statistics is mandated by the Statistics Act 2006 to supervise and coordinate the National Statistics System (NSS). A challenge facing the NSS is limited statistical capacity and adoption of technology and innovation. The NSS will require to be expanded to incorporate non-state actors in order to create the necessary synergies to trigger new data collection tools and technologies for SDG monitoring frameworks, consequently, it is crucial that technical and financial support is provided to the Bureau to effectively supervise and coordinate the NSS. In particular, specific areas of focus in strengthening statistical capacities in Kenya are:
a) Training of Ministries, Departments and Agencies, including Counties, on basic statistics and management of information, particularly administrative data;
b) Technical assistance to the National Statistical Office and National Statistical System on imputation of the indicators and sharing of methodologies involved, including adoption of small area technology;
c) Knowledge sharing, between international and national statistics agencies, on the indicators where methodology is still non-existent (Tier 111);
d) Incorporation of key stakeholders, including CSOs, in the SDGs data debate through the existing national technical statistics committees. This will enhance availability, accessibility and harmonization of data produced in the country;
e) Technical and financial support in conducting SDGs related surveys, further analysis of existing surveys and censuses to derive baseline information for the SDGs;
f) Effective coordination of big data (large/complex datasets) from non-official data sources; and
g) Collaboration with private sector and international agencies to develop geospatial databases.
Challenges
1. Inadequate capacity 2. High stakeholder expectations 3. Inadequate funding to implement the SDGs 4. Inadequate disaggregated data
8.0 NEXT STEPS
a. Intensified awareness creation and capacity building to position country governments as the SDGs implementers;
b. Mainstreaming of SDGs into the MTP III, second generation County Integrated Development Plans and public institutions strategic plans;
c. Review the National Statistical System (NSS) in light of the SDGs;.

47
d. Capacity assessment of both National and County Governments to achieve the SDGs; e. Incorporation of SDGs targets and indicators into performance contracting in the
Public Sector; f. Needs assessment and costing analysis of the public sector to deliver on the SDGs; and g. Prepare and finalize an engagement framework between Government and Non State
Actors on the SDGs.
9.0 CONCLUSION
The SDGs came at a favorable time for Kenya as the Agenda 2030 time framework overlaps with that of Kenya Vision 2030. This has enabled the country to easily mirror its National Development Plans and Programme with those of the SDGs. In addition, the timing of the SDGs also coincides with the completion of the Kenya Integrated Household and Budget Survey 2016. This is particularly useful as the data and information generated will provide a clear baseline for the SDGs agenda and thus more effective tracking, monitoring and evaluation of the targets and indicators. With the Kenya Constitution 2010 and its elaborate Socio cultural rights guaranteed for the citizens, the SDGs era presents a great challenge for the Government and other Non-State development actors to work harder than in the past. However, devolution which was designed to take services closer to the people offers a new fit for development for Kenya and more effective service delivery channels for development. This Voluntary National Review has been conducted at an opportune time when Kenya is s preparing the next generation of the Kenya Vision 2030 Medium Term Plan III and the County Integrated Development Plans. The review has provided useful information that feeds into the preparation of the two planning documents. The process of review has been collaborative involving the Government, Civil Society organizations, and Private sector as well as development partners a clear indication that the government is engaging other stakeholders in the SDGs process and this will continue. The progress made in the achievement of the goals and targets shows that Kenya is really committed to implement the agenda 2030. Although data gaps and other vital information, exist, stakeholders agree that the review is a demonstration of Kenya’s willingness to meet its international obligations on the development front.
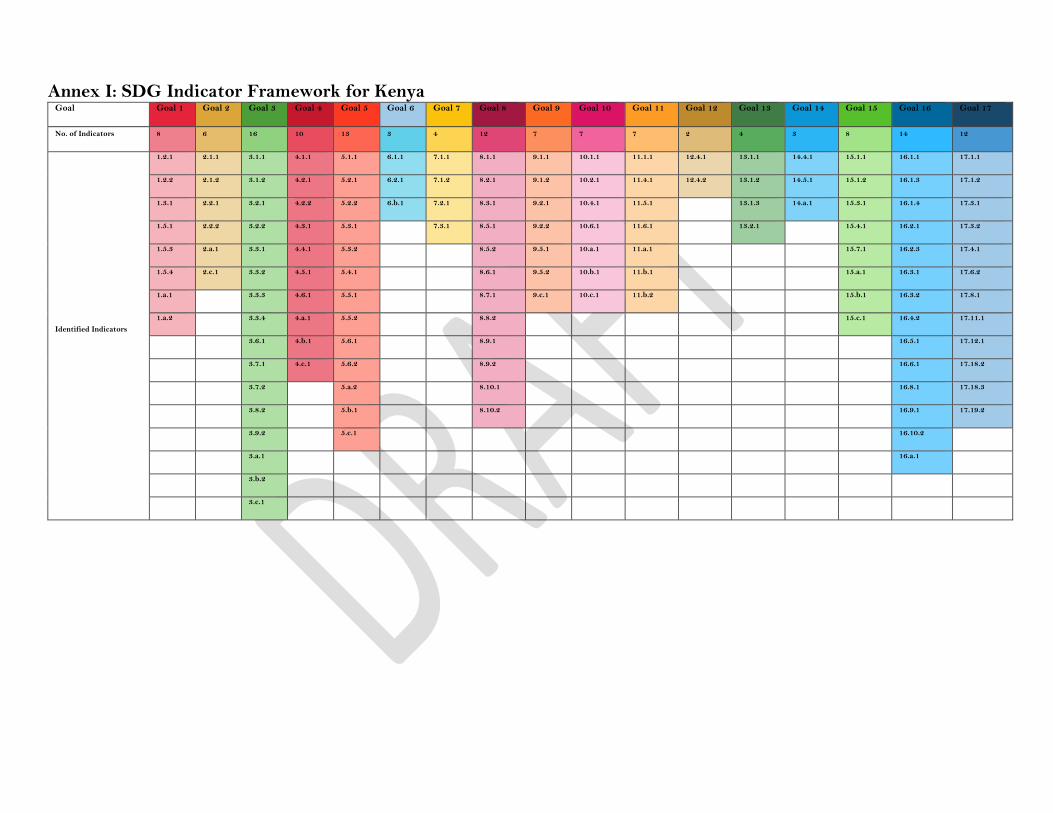
Annex I: SDG Indicator Framework for Kenya Goal Goal 1 Goal 2 Goal 3 Goal 4 Goal 5 Goal 6 Goal 7 Goal 8 Goal 9 Goal 10 Goal 11 Goal 12 Goal 13 Goal 14 Goal 15 Goal 16 Goal 17
No. of Indicators 8 6 16 10 13 3 4 12 7 7 7 2 4 3 8 14 12
Identified Indicators
1.2.1 2.1.1 3.1.1 4.1.1 5.1.1 6.1.1 7.1.1 8.1.1 9.1.1 10.1.1 11.1.1 12.4.1 13.1.1 14.4.1 15.1.1 16.1.1 17.1.1
1.2.2 2.1.2 3.1.2 4.2.1 5.2.1 6.2.1 7.1.2 8.2.1 9.1.2 10.2.1 11.4.1 12.4.2 13.1.2 14.5.1 15.1.2 16.1.3 17.1.2
1.3.1 2.2.1 3.2.1 4.2.2 5.2.2 6.b.1 7.2.1 8.3.1 9.2.1 10.4.1 11.5.1 13.1.3 14.a.1 15.3.1 16.1.4 17.3.1
1.5.1 2.2.2 3.2.2 4.3.1 5.3.1 7.3.1 8.5.1 9.2.2 10.6.1 11.6.1 13.2.1 15.4.1 16.2.1 17.3.2
1.5.3 2.a.1 3.3.1 4.4.1 5.3.2
8.5.2 9.5.1 10.a.1 11.a.1
15.7.1 16.2.3 17.4.1
1.5.4 2.c.1 3.3.2 4.5.1 5.4.1
8.6.1 9.5.2 10.b.1 11.b.1
15.a.1 16.3.1 17.6.2
1.a.1 3.3.3 4.6.1 5.5.1
8.7.1 9.c.1 10.c.1 11.b.2
15.b.1 16.3.2 17.8.1
1.a.2 3.3.4 4.a.1 5.5.2
8.8.2
15.c.1 16.4.2 17.11.1
3.6.1 4.b.1 5.6.1
8.9.1
16.5.1 17.12.1
3.7.1 4.c.1 5.6.2
8.9.2
16.6.1 17.18.2
3.7.2 5.a.2
8.10.1
16.8.1 17.18.3
3.8.2 5.b.1
8.10.2
16.9.1 17.19.2
3.9.2 5.c.1
16.10.2
3.a.1
16.a.1
3.b.2
3.c.1

Annex II: SDG at a Glance Goal
INDICATOR
INDICATOR Description UNITS BASELINE DATA (2009-2014)
2015 2016 Remarks
1 1.2.1 Proportion of population living below the national poverty line, by sex and age
Percent 45.2 (Total); 50.5 (Rural); 33.5 (Urban)
.. .. Census data used to estimate poverty using small area estimation
1 1.2.2 Proportion of men, women and children of all ages living in poverty in all its dimensions according to national definitions
Percent 45 (children <18 yrs); 19 (Urban, <18yrs); 56 (Rural, <18 yrs)
.. .. Refers to Children 0-17 years who are deprived in 3 or more dimensions (Education, Health, Water, Nutrition, Sanitation &). Kenya child Poverty Study (KNBS & Unicef) based on MODA-Multi-overlapping Deprivation Analysis
Same as ind. 11.5.1 and 13.1.1
1.5.1 Number of deaths, missing persons and directly affected persons attributed to disasters per 100,000 population
Number per 100,000
1 2 1
Same as ind. 11.b.1 and 13.1.2
1.5.3 Number of countries that adopt and implement national disaster risk reduction strategies in line with the Sendai Framework for Disaster Risk Reduction 2015-2030
National Disaster Reduction Strategy & Policy 2010, National Disaster Preparedness and
National Disaster Reduction Strategy & Policy 2010, National Disaster Preparedness and Response Strategies
National Disaster Reduction Strategy & Policy 2010, National Disaster Preparedness and Response Strategies

Goal
INDICATOR
INDICATOR Description UNITS BASELINE DATA (2009-2014)
2015 2016 Remarks
Response Strategies
Same as ind. 11.b.2 and 13.1.3
1.5.4 Proportion of local governments that adopt and implement local disaster risk reduction strategies in line with national risk reduction strategies
Percent 100 100 100 All the 47 County Governments have mainstreamed Disaster Risk Management Planning which is implemented through the County Integrated Development Plans (CIDPs)
1 1.a.1 Proportion of domestically generated resources allocated by the government directly to poverty reduction programmes
Percent 2.5 (NG-CDF); 20 (Counties)
2.5 (NG-CDF); 20 (Counties)
2.5 (NG-CDF); 20 (Counties)
Equalization fund and NG-Constituency Development Fund (poverty share) used as proxies
1 1.a.2 Proportion of total government spending on essential services (education, health and social protection)
Percent 21.2 (Total); 15.6 (Education); 2.5(health); 2.9 (Social protection);
20.8 (Total); 15.3 (Education); 1.7 (Health); 3.7 (Social protection);
20.2 (Total); 13.7 (Education); 2.8 (Health); 3.6 (Social protection);
Expenditure on Education, Health and Social Protection as a percentage of total expenditure.
2 2.1.2 Prevalence of moderate or severe food insecurity in the population, based on the Food Insecurity Experience Scale (FIES)
Percent 33.4 .. .. The figure refers to Low food secure and chronic food insecure. Based on 20 counties.
2 2.2.1 Prevalence of stunting (height for age <-2 standard deviation from the median of the World Health Organization (WHO) Child Growth Standards) among children under 5 years of age
Percent 26.0 (Total); 29.7 (Male); 22.3 (Female)
.. .. .. Data not available
2 2.2.2 a)Prevalence of malnutrition (weight for height <-2 standard deviation
Percent 4.0 (Total); 4.4 (Male);
.. .. .. Data not available

Goal
INDICATOR
INDICATOR Description UNITS BASELINE DATA (2009-2014)
2015 2016 Remarks
from the median of the WHO Child Growth Standards) among children under 5 years of age, by type (wasting)
3.7 (Female)
b)Prevalence of malnutrition (weight for height >+2 standard deviation from the median of the WHO Child Growth Standards) among children under 5 years of age, by type (overweight)
Percent 4.1 (Total); 4.7 (Male); 3.5 (Female)
.. .. .. Data not available
2 2.a.1 The agriculture orientation index for government expenditures
Index 0.09 0.05 0.06 Expenditure by COFOG based on fiscal year while GDP is by calendar year
2 2.c.1 Indicator of food price anomalies Percent 5.66 3.29 3.5 Underlying inflation
3 3.1.1 Maternal mortality ratio Deaths per 100,000 live births
362 .. .. .. Data not available
3 3.1.2 Proportion of births attended by skilled health personnel
Percent 61.8 .. .. .. Data not available
3 3.2.1 Under-five mortality rate Deaths per '000 live births
52 .. .. .. Data not available
3 3.2.2 Neonatal mortality rate Deaths per '000 live births
22 .. .. .. Data not available
3 3.3.3 Malaria incidence per 1,000 population
New infections per '000 population
225 173 182 Facility based disease incidence
3 3.6.1 Death rate due to road traffic injuries
deaths per 100,000 populatio
11 12 11

Goal
INDICATOR
INDICATOR Description UNITS BASELINE DATA (2009-2014)
2015 2016 Remarks
n 3 3.7.1 Proportion of women of
reproductive age (aged 15-49 years) who have their need for family planning satisfied with modern methods
Per cent 70.7 .. .. .. Data not available
3 3.7.2 b). Adolescent birth rate (aged 15-19 years) per 1,000 women in that age group
Births per '000 women
96 .. .. .. Data not available
3 3.a.1 Age-standardized prevalence of current tobacco use among persons aged 15 years and older
Percent 11.6 (Total); 19.1 (Male); 4.5 (Female)
.. .. .. Data not available
3 3.c.1 Health worker density and distribution
Per 100,000 population
21 (Doctors); 165 (Nurses)
22 (Doctors); 217 (nurses)
23 (Doctors); 230 (nurses)
4 4.2.2 Participation rate in organized learning (one year before the official primary entry age), by sex
Percent 70.4 74.6 74.9 Early Childhood Development (ECD) Net Enrolment Ratio (36 - 59 months)
4.3.1 a)Technical and Vocational Educational Training (TVET) Enrolment
Number 147,821 (Total); 75,105 (Male); 49,454(Female);
153,314 (Total); 79,846 (Male); 52,927(Female);
202,556 (Total); 91,209 (Male); 74,432(Female);
Tvet
4 b) Adult education Number 330,340 (Total); 113,552 (Male); 216,788 (Female);
306,228 (Total); 102,076 (Male); 204,152(Female)
271,769 (Total); 85,575 (Male); 186,194(Female);
Adult enrolment
4 4.5.1 Parity indices (female/male, rural/urban, bottom/top wealth quintile and others such as disability status, indigenous peoples and conflict-affected, as data become
Ratio 1.05 (Pre-primary) 0.97 (Primary) 0.92
0.97 (Pre-primary) 0.97 (Primary) 0.90 (Secondary) 0.66 (Tertiary), 0.97 (University)
0.96 (Pre-primary) 0.97 (Primary) 0.95 (Secondary) 0.82 (Tertiary), 0.96 (University)
Enrolment by female/male

Goal
INDICATOR
INDICATOR Description UNITS BASELINE DATA (2009-2014)
2015 2016 Remarks
available) for all education indicators on this list that can be disaggregated
(Secondary) 0.66 (Tertiary), 1.05 (University)
4 4.6.1 Proportion of population in a given age group achieving at least a fixed level of proficiency in functional (a) literacy and (b) numeracy skills, by sex
Percent 89.1 (Total); 87.8 (Women); 92.4 (Men)
.. .. Literacy (15 - 49 years)
4 4.a.1 Proportion of schools with access to: (a) electricity; (b) the Internet for pedagogical purposes; (c) computers for pedagogical purposes; (d) adapted infrastructure and materials for students with disabilities; (e) basic drinking water; (f) single-sex basic sanitation facilities; and (g) basic handwashing facilities (as per the WASH indicator definitions)
Percent 43.8 (Primary); 75.3 (Secondary);
.. .. Proportion of Schools connected to Electricity.
4 4.c.1 Proportion of teachers in: (a) pre- primary; (b) primary; (c) lower secondary; and (d) upper secondary education who have received at least the minimum organized teacher training (e.g. pedagogical training) pre-service or in- service required for teaching at the relevant level in a given country
Percent 84.1 (Pre-primary); 100 (Primary); 100 (Secondary)
86.7 (Pre-primary); 100 (Primary); 99.8 (Secondary)
88.2 (Pre-primary); 100 (Primary); 99.8 (Secondary)
For primary and secondary education, refers to public schools only
5 5.1.1 Whether or not legal frameworks are in place to promote, enforce and monitor equality and non-discrimination on the basis of sex
Gender Development Policy, 2011
Gender Development Policy, 2011
Gender Development Policy, 2011
5 5.2.1 a). Proportion of ever-partnered women and girls aged 15 years and older subjected to physical, sexual or
Percent 36.9 .. .. .. Data not available

Goal
INDICATOR
INDICATOR Description UNITS BASELINE DATA (2009-2014)
2015 2016 Remarks
psychological violence by a current or former intimate partner in the previous 12 months, by form of violence and by age (Physical Violence) b).Proportion of ever-partnered women and girls aged 15 years and older subjected to physical, sexual or psychological violence by a current or former intimate partner in the previous 12 months, by form of violence and by age (Sexual Violence)
Percent 13.3 .. .. .. Data not available
c).Proportion of ever-partnered women and girls aged 15 years and older subjected to physical, sexual or psychological violence by a current or former intimate partner in the previous 12 months, by form of violence and by age (Emotional/Psychological Violence)
Percent 32.4 .. .. .. Data not available
d).Proportion of ever-partnered women and girls aged 15 years and older subjected to physical, sexual or psychological violence by a current or former intimate partner in the previous 12 months, by form of violence and by age (Physical or Sexual or Emotional/Psychological Violence)
Percent 47.1 .. .. .. Data not available
e).Proportion of ever-partnered women and girls aged 15 years and older subjected to physical, sexual or psychological violence by a current or former intimate partner in the previous 12 months, by form of violence and by age (Physical and Sexual and Emotional/Psychological Violence)
Percent 8.5 .. .. .. Data not available

Goal
INDICATOR
INDICATOR Description UNITS BASELINE DATA (2009-2014)
2015 2016 Remarks
5 5.2.2 Proportion of women and girls aged 15 years and older subjected to sexual violence by persons other than an intimate partner in the previous 12 months, by age and place of occurrence
Percent 22.7 .. .. Refers to those aged 15-49 years who ever experienced sexual violence
5 5.3.1 Proportion of women aged 20-24 years who were married or in a union before age 15 and before age 18
Percent 22.9 .. .. .. Data not available
5 5.3.2 Proportion of girls and women aged 15-49 years who have undergone female genital mutilation/cutting, by age
Percent 21 .. .. .. Data not available
5 5.5.1 a). Proportion of seats held by women in national parliaments and local governments (National Assembly)
Percent 19.8 (National Assembly); 26.9 (Senators); 0.0 (Governors); 19.2 (Deputy Governors)
19.8 (National Assembly); 26.9 (Senators); 0.0 (Governors); 19.2 (Deputy Governors)
19.8 (National Assembly); 26.9 (Senators); 0.0 (Governors); 19.2 (Deputy Governors)
5 5.6.2 Number of countries with laws and regulations that guarantee fulland equal access to women and men aged 15 years and older to sexual and reproductive health care, information and education
Number 7 (Kenya vision 2030; Poverty Reduction strategy; SDGs; National Health Policy; National Health Sector Strategic plan; Public Service Reform
8 (The Constitution of Kenya; Kenya vision 2030; Poverty Reduction strategy; SDGs; National Health Policy; National Health Sector Strategic plan; Public Service Reform strategy; Health Sector Reform
.. .. Data not available

Goal
INDICATOR
INDICATOR Description UNITS BASELINE DATA (2009-2014)
2015 2016 Remarks
strategy; Health Sector Reform
5 5.a.2 Proportion of countries where the legal framework (including customary law) guarantees women’s equal rights to land ownership and/or control
Constitution 2010 Article 45 (3)
Constitution 2010 Article 45 (3)
Constitution 2010 Article 45 (3)
5 5.b.1 Proportion of individuals who own a mobile telephone, by sex
Percent 74 (Individuals) 86 (Households)
.. .. .. Data not available
5 5.c.1 Proportion of countries with systems to track and make public allocations for gender equality and women’s empowerment
KSh Million
1,736.20 (WEF); 4,240.40 (Uwezo Fund)
1,586.50 (WEF) ; 5,115.10 (Uwezo Fund)
2,434.10 (WEF) ; 5,373.90 (Uwezo Fund)
Financial Year (FY) Women Enterprise Fund (WEF) Economic Survey Chapter 3 Table 3.31
6 6.1.1 Proportion of population using safely managed drinking water services
Percent 66.9 (Households)
.. .. .. Data not available
6 6.2.1 a)Proportion of population using safely managed sanitation services
Percent 24.7 (Households)
.. .. .. Data not available
b) Proportion of population with hand-washing facility with soap and water
Percent 16.7 (Households)
.. .. .. Data not available
7 7.1.1 Proportion of population with access to electricity
Percent 36.0 (Households)
.. .. .. Data not available
7 7.1.2 Proportion of population with primary reliance on clean fuels and technology
Percent 11.9 (Cooking)
.. .. Refers to percentage of Households. 'clean' includes only Electricity (0.4) and LPG/biogas (11.5);
7 7.2.1 Renewable energy share in the total final energy consumption
Percent 12.4 11.8 11.8
7 7.3.1 Energy intensity measured in terms of primary energy and GDP
Tonnes of Oil
0.000106 0.00014 0.00014 Total energy supply over GDP; modern

Goal
INDICATOR
INDICATOR Description UNITS BASELINE DATA (2009-2014)
2015 2016 Remarks
equivalent per USD
energy only
8 8.1.1 Annual growth rate of real GDP per capita
Percent 2.45 2.97 3.12
8 8.2.1 Annual growth rate of real GDP per employed person
Percent -0.55 -0.17 0.33 Real GDP (Constant 2009 prices). Employment excludes small scale farming and pastoralist activities.
8 8.3.1 Proportion of informal employment in non-agriculture employment, by sex
Percent 82.7 82.8 83.2
8 8.5.2 Unemployment rate, by sex, age and persons with disabilities
Percent 9.7(Total) 9.9(Male) 9.4(Female)
.. .. .. Data not available
8 8.7.1 Proportion and number of children aged 5-17 years engaged in child labour, by sex and age
Percent, Number
34.5 .. .. .. Data not available
8 8.8.2 Level of national compliance of labour rights (freedom of association and collective bargaining) based on International Labour Organization (ILO) textual sources and national legislation, by sex and migrant status
Number 328 (CBAs registered)
230 (CBAs registered)
298 (CBAs registered)
8 8.9.1 Tourism direct GDP as a proportion of total GDP and in growth rate
Percent 0.9 0.8 0.7 As a proportion. Accomodation & food Services Sectors
8 8.9.2 Proportion of jobs in sustainable tourism industries out of total jobs
Percent 3.09 3.07 3.03
8 8.10.1 (a)Number of commercial bank branches per 100,000 adults and (b) number of automated teller machines (ATMs) per 100,000 adults
Number per 100,000 adults
7 (bank branches) 12 (ATMs)
7 (bank branches) 12 (ATMs)
.. .. Data not available

Goal
INDICATOR
INDICATOR Description UNITS BASELINE DATA (2009-2014)
2015 2016 Remarks
9 9.1.2 Passenger and freight volumes, by mode of transport
000 tonnes
1,509 (Railway freight); 279.9 (Air); 24,875 (Water)
1,575(Railway freight); 263.6 (Air); 26,732 (Water)
1,429(Railway freight); 250.0 (Air); 27,364 (Water)
000 Passenger
3,845 (Railway); 8,882 (Air)
2,359(Railway); 8,993.2 (Air)
2,186(Railway); 10,043.8 (Air)
9 9.2.1 Manufacturing value added as a proportion of GDP and per capita
Percent 10 9.4 9.2 As a proportion of GDP
KSh/Person
0.013 0.013 0.014 Per Capita
9 9.2.2 Manufacturing employment as a proportion of total employment
Percent 12.1 11.9 11.8
9 9.5.1 Research and development expenditure as a proportion of GDP
Percent 0.48 .. .. .. Data not available
9 9.5.2 Researchers (in full-time equivalent) per million inhabitants
Per million inhabitants
100 .. .. .. Data not available
9 9.c.1 Proportion of population covered by a mobile network, by technology
Percent 86 94 95 ES 2016 (Mobile penetration 3 yrs +)
10 10.4.1 Labour share of GDP, comprising wages and social protection transfers
Percent 31.3 30.2 28.8 Compenstion of employee to be used as a proxy to the labour share.
10 10.b.1 Total resource flows for development, by recipient and donor countries and type of flow (e.g. official development assistance, foreign direct investment and other flows)
KSh Million
28,117.50 29,596.70 51,470.6* External Grants , * (Estimate)
10 10.c.1 Remittance costs as a proportion of the amount remitted
Percent .. .. 8.47 Estimate
11 11.1.1 Proportion of urban population living in slums, informal settlements or inadequate housing
Percent 7.9 .. .. .. Data not available

Goal
INDICATOR
INDICATOR Description UNITS BASELINE DATA (2009-2014)
2015 2016 Remarks
11 11.4.1 Total expenditure (public and private) per capita spent on the preservation, protection and conservation of all cultural and natural heritage, by type of heritage (cultural, natural, mixed and World Heritage Centre designation), level of government (national, regional and local/municipal), type of expenditure (operating expenditure/investment) and type of private funding (donations in kind, private non-profit sector and sponsorship)
KSh/person
0.01 0.01 0.02 Refers to Public Expendetiture on Recreation, Culture and Religion
Same as ind. 1.5.1 and 13.1.1
11.5.1 Number of deaths, missing persons and persons affected by disaster per 100,000 people
Number per 100,000
1 2 1
11 11.6.1 Proportion of urban solid waste regularly collected and with adequate final discharge out of total urban solid waste generated, by cities
Percent 44 .. .. Nairobi City County Only
Same as ind. 1.5.3 and 13.1.2
11.b.1 Number of countries that adopt and implement national disaster risk reduction strategies in line with the Sendai Framework for Disaster Risk Reduction 2015-2030
National Disaster Reduction Strategy & Policy 2010, National Disaster Preparedness and Response Strategies
National Disaster Reduction Strategy & Policy 2010, National Disaster Preparedness and Response Strategies
National Disaster Reduction Strategy & Policy 2010, National Disaster Preparedness and Response Strategies
Same as ind.
11.b.2 Proportion of local governments that adopt and implement local disaster risk reduction strategies in line with
Percent 100 100 100 All the 47 County Governments have mainstreamed

Goal
INDICATOR
INDICATOR Description UNITS BASELINE DATA (2009-2014)
2015 2016 Remarks
1.5.4 and 13.1.3
national risk reduction strategies Disaster Risk Management Planning which is implemented through the County Integrated Development Plans (CIDPs)
Same as ind. 1.5.1 and 11.5.
1
13.1.1 Number of deaths, missing persons and persons affected by disaster per 100,000 people
Number per 100,000
1 2 1
Same as ind. 1.5.3 and 11.b.
1
13.1.2 Number of countries that adopt and implement national disaster risk reduction strategies in line with the Sendai Framework for Disaster Risk Reduction 2015-2030
National Disaster Reduction Strategy & Policy 2010, National Disaster Preparedness and Response Strategies
National Disaster Reduction Strategy & Policy 2010, National Disaster Preparedness and Response Strategies
National Disaster Reduction Strategy & Policy 2010, National Disaster Preparedness and Response Strategies
Same as ind. 1.5.4 and 11.b.
2
13.1.3 Proportion of local governments that adopt and implement local disaster
risk reduction strategies in line with national risk reduction strategies
Percent 100 100 100 All the 47 County Governments have mainstreamed Disaster Risk Management Planning which is implemented through the County Integrated Development Plans (CIDPs)
13 13.2.1 Number of countries that have Number National National Climate National Climate

Goal
INDICATOR
INDICATOR Description UNITS BASELINE DATA (2009-2014)
2015 2016 Remarks
communicated the establishment or operationalization of an integrated policy/strategy/plan which increases their ability to adapt to the adverse impacts of climate change, and foster climate resilience and low greenhouse gas emissions development in a manner that does not threaten food production (including a national adaptation plan, nationally determined contribution, national communication, biennial update report or other)
Climate Change Response Strategy 2010; National Climate Change Action Plan 2013-2017;
Change Response Strategy 2010; National Climate Change Action Plan 2013-2017; Kenya Independent Nationally Determined Contribution(INDC)2015; Kenya National Adaptation Plan 2015-2030. in place for to implement the strategy
Change Response Strategy 2010; National Climate Change Action Plan 2013-2017; Kenya Independent Nationally Determined Contribution(INDC)2015; The Climate Change Act 2016; National Climate Change Framework policy 2016; Kenya National Adaptation Plan 2015-2030. in place for to implement the strategy
14 14.4.1 Proportion of fish stocks within Biologically sustainable levels
Tonnes 168,413 144,325 128,645 Fish landed is used as a proxy
14 14.5.1 Coverage of protected areas in relation to marine areas
Percent 10 .. .. Study done by KMFRI in collaboration with UNEP &World Conservation Monitoring Centre
15 15.1.1 Forest area as a proportion of total land area
Percent 5.96 5.97 5.95
16 16.1.1 Number of victims of intentional homicide per 100,000 population, by sex and age
Per 100,000 population
6 6 6 Homicide crimes as a proxy
16 16.1.3 Proportion of population subjected to physical, psychological or sexual violence in the previous 12 months
Percent 16.3 (Physical violence) 5.3 (Sexual violence)
.. .. .. Data not available
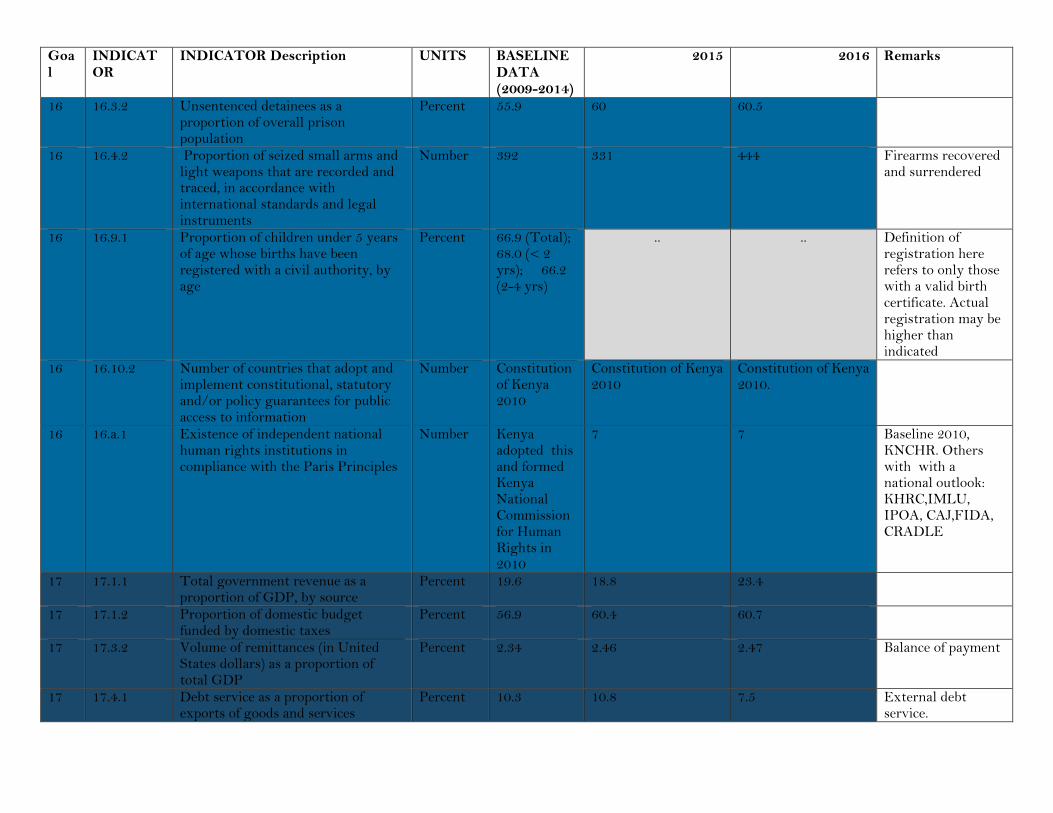
Goal
INDICATOR
INDICATOR Description UNITS BASELINE DATA (2009-2014)
2015 2016 Remarks
16 16.3.2 Unsentenced detainees as a proportion of overall prison population
Percent 55.9 60 60.5
16 16.4.2 Proportion of seized small arms and light weapons that are recorded and traced, in accordance with international standards and legal instruments
Number 392 331 444 Firearms recovered and surrendered
16 16.9.1 Proportion of children under 5 years of age whose births have been registered with a civil authority, by age
Percent 66.9 (Total); 68.0 (< 2 yrs); 66.2 (2-4 yrs)
.. .. Definition of registration here refers to only those with a valid birth certificate. Actual registration may be higher than indicated
16 16.10.2 Number of countries that adopt and implement constitutional, statutory and/or policy guarantees for public access to information
Number Constitution of Kenya 2010
Constitution of Kenya 2010
Constitution of Kenya 2010.
16 16.a.1 Existence of independent national human rights institutions in compliance with the Paris Principles
Number Kenya adopted this and formed Kenya National Commission for Human Rights in 2010
7 7 Baseline 2010, KNCHR. Others with with a national outlook: KHRC,IMLU, IPOA, CAJ,FIDA, CRADLE
17 17.1.1 Total government revenue as a proportion of GDP, by source
Percent 19.6 18.8 23.4
17 17.1.2 Proportion of domestic budget funded by domestic taxes
Percent 56.9 60.4 60.7
17 17.3.2 Volume of remittances (in United States dollars) as a proportion of total GDP
Percent 2.34 2.46 2.47 Balance of payment
17 17.4.1 Debt service as a proportion of exports of goods and services
Percent 10.3 10.8 7.5 External debt service.

Goal
INDICATOR
INDICATOR Description UNITS BASELINE DATA (2009-2014)
2015 2016 Remarks
17 17.6.2 Fixed internet broadband subscription per 100 inhabitants, by speed
Internet subscribers per 100 inhabitants
42.2 59.8 64.9 Wireless and fixed
17 17.8.1 Proportion of individuals using the Internet
Percent 60.8 80.4 86.7
17 17.11.1 Developing countries’ and least developed countries’ share of global exports
KSh mn 537,236 581,045 578,067 Values refer to Kenya's exports
17 17.18.2 Number of countries that have national statistical legislation that complies with the Fundamental Principles of Official Statistics
Number Statistics Act, 2006
Statistics Act, 2006 Statistics Act, 2006 Kenya's Statistics Act 2006, complies with the Fundamental Principles of Official Statistics
17 17.18.3 Number of countries with a national statistical plan that is fully funded and under implementation, by source of funding
Number KNBS SP (GoK)
KNBS SP (GoK) KNBS SP (GoK) KNBS Strategic Plan 2013-2017, funded fully by Government
17 17.19.2 Proportion of countries that (a) have conducted at least one population and housing census in the last 10 years; and (b) have achieved 100 per cent birth registration and 80 per cent death registration
a) Year 2009 (38,412,088)
2009 2009
birth registration (Percent )
70.2 .. .. .. Data not available
Death registration (Percent )
45.8 .. .. .. Data not available