ImperialCanadianBondPool InterimFinancialReports(unaudited) · 2016-08-26 ·...
26
The accompanying notes are an integral part of these financial statements. Imperial Canadian Bond Pool Interim Financial Reports (unaudited) for the period ended June 30, 2016 † Securities Lending The tables that follow indicate the Pool had assets involved in securities lending transactions outstanding as at June 30, 2016 and December 31, 2015. Aggregate Value of Securities on Loan ($000s) Aggregate Value of Collateral for Loan ($000s) x x June 30, 2016 2,898,878 2,988,762 x December 31, 2015 2,646,636 2,738,771 x Collateral Type* ($000s) i ii iii iv x x June 30, 2016 2,082,944 905,818 – – x December 31, 2015 1,454,522 1,281,415 – 2,834 x x * See note 2j for Collateral Type definitions. Organization of the Fund (note 1) The Pool was established on February 1, 1991 (Date Established). Inception Date x x Class A October 15, 1998 x x Statements of Financial Position (unaudited) (in 000s, except per unit amounts) As at June 30, 2016 and December 31, 2015 (note 1) June 30, 2016 December 31, 2015 x x x x Assets x x x Current assets x Investments (non-derivative financial assets) † (notes 2 and 3) $ 12,537,197 $ 11,611,068 x Cash including foreign currency holdings, at fair value 2,674 7,739 x Interest receivable 71,051 72,707 x Receivable for portfolio securities sold 53,281 34 x Receivable for units issued 11,578 6,462 x Other receivables 7 6 x Derivative assets 1,348 302 x x x Total Assets 12,677,136 11,698,318 x x x Liabilities x x x Current liabilities x Payable for portfolio securities purchased 20,142 11,116 x Payable for units redeemed 5,254 6,561 x Distributions payable to holders of redeemable units 2,111 – x Derivative liabilities 7,250 8,853 x x x Total Liabilities 34,757 26,530 x x x Net Assets Attributable to Holders of Redeemable Units (note 5) $ 12,642,379 $ 11,671,788 x x x Net Assets Attributable to Holders of Redeemable Units per Class x Class A $ 12,642,379 $ 11,671,788 x x x Net Assets Attributable to Holders of Redeemable Units per Unit (note 5) x Class A $ 11.89 $ 11.58 x 1
Transcript of ImperialCanadianBondPool InterimFinancialReports(unaudited) · 2016-08-26 ·...
The accompanying notes are an integral part of these financial statements.
Imperial Canadian Bond Pool
Interim Financial Reports (unaudited)for the period ended June 30, 2016
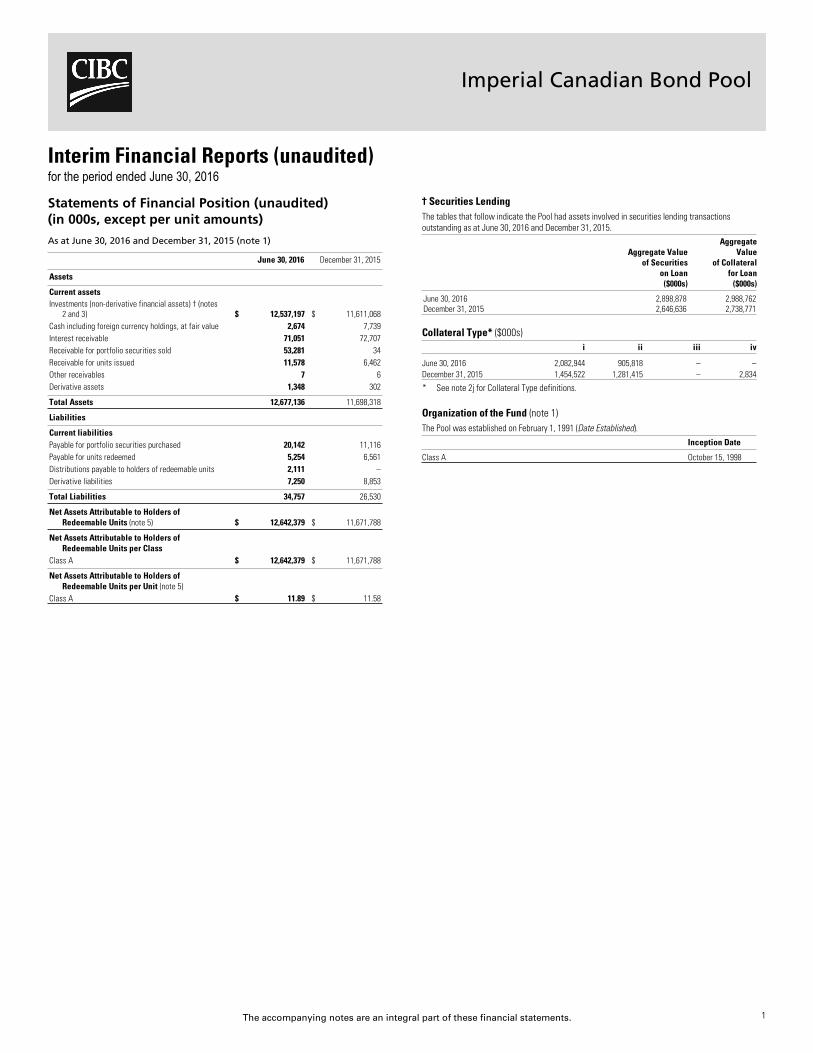
† Securities LendingThe tables that follow indicate the Pool had assets involved in securities lending transactionsoutstanding as at June 30, 2016 and December 31, 2015.
Aggregate Valueof Securities
on Loan($000s)
AggregateValue
of Collateralfor Loan
($000s)x
x
June 30, 2016 2,898,878 2,988,762x
December 31, 2015 2,646,636 2,738,771x
Collateral Type* ($000s)i ii iii iv
xx
June 30, 2016 2,082,944 905,818 – –x
December 31, 2015 1,454,522 1,281,415 – 2,834x
x
* See note 2j for Collateral Type definitions.
Organization of the Fund (note 1)The Pool was established on February 1, 1991 (Date Established).
Inception Datexx
Class A October 15, 1998xx
Statements of Financial Position (unaudited)(in 000s, except per unit amounts)
As at June 30, 2016 and December 31, 2015 (note 1)
June 30, 2016 December 31, 2015x
xxx
Assetsxxx
Current assetsx
Investments (non-derivative financial assets) † (notes2 and 3) $ 12,537,197 $ 11,611,068
x
Cash including foreign currency holdings, at fair value 2,674 7,739x
Interest receivable 71,051 72,707x
Receivable for portfolio securities sold 53,281 34x
Receivable for units issued 11,578 6,462x
Other receivables 7 6x
Derivative assets 1,348 302xxx
Total Assets 12,677,136 11,698,318xxx
Liabilitiesxxx
Current liabilitiesx
Payable for portfolio securities purchased 20,142 11,116x
Payable for units redeemed 5,254 6,561x
Distributions payable to holders of redeemable units 2,111 –x
Derivative liabilities 7,250 8,853xxx
Total Liabilities 34,757 26,530xxx
Net Assets Attributable to Holders ofRedeemable Units (note 5) $ 12,642,379 $ 11,671,788
xxx
Net Assets Attributable to Holders ofRedeemable Units per Class
x
Class A $ 12,642,379 $ 11,671,788xxx
Net Assets Attributable to Holders ofRedeemable Units per Unit (note 5)
x
Class A $ 11.89 $ 11.58x
1

The accompanying notes are an integral part of these financial statements.
Imperial Canadian Bond Pool
Statements of Comprehensive Income (unaudited)(in 000s, except per unit amounts)
For the periods ended June 30, 2016 and 2015 (note 1)
June 30, 2016 June 30, 2015x
x
Net Gain (loss) on Financial Instrumentsx
Interest for distribution purposes $ 203,277 $ 188,697x
Other changes in fair value of investments andderivatives
x
Net realized gain (loss) on sale of investments andderivatives 9,349 70,946
x
Net realized gain (loss) on foreign currency (notes 2fand g) 21,666 (31,052)
x
Net change in unrealized appreciation (depreciation)of investments and derivatives 305,648 18,736
xxx
Net Gain (loss) on Financial Instruments ± 539,940 247,327xx
x
Other Incomex
Foreign exchange gain (loss) on cash (270) 51x
Securities lending revenue ±± 2,198 1,605xxx
1,928 1,656xx
x
Expenses (note 6)x
Management fees ±±± 16,531 14,752x
Audit fees 5 5x
Custodial fees 116 105x
Independent review committee fees 11 18x
Legal fees 62 44x
Regulatory fees 157 117x
Transaction costs – –x
Unitholder reporting costs 1,726 1,391x
Withholding taxes (note 7) 23 –x
Other expenses 54 40xxx
18,685 16,472xx
x
Expenses waived/absorbed by the Manager (11,885) (10,572)xx
x
6,800 5,900xx
x
Increase (Decrease) in Net Assets Attributable toHolders of Redeemable Units (excludingdistributions) 535,068 243,083
xx
x
Increase (Decrease) in Net Assets Attributable toHolders of Redeemable Units per Class(excluding distributions)
x
Class A $ 535,068 $ 243,083xxx
Average Number of Units Outstanding for theperiod per Class
x
Class A 1,034,957 909,153xxx
Increase (Decrease) in Net Assets Attributable toHolders of Redeemable Units per Unit(excluding distributions)
x
Class A $ 0.52 $ 0.26x
x
± Net Gain (Loss) on Financial Instruments(in 000s)
Net gains (losses)
Category June 30, 2016 June 30, 2015x..
Financial assets at FVTPL..
Held for Trading $ 24,939 $ (27,326)..
Designated at Inception 515,001 274,653......
Total financial assets at FVTPL $ 539,940 $ 247,327..
±± Securities Lending Revenue (note 2j)June 30, 2016 June 30, 2015
(in 000s)
% of Grosssecurities
lending revenue (in 000s)
% of Grosssecurities
lending revenuexx
Gross securities lending revenue $ 7,557 100.0 $ 9,581 100.0x
Interest paid on collateral 4,334 57.3 7,214 75.2x
Withholding taxes 83 1.1 74 0.8x
Agent fees - Bank of New YorkMellon Corp. (The) 942 12.5 688 7.2
xxx
Securities lending revenue $ 2,198 29.1 $ 1,605 16.8xx
±±± Maximum Chargeable Annual Management Fee Rates (note 6)xx
Class A 0.25%xx
Service Provider (note 9)The amounts paid by the Pool (including all applicable taxes) to CIBC Mellon Trust Company forcustodial fees, and to CIBC Mellon Global Securities Services Company (CIBC GSS) for securitieslending, fund accounting and reporting, and portfolio valuation (all net of absorptions) for the periodsended June 30, 2016 and 2015 were as follows:
2016 2015x
x
($000s) 942 688xx
2
The accompanying notes are an integral part of these financial statements.
Imperial Canadian Bond Poolx
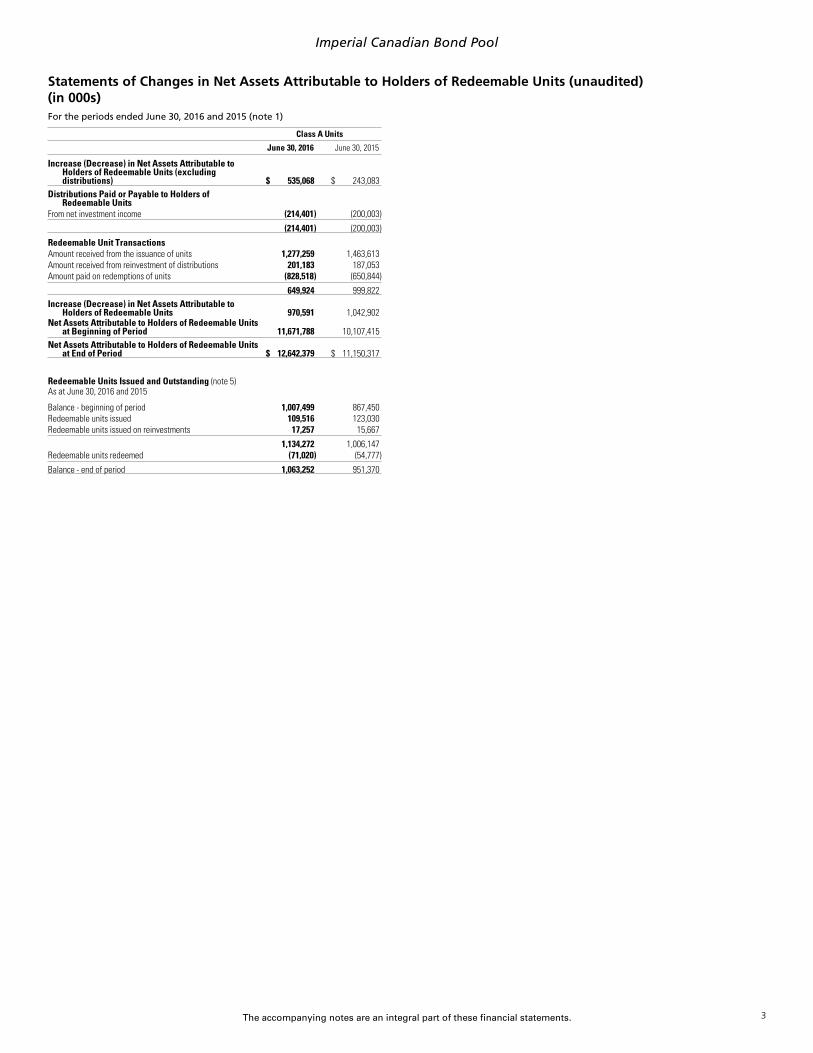
Statements of Changes in Net Assets Attributable to Holders of Redeemable Units (unaudited)(in 000s)For the periods ended June 30, 2016 and 2015 (note 1)
Class A Units
June 30, 2016 June 30, 2015xx.
Increase (Decrease) in Net Assets Attributable toHolders of Redeemable Units (excludingdistributions) $ 535,068 $ 243,083
xxx.
Distributions Paid or Payable to Holders ofRedeemable Units
x.
From net investment income (214,401) (200,003)x.xx
(214,401) (200,003)xxx.
Redeemable Unit Transactionsx.
Amount received from the issuance of units 1,277,259 1,463,613x.
Amount received from reinvestment of distributions 201,183 187,053x.
Amount paid on redemptions of units (828,518) (650,844)x.xx
649,924 999,822xxx.
Increase (Decrease) in Net Assets Attributable toHolders of Redeemable Units 970,591 1,042,902
x.
Net Assets Attributable to Holders of Redeemable Unitsat Beginning of Period 11,671,788 10,107,415
x.xx
Net Assets Attributable to Holders of Redeemable Unitsat End of Period $ 12,642,379 $ 11,150,317
xxx.
Redeemable Units Issued and Outstanding (note 5)x.
As at June 30, 2016 and 2015x.
Balance - beginning of period 1,007,499 867,450x.
Redeemable units issued 109,516 123,030x.
Redeemable units issued on reinvestments 17,257 15,667x.xx
1,134,272 1,006,147x.
Redeemable units redeemed (71,020) (54,777)x.xx
Balance - end of period 1,063,252 951,370xx
x
3

The accompanying notes are an integral part of these financial statements.
Imperial Canadian Bond Poolx
x
Statements of Cash Flows (unaudited)(in 000s)For the periods ended June 30, 2016 and 2015 (note 1)
June 30, 2016 June 30, 2015xx.
Cash Flows from Operating Activitiesx.
Increase (Decrease) in Net Assets Attributable to Holders of Redeemable Units from Operations (excluding distributions) $ 535,068 $ 243,083x.
Adjustments for:x.
Foreign exchange loss (gain) on cash 270 (51)x.
Net realized (gain) loss on sale of investments and derivatives (9,349) (70,946)x.
Net change in unrealized (appreciation) depreciation of investments and derivatives (305,648) (18,736)x.
Purchase of investments (6,079,045) (7,033,019)x.
Proceeds from the sale of investments 5,421,043 6,090,159x.
Interest receivable 1,656 (3,036)x.
Other receivables (1) –x.xx
(436,006) (792,546)xxx.
Cash Flows from Financing Activitiesx.
Amount received from the issuance of units 1,272,143 1,459,057x.
Amount paid on redemptions of units (829,825) (652,875)x.
Distributions paid to unitholders (11,107) (10,759)x.xx
431,211 795,423xxx.
Increase (Decrease) in Cash during the Period (4,795) 2,877xxx.
Foreign exchange loss (gain) on cash (270) 51xxx.
Cash (Bank Overdraft) at Beginning of Period 7,739 3,985xxx.
Cash (Bank Overdraft) at End of Period $ 2,674 $ 6,913x
x.
Interest received $ 204,933 $ 185,661
4
The accompanying notes are an integral part of these financial statements.
Imperial Canadian Bond Pool
x
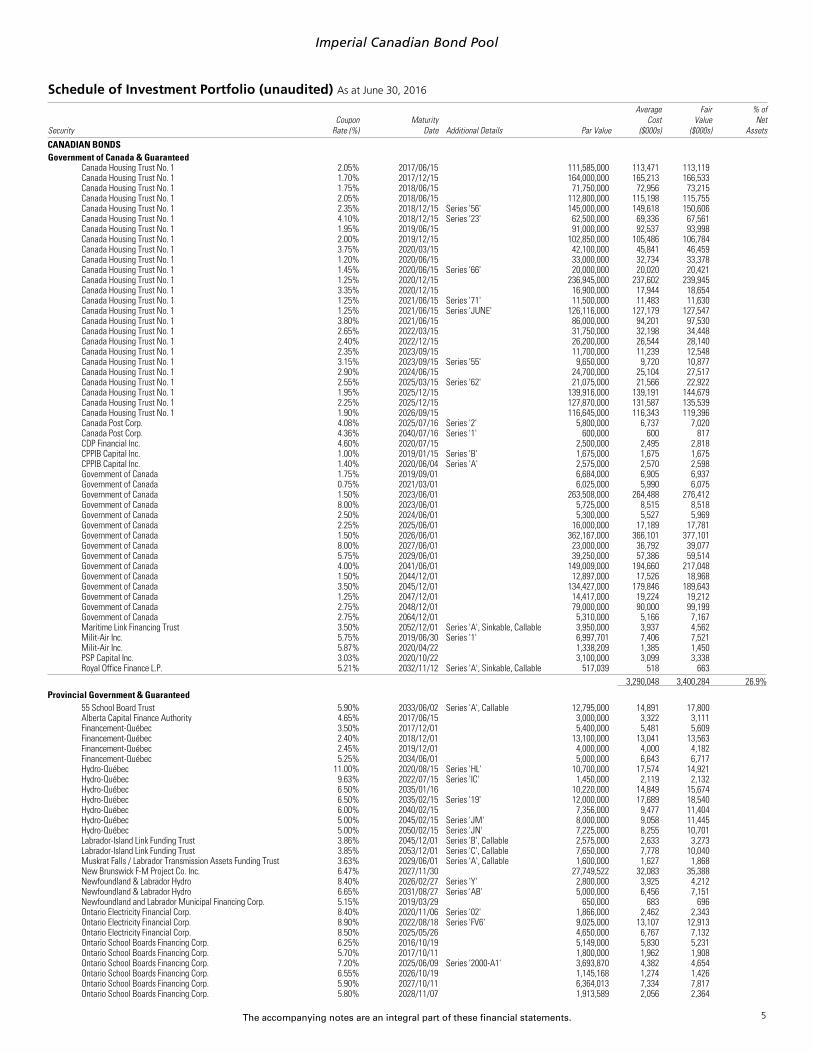
Schedule of Investment Portfolio (unaudited) As at June 30, 2016
SecurityCoupon
Rate (%)Maturity
Date Additional Details Par Value
AverageCost
($000s)
FairValue
($000s)
% ofNet
Assetsx
CANADIAN BONDS..
Government of Canada & Guaranteed..
Canada Housing Trust No. 1 2.05% 2017/06/15 111,585,000 113,471 113,119..
Canada Housing Trust No. 1 1.70% 2017/12/15 164,000,000 165,213 166,533..
Canada Housing Trust No. 1 1.75% 2018/06/15 71,750,000 72,956 73,215..
Canada Housing Trust No. 1 2.05% 2018/06/15 112,800,000 115,198 115,755..
Canada Housing Trust No. 1 2.35% 2018/12/15 Series '56' 145,000,000 149,618 150,606..
Canada Housing Trust No. 1 4.10% 2018/12/15 Series '23' 62,500,000 69,336 67,561..
Canada Housing Trust No. 1 1.95% 2019/06/15 91,000,000 92,537 93,998..
Canada Housing Trust No. 1 2.00% 2019/12/15 102,850,000 105,486 106,784..
Canada Housing Trust No. 1 3.75% 2020/03/15 42,100,000 45,841 46,459..
Canada Housing Trust No. 1 1.20% 2020/06/15 33,000,000 32,734 33,378..
Canada Housing Trust No. 1 1.45% 2020/06/15 Series '66' 20,000,000 20,020 20,421..
Canada Housing Trust No. 1 1.25% 2020/12/15 236,945,000 237,602 239,945..
Canada Housing Trust No. 1 3.35% 2020/12/15 16,900,000 17,944 18,654..
Canada Housing Trust No. 1 1.25% 2021/06/15 Series '71' 11,500,000 11,483 11,630..
Canada Housing Trust No. 1 1.25% 2021/06/15 Series 'JUNE' 126,116,000 127,179 127,547..
Canada Housing Trust No. 1 3.80% 2021/06/15 86,000,000 94,201 97,530..
Canada Housing Trust No. 1 2.65% 2022/03/15 31,750,000 32,198 34,448..
Canada Housing Trust No. 1 2.40% 2022/12/15 26,200,000 26,544 28,140..
Canada Housing Trust No. 1 2.35% 2023/09/15 11,700,000 11,239 12,548..
Canada Housing Trust No. 1 3.15% 2023/09/15 Series '55' 9,650,000 9,720 10,877..
Canada Housing Trust No. 1 2.90% 2024/06/15 24,700,000 25,104 27,517..
Canada Housing Trust No. 1 2.55% 2025/03/15 Series '62' 21,075,000 21,566 22,922..
Canada Housing Trust No. 1 1.95% 2025/12/15 139,916,000 139,191 144,679..
Canada Housing Trust No. 1 2.25% 2025/12/15 127,870,000 131,587 135,539..
Canada Housing Trust No. 1 1.90% 2026/09/15 116,645,000 116,343 119,396..
Canada Post Corp. 4.08% 2025/07/16 Series '2' 5,800,000 6,737 7,020..
Canada Post Corp. 4.36% 2040/07/16 Series '1' 600,000 600 817..
CDP Financial Inc. 4.60% 2020/07/15 2,500,000 2,495 2,818..
CPPIB Capital Inc. 1.00% 2019/01/15 Series 'B' 1,675,000 1,675 1,675..
CPPIB Capital Inc. 1.40% 2020/06/04 Series 'A' 2,575,000 2,570 2,598..
Government of Canada 1.75% 2019/09/01 6,684,000 6,905 6,937..
Government of Canada 0.75% 2021/03/01 6,025,000 5,990 6,075..
Government of Canada 1.50% 2023/06/01 263,508,000 264,488 276,412..
Government of Canada 8.00% 2023/06/01 5,725,000 8,515 8,518..
Government of Canada 2.50% 2024/06/01 5,300,000 5,527 5,969..
Government of Canada 2.25% 2025/06/01 16,000,000 17,189 17,781..
Government of Canada 1.50% 2026/06/01 362,167,000 366,101 377,101..
Government of Canada 8.00% 2027/06/01 23,000,000 36,792 39,077..
Government of Canada 5.75% 2029/06/01 39,250,000 57,386 59,514..
Government of Canada 4.00% 2041/06/01 149,009,000 194,660 217,048..
Government of Canada 1.50% 2044/12/01 12,897,000 17,526 18,968..
Government of Canada 3.50% 2045/12/01 134,427,000 179,846 189,643..
Government of Canada 1.25% 2047/12/01 14,417,000 19,224 19,212..
Government of Canada 2.75% 2048/12/01 79,000,000 90,000 99,199..
Government of Canada 2.75% 2064/12/01 5,310,000 5,166 7,167..
Maritime Link Financing Trust 3.50% 2052/12/01 Series 'A', Sinkable, Callable 3,950,000 3,937 4,562..
Milit-Air Inc. 5.75% 2019/06/30 Series '1' 6,997,701 7,406 7,521..
Milit-Air Inc. 5.87% 2020/04/22 1,338,209 1,385 1,450..
PSP Capital Inc. 3.03% 2020/10/22 3,100,000 3,099 3,338..
Royal Office Finance L.P. 5.21% 2032/11/12 Series 'A', Sinkable, Callable 517,039 518 663..
....
3,290,048 3,400,284 26.9%..x
Provincial Government & Guaranteed..
55 School Board Trust 5.90% 2033/06/02 Series 'A', Callable 12,795,000 14,891 17,800..
Alberta Capital Finance Authority 4.65% 2017/06/15 3,000,000 3,322 3,111..
Financement-Québec 3.50% 2017/12/01 5,400,000 5,481 5,609..
Financement-Québec 2.40% 2018/12/01 13,100,000 13,041 13,563..
Financement-Québec 2.45% 2019/12/01 4,000,000 4,000 4,182..
Financement-Québec 5.25% 2034/06/01 5,000,000 6,643 6,717..
Hydro-Québec 11.00% 2020/08/15 Series 'HL' 10,700,000 17,574 14,921..
Hydro-Québec 9.63% 2022/07/15 Series 'IC' 1,450,000 2,119 2,132..
Hydro-Québec 6.50% 2035/01/16 10,220,000 14,849 15,674..
Hydro-Québec 6.50% 2035/02/15 Series '19' 12,000,000 17,689 18,540..
Hydro-Québec 6.00% 2040/02/15 7,356,000 9,477 11,404..
Hydro-Québec 5.00% 2045/02/15 Series 'JM' 8,000,000 9,058 11,445..
Hydro-Québec 5.00% 2050/02/15 Series 'JN' 7,225,000 8,255 10,701..
Labrador-Island Link Funding Trust 3.86% 2045/12/01 Series 'B', Callable 2,575,000 2,633 3,273..
Labrador-Island Link Funding Trust 3.85% 2053/12/01 Series 'C', Callable 7,650,000 7,778 10,040..
Muskrat Falls / Labrador Transmission Assets Funding Trust 3.63% 2029/06/01 Series 'A', Callable 1,600,000 1,627 1,868..
New Brunswick F-M Project Co. Inc. 6.47% 2027/11/30 27,749,522 32,083 35,388..
Newfoundland & Labrador Hydro 8.40% 2026/02/27 Series 'Y' 2,800,000 3,925 4,212..
Newfoundland & Labrador Hydro 6.65% 2031/08/27 Series 'AB' 5,000,000 6,456 7,151..
Newfoundland and Labrador Municipal Financing Corp. 5.15% 2019/03/29 650,000 683 696..
Ontario Electricity Financial Corp. 8.40% 2020/11/06 Series '02' 1,866,000 2,462 2,343..
Ontario Electricity Financial Corp. 8.90% 2022/08/18 Series 'FV6' 9,025,000 13,107 12,913..
Ontario Electricity Financial Corp. 8.50% 2025/05/26 4,650,000 6,767 7,132..
Ontario School Boards Financing Corp. 6.25% 2016/10/19 5,149,000 5,830 5,231..
Ontario School Boards Financing Corp. 5.70% 2017/10/11 1,800,000 1,962 1,908..
Ontario School Boards Financing Corp. 7.20% 2025/06/09 Series '2000-A1' 3,693,870 4,382 4,654..
Ontario School Boards Financing Corp. 6.55% 2026/10/19 1,145,168 1,274 1,426..
Ontario School Boards Financing Corp. 5.90% 2027/10/11 6,364,013 7,334 7,817..
Ontario School Boards Financing Corp. 5.80% 2028/11/07 1,913,589 2,056 2,364
5
The accompanying notes are an integral part of these financial statements.
Imperial Canadian Bond Pool
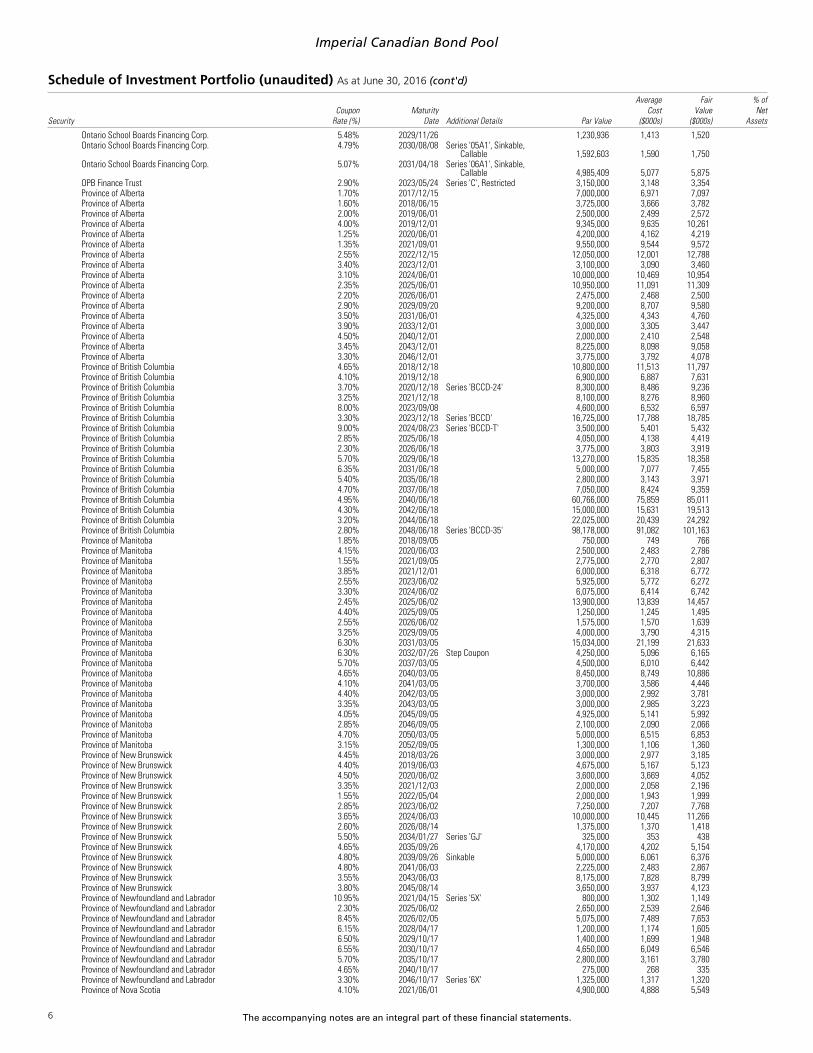
Schedule of Investment Portfolio (unaudited) As at June 30, 2016 (cont'd)
SecurityCoupon
Rate (%)Maturity
Date Additional Details Par Value
AverageCost
($000s)
FairValue
($000s)
% ofNet
Assets..
Ontario School Boards Financing Corp. 5.48% 2029/11/26 1,230,936 1,413 1,520..
Ontario School Boards Financing Corp. 4.79% 2030/08/08 Series '05A1', Sinkable,Callable 1,592,603 1,590 1,750
..
Ontario School Boards Financing Corp. 5.07% 2031/04/18 Series '06A1', Sinkable,Callable 4,985,409 5,077 5,875
..
OPB Finance Trust 2.90% 2023/05/24 Series 'C', Restricted 3,150,000 3,148 3,354..
Province of Alberta 1.70% 2017/12/15 7,000,000 6,971 7,097..
Province of Alberta 1.60% 2018/06/15 3,725,000 3,666 3,782..
Province of Alberta 2.00% 2019/06/01 2,500,000 2,499 2,572..
Province of Alberta 4.00% 2019/12/01 9,345,000 9,635 10,261..
Province of Alberta 1.25% 2020/06/01 4,200,000 4,162 4,219..
Province of Alberta 1.35% 2021/09/01 9,550,000 9,544 9,572..
Province of Alberta 2.55% 2022/12/15 12,050,000 12,001 12,788..
Province of Alberta 3.40% 2023/12/01 3,100,000 3,090 3,460..
Province of Alberta 3.10% 2024/06/01 10,000,000 10,469 10,954..
Province of Alberta 2.35% 2025/06/01 10,950,000 11,091 11,309..
Province of Alberta 2.20% 2026/06/01 2,475,000 2,468 2,500..
Province of Alberta 2.90% 2029/09/20 9,200,000 8,707 9,580..
Province of Alberta 3.50% 2031/06/01 4,325,000 4,343 4,760..
Province of Alberta 3.90% 2033/12/01 3,000,000 3,305 3,447..
Province of Alberta 4.50% 2040/12/01 2,000,000 2,410 2,548..
Province of Alberta 3.45% 2043/12/01 8,225,000 8,098 9,058..
Province of Alberta 3.30% 2046/12/01 3,775,000 3,792 4,078..
Province of British Columbia 4.65% 2018/12/18 10,800,000 11,513 11,797..
Province of British Columbia 4.10% 2019/12/18 6,900,000 6,887 7,631..
Province of British Columbia 3.70% 2020/12/18 Series 'BCCD-24' 8,300,000 8,486 9,236..
Province of British Columbia 3.25% 2021/12/18 8,100,000 8,276 8,960..
Province of British Columbia 8.00% 2023/09/08 4,600,000 6,532 6,597..
Province of British Columbia 3.30% 2023/12/18 Series 'BCCD' 16,725,000 17,788 18,785..
Province of British Columbia 9.00% 2024/08/23 Series 'BCCD-T' 3,500,000 5,401 5,432..
Province of British Columbia 2.85% 2025/06/18 4,050,000 4,138 4,419..
Province of British Columbia 2.30% 2026/06/18 3,775,000 3,803 3,919..
Province of British Columbia 5.70% 2029/06/18 13,270,000 15,835 18,358..
Province of British Columbia 6.35% 2031/06/18 5,000,000 7,077 7,455..
Province of British Columbia 5.40% 2035/06/18 2,800,000 3,143 3,971..
Province of British Columbia 4.70% 2037/06/18 7,050,000 8,424 9,359..
Province of British Columbia 4.95% 2040/06/18 60,766,000 75,859 85,011..
Province of British Columbia 4.30% 2042/06/18 15,000,000 15,631 19,513..
Province of British Columbia 3.20% 2044/06/18 22,025,000 20,439 24,292..
Province of British Columbia 2.80% 2048/06/18 Series 'BCCD-35' 98,178,000 91,082 101,163..
Province of Manitoba 1.85% 2018/09/05 750,000 749 766..
Province of Manitoba 4.15% 2020/06/03 2,500,000 2,483 2,786..
Province of Manitoba 1.55% 2021/09/05 2,775,000 2,770 2,807..
Province of Manitoba 3.85% 2021/12/01 6,000,000 6,318 6,772..
Province of Manitoba 2.55% 2023/06/02 5,925,000 5,772 6,272..
Province of Manitoba 3.30% 2024/06/02 6,075,000 6,414 6,742..
Province of Manitoba 2.45% 2025/06/02 13,900,000 13,839 14,457..
Province of Manitoba 4.40% 2025/09/05 1,250,000 1,245 1,495..
Province of Manitoba 2.55% 2026/06/02 1,575,000 1,570 1,639..
Province of Manitoba 3.25% 2029/09/05 4,000,000 3,790 4,315..
Province of Manitoba 6.30% 2031/03/05 15,034,000 21,199 21,633..
Province of Manitoba 6.30% 2032/07/26 Step Coupon 4,250,000 5,096 6,165..
Province of Manitoba 5.70% 2037/03/05 4,500,000 6,010 6,442..
Province of Manitoba 4.65% 2040/03/05 8,450,000 8,749 10,886..
Province of Manitoba 4.10% 2041/03/05 3,700,000 3,586 4,446..
Province of Manitoba 4.40% 2042/03/05 3,000,000 2,992 3,781..
Province of Manitoba 3.35% 2043/03/05 3,000,000 2,985 3,223..
Province of Manitoba 4.05% 2045/09/05 4,925,000 5,141 5,992..
Province of Manitoba 2.85% 2046/09/05 2,100,000 2,090 2,066..
Province of Manitoba 4.70% 2050/03/05 5,000,000 6,515 6,853..
Province of Manitoba 3.15% 2052/09/05 1,300,000 1,106 1,360..
Province of New Brunswick 4.45% 2018/03/26 3,000,000 2,977 3,185..
Province of New Brunswick 4.40% 2019/06/03 4,675,000 5,167 5,123..
Province of New Brunswick 4.50% 2020/06/02 3,600,000 3,669 4,052..
Province of New Brunswick 3.35% 2021/12/03 2,000,000 2,058 2,196..
Province of New Brunswick 1.55% 2022/05/04 2,000,000 1,943 1,999..
Province of New Brunswick 2.85% 2023/06/02 7,250,000 7,207 7,768..
Province of New Brunswick 3.65% 2024/06/03 10,000,000 10,445 11,266..
Province of New Brunswick 2.60% 2026/08/14 1,375,000 1,370 1,418..
Province of New Brunswick 5.50% 2034/01/27 Series 'GJ' 325,000 353 438..
Province of New Brunswick 4.65% 2035/09/26 4,170,000 4,202 5,154..
Province of New Brunswick 4.80% 2039/09/26 Sinkable 5,000,000 6,061 6,376..
Province of New Brunswick 4.80% 2041/06/03 2,225,000 2,483 2,867..
Province of New Brunswick 3.55% 2043/06/03 8,175,000 7,828 8,799..
Province of New Brunswick 3.80% 2045/08/14 3,650,000 3,937 4,123..
Province of Newfoundland and Labrador 10.95% 2021/04/15 Series '5X' 800,000 1,302 1,149..
Province of Newfoundland and Labrador 2.30% 2025/06/02 2,650,000 2,539 2,646..
Province of Newfoundland and Labrador 8.45% 2026/02/05 5,075,000 7,489 7,653..
Province of Newfoundland and Labrador 6.15% 2028/04/17 1,200,000 1,174 1,605..
Province of Newfoundland and Labrador 6.50% 2029/10/17 1,400,000 1,699 1,948..
Province of Newfoundland and Labrador 6.55% 2030/10/17 4,650,000 6,049 6,546..
Province of Newfoundland and Labrador 5.70% 2035/10/17 2,800,000 3,161 3,780..
Province of Newfoundland and Labrador 4.65% 2040/10/17 275,000 268 335..
Province of Newfoundland and Labrador 3.30% 2046/10/17 Series '6X' 1,325,000 1,317 1,320..
Province of Nova Scotia 4.10% 2021/06/01 4,900,000 4,888 5,549
6

The accompanying notes are an integral part of these financial statements.
Imperial Canadian Bond Pool
Schedule of Investment Portfolio (unaudited) As at June 30, 2016 (cont'd)
SecurityCoupon
Rate (%)Maturity
Date Additional Details Par Value
AverageCost
($000s)
FairValue
($000s)
% ofNet
Assets..
Province of Nova Scotia 9.60% 2022/01/30 775,000 1,045 1,109..
Province of Nova Scotia 6.60% 2027/06/01 400,000 411 565..
Province of Nova Scotia 6.60% 2031/12/01 3,600,000 4,508 5,340..
Province of Nova Scotia 4.90% 2035/06/01 4,900,000 4,836 6,320..
Province of Nova Scotia 4.50% 2037/06/01 8,000,000 9,315 9,918..
Province of Nova Scotia 4.70% 2041/06/01 3,800,000 3,742 4,938..
Province of Nova Scotia 4.40% 2042/06/01 3,000,000 3,197 3,762..
Province of Nova Scotia 3.50% 2062/06/02 8,000,000 8,053 9,057..
Province of Ontario 4.88% 2016/12/02 9,675,000 9,862 9,845..
Province of Ontario 1.90% 2017/09/08 23,500,000 23,416 23,835..
Province of Ontario 2.10% 2018/09/08 10,850,000 10,844 11,141..
Province of Ontario 1.75% 2018/10/09 250,000 250 255..
Province of Ontario 4.40% 2019/06/02 21,750,000 22,401 23,883..
Province of Ontario 4.20% 2020/06/02 35,650,000 38,204 39,856..
Province of Ontario 4.00% 2021/06/02 32,600,000 34,668 36,905..
Province of Ontario 3.15% 2022/06/02 52,475,000 53,916 57,734..
Province of Ontario 9.50% 2022/07/13 10,801,000 16,764 15,788..
Province of Ontario 1.95% 2023/01/27 1,000,000 998 1,028..
Province of Ontario 2.85% 2023/06/02 47,825,000 47,659 51,925..
Province of Ontario 8.10% 2023/09/08 1,000,000 1,436 1,439..
Province of Ontario 3.50% 2024/06/02 72,150,000 77,629 81,825..
Province of Ontario 2.60% 2025/06/02 202,000,000 207,489 214,790..
Province of Ontario 8.00% 2026/02/06 2,650,000 3,404 4,041..
Province of Ontario 2.40% 2026/06/02 12,500,000 12,566 12,994..
Province of Ontario 8.00% 2026/12/02 3,000,000 4,612 4,658..
Province of Ontario 7.60% 2027/06/02 Series 'KJ' 13,000,000 18,837 20,005..
Province of Ontario 6.50% 2029/03/08 31,175,000 43,056 45,369..
Province of Ontario 6.20% 2031/06/02 9,200,000 12,470 13,426..
Province of Ontario 5.85% 2033/03/08 19,000,000 25,404 27,304..
Province of Ontario 9.50% 2035/01/12 Series 'JG' 1,300,000 2,378 2,535..
Province of Ontario 9.88% 2035/02/08 Series 'JJ' 1,000,000 1,873 2,006..
Province of Ontario 5.60% 2035/06/02 24,000,000 31,684 34,392..
Province of Ontario 8.25% 2036/06/20 12,871,000 19,265 23,361..
Province of Ontario 4.70% 2037/06/02 28,000,000 31,485 36,747..
Province of Ontario 4.60% 2039/06/02 24,732,000 27,004 32,436..
Province of Ontario 4.65% 2041/06/02 35,950,000 39,700 48,156..
Province of Ontario 3.50% 2043/06/02 44,600,000 44,798 50,863..
Province of Ontario 3.45% 2045/06/02 51,700,000 49,959 58,906..
Province of Ontario 2.90% 2046/12/02 87,420,000 81,532 90,296..
Province of Prince Edward Island 6.10% 2027/07/29 2,900,000 3,455 3,956..
Province of Prince Edward Island 5.30% 2036/05/19 1,600,000 1,599 2,126..
Province of Prince Edward Island 4.65% 2037/11/19 3,500,000 3,462 4,327..
Province of Prince Edward Island 4.60% 2041/05/19 1,700,000 1,773 2,123..
Province of Prince Edward Island 3.60% 2053/01/17 2,200,000 2,031 2,436..
Province of Quebec 4.50% 2017/12/01 Series 'B088' 4,600,000 4,911 4,844..
Province of Quebec 4.50% 2018/12/01 18,525,000 20,157 20,120..
Province of Quebec 4.50% 2019/12/01 10,000,000 10,087 11,154..
Province of Quebec 4.50% 2020/12/01 13,450,000 14,717 15,374..
Province of Quebec 4.25% 2021/12/01 44,000,000 48,080 50,715..
Province of Quebec 3.50% 2022/12/01 28,650,000 29,848 32,168..
Province of Quebec 9.38% 2023/01/16 500,000 745 742..
Province of Quebec 3.00% 2023/09/01 33,000,000 33,546 36,142..
Province of Quebec 3.75% 2024/09/01 Series 'B113' 42,875,000 46,601 49,453..
Province of Quebec 2.75% 2025/09/01 28,700,000 29,551 30,818..
Province of Quebec 8.50% 2026/04/01 3,000,000 4,149 4,701..
Province of Quebec 2.50% 2026/09/01 16,450,000 16,670 17,199..
Province of Quebec 6.00% 2029/10/01 Series 'OS' 8,000,000 9,007 11,250..
Province of Quebec 6.25% 2032/06/01 90,008,000 131,040 132,787..
Province of Quebec 5.75% 2036/12/01 16,000,000 20,421 23,430..
Province of Quebec 5.00% 2038/12/01 24,000,000 28,416 32,781..
Province of Quebec 5.00% 2041/12/01 40,900,000 47,068 57,129..
Province of Quebec 4.25% 2043/12/01 27,725,000 30,345 35,329..
Province of Quebec 3.50% 2045/12/01 Series 'B112' 34,275,000 32,763 39,070..
Province of Quebec 3.50% 2048/12/01 4,650,000 5,021 5,360..
Province of Saskatchewan 1.95% 2019/03/01 3,000,000 3,024 3,079..
Province of Saskatchewan 3.90% 2020/07/28 3,700,000 3,689 4,103..
Province of Saskatchewan 3.20% 2024/06/03 77,878,000 83,297 86,104..
Province of Saskatchewan 8.75% 2025/05/30 1,150,000 1,552 1,784..
Province of Saskatchewan 2.55% 2026/06/02 1,675,000 1,674 1,746..
Province of Saskatchewan 5.75% 2029/03/05 1,150,000 1,108 1,557..
Province of Saskatchewan 6.40% 2031/09/05 1,250,000 1,350 1,830..
Province of Saskatchewan 5.80% 2033/09/05 30,730,000 44,121 43,391..
Province of Saskatchewan 4.75% 2040/06/01 Series 'GC' 7,370,000 7,673 9,674..
Province of Saskatchewan 3.40% 2042/02/03 30,915,000 30,933 33,562..
Province of Saskatchewan 3.90% 2045/06/02 33,114,000 35,573 39,472..
Province of Saskatchewan 2.75% 2046/12/02 35,385,000 31,901 34,292..
....
2,706,584 2,937,671 23.2%..x
Municipal Government & Guaranteed..
Aéroports de Montréal 6.55% 2033/10/11 Callable 5,875,000 7,106 8,511..
Aéroports de Montréal 5.67% 2037/10/16 Series 'H', Callable 1,000,000 1,203 1,381..
Aéroports de Montréal 5.47% 2040/04/16 Series 'I', Callable 3,800,000 4,385 5,234..
Aéroports de Montréal 3.92% 2042/09/26 Series 'K', Callable 1,975,000 2,035 2,228..
City of Edmonton 8.50% 2018/09/14 Series 'QB' 1,100,000 1,426 1,274..
City of Montreal 5.00% 2018/12/01 3,500,000 3,919 3,813
7

The accompanying notes are an integral part of these financial statements.
Imperial Canadian Bond Pool
Schedule of Investment Portfolio (unaudited) As at June 30, 2016 (cont'd)
SecurityCoupon
Rate (%)Maturity
Date Additional Details Par Value
AverageCost
($000s)
FairValue
($000s)
% ofNet
Assets..
City of Montreal 4.50% 2021/12/01 5,100,000 5,301 5,838..
City of Montreal 3.50% 2023/09/01 11,550,000 11,877 12,717..
City of Montreal 3.50% 2024/09/01 1,975,000 1,971 2,175..
City of Montreal 3.00% 2025/09/01 1,325,000 1,333 1,402..
City of Montreal 6.00% 2043/06/01 2,408,000 2,870 3,629..
City of Ottawa 4.99% 2026/08/28 270,688 278 314..
City of Ottawa 4.20% 2053/07/30 1,425,000 1,421 1,759..
City of Toronto 5.05% 2017/07/18 1,000,000 1,127 1,044..
City of Toronto 3.90% 2023/09/29 Sinkable 4,300,000 4,288 4,889..
City of Toronto 2.45% 2025/02/06 6,350,000 6,340 6,541..
City of Toronto 2.40% 2026/06/24 2,600,000 2,598 2,633..
City of Toronto 5.20% 2040/06/01 3,975,000 4,636 5,351..
City of Toronto 4.70% 2041/06/10 1,775,000 1,844 2,252..
City of Toronto 3.80% 2042/12/13 3,000,000 2,990 3,351..
City of Toronto 4.15% 2044/03/10 5,500,000 6,289 6,526..
City of Vancouver 4.90% 2019/12/02 3,100,000 3,132 3,476..
City of Vancouver 4.50% 2020/06/01 2,000,000 1,992 2,241..
City of Winnipeg 5.90% 2029/02/02 Series 'VW' 303,000 372 406..
City of Winnipeg 4.10% 2045/06/01 5,000,000 5,681 5,820..
Durham District School Board 6.75% 2019/11/19 418,000 504 490..
Greater Toronto Airports Authority 5.26% 2018/04/17 Callable 3,100,000 3,501 3,322..
Greater Toronto Airports Authority 5.96% 2019/11/20 Series '2009-1' 5,000,000 5,847 5,780..
Greater Toronto Airports Authority 3.04% 2022/09/21 Callable 10,274,000 10,300 11,172..
Greater Toronto Airports Authority 6.45% 2029/07/30 5,138,839 5,424 6,620..
Greater Toronto Airports Authority 6.98% 2032/10/15 Series '02-3' 5,800,000 6,935 8,654..
Greater Toronto Airports Authority 5.63% 2040/06/07 Series '2010-1', Callable 1,950,000 1,948 2,736..
Greater Toronto Airports Authority 5.30% 2041/02/25 Callable 4,100,000 4,367 5,544..
Municipal Finance Authority of British Columbia 4.80% 2017/12/01 350,000 362 369..
Municipal Finance Authority of British Columbia 4.88% 2019/06/03 2,200,000 2,338 2,433..
Municipal Finance Authority of British Columbia 4.45% 2020/06/01 72,320,000 77,042 81,024..
Municipal Finance Authority of British Columbia 4.15% 2021/06/01 5,550,000 5,852 6,272..
Municipal Finance Authority of British Columbia 3.75% 2023/09/26 52,544,000 53,917 59,440..
Municipal Finance Authority of British Columbia 2.95% 2024/10/14 3,450,000 3,685 3,709..
Municipal Finance Authority of British Columbia 4.98% 2025/04/06 1,485,292 1,523 1,704..
Municipal Finance Authority of British Columbia 2.50% 2026/04/19 16,995,000 16,959 17,444..
Municipal Finance Authority of British Columbia 4.95% 2027/12/01 425,000 514 532..
Ottawa MacDonald-Cartier International Airport Authority 3.93% 2045/06/09 Series 'E', Sinkable,Restricted, Callable 15,187,000 15,191 16,221
..
Queen's University 6.10% 2032/11/19 Series 'A' 1,800,000 1,934 2,479..
Regional Municipality of Durham 7.13% 2017/06/12 2,122,000 2,569 2,246..
Regional Municipality of Peel 4.25% 2033/12/02 2,125,000 2,117 2,504..
Regional Municipality of Peel 5.10% 2040/06/29 Sinkable 6,925,000 8,378 9,247..
Regional Municipality of Peel 3.85% 2042/10/30 15,300,000 15,302 17,305..
Regional Municipality of York 2.60% 2025/12/15 2,550,000 2,539 2,646..
Regional Municipality of York 2.50% 2026/06/02 2,900,000 2,899 2,968..
Regional Municipality of York 4.00% 2032/05/31 Series 'F' 5,125,000 5,762 5,849..
Regional Municipality of York 3.65% 2033/05/13 600,000 627 657..
Regional Municipality of York 4.05% 2034/05/01 10,425,000 10,644 11,949..
South Coast British Columbia Transportation Authority 4.65% 2041/06/20 1,500,000 1,568 1,891..
South Coast British Columbia Transportation Authority 3.85% 2052/02/09 1,450,000 1,489 1,669..
TCHC Issuer Trust 5.40% 2040/02/22 Series 'B', Callable 5,500,000 6,732 7,545..
University of Ottawa 6.28% 2043/04/15 2,350,000 2,601 3,560..
University of Toronto 6.78% 2031/07/18 Callable 1,025,000 1,060 1,482..
University of Toronto 5.84% 2043/12/15 Series 'B', Callable 1,733,000 2,005 2,492..
University of Toronto 4.49% 2046/12/13 Series 'D', Callable 5,136,000 5,062 6,268..
Vancouver International Airport Authority 4.42% 2018/12/07 770,000 716 829..
Vancouver International Airport Authority 7.43% 2026/12/07 Series 'B', Step Coupon 21,024,000 28,340 30,721..
Winnipeg Airport Authority Inc. 4.57% 2019/11/20 1,300,000 1,300 1,429..
York Region District School Board 6.45% 2024/06/04 1,009,501 1,146 1,214..
York University 5.84% 2044/05/04 1,750,000 1,750 2,550..
....
409,163 447,771 3.5%..x
Mortgage-Backed Securities..
Genesis Trust II 1.70% 2020/04/15 Series '15-1' 15,150,000 15,141 15,294..
Genesis Trust II 2.43% 2026/05/15 Class 'A', Series '2014-1' 9,378,000 9,676 9,660..
Institutional Mortgage Securities Canada Inc. 1.94% 2024/09/12 Class 'A1', Series '2015-6',Restricted, Callable 15,202,886 15,192 15,058
..
Real Estate Asset Liquidity Trust 5.20% 2017/03/12 Class 'A1', Series '2007-2',Variable Rate, Callable 1,011,766 1,012 1,031
..
Real Estate Asset Liquidity Trust 5.20% 2017/06/12 Class 'A2', Series '2007-2' 6,232,000 6,251 6,399..
Schooner Trust 5.19% 2017/05/12 Class 'A2', Series '2007-8' 4,300,000 4,255 4,413..
....
51,527 51,855 0.4%..
x2Corporate (note 10)..
1011778 B.C. ULC / New Red Finance Inc. 6.00% 2022/04/01 Callable, USD 12,286,000 13,714 16,503..
407 International Inc. 3.87% 2017/11/24 Callable 1,900,000 1,899 1,962..
407 International Inc. 4.30% 2021/05/26 Callable 5,700,000 6,052 6,439..
407 International Inc. 3.35% 2024/05/16 Callable 15,487,000 15,700 17,161..
407 International Inc. 5.96% 2035/12/03 4,980,000 5,588 6,946..
407 International Inc. 5.75% 2036/02/14 Series '06D1' 63,398,000 71,762 82,569..
407 International Inc. 4.45% 2041/11/15 Callable 6,200,000 6,593 7,277..
407 International Inc. 4.19% 2042/04/25 Callable 4,900,000 4,893 5,559..
407 International Inc. 3.83% 2046/05/11 Callable 1,550,000 1,547 1,660..
407 International Inc. 3.60% 2047/05/21 Callable 5,665,000 5,659 5,871..
407 International Inc. 4.68% 2053/10/07 Callable 750,000 750 931..
Aimia Inc. 5.60% 2019/05/17 Callable 1,700,000 1,794 1,738
8
The accompanying notes are an integral part of these financial statements.
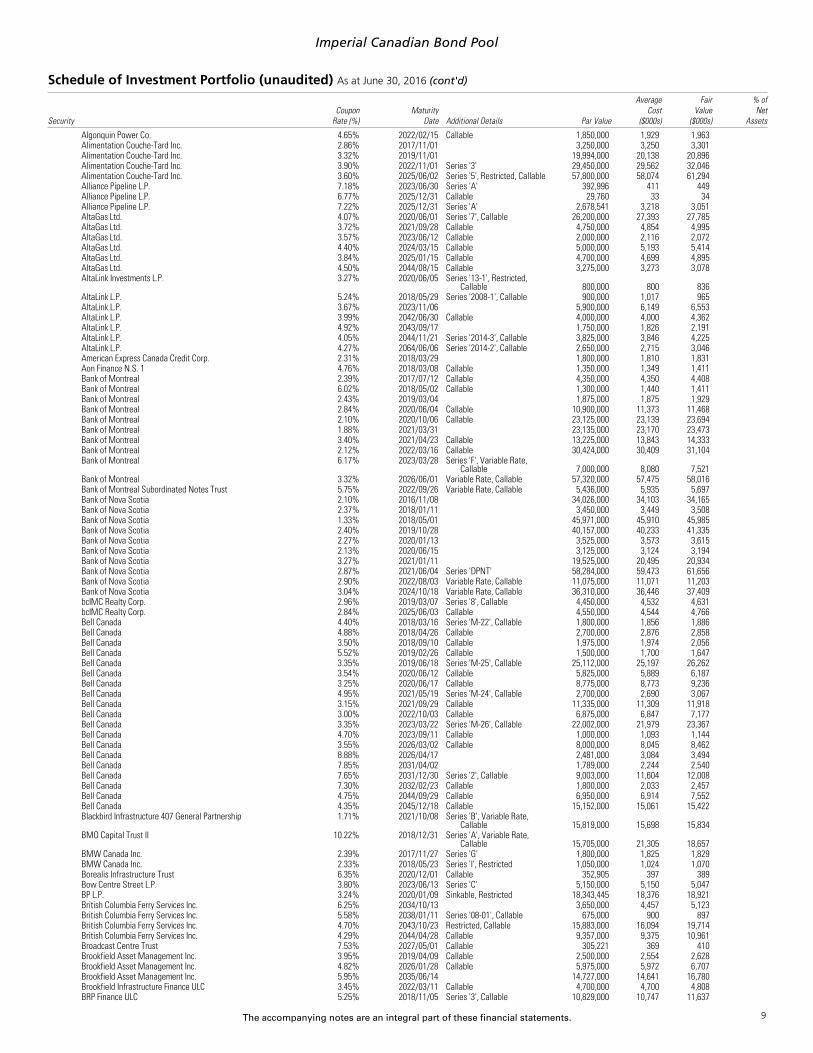
Imperial Canadian Bond Pool
Schedule of Investment Portfolio (unaudited) As at June 30, 2016 (cont'd)
SecurityCoupon
Rate (%)Maturity
Date Additional Details Par Value
AverageCost
($000s)
FairValue
($000s)
% ofNet
Assets..
Algonquin Power Co. 4.65% 2022/02/15 Callable 1,850,000 1,929 1,963..
Alimentation Couche-Tard Inc. 2.86% 2017/11/01 3,250,000 3,250 3,301..
Alimentation Couche-Tard Inc. 3.32% 2019/11/01 19,994,000 20,138 20,896..
Alimentation Couche-Tard Inc. 3.90% 2022/11/01 Series '3' 29,450,000 29,562 32,046..
Alimentation Couche-Tard Inc. 3.60% 2025/06/02 Series '5', Restricted, Callable 57,800,000 58,074 61,294..
Alliance Pipeline L.P. 7.18% 2023/06/30 Series 'A' 392,996 411 449..
Alliance Pipeline L.P. 6.77% 2025/12/31 Callable 29,760 33 34..
Alliance Pipeline L.P. 7.22% 2025/12/31 Series 'A' 2,678,541 3,218 3,051..
AltaGas Ltd. 4.07% 2020/06/01 Series '7', Callable 26,200,000 27,393 27,785..
AltaGas Ltd. 3.72% 2021/09/28 Callable 4,750,000 4,854 4,995..
AltaGas Ltd. 3.57% 2023/06/12 Callable 2,000,000 2,116 2,072..
AltaGas Ltd. 4.40% 2024/03/15 Callable 5,000,000 5,193 5,414..
AltaGas Ltd. 3.84% 2025/01/15 Callable 4,700,000 4,699 4,895..
AltaGas Ltd. 4.50% 2044/08/15 Callable 3,275,000 3,273 3,078..
AltaLink Investments L.P. 3.27% 2020/06/05 Series '13-1', Restricted,Callable 800,000 800 836
..
AltaLink L.P. 5.24% 2018/05/29 Series '2008-1', Callable 900,000 1,017 965..
AltaLink L.P. 3.67% 2023/11/06 5,900,000 6,149 6,553..
AltaLink L.P. 3.99% 2042/06/30 Callable 4,000,000 4,000 4,362..
AltaLink L.P. 4.92% 2043/09/17 1,750,000 1,826 2,191..
AltaLink L.P. 4.05% 2044/11/21 Series '2014-3', Callable 3,825,000 3,846 4,225..
AltaLink L.P. 4.27% 2064/06/06 Series '2014-2', Callable 2,650,000 2,715 3,046..
American Express Canada Credit Corp. 2.31% 2018/03/29 1,800,000 1,810 1,831..
Aon Finance N.S. 1 4.76% 2018/03/08 Callable 1,350,000 1,349 1,411..
Bank of Montreal 2.39% 2017/07/12 Callable 4,350,000 4,350 4,408..
Bank of Montreal 6.02% 2018/05/02 Callable 1,300,000 1,440 1,411..
Bank of Montreal 2.43% 2019/03/04 1,875,000 1,875 1,929..
Bank of Montreal 2.84% 2020/06/04 Callable 10,900,000 11,373 11,468..
Bank of Montreal 2.10% 2020/10/06 Callable 23,125,000 23,139 23,694..
Bank of Montreal 1.88% 2021/03/31 23,135,000 23,170 23,473..
Bank of Montreal 3.40% 2021/04/23 Callable 13,225,000 13,843 14,333..
Bank of Montreal 2.12% 2022/03/16 Callable 30,424,000 30,409 31,104..
Bank of Montreal 6.17% 2023/03/28 Series 'F', Variable Rate,Callable 7,000,000 8,080 7,521
..
Bank of Montreal 3.32% 2026/06/01 Variable Rate, Callable 57,320,000 57,475 58,016..
Bank of Montreal Subordinated Notes Trust 5.75% 2022/09/26 Variable Rate, Callable 5,436,000 5,935 5,697..
Bank of Nova Scotia 2.10% 2016/11/08 34,026,000 34,103 34,165..
Bank of Nova Scotia 2.37% 2018/01/11 3,450,000 3,449 3,508..
Bank of Nova Scotia 1.33% 2018/05/01 45,971,000 45,910 45,985..
Bank of Nova Scotia 2.40% 2019/10/28 40,157,000 40,233 41,335..
Bank of Nova Scotia 2.27% 2020/01/13 3,525,000 3,573 3,615..
Bank of Nova Scotia 2.13% 2020/06/15 3,125,000 3,124 3,194..
Bank of Nova Scotia 3.27% 2021/01/11 19,525,000 20,495 20,934..
Bank of Nova Scotia 2.87% 2021/06/04 Series 'DPNT' 58,284,000 59,473 61,656..
Bank of Nova Scotia 2.90% 2022/08/03 Variable Rate, Callable 11,075,000 11,071 11,203..
Bank of Nova Scotia 3.04% 2024/10/18 Variable Rate, Callable 36,310,000 36,446 37,409..
bcIMC Realty Corp. 2.96% 2019/03/07 Series '8', Callable 4,450,000 4,532 4,631..
bcIMC Realty Corp. 2.84% 2025/06/03 Callable 4,550,000 4,544 4,766..
Bell Canada 4.40% 2018/03/16 Series 'M-22', Callable 1,800,000 1,856 1,886..
Bell Canada 4.88% 2018/04/26 Callable 2,700,000 2,876 2,858..
Bell Canada 3.50% 2018/09/10 Callable 1,975,000 1,974 2,056..
Bell Canada 5.52% 2019/02/26 Callable 1,500,000 1,700 1,647..
Bell Canada 3.35% 2019/06/18 Series 'M-25', Callable 25,112,000 25,197 26,262..
Bell Canada 3.54% 2020/06/12 Callable 5,825,000 5,889 6,187..
Bell Canada 3.25% 2020/06/17 Callable 8,775,000 8,773 9,236..
Bell Canada 4.95% 2021/05/19 Series 'M-24', Callable 2,700,000 2,690 3,067..
Bell Canada 3.15% 2021/09/29 Callable 11,335,000 11,309 11,918..
Bell Canada 3.00% 2022/10/03 Callable 6,875,000 6,847 7,177..
Bell Canada 3.35% 2023/03/22 Series 'M-26', Callable 22,002,000 21,979 23,367..
Bell Canada 4.70% 2023/09/11 Callable 1,000,000 1,093 1,144..
Bell Canada 3.55% 2026/03/02 Callable 8,000,000 8,045 8,462..
Bell Canada 8.88% 2026/04/17 2,481,000 3,084 3,494..
Bell Canada 7.85% 2031/04/02 1,789,000 2,244 2,540..
Bell Canada 7.65% 2031/12/30 Series '2', Callable 9,003,000 11,604 12,008..
Bell Canada 7.30% 2032/02/23 Callable 1,800,000 2,033 2,457..
Bell Canada 4.75% 2044/09/29 Callable 6,950,000 6,914 7,552..
Bell Canada 4.35% 2045/12/18 Callable 15,152,000 15,061 15,422..
Blackbird Infrastructure 407 General Partnership 1.71% 2021/10/08 Series 'B', Variable Rate,Callable 15,819,000 15,698 15,834
..
BMO Capital Trust II 10.22% 2018/12/31 Series 'A', Variable Rate,Callable 15,705,000 21,305 18,657
..
BMW Canada Inc. 2.39% 2017/11/27 Series 'G' 1,800,000 1,825 1,829..
BMW Canada Inc. 2.33% 2018/05/23 Series 'I', Restricted 1,050,000 1,024 1,070..
Borealis Infrastructure Trust 6.35% 2020/12/01 Callable 352,905 397 389..
Bow Centre Street L.P. 3.80% 2023/06/13 Series 'C' 5,150,000 5,150 5,047..
BP L.P. 3.24% 2020/01/09 Sinkable, Restricted 18,343,445 18,376 18,921..
British Columbia Ferry Services Inc. 6.25% 2034/10/13 3,650,000 4,457 5,123..
British Columbia Ferry Services Inc. 5.58% 2038/01/11 Series '08-01', Callable 675,000 900 897..
British Columbia Ferry Services Inc. 4.70% 2043/10/23 Restricted, Callable 15,883,000 16,094 19,714..
British Columbia Ferry Services Inc. 4.29% 2044/04/28 Callable 9,357,000 9,375 10,961..
Broadcast Centre Trust 7.53% 2027/05/01 Callable 305,221 369 410..
Brookfield Asset Management Inc. 3.95% 2019/04/09 Callable 2,500,000 2,554 2,628..
Brookfield Asset Management Inc. 4.82% 2026/01/28 Callable 5,975,000 5,972 6,707..
Brookfield Asset Management Inc. 5.95% 2035/06/14 14,727,000 14,641 16,780..
Brookfield Infrastructure Finance ULC 3.45% 2022/03/11 Callable 4,700,000 4,700 4,808..
BRP Finance ULC 5.25% 2018/11/05 Series '3', Callable 10,829,000 10,747 11,637
9

The accompanying notes are an integral part of these financial statements.
Imperial Canadian Bond Pool
Schedule of Investment Portfolio (unaudited) As at June 30, 2016 (cont'd)
SecurityCoupon
Rate (%)Maturity
Date Additional Details Par Value
AverageCost
($000s)
FairValue
($000s)
% ofNet
Assets..
BRP Finance ULC 5.14% 2020/10/13 Series '7', Callable 12,232,000 12,344 13,658..
BRP Finance ULC 4.79% 2022/02/07 Callable 5,200,000 5,200 5,817..
BRP Finance ULC 5.84% 2036/11/05 Series '4', Callable 5,614,000 5,476 6,339..
Bruce Power L.P. 2.84% 2021/06/23 Restricted 16,550,000 16,565 16,758..
Bruce Power L.P. 3.97% 2026/06/23 Restricted, Callable 4,810,000 4,823 4,913..
Cadillac Fairview Finance Trust 3.64% 2018/05/09 2,800,000 2,800 2,923..
Cadillac Fairview Finance Trust 4.31% 2021/01/25 Series 'B', Callable 1,150,000 1,150 1,291..
Caisse centrale Desjardins du Quebec 1.75% 2020/03/02 8,000,000 7,965 8,057..
Calloway REIT 4.05% 2020/07/27 Callable 9,482,000 9,889 10,171..
Calloway REIT 3.75% 2021/02/11 Series 'L' 13,163,000 13,217 14,006..
Calloway REIT 3.99% 2023/05/30 23,805,000 23,906 25,675..
Calloway REIT 3.56% 2025/02/06 Series 'N' 6,700,000 6,734 6,953..
Cameco Corp. 5.67% 2019/09/02 Series 'D', Callable 2,200,000 2,483 2,401..
Cameco Corp. 3.75% 2022/11/14 Series 'E' 3,450,000 3,450 3,575..
Canada Life Assurance Co. 6.40% 2028/12/11 Series 'B', Callable 2,250,000 2,287 2,940..
Canadian Credit Card Trust II 1.83% 2020/03/24 Series 'A' 2,425,000 2,426 2,448..
Canadian Imperial Bank of Commerce 3.95% 2017/07/14 2,900,000 2,894 2,985..
Canadian Imperial Bank of Commerce 2.35% 2017/10/18 2,000,000 1,997 2,030..
Canadian Imperial Bank of Commerce 2.22% 2018/03/07 15,500,000 15,458 15,752..
Canadian Imperial Bank of Commerce 1.90% 2021/04/26 4,000,000 4,050 4,063..
Canadian National Railway Co. 2.80% 2025/09/22 Callable 4,000,000 3,987 4,223..
Canadian Natural Resources Ltd. 2.60% 2019/12/03 Callable 33,142,000 33,031 32,929..
Canadian Natural Resources Ltd. 2.89% 2020/08/14 Series '2', Callable 10,425,000 10,569 10,414..
Canadian Natural Resources Ltd. 3.55% 2024/06/03 Callable 7,075,000 7,049 7,014..
Canadian Pacific Railway Co. 6.45% 2039/11/17 Callable 3,618,000 3,721 4,725..
Canadian Tire Corp. Ltd. 5.61% 2035/09/04 Callable 5,100,000 4,960 6,116..
Canadian Utilities Ltd. 11.77% 2020/11/30 1,600,000 2,529 2,277..
Canadian Western Bank 2.53% 2018/03/22 1,975,000 1,983 1,983..
Canadian Western Bank 3.46% 2024/12/17 Variable Rate, Callable 1,900,000 1,900 1,908..
Capital City Link General Partnership 4.39% 2046/03/31 Sinkable, Callable 27,445,000 27,615 29,487..
Capital Desjardins Inc. 5.19% 2020/05/05 Series 'G', Callable 11,300,000 12,531 12,612..
Capital Desjardins Inc. 4.95% 2026/12/15 Variable Rate, Callable 3,150,000 3,150 3,582..
Capital Power Corp. 5.28% 2020/11/16 1,450,000 1,450 1,497..
Cascades Inc. 5.50% 2021/07/15 Restricted, Callable 6,955,000 6,934 6,950..
Caterpillar Financial Services Ltd. 2.29% 2018/06/01 3,275,000 3,262 3,327..
Choice Properties L.P. 3.60% 2020/04/20 Series '8', Restricted 6,375,000 6,513 6,742..
Choice Properties L.P. 3.60% 2022/09/20 Series '10', Callable 5,900,000 5,880 6,304..
Choice Properties REIT 3.55% 2018/07/05 Series 'A', Callable 4,100,000 4,100 4,244..
Choice Properties REIT 2.30% 2020/09/14 Series 'E', Callable 12,717,000 12,715 12,862..
Choice Properties REIT 3.50% 2021/02/08 3,400,000 3,400 3,605..
Choice Properties REIT 4.06% 2025/11/24 Series 'F', Callable 21,950,000 23,233 23,843..
CIBC Capital Trust 9.98% 2019/06/30 Series 'A', Callable 18,625,000 24,051 22,279..
CIBC Capital Trust 10.25% 2039/06/30 Callable 3,000,000 4,592 4,163..
Clarica Life Insurance Co. 6.30% 2028/05/15 Series '2' 5,336,000 6,147 6,807..
Cogeco Cable Inc. 5.15% 2020/11/16 Callable 28,893,000 30,341 31,923..
Cogeco Cable Inc. 4.93% 2022/02/14 Callable 1,850,000 1,910 2,054..
Comber Wind L.P. 5.13% 2030/11/15 Sinkable, Callable 755,653 756 826..
Cominar REIT 4.23% 2019/12/04 6,650,000 6,768 6,879..
Co-operators Financial Services Ltd. 5.78% 2020/03/10 Callable 2,350,000 2,350 2,558..
Crosslinx Transit Solutions General Partnership 4.65% 2046/09/30 Sinkable 2,975,000 2,968 3,106..
CT REIT 2.85% 2022/06/09 Series 'A', Callable 10,124,000 10,124 10,412..
CT REIT 3.53% 2025/06/09 Series 'B', Callable 6,625,000 6,625 6,911..
CT REIT 3.29% 2026/06/01 Series 'D', Callable 6,275,000 6,275 6,350..
CU Inc. 6.80% 2019/08/13 2,700,000 3,451 3,140..
CU Inc. 5.18% 2035/11/21 Callable 2,000,000 2,269 2,498..
CU Inc. 4.54% 2041/10/24 Callable 4,100,000 4,380 4,833..
CU Inc. 3.81% 2042/09/10 4,000,000 4,098 4,219..
CU Inc. 4.72% 2043/09/09 Callable 3,800,000 3,959 4,619..
CU Inc. 4.09% 2044/09/02 Callable 32,960,000 33,415 36,539..
CU Inc. 3.96% 2045/07/27 Callable 4,000,000 4,000 4,355..
CU Inc. 4.95% 2050/11/18 Callable 1,650,000 1,650 2,090..
CU Inc. 4.56% 2053/11/07 Callable 9,716,000 9,998 11,661..
Daimler Canada Finance Inc. 2.28% 2017/02/17 16,147,000 16,160 16,260..
Daimler Canada Finance Inc. 1.78% 2019/08/19 20,751,000 20,708 20,843..
Dollarama Inc. 3.10% 2018/11/05 2,425,000 2,442 2,498..
Dream Office REIT 3.42% 2018/06/13 Series 'A', Callable 18,594,000 18,614 18,657..
Dream Office REIT 4.07% 2020/01/21 Series 'C' 4,600,000 4,702 4,682..
Eldorado Gold Corp. 6.13% 2020/12/15 Callable, USD 10,830,000 11,206 14,062..
Enbridge Gas Distribution Inc. 4.04% 2020/11/23 Callable 400,000 400 440..
Enbridge Gas Distribution Inc. 6.16% 2033/12/16 Callable 2,200,000 2,247 2,954..
Enbridge Gas Distribution Inc. 5.21% 2036/02/25 Callable 2,600,000 2,596 3,215..
Enbridge Gas Distribution Inc. 4.95% 2050/11/22 Callable 1,900,000 2,039 2,361..
Enbridge Inc. 4.77% 2019/09/02 Callable 4,583,000 4,649 4,938..
Enbridge Inc. 4.53% 2020/03/09 Callable 3,725,000 3,776 4,015..
Enbridge Inc. 3.94% 2023/06/30 Callable 2,000,000 2,169 2,121..
Enbridge Inc. 6.10% 2028/07/14 1,400,000 1,390 1,577..
Enbridge Inc. 5.75% 2039/09/02 Callable 6,400,000 7,346 7,093..
Enbridge Inc. 5.12% 2040/09/28 Callable 2,600,000 2,509 2,719..
Enbridge Inc. 4.24% 2042/08/27 Callable 22,901,000 22,094 20,816..
Enbridge Income Fund (The) 4.10% 2019/02/22 Callable 1,950,000 1,994 2,043..
Enbridge Income Fund (The) 4.85% 2022/02/22 Series '7' 1,200,000 1,372 1,335..
Enbridge Income Fund (The) 3.95% 2024/11/19 Callable 3,100,000 3,100 3,266..
Enbridge Pipelines Inc. 4.49% 2019/11/12 Callable 250,000 250 272..
Enbridge Pipelines Inc. 6.35% 2023/11/17 1,000,000 1,226 1,231..
Enbridge Pipelines Inc. 3.45% 2025/09/29 Callable 1,900,000 1,897 1,997
10

The accompanying notes are an integral part of these financial statements.
Imperial Canadian Bond Pool
Schedule of Investment Portfolio (unaudited) As at June 30, 2016 (cont'd)
SecurityCoupon
Rate (%)Maturity
Date Additional Details Par Value
AverageCost
($000s)
FairValue
($000s)
% ofNet
Assets..
Enbridge Pipelines Inc. 5.08% 2036/12/19 Callable 4,570,000 4,564 5,139..
Enbridge Pipelines Inc. 5.35% 2039/11/10 Callable 575,000 652 679..
Enbridge Pipelines Inc. 5.33% 2040/04/06 Callable 8,975,000 9,373 10,566..
Enersource Corp. 4.52% 2021/04/29 Series 'A', Callable 1,100,000 1,100 1,237..
Enmax Corp. 6.15% 2018/06/19 Callable 1,600,000 1,822 1,723..
Epcor Utilities Inc. 5.80% 2018/01/31 Callable 4,200,000 4,756 4,493..
Epcor Utilities Inc. 5.65% 2035/11/16 Series 'B-6', Callable 2,375,000 2,840 3,090..
Epcor Utilities Inc. 6.65% 2038/04/15 Callable 4,225,000 5,823 6,299..
Epcor Utilities Inc. 5.75% 2039/11/24 Callable 2,400,000 2,938 3,289..
Epcor Utilities Inc. 4.55% 2042/02/28 Callable 2,400,000 2,394 2,844..
Fairfax Financial Holdings Ltd. 7.50% 2019/08/19 Callable 2,065,000 2,067 2,323..
Fairfax Financial Holdings Ltd. 5.84% 2022/10/14 Callable 3,450,000 3,633 3,832..
Fairfax Financial Holdings Ltd. 4.50% 2023/03/22 17,460,000 17,361 18,009..
Fairfax Financial Holdings Ltd. 4.95% 2025/03/03 24,270,000 24,291 25,483..
Federated Co-Operatives Ltd. 3.92% 2025/06/17 Restricted, Callable 35,325,000 35,331 35,910..
Finning International Inc. 6.02% 2018/06/01 Callable 1,800,000 2,072 1,934..
Finning International Inc. 3.23% 2020/07/03 Callable 3,100,000 3,100 3,187..
First Capital Realty Inc. 3.90% 2023/10/30 Series 'Q', Callable 4,800,000 4,750 5,209..
First Capital Realty Inc. 4.79% 2024/08/30 Series 'R', Callable 4,000,000 4,369 4,589..
First Capital Realty Inc. 4.32% 2025/07/31 Series 'S', Callable 8,725,000 8,732 9,649..
First Capital Realty Inc. 3.60% 2026/05/06 Series 'T', Callable 1,500,000 1,500 1,557..
First Quantum Minerals Ltd. 6.75% 2020/02/15 Callable, USD 6,320,000 7,170 6,859..
First Quantum Minerals Ltd. 7.00% 2021/02/15 Callable, USD 5,220,000 5,922 5,454..
Ford Credit Canada Ltd. 3.70% 2018/08/02 Callable 5,225,000 5,297 5,411..
Ford Credit Canada Ltd. 2.94% 2019/02/19 6,175,000 6,183 6,312..
Ford Credit Canada Ltd. 2.45% 2020/05/07 Restricted 30,655,000 30,516 30,801..
Ford Credit Canada Ltd. 2.92% 2020/09/16 Restricted, Callable 1,950,000 1,950 1,991..
Ford Credit Canada Ltd. 2.58% 2021/05/10 17,665,000 17,635 17,745..
Ford Credit Canada Ltd. 3.28% 2021/07/02 7,050,000 7,116 7,302..
Fortis Inc. 6.51% 2039/07/04 Callable 9,715,000 10,595 12,854..
FortisAlberta Inc. 6.22% 2034/10/31 Series '04-2', Callable 5,901,000 7,520 8,056..
FortisAlberta Inc. 7.06% 2039/02/14 Callable 1,400,000 1,799 2,156..
FortisAlberta Inc. 5.37% 2039/10/30 Callable 1,100,000 1,100 1,422..
FortisBC Energy Inc. 6.50% 2034/05/01 1,000,000 994 1,408..
FortisBC Energy Inc. 5.80% 2038/05/13 Callable 4,050,000 5,322 5,502..
Gaz Métro inc. 10.45% 2016/10/31 Series 'D' 5,602,000 7,535 5,763..
Gaz Métro inc. 5.70% 2036/07/10 Series 'J', Callable 2,000,000 2,552 2,667..
GE Capital Canada Funding Co. 4.60% 2022/01/26 13,572,000 14,451 15,722..
General Motors Financial of Canada Ltd. 3.08% 2020/05/22 Restricted, Callable 4,225,000 4,223 4,282..
George Weston Ltd. 6.69% 2033/03/01 2,216,000 2,296 2,842..
Gibson Energy Inc. 7.00% 2020/07/15 Callable 11,415,000 11,389 11,486..
Gibson Energy Inc. 5.38% 2022/07/15 Restricted, Callable 5,067,000 5,040 4,725..
Glacier Credit Card Trust 2.39% 2017/10/20 2,325,000 2,325 2,357..
Glacier Credit Card Trust 2.76% 2018/11/20 Series '2013-1' 13,504,000 14,006 13,916..
Glacier Credit Card Trust 2.57% 2019/09/20 1,700,000 1,700 1,754..
Glacier Credit Card Trust 2.24% 2020/09/20 33,027,000 33,040 33,797..
Grand Renewable Solar L.P. 3.93% 2035/01/31 Series '1A', Sinkable,Restricted, Callable 1,100,000 1,100 1,134
..
Granite REIT Holdings L.P. 4.61% 2018/10/02 1,500,000 1,526 1,573..
Great Canadian Gaming Corp. 6.63% 2022/07/25 Callable 12,652,000 12,915 12,937..
Great-West Lifeco Inc. 4.65% 2020/08/13 Callable 11,282,000 11,620 12,563..
Great-West Lifeco Inc. 6.67% 2033/03/21 Callable 5,685,000 7,301 7,697..
Great-West Lifeco Inc. 6.00% 2039/11/16 6,775,000 8,265 8,946..
HCN Canadian Holdings-1 L.P. 3.35% 2020/11/25 Restricted 5,995,000 5,991 6,164..
Health Montreal Collective L.P. 6.72% 2049/09/30 Sinkable, Callable 5,300,000 6,049 7,298..
Home Trust Co. (The) 2.28% 2018/03/06 900,000 897 894..
Honda Canada Finance Inc. 2.28% 2017/12/11 Restricted 1,500,000 1,491 1,522..
Honda Canada Finance Inc. 2.35% 2018/06/04 Series '2013-1', Restricted 1,450,000 1,450 1,477..
Honda Canada Finance Inc. 1.63% 2019/08/12 2,950,000 2,951 2,963..
Hospital Infrastructure Partners NOH Partnership 5.44% 2045/01/31 Series 'A', Sinkable, Callable 11,249,324 11,880 13,177..
HSBC Bank Canada 3.56% 2017/10/04 3,000,000 3,097 3,079..
HSBC Bank Canada 2.08% 2018/11/26 12,970,000 12,971 13,087..
HSBC Bank Canada 2.49% 2019/05/13 1,600,000 1,600 1,631..
HSBC Bank Canada 2.94% 2020/01/14 10,200,000 10,288 10,543..
HSBC Bank Canada 1.82% 2020/07/07 5,825,000 5,825 5,786..
HSBC Bank Canada 2.45% 2021/01/29 4,925,000 4,925 5,011..
HSBC Bank Canada 2.91% 2021/09/29 7,175,000 7,207 7,440..
HSBC Bank Canada 4.80% 2022/04/10 1,300,000 1,323 1,328..
Husky Energy Inc. 5.00% 2020/03/12 Callable 17,568,000 18,433 19,124..
Husky Energy Inc. 3.55% 2025/03/12 Callable 36,149,000 36,109 36,995..
Hydro One Inc. 5.18% 2017/10/18 Callable 3,000,000 3,346 3,152..
Hydro One Inc. 2.78% 2018/10/09 Callable 8,721,000 8,757 9,011..
Hydro One Inc. 3.20% 2022/01/13 Callable 5,500,000 5,674 5,963..
Hydro One Inc. 2.77% 2026/02/24 Callable 4,000,000 3,999 4,181..
Hydro One Inc. 7.35% 2030/06/03 Callable 1,528,000 1,749 2,247..
Hydro One Inc. 6.93% 2032/06/01 Callable 3,750,000 4,658 5,422..
Hydro One Inc. 6.35% 2034/01/31 Callable 3,225,000 3,564 4,486..
Hydro One Inc. 5.36% 2036/05/20 4,550,000 5,151 5,806..
Hydro One Inc. 5.49% 2040/07/16 Callable 4,950,000 6,272 6,565..
Hydro One Inc. 4.39% 2041/09/26 Callable 3,000,000 3,243 3,477..
Hydro One Inc. 4.59% 2043/10/09 Callable 23,712,000 23,861 28,291..
IGM Financial Inc. 7.35% 2019/04/08 800,000 962 916..
IGM Financial Inc. 6.65% 2027/12/13 Series '1997' 1,825,000 2,053 2,384..
IGM Financial Inc. 7.11% 2033/03/07 2,864,000 3,312 3,954..
IGM Financial Inc. 6.00% 2040/12/10 Callable 1,075,000 1,112 1,412
11

The accompanying notes are an integral part of these financial statements.
Imperial Canadian Bond Pool
Schedule of Investment Portfolio (unaudited) As at June 30, 2016 (cont'd)
SecurityCoupon
Rate (%)Maturity
Date Additional Details Par Value
AverageCost
($000s)
FairValue
($000s)
% ofNet
Assets..
Intact Financial Corp. 5.41% 2019/09/03 Callable 2,833,000 2,852 3,132..
Intact Financial Corp. 4.70% 2021/08/18 2,000,000 2,107 2,242..
Intact Financial Corp. 3.77% 2026/03/02 Callable 13,285,000 13,278 14,221..
Intact Financial Corp. 6.40% 2039/11/23 5,375,000 6,607 7,074..
Intact Financial Corp. 5.16% 2042/06/16 Series '5', Callable 10,712,000 11,746 12,352..
Inter Pipeline Ltd. 3.84% 2018/07/30 Callable 1,500,000 1,551 1,559..
Inter Pipeline Ltd. 3.45% 2020/07/20 Callable 3,725,000 3,769 3,910..
Inter Pipeline Ltd. 3.78% 2022/05/30 Callable 2,000,000 2,064 2,133..
Inter Pipeline Ltd. 3.17% 2025/03/24 Series '7', Callable 2,000,000 2,000 2,010..
Inter Pipeline Ltd. 4.64% 2044/05/30 Callable 2,000,000 2,081 2,034..
International Bank for Reconstruction and Development (The) 1.13% 2020/03/11 Series 'GDIF' 5,750,000 5,735 5,749..
International Bank for Reconstruction and Development (The) 1.25% 2021/03/18 2,450,000 2,432 2,458..
Iron Mountain Canada Operations ULC 6.13% 2021/08/15 Callable 11,730,000 11,810 12,136..
John Deere Canada Funding Inc. 2.25% 2017/10/18 4,100,000 4,098 4,154..
Laurentian Bank of Canada 2.56% 2018/03/26 3,600,000 3,576 3,641..
Laurentian Bank of Canada 2.50% 2020/01/23 3,850,000 3,850 3,882..
Loblaw Cos. Ltd. 3.75% 2019/03/12 Callable 3,125,000 3,163 3,296..
Loblaw Cos. Ltd. 5.22% 2020/06/18 Callable 4,800,000 5,120 5,411..
Loblaw Cos. Ltd. 4.86% 2023/09/12 Callable 49,063,000 50,179 56,825..
Loblaw Cos. Ltd. 6.50% 2029/01/22 Callable 1,549,000 1,722 1,998..
Loblaw Cos. Ltd. 6.15% 2035/01/29 Callable 845,000 946 1,079..
Lower Mattagami Energy L.P. 5.14% 2041/05/18 Series '2011-4', Restricted,Callable 1,500,000 1,820 1,914
..
Lundin Mining Corp. 7.50% 2020/11/01 Callable, USD 8,487,000 9,594 11,239..
Lundin Mining Corp. 7.88% 2022/11/01 Callable, USD 7,275,000 8,215 9,657..
Magna International Inc. 3.10% 2022/12/15 Callable 24,734,000 24,946 25,871..
Manitoba Telecom Services Inc. 5.63% 2019/12/16 Series '8', Callable 2,075,000 2,090 2,325..
Manufacturers Life Insurance Co. (The) 2.82% 2023/02/26 Callable 10,935,000 11,087 11,067..
Manufacturers Life Insurance Co. (The) 2.81% 2024/02/21 Variable Rate, Callable 1,675,000 1,675 1,700..
Manufacturers Life Insurance Co. (The) 2.10% 2025/06/01 Variable Rate, Callable 6,550,000 6,542 6,488..
Manufacturers Life Insurance Co. (The) 2.39% 2026/01/05 Variable Rate, Callable 4,275,000 4,275 4,272..
Manufacturers Life Insurance Co. (The) 3.18% 2027/11/22 Variable Rate, Callable 48,675,000 48,644 50,361..
Manulife Financial Capital Trust II 7.41% 2019/12/31 Series '1', Variable Rate,Callable 39,389,000 44,891 45,283
..
Manulife Financial Corp. 5.51% 2018/06/26 Callable 1,500,000 1,662 1,609..
Manulife Financial Corp. 7.77% 2019/04/08 Callable 9,854,000 11,466 11,402..
Master Credit Card Trust 2.63% 2017/01/21 11,023,000 11,048 11,121..
Master Credit Card Trust II 2.72% 2018/11/21 35,744,000 36,071 36,930..
Mattamy Group Corp. 6.88% 2020/11/15 Callable 19,247,000 19,287 19,135..
Melancthon Wolfe Wind L.P. 3.83% 2028/12/31 Restricted, Callable 1,000,000 1,000 1,014..
Metro Inc. 3.20% 2021/12/01 Series 'C', Restricted, Callable 20,500,000 20,910 21,598..
Metro Inc. 5.97% 2035/10/15 Callable 9,110,000 10,063 11,162..
Metro Inc. 5.03% 2044/12/01 Series 'D', Restricted, Callable 21,312,000 21,417 23,931..
Millar Western Forest Products Ltd. 8.50% 2021/04/01 Callable, USD 12,382,000 12,151 7,439..
National Bank of Canada 2.79% 2018/08/09 3,000,000 3,147 3,090..
National Bank of Canada 2.11% 2022/03/18 36,077,000 36,089 36,702..
NAV Canada 4.40% 2021/02/18 Callable 2,500,000 2,553 2,839..
NAV Canada 7.56% 2027/03/01 Series '97-2', Callable 1,577,949 1,869 2,068..
NAV Canada 7.40% 2027/06/01 Series '96-3' 1,750,000 2,108 2,601..
NBC Asset Trust 7.24% 2018/06/30 Variable Rate, Perpetual 4,582,000 5,018 5,013..
NBC Asset Trust 7.45% 2020/06/30 Series '2', Variable Rate,Perpetual 16,191,000 19,332 18,795
..
North Battleford Power L.P. 4.96% 2032/12/31 Series 'A', Sinkable 2,927,754 2,928 3,401..
North West Redwater Partnership / NWR Financing Co. Ltd. 3.20% 2024/07/22 Series 'A', Callable 17,425,000 17,521 18,184..
North West Redwater Partnership / NWR Financing Co. Ltd. 3.20% 2026/04/24 Callable 6,425,000 6,441 6,621..
North West Redwater Partnership / NWR Financing Co. Ltd. 4.25% 2029/06/01 Series 'F', Callable 5,200,000 5,186 5,642..
North West Redwater Partnership / NWR Financing Co. Ltd. 4.15% 2033/06/01 Series 'H', Restricted, Callable 32,180,000 32,099 33,022..
North West Redwater Partnership / NWR Financing Co. Ltd. 3.70% 2043/02/23 Series 'D', Restricted, Callable 3,050,000 3,055 2,854..
North West Redwater Partnership / NWR Financing Co. Ltd. 4.05% 2044/07/22 Callable 11,805,000 11,762 12,049..
NOVA Gas Transmission Ltd. 9.90% 2024/12/16 Series '23' 425,000 576 650..
Nova Scotia Power Inc. 6.95% 2033/08/25 1,200,000 1,416 1,725..
Nova Scotia Power Inc. 5.95% 2039/07/27 Callable 4,883,000 4,947 6,677..
Nova Scotia Power Inc. 4.50% 2043/07/20 Callable 1,925,000 2,061 2,231..
OMERS Realty Corp. 2.50% 2018/06/05 Series '1', Restricted 2,000,000 2,018 2,044..
OMERS Realty Corp. 3.36% 2023/06/05 Series '2', Restricted 3,000,000 3,231 3,275..
OMERS Realty Corp. 3.33% 2024/11/12 Series '6', Restricted 3,000,000 3,000 3,272..
Original Wempi Inc. 4.06% 2024/02/13 Series 'B2', Sinkable, Callable 12,708,256 12,735 13,589..
Original Wempi Inc. 4.31% 2024/02/13 Series 'B1', Callable 2,000,000 2,118 2,182..
Paramount Resources Ltd. 6.88% 2023/06/30 Callable, USD 12,227,000 14,846 12,479..
Parkland Fuel Corp. 5.50% 2021/05/28 Restricted, Callable 2,312,000 2,313 2,343..
Parkland Fuel Corp. 6.00% 2022/11/21 Restricted, Callable 12,456,000 12,458 12,643..
Pearson International Fuel Facilities Corp. 5.09% 2032/03/09 Series 'A', Callable 154,478 163 172..
Pembina Pipeline Corp. 3.77% 2022/10/24 4,725,000 4,782 4,939..
Pembina Pipeline Corp. 3.54% 2025/02/03 Series '5', Callable 4,000,000 3,983 4,019..
Pembina Pipeline Corp. 4.75% 2043/04/30 Callable 3,475,000 3,359 3,299..
Pembina Pipeline Corp. 4.81% 2044/03/25 Series '4', Callable 2,000,000 2,070 1,914..
Penske Truck Leasing Canada Inc. 3.65% 2018/02/01 Callable 23,187,000 23,595 23,730..
Penske Truck Leasing Canada Inc. 2.95% 2020/06/12 6,515,000 6,523 6,602..
Plenary Health Bridgepoint L.P. 7.25% 2042/08/31 Callable 777,349 1,019 1,122..
Plenary Health Care Partnerships Humber L.P. 4.90% 2039/05/31 Callable 1,777,993 1,778 2,050..
Plenary Health Care Partnerships Humber L.P. 4.82% 2044/11/30 Callable 12,321,000 12,599 14,807..
Plenary Properties LTAP L.P. 6.29% 2044/01/31 Callable 36,882,852 42,048 49,814..
Power Corp. of Canada 7.57% 2019/04/22 Callable 900,000 928 1,034..
Power Corp. of Canada 8.57% 2039/04/22 Callable 150,000 248 242..
Quebecor Media Inc. 7.38% 2021/01/15 Callable 9,286,000 9,375 9,622
12

The accompanying notes are an integral part of these financial statements.
Imperial Canadian Bond Pool
Schedule of Investment Portfolio (unaudited) As at June 30, 2016 (cont'd)
SecurityCoupon
Rate (%)Maturity
Date Additional Details Par Value
AverageCost
($000s)
FairValue
($000s)
% ofNet
Assets..
Quebecor Media Inc. 6.63% 2023/01/15 Callable 27,647,000 28,141 28,722..
RBC Capital Trust 6.82% 2018/06/30 Series '2018', Variable Rate,Perpetual 37,632,000 43,920 41,036
..
Reliance L.P. 5.19% 2019/03/15 1,700,000 1,813 1,790..
RioCan REIT 3.85% 2019/06/28 Series 'Q', Callable 4,100,000 4,204 4,338..
RioCan REIT 3.62% 2020/06/01 Series 'U' 4,700,000 4,773 4,984..
RioCan REIT 3.72% 2021/12/13 Series 'R' 6,950,000 6,914 7,469..
RioCan REIT 3.73% 2023/04/18 Series 'T' 12,576,000 12,607 13,441..
RioCan REIT 3.29% 2024/02/12 5,700,000 5,695 5,894..
Rogers Communications Inc. 3.00% 2017/06/06 Callable 900,000 899 913..
Rogers Communications Inc. 5.38% 2019/11/04 Callable 1,875,000 1,874 2,090..
Rogers Communications Inc. 5.34% 2021/03/22 Callable 6,075,000 6,689 6,964..
Rogers Communications Inc. 4.00% 2022/06/06 Callable 16,083,000 16,294 17,628..
Rogers Communications Inc. 4.00% 2024/03/13 Callable 33,129,000 33,403 36,367..
Rogers Communications Inc. 6.68% 2039/11/04 Callable 2,080,000 2,078 2,791..
Rogers Communications Inc. 6.11% 2040/08/25 39,971,000 42,493 50,283..
Rogers Communications Inc. 6.56% 2041/03/22 Callable 2,425,000 2,562 3,225..
Royal Bank of Canada 2.36% 2017/09/21 2,050,000 2,050 2,080..
Royal Bank of Canada 2.26% 2018/03/12 6,600,000 6,576 6,710..
Royal Bank of Canada 2.82% 2018/07/12 26,025,000 26,090 26,789..
Royal Bank of Canada 2.89% 2018/10/11 3,900,000 3,900 4,035..
Royal Bank of Canada 2.77% 2018/12/11 1,150,000 1,150 1,189..
Royal Bank of Canada 2.98% 2019/05/07 6,400,000 6,387 6,683..
Royal Bank of Canada 2.35% 2019/12/09 Variable Rate 2,375,000 2,375 2,445..
Royal Bank of Canada 1.92% 2020/07/17 23,987,000 24,041 24,338..
Royal Bank of Canada 2.86% 2021/03/04 55,924,000 56,493 59,060..
Royal Bank of Canada 2.03% 2021/03/15 38,450,000 38,485 39,186..
Royal Bank of Canada 1.97% 2022/03/02 54,151,000 54,258 54,779..
Royal Bank of Canada 2.99% 2024/12/06 Variable Rate, Callable 26,550,000 26,778 27,347..
Scotiabank Capital Trust 5.65% 2056/12/31 Series '06-1', Callable 11,382,000 13,024 13,213..
Scotiabank Tier I Trust 7.80% 2019/06/30 Variable Rate, Callable 28,953,000 33,519 32,924..
SGTP Highway Bypass L.P. 4.11% 2045/01/31 Series 'A', Sinkable, Callable 19,596,000 19,599 20,725..
Shaw Communications Inc. 5.65% 2019/10/01 Callable 3,975,000 3,983 4,398..
Shaw Communications Inc. 5.50% 2020/12/07 Callable 1,250,000 1,245 1,411..
Shaw Communications Inc. 4.35% 2024/01/31 Callable 1,300,000 1,377 1,417..
Shaw Communications Inc. 6.75% 2039/11/09 Callable 8,300,000 9,558 10,409..
Sherritt International Corp. 8.00% 2018/11/15 Series '1', Callable 5,162,988 5,099 2,988..
Sherritt International Corp. 7.50% 2020/09/24 Series '2', Callable 4,623,326 4,523 2,491..
Sherritt International Corp. 7.88% 2022/10/11 Callable 7,565,000 7,294 3,852..
Shoppers Drug Mart Corp. 2.36% 2018/05/24 Series '6', Callable 4,200,000 4,098 4,266..
Sirius XM Canada Holdings Inc. 5.63% 2021/04/23 Callable 6,998,000 6,999 6,973..
SNC-Lavalin Group Inc. 6.19% 2019/07/03 Callable 21,632,000 23,792 23,996..
SNC-Lavalin Innisfree McGill Finance Inc. 6.63% 2044/06/30 Callable 23,727,244 26,580 31,936..
Sobeys Inc. 7.16% 2018/02/26 2,000,000 2,287 2,155..
Sobeys Inc. 3.52% 2018/08/08 5,436,000 5,455 5,570..
Sobeys Inc. 4.70% 2023/08/08 Callable 29,292,000 29,899 31,949..
SSL Finance Inc. / SSL Financement Inc. 4.10% 2045/10/31 Sinkable, Restricted, Callable 2,175,000 2,175 2,283..
Sun Life Capital Trust 7.09% 2052/06/30 Series 'B', Callable 4,202,000 5,071 5,421..
Sun Life Capital Trust II 5.86% 2019/12/31 Callable 6,125,000 6,640 6,745..
Sun Life Financial Inc. 5.70% 2019/07/02 Series 'D', Callable 2,250,000 2,279 2,511..
Sun Life Financial Inc. 4.38% 2022/03/02 Series '2012-1', VariableRate, Callable 28,898,000 29,109 29,381
..
Sun Life Financial Inc. 2.77% 2024/05/13 Series '14-1', Variable Rate,Callable 13,863,000 13,866 14,027
..
Sun Life Financial Inc. 2.60% 2025/09/25 Variable Rate, Callable 9,982,000 9,975 10,048..
Sun Life Financial Inc. 3.10% 2026/02/19 Variable Rate, Callable 34,560,000 34,520 35,540..
Suncor Energy Inc. 5.80% 2018/05/22 Series '4', Callable 3,639,000 3,639 3,921..
Suncor Energy Inc. 3.10% 2021/11/26 Series '5', Callable 16,867,000 16,835 17,790..
Suncor Energy Inc. 5.39% 2037/03/26 Callable 8,108,000 8,435 9,191..
Superior Plus L.P. 6.50% 2021/12/09 Callable 11,154,000 11,152 11,182..
TD Capital Trust III 7.24% 2018/12/31 Variable Rate, Perpetual 15,732,000 17,836 17,641..
TD Capital Trust IV 6.63% 2021/06/30 Variable Rate, Callable 21,048,000 22,077 24,524..
TD Capital Trust IV 10.00% 2039/06/30 Series '2', Variable Rate,Callable 3,925,000 5,539 5,349
..
TD Capital Trust IV 9.52% 2039/06/30 Series '1', Variable Rate,Callable 11,070,000 13,644 13,139
..
TELUS Communications Inc. 10.65% 2021/06/19 Series '3' 2,965,000 4,504 4,116..
TELUS Corp. 5.05% 2019/12/04 Series 'CG', Callable 2,575,000 2,560 2,841..
TELUS Corp. 5.05% 2020/07/23 Series 'CH', Callable 34,719,000 36,829 38,852..
TELUS Corp. 3.20% 2021/04/05 Series 'CO', Callable 9,850,000 9,824 10,329..
TELUS Corp. 2.35% 2022/03/28 Callable 16,548,000 16,498 16,642..
TELUS Corp. 3.35% 2023/03/15 Series 'CJ', Callable 18,667,000 18,660 19,692..
TELUS Corp. 3.35% 2024/04/01 Callable 13,900,000 13,821 14,596..
TELUS Corp. 3.75% 2025/01/17 Callable 15,939,000 15,988 17,086..
TELUS Corp. 3.75% 2026/03/10 Callable 3,925,000 3,894 4,173..
TELUS Corp. 4.40% 2043/04/01 Callable 50,055,000 49,720 49,498..
TELUS Corp. 5.15% 2043/11/26 Callable 14,267,000 14,842 15,736..
TELUS Corp. 4.75% 2045/01/17 Callable 5,325,000 5,313 5,558..
Teranet Holdings L.P. 4.81% 2020/12/16 Callable 35,751,000 37,646 39,573..
Teranet Holdings L.P. 3.27% 2031/12/01 Callable 18,584,000 20,709 22,973..
Teranet Holdings L.P. 5.75% 2040/12/17 Callable 9,350,000 10,129 11,125..
Teranet Holdings L.P. 6.10% 2041/06/17 Callable 2,000,000 1,999 2,531..
Terasen Gas Inc. 6.00% 2037/10/02 Callable 2,800,000 3,250 3,858..
Thomson Reuters Corp. 4.35% 2020/09/30 Callable 7,000,000 7,135 7,619..
Thomson Reuters Corp. 3.31% 2021/11/12 Callable 25,425,000 25,444 26,685..
TMX Group Ltd. 3.25% 2018/10/03 1,925,000 1,940 1,998
13

The accompanying notes are an integral part of these financial statements.
Imperial Canadian Bond Pool
Schedule of Investment Portfolio (unaudited) As at June 30, 2016 (cont'd)
SecurityCoupon
Rate (%)Maturity
Date Additional Details Par Value
AverageCost
($000s)
FairValue
($000s)
% ofNet
Assets..
Toronto Hospital 5.64% 2022/12/08 Series 'DOM1' 1,987,110 2,150 2,239..
Toronto Hydro Corp. 4.49% 2019/11/12 Series '3', Callable 1,786,000 1,806 1,966..
Toronto Hydro Corp. 3.54% 2021/11/18 Callable 1,000,000 999 1,100..
Toronto Hydro Corp. 2.91% 2023/04/10 Series '8', Callable 3,550,000 3,546 3,773..
Toronto-Dominion Bank (The) 4.78% 2016/12/14 Variable Rate, Callable 21,388,000 21,054 21,665..
Toronto-Dominion Bank (The) 2.43% 2017/08/15 7,475,000 7,475 7,584..
Toronto-Dominion Bank (The) 5.76% 2017/12/18 Variable Rate, Callable 37,590,000 40,716 39,634..
Toronto-Dominion Bank (The) 2.45% 2019/04/02 44,543,000 45,189 45,885..
Toronto-Dominion Bank (The) 1.69% 2020/04/02 37,761,000 37,716 38,069..
Toronto-Dominion Bank (The) 2.05% 2021/03/08 14,925,000 14,925 15,251..
Toronto-Dominion Bank (The) 1.68% 2021/06/08 Series 'CBL14' 21,020,000 21,012 21,191..
Toronto-Dominion Bank (The) 2.62% 2021/12/22 2,275,000 2,332 2,388..
Toronto-Dominion Bank (The) 5.83% 2023/07/09 Variable Rate, Callable 1,500,000 1,713 1,620..
Toronto-Dominion Bank (The) 3.23% 2024/07/24 25,400,000 26,342 27,791..
Toronto-Dominion Bank (The) 4.86% 2031/03/04 Variable Rate, Callable 68,135,000 70,736 74,596..
Toyota Credit Canada Inc. 2.20% 2017/10/19 1,025,000 1,024 1,038..
Toyota Credit Canada Inc. 2.75% 2018/07/18 2,925,000 2,925 3,006..
Toyota Credit Canada Inc. 1.80% 2020/02/19 Restricted 7,050,000 7,041 7,114..
TransAlta Corp. 6.40% 2019/11/18 Callable 3,050,000 3,134 3,070..
TransCanada PipeLines Ltd. 11.80% 2020/11/20 Series 'U' 1,480,000 2,228 2,059..
TransCanada PipeLines Ltd. 3.65% 2021/11/15 Callable 1,500,000 1,558 1,618..
TransCanada PipeLines Ltd. 3.69% 2023/07/19 Callable 12,495,000 12,865 13,536..
TransCanada PipeLines Ltd. 7.31% 2027/01/15 5,025,000 6,177 6,537..
TransCanada PipeLines Ltd. 7.90% 2027/04/15 Callable 234,000 308 317..
TransCanada PipeLines Ltd. 6.89% 2028/08/07 3,000,000 3,286 3,887..
TransCanada PipeLines Ltd. 8.21% 2030/04/25 2,198,000 2,641 3,145..
TransCanada PipeLines Ltd. 8.05% 2039/02/17 Callable 1,800,000 2,686 2,807..
TransCanada PipeLines Ltd. 4.55% 2041/11/15 Callable 2,550,000 2,639 2,766..
TransCanada PipeLines Ltd. 4.35% 2046/06/06 Callable 15,960,000 15,923 16,663..
TransEd Partners General Partnership 3.95% 2050/09/30 Series 'A', Callable 1,825,000 1,688 1,724..
Union Gas Ltd. 5.35% 2018/04/27 Series '6', Callable 2,550,000 2,923 2,727..
Union Gas Ltd. 8.75% 2018/08/03 Series '1993', Callable 4,735,000 6,240 5,385..
Union Gas Ltd. 2.76% 2021/06/02 Series '11', Callable 10,208,000 10,217 10,696..
Union Gas Ltd. 4.85% 2022/04/25 Series '6', Callable 2,710,000 2,702 3,146..
Union Gas Ltd. 3.19% 2025/09/17 Callable 5,995,000 5,998 6,413..
Union Gas Ltd. 8.65% 2025/11/10 1,025,000 1,246 1,511..
Union Gas Ltd. 2.81% 2026/06/01 Callable 4,350,000 4,350 4,469..
Union Gas Ltd. 6.05% 2038/09/02 Callable 2,175,000 3,029 3,019..
Union Gas Ltd. 5.20% 2040/07/23 Callable 11,105,000 11,660 14,082..
Union Gas Ltd. 4.88% 2041/06/21 Callable 3,975,000 4,287 4,851..
Ventas Canada Finance Ltd. 3.30% 2022/02/01 Callable 2,625,000 2,625 2,716..
Veresen Inc. 3.95% 2017/03/14 Callable 1,800,000 1,880 1,816..
Videotron Ltd. 5.63% 2025/06/15 Restricted, Callable 13,833,000 13,827 14,308..
VW Credit Canada Inc. 2.45% 2017/11/14 Restricted 2,375,000 2,374 2,397..
Wells Fargo Financial Canada Corp. 2.78% 2018/11/15 17,484,000 17,497 18,074..
Wells Fargo Financial Canada Corp. 2.94% 2019/07/25 26,698,000 26,815 27,904..
Wells Fargo Financial Canada Corp. 3.04% 2021/01/29 44,835,000 45,284 47,584..
Wells Fargo Financial Canada Corp. 3.46% 2023/01/24 1,475,000 1,475 1,611..
Westcoast Energy Inc. 8.50% 2018/09/04 Series 'O' 2,828,000 3,655 3,210..
Westcoast Energy Inc. 5.60% 2019/01/16 3,300,000 3,694 3,590..
Westcoast Energy Inc. 9.90% 2020/01/10 Series 'S' 1,509,000 2,213 1,887..
Westcoast Energy Inc. 4.57% 2020/07/02 Series '10', Callable 8,740,000 8,847 9,521..
Westcoast Energy Inc. 3.12% 2022/12/05 26,796,000 26,717 27,696..
Westcoast Energy Inc. 3.43% 2024/09/12 Series '15', Callable 2,450,000 2,449 2,542..
Westcoast Energy Inc. 8.85% 2025/07/21 9,220,000 12,553 12,885..
Westcoast Energy Inc. 6.75% 2027/12/15 Callable 1,599,000 1,591 2,029..
....
4,808,699 5,010,895 39.7%..
..
TOTAL CANADIAN BONDS 11,266,021 11,848,476 93.7%..x
INTERNATIONAL BONDS..
2Australia (note 10)..
Commonwealth Bank of Australia 5.15% 2020/04/09 19,946,000 20,290 22,334..
FMG Resources (August 2006) Pty. Ltd. 6.88% 2022/04/01 Callable, USD 11,953,000 13,036 14,664..
....
33,326 36,998 0.3%..
x2Cayman Islands (note 10)..
Seagate HDD Cayman 4.75% 2025/01/01 Callable, USD 11,645,000 13,160 11,835..
....
13,160 11,835 0.1%..
x2Luxembourg (note 10)..
Intelsat Jackson Holdings SA 7.25% 2020/10/15 Callable, USD 10,800,000 11,183 9,988..
....
11,183 9,988 0.1%..
x1Mexico (note 10)..
United Mexican States 10.00% 2024/12/05 Series 'M20', MXN 245,900,000 26,602 22,188..
....
26,602 22,188 0.2%..
x2Netherlands (note 10)..
Fiat Chrysler Automobiles NV 4.50% 2020/04/15 Callable, USD 2,540,000 3,200 3,301..
Fiat Chrysler Automobiles NV 5.25% 2023/04/15 Callable, USD 10,515,000 13,164 13,408..
....
16,364 16,709 0.1%..x
United Kingdom..
Aviva PLC 4.50% 2021/05/10 Restricted 19,715,000 19,652 20,522..
....
19,652 20,522 0.2%..
14

The accompanying notes are an integral part of these financial statements.
Imperial Canadian Bond Pool
Schedule of Investment Portfolio (unaudited) As at June 30, 2016 (cont'd)
SecurityCoupon
Rate (%)Maturity
Date Additional Details Par Value
AverageCost
($000s)
FairValue
($000s)
% ofNet
Assetsx2United States (note 10)
..
Alere Inc. 6.50% 2020/06/15 Callable, USD 4,370,000 4,571 5,646..
Aleris International Inc. 7.88% 2020/11/01 Callable, USD 7,027,000 7,973 8,080..
Anheuser-Busch InBev Finance Inc. 2.38% 2018/01/25 Callable 19,401,000 19,345 19,697..
CHS / Community Health Systems Inc. 7.13% 2020/07/15 Callable, USD 8,271,000 8,947 9,960..
Communications Sales & Leasing Inc. / CSL Capital LLC 8.25% 2023/10/15 Callable, USD 14,540,000 18,270 19,149..
Fresenius Medical Care US Finance II Inc. 5.88% 2022/01/31 Callable, USD 3,169,000 3,294 4,509..
Frontier Communications Corp. 6.25% 2021/09/15 Callable, USD 8,962,000 9,828 10,974..
Frontier Communications Corp. 10.50% 2022/09/15 Series 'WI', Callable, USD 6,257,000 8,411 8,584..
Frontier Communications Corp. 11.00% 2025/09/15 Series 'WI', Callable, USD 7,861,000 10,505 10,550..
General Cable Corp. 5.75% 2022/10/01 Variable Rate, Callable, USD 4,671,000 5,190 5,582..
Great-West Lifeco Finance (Delaware) L.P. II 7.13% 2068/06/26 Variable Rate, Callable 2,000,000 2,351 2,174..
HCA Inc. 7.50% 2022/02/15 Callable, USD 6,920,000 10,108 10,187..
HDTFS Inc. 6.25% 2022/10/15 Callable, USD 10,555,000 11,135 14,114..
Iron Mountain Inc. 5.75% 2024/08/15 Callable, USD 3,589,000 3,831 4,706..
Land O' Lakes Capital Trust I 7.45% 2028/03/15 USD 12,822,000 13,116 18,015..
Landry's Inc. 9.38% 2020/05/01 Callable, USD 7,185,000 8,179 9,758..
Manulife Finance Delaware L.P. 5.06% 2041/12/15 Variable Rate, Callable 4,475,000 4,618 4,717..
MasTec Inc. 4.88% 2023/03/15 Callable, USD 7,450,000 7,312 8,975..
MGM Resorts International 7.75% 2022/03/15 USD 6,785,000 8,717 9,938..
Micron Technology Inc. 5.25% 2024/01/15 Callable, USD 3,540,000 3,626 3,899..
Navistar International Corp. 8.25% 2021/11/01 Callable, USD 12,983,000 13,334 11,867..
NRG Energy Inc. 7.88% 2021/05/15 Callable, USD 7,040,000 9,405 9,459..
NRG Energy Inc. 6.63% 2023/03/15 Callable, USD 7,215,000 9,187 9,228..
Post Holdings Inc. 7.75% 2024/03/15 Callable, USD 4,365,000 5,673 6,224..
Reynolds Group Issuer Inc. / Reynolds Group Issuer LLC /Reynolds Group Issuer (Luxembourg) SA
5.75% 2020/10/15 Callable, USD4,255,000 4,233 5,690
..
Reynolds Group Issuer Inc. / Reynolds Group Issuer LLC /Reynolds Group Issuer (Luxembourg) SA
8.25% 2021/02/15 Callable, USD9,670,000 10,649 13,072
..
Sprint Corp. 7.88% 2023/09/15 USD 14,615,000 17,391 15,530..
Tenet Healthcare Corp. 5.00% 2019/03/01 Callable, USD 5,822,000 6,467 7,315..
Tenet Healthcare Corp. 8.13% 2022/04/01 Callable, USD 15,716,000 20,697 20,909..
T-Mobile USA Inc. 6.63% 2023/04/01 Callable, USD 11,255,000 11,937 15,459..
Triumph Group Inc. 4.88% 2021/04/01 Callable, USD 3,900,000 4,108 4,762..
Wells Fargo & Co. 2.22% 2021/03/15 24,680,000 24,709 24,965..
Wells Fargo & Co. 3.87% 2025/05/21 Series 'O', Restricted 21,938,000 22,005 23,257..
....
329,122 356,951 2.8%..
..
TOTAL INTERNATIONAL BONDS 449,409 475,191 3.8%..x
SUPRANATIONAL BONDS..
Asian Development Bank 4.65% 2027/02/16 3,000,000 3,002 3,717..
Inter-American Development Bank 4.40% 2026/01/26 42,553,000 43,950 51,586..
....
46,952 55,303 0.4%..
..
TOTAL SUPRANATIONAL BONDS 46,952 55,303 0.4%..
..
TOTAL BONDS 11,762,382 12,378,970 97.9%..
..
TOTAL INVESTMENTS BEFORE SHORT-TERM INVESTMENTS 11,762,382 12,378,970 97.9%..x
SHORT-TERM INVESTMENTS..
Government of Canada 0.56% 2016/07/28 Treasury Bill 10,550,000 10,534 10,546..
Government of Canada 0.54% 2016/08/11 Treasury Bill 30,525,000 30,481 30,507..
Government of Canada 0.54% 2016/08/25 Treasury Bill 5,600,000 5,592 5,595..
Government of Canada 0.53% 2016/09/08 Treasury Bill 51,175,000 51,103 51,124..
Government of Canada 0.51% 2016/09/22 Treasury Bill 52,875,000 52,802 52,813..
Government of Canada 0.49% 2016/10/06 Treasury Bill 6,000,000 5,992 5,992..
Royal Bank of Canada 0.45% 2016/07/04 Term Deposit 1,650,000 1,650 1,650..
....
TOTAL SHORT-TERM INVESTMENTS 158,154 158,227 1.3%..
..
Less: Transaction costs included in average cost –.
..
..
TOTAL INVESTMENTS 11,920,536 12,537,197 99.2%..
..
Derivative assets 1,348 0.0%..
Derivative liabilities (7,250) (0.1)%..
Other Assets, less Liabilities 111,084 0.9%..
....
TOTAL NET ASSETS ATTRIBUTABLE TO HOLDERS OFREDEEMABLE UNITS 12,642,379 100.0%
.
...
1-2Hedging reference number. Refers to a corresponding number on the Schedule of Derivative Assets and Liabilities - Forward Foreign Currency Contracts.x
x
Schedule of Derivative Assets and Liabilities - Forward Foreign Currency Contracts (note 10)
Hedging Ref.No.** Counterparty
Credit Rating forCounterparty*
SettlementDate
CurrencyBuys Par Value
CurrencySells Par Value Forward Rate Current Rate
Unrealized Gain(Loss) ($000s)
x..
1 Royal Bank of Canada A-1+ 2016/07/07 MXN 309,335,000 CAD 21,750,151 0.070 0.071 105..
1 Royal Bank of Canada A-1+ 2016/07/07 MXN 3,570,000 CAD 246,604 0.069 0.071 5..
1 Royal Bank of Canada A-1+ 2016/07/07 CAD 23,318,404 MXN 312,905,000 13.419 14.154 1,211..
1 Royal Bank of Canada A-1+ 2016/10/07 CAD 21,547,136 MXN 309,335,000 14.356 14.290 (99)..
2 State Street Trust Co. Canada A-1+ 2016/09/13 USD 3,660,000 CAD 4,784,846 1.307 1.292 (57)..
2 Bank of Montreal A-1 2016/09/13 CAD 21,256,383 USD 16,600,000 0.781 0.774 (187)..
2 Bank of Montreal A-1 2016/09/13 CAD 14,279,384 USD 11,200,000 0.784 0.774 (189)..
2 Royal Bank of Canada A-1+ 2016/09/13 CAD 363,634,274 USD 286,684,895 0.788 0.774 (6,691)..
2 Royal Bank of Canada A-1+ 2016/09/13 CAD 2,593,460 USD 2,025,000 0.781 0.774 (22)..
2 Royal Bank of Canada A-1+ 2016/09/13 CAD 2,384,761 USD 1,850,000 0.776 0.774 (5)
15

The accompanying notes are an integral part of these financial statements.
Imperial Canadian Bond Pool
Hedging Ref.No.** Counterparty
Credit Rating forCounterparty*
SettlementDate
CurrencyBuys Par Value
CurrencySells Par Value Forward Rate Current Rate
Unrealized Gain(Loss) ($000s)
..
2 State Street Trust Co. Canada A-1+ 2016/09/13 CAD 8,002,800 USD 6,175,000 0.772 0.774 27......
Derivative Assets and Liabilities - Forwards (5,902)..
..
* The credit rating of each counterparty (as rated by S&P Global Ratings, a division of S&P Global) of the forward foreign currency contracts held by the Pool meets or exceeds the minimum approved credit rating...
** See corresponding reference number on the Schedule of Investment Portfolio.
16

The accompanying notes are an integral part of these financial statements.
Imperial Canadian Bond Pool
Supplemental Schedule to Schedule of Investment Portfolio (unaudited)
Offsetting Arrangements (note 2d)
(in 000s)
The Pool may enter into various master netting arrangements or other similar agreements that do not meet the criteria for offsetting in the Statements of Financial Position but still allowfor the related amounts to be set off in certain circumstances, such as bankruptcy or the termination of the contracts.
The following table reconciles the net amount of “Over-The-Counter” derivatives presented in the Statements of Financial Position, as at June 30, 2016 and December 31, 2015, to:
l The gross amount before offsetting required under IFRS; and
l The net amount after offsetting under the terms of master netting arrangements or other similar arrangements, but which do not meet the criteria for offsetting under IFRS.
x
Financial Assets and Liabilities Amounts Offset Amounts Not Offset Net
Gross Assets(Liabilities)
Amounts Offset UnderIFRS
Net AmountsPresented onStatements of
Financial PositionMaster NettingArrangements
Cash CollateralReceived
x..
As at June 30, 2016..
OTC Derivative Assets $ 1,348 $ – $ 1,348 $ (1,348) $ – $ –..
OTC Derivative Liabilities (7,250) – (7,250) 1,348 – (5,902)......
Total $ (5,902) $ – $ (5,902) $ – $ – $ (5,902)..
..
As at December 31, 2015..
OTC Derivative Assets $ 302 $ – $ 302 $ (294) $ – $ 8..
OTC Derivative Liabilities (8,853) – (8,853) 294 – (8,559)......
Total $ (8,551) $ – $ (8,551) $ – $ – $ (8,551)..
Interests in Underlying Funds (note 4)
As at June 30, 2016 and December 31, 2015, the Pool had no investments in underlying funds where the ownership exceeded 20% of each underlying fund.
17

The accompanying notes are an integral part of these financial statements.
Imperial Canadian Bond Pool
Financial Instrument RisksInvestment Objective: Imperial Canadian Bond Pool (the Pool) seeks to provide a highlevel of interest income and some capital growth, while attempting to preserve capital byinvesting primarily in bonds, debentures, notes, other debt instruments (whether securedor unsecured), preferred shares, and convertible preferred shares of Canadian andnon-Canadian issuers.
Investment Strategies: The term-to-maturity of the Pool is adjusted to reflect the portfolioadvisor’s outlook for interest rates. Pool assets are then allocated to sectors of the bondmarket based on market outlook. Adjustments to the portfolio are based on a review ofmacroeconomic and capital market conditions both inside and outside of Canada, alongwith detailed issuer credit reviews.
Significant risks that are relevant to the Pool are discussed here. General information onrisk management and specific discussion on concentration, credit, currency, interest rate,liquidity, and other price/market risk can be found in note 2 of the financial statements.
In the following risk tables, Net Assets is defined as meaning “Net assets attributable toholders of redeemable units".
Concentration Risk as at June 30, 2016 and December 31, 2015The Schedule of Investment Portfolio presents the securities held by the Pool as at June30, 2016.The following table presents the investment sectors held by the Pool as at December 31,2015 and groups the securities by asset type, industry sector, geographic region, orcurrency exposure:
As at December 31, 2015
Portfolio Breakdown% of Net
Assetsx
x
Canadian Bondsx
Government of Canada & Guaranteed 27.8x
Provincial Government & Guaranteed 22.2x
Municipal Government & Guaranteed 3.4x
Mortgage-Backed Securities 0.5x
Corporate 39.6x
International Bondsx
Australia 0.2x
Cayman Islands 0.1x
Luxembourg 0.1x
Mexico 0.2x
Netherlands 0.2x
United States 3.0x
Supranational Bonds 0.5x
Short-Term Investments 1.7x
Derivative Assets (Liabilities) (0.1)x
Other Assets, less Liabilities 0.6xxx
Total 100.0xx
Credit RiskCredit ratings represent a consolidation of the ratings provided by various outside serviceproviders and are subject to change, which could be material.
See the Schedule of Investment Portfolio for counterparty from over-the-counterderivative contracts, where applicable.
As at June 30, 2016 and December 31, 2015, the Pool invested in debt securities with thefollowing credit ratings:
.
% of Net Assets
Debt Securities by Credit Rating (note 2b) June 30, 2016 December 31, 2015x
x
'AAA' 34.6 37.0x
'AA' 12.3 10.2x
'A' 29.3 28.8x
'BBB' 18.5 18.8x
Below 'BBB' 4.5 4.7xxx
Total 99.2 99.5xx
Currency RiskThe tables that follow indicate the currencies to which the Pool had significant exposureas at June 30, 2016 and December 31, 2015, based on the market value of the Pool'sfinancial instruments (including cash and cash equivalents) and the underlying principalamounts of forward foreign currency contracts, as applicable.
As at June 30, 2016
Currency (note 2l)Total Currency
Exposure* ($000s)% of
Net Assetsx
x
USD 13,891 0.1x
MXN 614 –xxx
* Amounts reflect the carrying value of monetary and non-monetary items (including the notionalamount of forward foreign currency contracts, if any).
As at December 31, 2015
Currency (note 2l)Total Currency
Exposure* ($000s)% of
Net Assetsx
x
USD 7,981 0.1x
MXN 3,099 –x
AUD 340 –x
EUR 91 –xxx
* Amounts reflect the carrying value of monetary and non-monetary items (including the notionalamount of forward foreign currency contracts, if any).
The table that follows indicates how net assets as at June 30, 2016 and December 31,2015 would have decreased or increased had the Canadian dollar strengthened orweakened by 1% in relation to all foreign currencies. This analysis assumes that all othervariables remain unchanged. In practice, the actual results may differ from this analysisand the difference could be material.
June 30, 2016 December 31, 2015x
x
Impact on Net Assets ($000s) 145 115xx
Interest Rate RiskThe Pool’s short-term assets and liabilities were not subject to significant amounts of riskdue to fluctuations in the prevailing level of market interest rates.
The table that follows indicates the Pool’s exposure to fixed income securities byremaining term-to-maturity.
.
June 30, 2016 December 31, 2015Remaining Term-to-Maturity ($000s) ($000s)
xx
Less than 1 year 237,098 141,781x
1-3 years 1,551,179 1,694,739x
3-5 years 2,520,298 2,122,563x
> 5 years 8,070,395 7,450,068xxx
Total 12,378,970 11,409,151xx
The table that follows indicates how net assets as at June 30, 2016 and December 31,2015 would have increased or decreased had the interest rate decreased or increased by25 basis points and assuming a parallel shift in the yield curve. This change is estimatedusing the weighted average duration of the fixed income portfolio. This analysis assumesthat all other variables remain unchanged. In practice, actual results may differ from thisanalysis and the difference could be material..
June 30, 2016 December 31, 2015x
x
Impact on Net Assets ($000s) 260,561 231,839xx
Liquidity RiskLiquidity risk is the risk that the Pool will encounter difficulty in meeting obligationsassociated with financial liabilities. The Pool is exposed to daily cash redemptions ofredeemable units. The Pool maintains sufficient cash on hand to fund anticipatedredemptions.
With the exception of derivative contracts, where applicable, all of the Pool’s financialliabilities are short-term liabilities maturing within 90 days after the period end.
For pools that hold derivative contracts with a term-to-maturity that exceeds 90 days fromthe period end, further information related to those contracts can be referenced in thederivative schedules following the Schedule of Investment Portfolio.
Other Price/Market RiskAs at June 30, 2016 and December 31, 2015, the Pool did not have a significant exposureto other price/market risk.
Fair Value Measurement of Financial InstrumentsThe following is a summary of the inputs used as at June 30, 2016 and December 31,2015 in valuing the Pool’s financial assets and financial liabilities, carried at fair value:
18

The accompanying notes are an integral part of these financial statements.
Imperial Canadian Bond Pool
As at June 30, 2016Level 1 (i) Level 2 (ii) Level 3 (iii) Total
Classification ($000s) ($000s) ($000s) ($000s)xx
Financial Assetsx
Fixed Income Securities – 12,378,970 – 12,378,970x
Short-Term Investments – 158,227 – 158,227x
Derivative assets – 483,850 – 483,850xxx
Total Financial Assets – 13,021,047 – 13,021,047xx
x
Financial Liabilitiesx
Derivative liabilities – (489,752) – (489,752)xxx
Total Financial Liabilities – (489,752) – (489,752)xx
x
Total Financial Assets and Liabilities – 12,531,295 – 12,531,295xx
x
(i) Quoted prices in active markets for identical assetsx
(ii) Significant other observable inputsx
(iii) Significant unobservable inputs
As at December 31, 2015Level 1 (i) Level 2 (ii) Level 3 (iii) Total
Classification ($000s) ($000s) ($000s) ($000s)xx
Financial Assetsx
Fixed Income Securities – 11,409,151 – 11,409,151x
Short-Term Investments – 201,917 – 201,917x
Derivative assets – 511,652 – 511,652xxx
Total Financial Assets – 12,122,720 – 12,122,720xx
x
Financial Liabilitiesx
Derivative liabilities – (520,203) – (520,203)xxx
Total Financial Liabilities – (520,203) – (520,203)xx
x
Total Financial Assets and Liabilities – 11,602,517 – 11,602,517xx
x
(i) Quoted prices in active markets for identical assetsx
(ii) Significant other observable inputsx
(iii) Significant unobservable inputs
Transfer of assets between Level 1 and Level 2Financial assets and liabilities transferred from Level 1 to Level 2 are the result ofsecurities no longer being traded in an active market.
For the periods ended June 30, 2016 and December 31, 2015, there were no transfers offinancial assets and liabilities from Level 1 to Level 2.
Financial assets and liabilities transferred from Level 2 to Level 1 are the result ofsecurities now being traded in an active market.
For the periods ended June 30, 2016 and December 31, 2015, there were no transfers offinancial assets and liabilities from Level 2 to Level 1.
Reconciliation of financial asset and liability movement – Level 3The Pool did not hold any significant positions of Level 3 investments at the beginning of,during, or at the end of either reporting period.
19

Notes to Financial Statements (unaudited)
x
As at and for the periods as disclosed in the financial statements (note 1)
1. Organization of the Funds and Financial Reporting Periods
The Imperial Pools consist of Imperial Money Market Pool, Imperial Short-Term Bond Pool, Imperial Canadian Bond Pool, Imperial Canadian Diversified Income Pool, Imperial International Bond Pool, Imperial EquityHigh Income Pool, Imperial Canadian Dividend Income Pool, Imperial Global Equity Income Pool, Imperial Canadian Equity Pool, Imperial U.S. Equity Pool, Imperial International Equity Pool, Imperial Overseas Equity Pool,and Imperial Emerging Economies Pool (individually, a Pool, and collectively, the Pools).
Conservative Income Portfolio, Balanced Income Portfolio and Enhanced Income Portfolio (individually, a Portfolio, and collectively, the Portfolios) were established on December 14, 2015.
Each of the Imperial Pools and Portfolios (individually, a Fund, and collectively, the Funds) is a mutual fund trust organized under the laws of Ontario and governed by a declaration of trust (Declaration of Trust). Theaddress of the Funds' registered office is 18 York Street, Suite 1300, Toronto, Ontario.
Canadian Imperial Bank of Commerce (CIBC) is the manager (the Manager) of the Funds and CIBC Trust Corporation is the trustee (the Trustee) of the Funds. Each Fund may issue an unlimited number of classes ofunits and an unlimited number of units of each class. As at the date of these financial statements, Class A units of each of the Funds are available for sale, except for the Conservative Income Portfolio which offersClass T3 and Class T4 units, the Balanced Income Portfolio which offers Class T4 and Class T5 units, and the Enhanced Income Portfolio which offers Class T5 and Class T6 units.
The date upon which each Fund was established by Declaration of Trust (Date Established) and the date upon which units of each Fund was first sold to the public (Inception Date) are reported in footnote Organizationof the Fund on the Statements of Financial Position.
The Schedule of Investment Portfolio of each Fund is as at June 30, 2016. The Statements of Financial Position of each of the Funds are as at June 30, 2016 and December 31, 2015. The Statements of ComprehensiveIncome, Statements of Changes in Net Assets Attributable to Holders of Redeemable Units, and Statements of Cash Flows of each of the Funds are for the six-month periods ended June 30, 2016 and December 31,2015, except for Funds established during either year, in which case the information presented is from the Date Established or the Inception Date to June 30, 2016 or 2015.
These financial statements were approved for issuance by the Manager on August 18, 2016.xx
2. Summary of Significant Accounting Policies
These financial statements have been prepared in accordance with International Accounting Standards Interim Financial Reporting (IAS 34) as published by the International Accounting Standards Board (IASB).The Funds adopted IFRS in 2014 as required by Canadian securities legislation and the Canadian Accounting Standards Board. Previously, the Funds prepared their financial statements in accordance with Canadiangenerally accepted accounting principles (GAAP) as defined in Part V of the CPA Canada Handbook.
The financial statements have been prepared on a going concern basis using the historical cost convention. However, each Fund is an investment entity and primarily all financial assets and financial liabilities aremeasured at fair value in accordance with IFRS. Accordingly, the Funds’ accounting policies for measuring the fair value of investments and derivatives are consistent with those used in measuring the Net Asset Valuefor transactions with unitholders. In applying IFRS, these financial statements include estimates and assumptions made by management that affect the reported amounts of assets, liabilities, income, and expensesduring the reporting periods. However, existing circumstances and assumptions may change due to market changes or circumstances arising beyond the control of the Funds. Such changes are reflected in theassumptions when they occur.
These financial statements have been presented in Canadian dollars, which is the Funds’ functional currency (unless otherwise noted).
a) Financial Instruments
Classification and recognition of financial instruments
In accordance with IAS 39 Financial Instruments: Recognition and Measurement, financial assets and financial liabilities are classified at initial recognition into the following categories:
Financial assets and liabilities at fair value through profit or loss (FVTPL)
This category is sub-divided into:
l Financial instruments classified as Held For Trading: Financial assets and liabilities are classified as Held For Trading if they are acquired for the purpose of selling and/or repurchasing in the near term, andare acquired principally for the purpose of generating a profit from short-term fluctuations in price. Derivatives and securities sold short held by the Funds are classified as Held For Trading and do not meetthe definition of effective hedging instruments as defined by IAS 39.
l Financial instruments designated as FVTPL through inception: All investments held by the Funds, excluding those classified as Held For Trading (discussed above), are designated as fair value through profitor loss upon initial recognition. These financial assets are designated upon initial recognition on the basis that they are part of a group of financial assets that are managed and have their performanceevaluated on a fair value basis, in accordance with risk management and investment strategies of the Funds, as set out in the Funds’ prospectus.
Loans and receivables
The Funds include in this category receivable balances relating to portfolio investments and other short-term receivables such as receivable for units issued.
Other financial liabilities
This category includes all financial liabilities, other than those classified as fair value through profit or loss. The Funds include in this category amounts relating to payables for portfolio securities purchased and otheraccrued liabilities such as payable for units redeemed and distributions payable to holders of redeemable units.
All Funds have contractual obligations to distribute cash to the unitholders. As a result, each Fund's obligation for net assets attributable to holders of redeemable units represents a financial liability and is presentedat the redemption amount.
b) Risk Management
The Funds’ overall risk management approach includes formal guidelines that govern the extent of exposure to various types of risk, including diversification within asset classes and limits on the exposure to individualinvestments and counterparties. In addition, derivative financial instruments may be used to manage certain risk exposures. The Manager also has various internal controls to oversee the Funds’ investment activities,including monitoring compliance with the investment objectives and strategies, internal guidelines, and securities regulations. Please refer to each Fund’s Supplemental Schedule to Schedule of InvestmentPortfolio for specific risk disclosures.
Fair value of financial instruments by using valuation techniques
Financial instruments are valued at their fair value which is defined as the price that would be received to sell an asset or paid to transfer a liability in an orderly transaction between market participants at themeasurement date. Refer to note 3a to 3f for valuation of each specific type of financial instrument held by the Funds. The fair value of financial assets and liabilities traded in active markets are based on quotedmarket prices at the close of trading on the reporting date. The Funds use the last traded market price for both financial assets and financial liabilities where the last traded price falls within that day’s bid-ask spread.In circumstances where the last traded price is not within the bid-ask spread, the Manager determines the price that is most representative of fair value based on the specific facts and circumstances.
For financial assets and financial liabilities that are not traded in an active market, fair value is determined using valuation techniques.
The Funds classify fair value measurement within a hierarchy which gives the highest priority to unadjusted quoted prices in active markets for identical assets or liabilities (Level 1) and the lowest priority tounobservable inputs (Level 3). The three levels of the fair value hierarchy are:
Level 1: Quoted prices (unadjusted) in active markets for identical assets or liabilities that the entity can access at the measurement date;
Level 2: Inputs other than quoted prices included within Level 1 that are observable for the asset or liability, either directly or indirectly; and
Level 3: Inputs are unobservable for the asset or liability.
20

p / 2 Notes to Financial Statements (unaudited)
If inputs are used to measure an asset’s or liability’s fair value, the classification within the hierarchy is based on the lowest level input that is significant to the fair value measurement. Each Fund’s fair value hierarchyclassification of its assets and liabilities is included in the Supplemental Schedule to Schedule of Investment Portfolio.
The carrying values of all non-investment assets and liabilities approximate their fair values due to their short-term nature. Fair values are classified as Level 1 when the related security or derivative is actively tradedand a quoted price is available. If an instrument classified as Level 1 subsequently ceases to be actively traded, it is transferred out of Level 1. In such cases, instruments are reclassified into Level 2, unless themeasurement of its fair value requires the use of significant unobservable inputs, in which case it is classified as Level 3.
The Manager is responsible for performing the fair value measurements included in the financial statements of a Fund, including the Level 3 measurements. The Manager obtains pricing from third-party pricingvendors and the pricing is reviewed daily. At each financial reporting date, the Manager reviews and approves all Level 3 fair value measurements. The Funds also have a Valuation Committee which meets quarterly toperform detailed reviews of the valuations of investments held by the Funds, which includes discussion on Level 3 measurements.
Credit risk
Credit risk is the risk that a counterparty to a financial instrument, such as a fixed income security or a derivative contract, will fail to discharge an obligation or commitment that it has entered into with the Funds. Thevalue of fixed income securities and derivatives as presented on the Schedule of Investment Portfolio includes consideration of the creditworthiness of the issuer and, accordingly, represents the maximum credit riskexposure of the Funds. Certain Funds may invest in short-term fixed income securities issued or guaranteed primarily by the Government of Canada or any Canadian provincial government, obligations of Canadianchartered banks or trust companies, and commercial paper with approved credit ratings. The risk of default on these short-term fixed income securities is considered low and these securities primarily have creditratings of ‘A-1 (Low)’ or higher (as rated by S&P Global Ratings, a division of S&P Global, or equivalent rating from another rating service).
The bond ratings noted in the Funds’ ‘Financial Instruments Risk’ under sub-section ‘Credit Risk’ represent ratings collected and disseminated by recognized third party vendors. These ratings utilized by the Manager,while obtained from vendors skilled and recognized for bond rating services, may not be the same as those used directly by the portfolio advisor or portfolio sub-advisors. Ratings used by the portfolio advisor orportfolio sub-advisors could be higher or lower than those used for risk disclosure in the financial statements in compliance with their investment policy guidelines.
The Funds may engage in securities lending transactions. The credit risk related to securities lending transactions is limited by the fact that the value of cash or securities held as collateral by the Funds in connectionwith these transactions is at least 102% of the fair value of the securities loaned. The collateral and loaned securities are marked to market on each business day. Further information regarding the collateral andsecurities on loan can be found in the footnotes to the Statements of Financial Position and in note 2j.
Currency risk
Currency risk is the risk that the value of an investment will fluctuate due to changes in foreign exchange rates. Mutual funds may invest in securities denominated or traded in currencies other than the funds’reporting currency.
Interest rate risk
Prices of fixed income securities generally increase when interest rates decline and decrease when interest rates rise. This risk is known as interest rate risk. Prices of longer-term fixed income securities will generallyfluctuate more in response to interest rate changes than would shorter-term securities. Due to the nature of short-term fixed income securities with a remaining term-to-maturity of less than one year, theseinvestments are not generally exposed to a significant risk that their value will fluctuate in response to changes in the prevailing levels of market interest rates.
Liquidity risk
The Funds are exposed to daily cash redemptions of redeemable units. Generally, the Funds retain sufficient cash and cash equivalent positions to maintain adequate liquidity. However, liquidity risk also involves theability to sell an asset for cash easily and at a fair price. Some securities are illiquid due to legal restrictions on their resale, the nature of the investment, or simply a lack of interested buyers for a particular security orsecurity type. Certain securities may become less liquid due to changes in market conditions, such as interest rate changes or market volatility, which could impair the ability of a Fund to sell such securities quickly or ata fair price. Difficulty in selling securities could result in a loss or lower return for a Fund.
Other price/market risk
Other price/market risk is the risk that the value of investments will fluctuate as a result of changes in market conditions. Several factors can influence market trends, such as economic developments, changes ininterest rates, political changes, and catastrophic events. All investments are exposed to other price/market risk.
c) Investment Transactions, Income Recognition, and Recognition of Realized and Unrealized Gains and Losses
i) Interest for distribution purposes shown on the Statements of Comprehensive Income represents the coupon interest received by the Fund accounted for on an accrual basis. The Funds do not amortizepremiums paid or discounts received on the purchase of fixed income securities except for zero coupon bonds, which are amortized on a straight-line basis.
ii) Dividend income is recorded on the ex-dividend date.
iii) Securities that are exchange-traded are recorded at fair value established by the last traded market price when that price falls within that day’s bid-ask spread. Debt securities are recorded at fair value,established by the last traded price on the over-the-counter market (OTC) when that price falls within that day’s bid-ask spread. In circumstances where the last traded price is not within the bid-ask spread,the Manager determines the price that is most representative of fair value based on the specific facts and circumstances. Unlisted securities are recorded at fair value using fair valuation techniquesestablished by the Manager in establishing a fair value.
iv) Realized gains and losses on investments and unrealized appreciation or depreciation of investments are calculated using the average cost, excluding transaction costs, of the related investments.
v) Other income is the sum of income, excluding transaction costs, other than that which is separately classified on the Statements of Comprehensive Income.
d) Offsetting
Financial assets and liabilities are offset and the net amount reported in the Statements of Financial Position, if there is a currently enforceable legal right to offset the recognized amounts and there is an intention tosettle on a net basis, or to realize the asset and settle the liability simultaneously.
Where applicable, additional information can be found in the table Offsetting Arrangements as part of the Supplemental Schedule to Schedule of Investment Portfolio. This supplemental schedule discloses the OTCderivatives which are subject to offsetting.
e) Portfolio Securities
The cost of securities of a Fund is determined in the following manner: securities are purchased and sold at a market-traded price to arrive at a value for the position traded. The total purchased value represents thetotal cost of the security to the Fund. When additional units of the same security are purchased, the cost of those additional units is added to the total security cost. When units of the same security are sold, theproportionate cost of the units of the security sold is deducted from the total security cost. If there is a return of capital paid by a security, the amount of this return of capital is deducted from the total security cost.This method of tracking security cost is known as “average cost” and the current total for any one security is referred to as the “adjusted cost base” or “ACB” of the security. Transaction costs incurred in portfoliotransactions are excluded from the average cost of investments and are recognized immediately in net income and are presented as a separate expense item in the financial statements.
The difference between the fair value of securities and their average cost, excluding transaction costs, represents the unrealized appreciation (depreciation) in value of the portfolio investments. The applicable periodchange in unrealized appreciation (depreciation) of investments is included on the Statements of Comprehensive Income.
Short-term investments on the Schedule of Investment Portfolio are presented at their amortized cost which approximates the fair value. Accrued interest for bonds is disclosed separately on the Statements ofFinancial Position.
f) Foreign Exchange
The value of investments and other assets and liabilities denominated in foreign currencies is translated into Canadian dollars, which is the Funds’ functional and presentation currency at the current rates prevailing oneach valuation date (unless otherwise indicated).
Purchases and sales of investments, income, and expenses are translated into Canadian dollars, which is the Funds’ functional and presentation currency at the foreign exchange rates prevailing on the dates of suchtransactions. Foreign currency translation gains (losses) on investments and income transactions are included in Net realized gain (loss) on foreign currency on the Statements of Comprehensive Income.
21

Notes to Financial Statements (unaudited) p / 3
g) Forward Foreign Currency Contracts
The Funds may enter into forward foreign currency contracts for either hedging or non-hedging purposes where such activity is consistent with their investment objectives and as permitted by the Canadian securitiesregulatory authorities.
Changes in the fair value of forward foreign currency contracts are included in derivative assets or derivative liabilities on the Statements of Financial Position and are recorded as an Increase (decrease) in unrealizedappreciation (depreciation) of investments and derivatives during the applicable period on the Statements of Comprehensive Income.
The gain or loss arising from the difference between the value of the original forward foreign currency contract and the value of such contract at close or delivery is realized and recorded as Net realized gain (loss) onforeign currency for Pools that use the forward foreign currency contracts for hedging or as Derivative income (loss) for Pools that do not use the forward foreign currency contracts for hedging.
h) Futures Contracts
The margin deposits with brokers relating to futures contracts are included in Margin on the Statements of Financial Position. Any change in the margin requirement is settled daily and included in Receivable forportfolio securities sold or Payable for portfolio securities purchased on the Statements of Financial Position.
Any difference between the settlement value at the close of business on each valuation date and the settlement value at the close of business on the previous valuation date is recorded as Derivative income (loss) onthe Statements of Comprehensive Income.
i) Options
Premiums paid for purchased call and put options are included in derivative assets and subsequently measured at fair value on the Statements of Financial Position. When a purchased option expires, the Fund willrealize a loss in the amount of the cost of the option. For a closing transaction, the Fund will realize a gain or loss depending on whether the proceeds are greater or less than the premium paid at the time of purchase.When a purchased call option is exercised, the cost of the security purchased is increased by the premium paid at the time of purchase.
Premiums received from writing options are included in derivative liabilities and subsequently measured at fair value on the Statements of Financial Position as initial reductions in the value of investments. Premiumsreceived from writing options that expire unexercised are recorded as realized gains and reported as Net gain (loss) on sale of investments and derivatives on the Statements of Comprehensive Income. For a closingtransaction, if the cost of closing the transaction exceeds the premium received, the Fund will record a realized loss or, if the premium received at the time the option was written is greater than the amount paid,the Fund will record a realized gain and is reported as Net gain (loss) on sale of investments and derivatives. If a written put option is exercised, the cost for the security delivered is reduced by the premiums received atthe time the option was written.
j) Securities Lending
A Fund may lend portfolio securities in order to earn additional revenue, which is disclosed on the Statements of Comprehensive Income. The loaned assets of any one Fund are not permitted to exceed 50% of thefair value of the assets of that Fund (excluding collateral debt for the loaned securities). The minimum allowable collateral is 102% of the fair value of the loaned securities as per the requirements of NationalInstrument 81-102 – Investment Funds. Collateral can consist of the following:
i) Cash.
ii) Qualified securities.
iii) Irrevocable letters of credit issued by a Canadian financial institution that is not the counterparty, or an affiliate counterparty, of the pool in the transaction, if evidences of indebtedness of the Canadianfinancial institution that are rated as short-term debt by an approved credit rating organization have an approved credit rating.
iv) Securities that are immediately convertible into securities of the same issuer, class, or type, and the same term, as the securities loaned.
The fair value of the loaned securities is determined on the close of any valuation date and any additional required collateral is delivered to the Pool on the next business day. The securities on loan continue to beincluded on the Schedule of Investment Portfolio, and are included in the total value on the Statements of Financial Position in Investments (non-derivative financial assets) at fair value. Where applicable, a Fund’ssecurities lending transactions are reported in footnote Securities Lending on the Statements of Financial Position.
Changes to National Instrument 81-106 – Investment Fund Continuous Disclosure took effect for Funds with a financial year beginning on or after January 1, 2016. Those changes now require a reconciliation of thegross amount generated from the securities lending transactions of the Funds to the revenue from securities lending disclosed in the Funds’ Statements of Comprehensive Income. The gross amount generated fromsecurities lending includes interest paid on collateral, withholding taxes deducted, the fees paid to the Funds’ lending agent and the securities lending revenue received by the Funds. Where applicable, thereconciliation can be found in the footnotes to the Funds’ Statements of Comprehensive Income.
k) Loans and Receivables, Other Assets and Liabilities
Loans and Receivables, other assets and liabilities (other than those classified as FVTPL) are recorded at cost, which approximates their fair value, with the exception of Net Assets Attributable to Holders ofRedeemable Units which are presented at the redemption value.
l) Legend of Abbreviations
The following is a list of abbreviations (foreign currency translation and others) that may be used in the Schedule of Investment Portfolio:x
x..x
x
Currency Abbreviations
x..
ARS – Argentine Peso JPY – Japanese Yen..
AUD – Australian Dollar KES – Kenyan Shilling..
BRL – Brazilian Real KRW – South Korean Won..
CAD – Canadian Dollar MAD – Morocco Dirham..
CHF – Swiss Franc MXN – Mexican Peso..
CLP – Chilean Peso MYR – Malaysian Ringgit..
CNY – Chinese Renminbi NOK – Norwegian Krone..
COP – Colombian Peso NZD – New Zealand Dollar..
CZK – Czech Koruna PHP – Philippine Peso..
DKK – Danish Krone PLN – Polish Zloty..
EGP – Egyptian Pound RUB – Russian Ruble..
EUR – Euro SEK – Swedish Krona..
GBP – British Pound SGD – Singapore Dollar..
HKD – Hong Kong Dollar THB – Thai Baht..
HUF – Hungarian Forint TRY – New Turkish Lira..
IDR – Indonesian Rupiah TWD – Taiwan Dollar..
ILS – Israeli Shekel USD – United States Dollar..
INR – Indian Rupee ZAR – South African Rand
22

p / 4 Notes to Financial Statements (unaudited)
..
Other Abbreviations
..
ADR – American Depositary Receipt..
CVO – Contingent Value Obligations..
ETF – Exchange-Traded Fund..
GDR – Global Depositary Receipt Securities..
NVDR – Non-Voting Depositary Receiptxxxxxxxx
m) Standards issued but not yet effective
Standards issued but not yet effective up to the date of issuance of the Funds’ financial statements are listed below. The Funds intend to adopt applicable standards when they become effective.
IFRS 9, Financial Instruments - Classification and Measurement
In July 2014, the IASB issued the final version of IFRS 9, Financial Instruments which reflects all phases of the financial instruments project and replaces IAS 39, Financial Instruments: Recognition and Measurementand all previous versions of IFRS 9. The standard introduces new requirements for classification and measurement, impairment, and hedge accounting. IFRS 9 is effective for annual periods beginning on or afterJanuary 1, 2018, with early application permitted. The Funds are in the process of assessing the impact of IFRS 9.
n) Increase (Decrease) in Net Assets Attributable to Holders of Redeemable Units per Unit
Increase (decrease) in net assets attributable to holders of redeemable units per unit of each class is calculated by dividing the Increase (decrease) in net assets attributable to holders of redeemable units (excludingdistributions), as reported on the Statements of Comprehensive Income, by the weighted average number of units in issue during the related period.
3. Valuation of Investments
The valuation date (Valuation Date) for a Fund is any day when the Manager’s head office is open for business. The Manager may, at its discretion, establish other Valuation Dates.
The fair value of the investments or assets of a Fund is determined as follows:
a) Cash and Other Assets
Cash, accounts receivable, dividends receivable, distributions receivable, and interest receivable are valued at fair value or at their recorded cost, plus or minus any foreign exchange between recognition of the assetby the Fund and the current Valuation Date, which approximates fair value.
b) Bonds, Debentures, and Other Debt Obligations
Bonds, debentures, and other debt obligations are fair valued using the last traded price provided by a recognized vendor upon the close of trading on a Valuation Date, whereby the last traded price falls within thatday’s bid-ask spread. If the last traded price does not fall within that day’s bid-ask spread, then the Manager will determine the price that is most representative of fair value based on the specific facts andcircumstances.
c) Listed Securities, Unlisted Securities, and Fair Value Pricing of Foreign Securities
Any security that is listed or traded on a securities exchange is fair valued using the last traded price, whereby the last traded price falls within that day’s bid-ask spread or, if there is no traded price on that exchangeor the last traded price does not fall within that day’s bid-ask spread and in the case of securities traded on an OTC market, at the fair value as determined by the Manager as an appropriate basis for valuation. In suchsituations, a fair value will be determined by the Manager to establish current value. If any securities are inter-listed or traded on more than one exchange or market, the Manager will use the principal exchange ormarket for the fair value of such securities.
Units of each mutual fund in which a Fund invests will be valued at fair value using the most recent net asset value quoted by the Trustee or Manager of the mutual fund on the Valuation Date.
Unlisted securities are fair valued using the last traded price quoted by a recognized dealer, or the Manager may determine a price that more accurately reflects the fair value of these securities if the Manager feelsthe last traded price does not reflect fair value.
Fair value pricing is designed to avoid stale prices and to provide a more accurate fair value, and may assist in the deterrence of harmful short-term or excessive trading in the Fund. When securities listed or traded onmarkets or exchanges that close prior to North or South American markets or exchanges are valued by the Manager at their fair market value, instead of using quoted or published prices, the prices of such securitiesused to calculate the Fund’s net assets or net asset value may differ from quoted or published prices of such securities.
d) Derivatives
Long positions in options, debt-like securities, and listed warrants are valued at fair value using the last traded price as established on either their principal trading exchange or by a recognized dealer in such securities,whereby the last traded price falls within that day’s bid-ask spread and the credit rating of each counterparty (as rated by S&P Global Ratings, a division of S&P Global) meets or exceeds the minimum approved creditrating.
When any option is written by any Fund, the premium received by the Fund will be reflected as a liability that will be valued at an amount equal to the current fair value of the option that would have the effect ofclosing the position. Any difference resulting from revaluation shall be treated as an unrealized gain or loss on investment; the liability shall be deducted in arriving at the net assets attributable to holders ofredeemable units of the Fund. The securities that are the subject of a written option, if any, will be valued in the manner described above for listed securities.
Futures contracts, forward contracts, or swaps will be valued at fair value of the gain or loss, if any, that would be realized on the Valuation Date if the position in the futures contracts, forward contracts, or swapswere to be closed out.
Margin paid or deposited in respect of futures contracts and forward contracts will be reflected as an account receivable and margin consisting of assets other than cash will be noted as held as collateral.
Other derivatives and margin are fair valued in a manner that the Manager determines to represent their fair value.
e) Restricted Securities
Restricted securities purchased by any Fund will be fair valued in a manner that the Manager determines to represent their fair value.
f) Other Investments
All other investments of the Funds will be fair valued in accordance with the laws of the Canadian securities regulatory authorities, where applicable.
The value of any security or other property of a Fund for which a market quotation is not readily available or where the market quotations do not properly reflect the fair value of such securities will be determined bythe Manager by valuing the securities at their fair value. In such situations, fair value will be determined using the fair valuation technique that most accurately reflects the fair value as established by the Manager.
4. Interest in Underlying Funds
The Funds may invest in other investment funds (Underlying Funds). Each Underlying Fund invests in a portfolio of assets to generate returns in the form of investment income and capital appreciation for itsunitholders. Each Underlying Fund finances its operations primarily through the issuance of redeemable units, which are puttable at the unitholder's option and entitle the unitholder to a proportionate share of theunderlying fund's net assets. The Fund's interests in Underlying Funds held in the form of redeemable units, are reported in its Schedule of Investments at fair value, which represents the Funds’ maximum exposure onthose investments. The Funds' interests in underlying funds as at the prior year period ends are presented in the Financial Instruments Risks - Concentration Risk section in the Supplemental Schedule to Schedule ofInvestment Portfolio. Distributions earned from Underlying Funds are included in “Investment Income” in the Statements of Comprehensive Income. The total realized and change in unrealized gains (losses) arisingfrom Underlying Funds are also included in the Statement of Comprehensive Income. The Funds do not provide any additional significant financial or other support to Underlying Funds.
Where applicable, the table “Interests in Underlying Funds” presented as part of the Supplemental Schedule to Schedule of Investment Portfolio, provides additional information on the Funds’ investments inUnderlying Funds where the ownership interest exceeds 20% of each Underlying Fund.
23
Notes to Financial Statements (unaudited) p / 5
5. Redeemable Units Issued and Outstanding
Each Fund is permitted to have an unlimited number of classes of units and may issue an unlimited number of units of each class. The outstanding units represent the capital of a Fund. Each unit has no par value andthe value of each unit is the net assets attributable to holders of redeemable units per unit next determined. Settlement of the cost for units issued is completed as per security regulations in place at the time of issue.Distributions made by a Fund and reinvested by unitholders in additional units also constitute issued redeemable units of a Fund.
Units are redeemed at the net assets attributable to holders of a redeemable unit per unit of a Fund. A right to redeem units of a Fund may be suspended with the approval of the Canadian securities regulatoryauthorities or when normal trading is suspended on a stock, options, or futures exchange within Canada or outside of Canada on which securities or derivatives that make up more than 50% of the value or underlyingexposure of the total assets of a Fund, not including any liabilities of a Fund, are traded and when those securities or derivatives are not traded on any other exchange that represents a reasonably practical alternativefor a Fund. The Fund is not subject to any externally imposed capital requirements.
The capital received by a Fund is utilized within the respective investment mandate of the Fund. This includes the ability to make liquidity available to satisfy unitholder unit redemption requirements upon theunitholder’s request.
Changes in issued and outstanding units for the six-month periods ended June 30, 2016 and 2015 can be found on the Statements of Changes in Net Assets Attributable to Holders of Redeemable Units.x
6. Management Fees and Operating Expenses
Management fees are based on the net asset value of the Funds and are calculated daily. Management fees are paid to the Manager in consideration for providing, or arranging for the provision of, management,distribution, and portfolio advisory services. The maximum annual management fee expressed as a percentage of the average net asset value that can be charged by a Fund is reported in footnote MaximumChargeable Annual Management Fee Rates on the Statements of Comprehensive Income.
In addition to the management fees, the Funds are responsible for all expenses relating to the operation and conduct of the business of the Funds, which may include interest, operating, and administrative costs (otherthan advertising and promotional expenses, which are the responsibility of the Manager), brokerage fees, commissions, spreads, regulatory fees, Independent Review Committee fees, taxes, audit and legal fees andexpenses, safekeeping and custodial fees, investor servicing costs, and costs of unitholder reports, prospectuses, and other reports. All such operating expenses are paid by the Manager and recovered from the Funds.The Funds do not pay a fee to the Trustee.
The Manager may recover less than the actual operating expenses paid by the Manager, resulting in the Manager absorbing expenses. The Manager may also charge to a Fund less than the maximum managementfee in footnote Maximum Chargeable Annual Management Fee Rates on the Statements of Comprehensive Income, resulting in the Manager waiving management fees.
At its sole discretion, the Manager may stop absorbing operating expenses and/or waiving management fees at any time. Operating expenses absorbed and/or management fees waived by the Manager are disclosedon the Statements of Comprehensive Income.
In some cases, the Manager may charge management fees to a Fund that are less than the management fees the Manager is entitled to charge in respect of certain investors in a Fund. The difference in the amount ofthe management fees will be paid out by the Fund to the applicable investors as a distribution of additional units of the Fund (Management Fee Distributions). Management Fee Distributions are negotiable betweenthe Manager and the investor and are dependent primarily on the size of the investor’s investment in the Fund. Management Fee Distributions paid to qualified investors do not adversely impact the Fund or any of theFund’s other investors. The Manager may increase or decrease the amount of Management Fee Distributions to certain investors from time to time.
Where a Fund invests in units of an Underlying Fund, the Fund does not pay duplicate management fees on the portion of its assets that it invests in units of the Underlying Fund. In addition, the Fund will not payduplicate sales fees or redemption fees with respect to the purchase or redemption by it of units of the Underlying Fund. Some of the Underlying Funds held by the Funds may offer Management Fee Distributions. SuchManagement Fee Distributions of an Underlying Fund will be paid out as required for taxable distribution payments by a Fund. The manager of an Underlying Fund may, in some cases, waive a portion of an UnderlyingFund’s management fee and/or absorb a portion of an Underlying Fund’s operating expenses.
7. Income Taxes and Withholding Taxes
The Funds qualify as mutual fund trusts under the Income Tax Act (Canada). No income tax is payable by the Funds on net income and/or net realized capital gains that are distributed to unitholders. In addition, incometaxes payable on undistributed net realized capital gains are refundable on a formula basis when units of the Funds are redeemed. Sufficient net income and realized capital gains of the Funds have been, or will be,distributed to the unitholders such that no tax is payable by the Funds and, accordingly, no provision for income taxes has been made in the financial statements. Occasionally, a Fund may pay distributions in excess ofthe net income and net realized capital gains of the Fund. This excess distribution is called a return of capital and is non-taxable to the unitholder. However, a return of capital reduces the average cost of theunitholder’s units for tax purposes, which may result in a capital gain to the unitholder to the extent the average cost becomes less than zero.
Non-capital losses that arose in 2006 and thereafter are available to be carried forward for 20 years.
Capital losses for income tax purposes may be carried forward indefinitely and applied against capital gains realized in future years. Where applicable, a Fund’s net capital and non-capital losses are reported infootnote Net Capital and Non-Capital Losses on the Statements of Changes in Net Assets Attributable to Holders of Redeemable Units.
The Funds have a taxation year-end of December 15 (except Imperial Money Market Pool, which has a taxation year-end of December 31).
The Funds currently incur withholding taxes imposed by certain countries on investment income and capital gains. Such income and gains are recorded on a gross basis and the related withholding taxes are shown asa separate expense in the Statements of Comprehensive Income.
8. Brokerage Commissions and Fees
The total commissions paid by the Funds to brokers in connection with portfolio transactions are reported in footnote Brokerage Commissions and Fees on the Statements of Comprehensive Income of each Fund. Inallocating brokerage business to a dealer, consideration may be given by the portfolio sub-advisors of the Funds for the provision of goods and services by the dealer or a third party, other than order execution (referredto in the industry as “soft dollar” arrangements). These goods and services are paid for with a portion of brokerage commissions and assist the portfolio sub-advisors with their investment decision-making services tothe Funds or relate directly to executing portfolio transactions on behalf of the Funds. The total soft dollar payments paid by the Funds to brokers are reported in footnote Brokerage Commissions and Fees on theStatements of Comprehensive Income of each Fund. In addition, the Manager may enter into commission recapture arrangements with certain dealers with respect to the Fund. Any commission recaptured will be paidto the applicable Fund.
Fixed income and certain other securities are transacted in an OTC market, where participants are dealing as principals. Such securities are generally traded on a net basis and do not normally involve brokeragecommissions, but will typically include a “spread” (being the difference between the bid and the offer prices on the security of the applicable marketplace).
Spreads associated with fixed income securities trading and certain other securities are not ascertainable and, for that reason, are not included in the dollar amounts. In addition, the soft dollar amounts only includethe value of research and other services supplied by a third party to CIBC Asset Management Inc. (CAMI or the Portfolio Advisor) and any portfolio sub-advisors, as the value of the services supplied to the PortfolioAdvisor and any portfolio sub-advisors by the dealer is not ascertainable. When these services benefit more than one Fund, the costs are allocated among the Funds based on transaction activity or some other fairbasis as determined by the Portfolio Advisor and any portfolio sub-advisors.x
9. Related Party Transactions
CIBC and its affiliates have the following roles and responsibilities with respect to the Funds and receive the fees described below in connection with their roles and responsibilities. The Funds may hold securities ofCIBC. CIBC and its affiliates may also be involved in underwriting or lending to issuers of securities that may be held by the Funds, have purchased or sold securities from or to the Funds while acting as principal, havepurchased or sold securities from or to the Funds on behalf of another investment fund managed by CIBC or an affiliate, and also may have been involved as a counterparty to derivative transactions. Management feespayable and other accrued expenses on the Statements of Financial Position are amounts generally payable to a related party of the Fund.
Manager, Trustee, Portfolio Advisor, and certain Portfolio Sub-Advisors of the Funds
CIBC is the Manager, CIBC Trust Corporation is the Trustee, and CAMI is the Portfolio Advisor of each of the Funds. American Century Investment Management, Inc. (ACI) is a portfolio sub-advisor to certain Funds.Although not an affiliate, CIBC had previously owned a 41% equity interest in ACI. On December 21, 2015, CIBC announced that it entered into a definitive agreement to sell its minority position in ACI. The sale wascompleted on May 19, 2016.
The Manager also arranges for fund administrative services (other than advertising and promotional, which are the responsibility of the Manager), legal, investor servicing, and costs of unitholder reports,prospectuses, and other reports. The Manager is the registrar and transfer agent for the Funds and provides, or arranges for the provision of, all other administrative services required by the Funds. The dollar amount
24

p / 6 Notes to Financial Statements (unaudited)
(including all applicable taxes) of all fund administrative expenses (net of absorptions) that the Manager recovers from a Fund is reported in footnote Administrative and Other Fund Operating Expenses on theStatements of Comprehensive Income.
Brokerage Arrangements and Soft Dollars
The Portfolio Advisor generally delegates trading and execution authority to the portfolio sub-advisors. Where applicable, disclosure of the amounts of soft dollars can be found in the Brokerage Commission andFees schedule on the Statements of Comprehensive Income for each Fund.
The Portfolio Advisor and portfolio sub-advisors make decisions, including the selection of markets and dealers and the negotiation of commissions, with respect to the purchase and sale of portfolio securities, certainderivative products (including futures and forwards), and the execution of portfolio transactions. Brokerage business may be allocated by the Portfolio Advisor and portfolio sub-advisors to CIBC World Markets Inc. andor CIBC World Markets Corp., each a subsidiary of CIBC. The total commissions paid to related brokers in connection with portfolio transactions are reported in footnote Brokerage Commissions and Fees on theStatements of Comprehensive Income of each Fund.
CIBC World Markets Inc. and CIBC World Markets Corp. may also earn spreads on the sale of fixed income and other securities, and certain derivative products (including futures and forwards) to the Funds. Dealers,including CIBC World Markets Inc. and CIBC World Markets Corp., may furnish goods and services, other than order execution, to the Portfolio Advisor and portfolio sub-advisors that process trades through them(referred to in the industry as “soft dollar” arrangements). These goods and services are paid for with a portion of brokerage commissions and assist the Portfolio Advisor and portfolio sub-advisors with theirinvestment decision-making services to the Fund or relate directly to executing portfolio transactions on behalf of the Fund. As per terms of the portfolio sub-advisory agreements, such soft dollar arrangements are incompliance with applicable laws. Custodial fees directly related to portfolio transactions incurred by a Fund, otherwise payable by the Fund, shall be paid by CAMI, and/or dealer(s) directed by CAMI, up to the amountof the credits generated under soft dollar arrangements from trading on behalf of the Fund, or a portion of the Fund, during that month. The total soft dollar payments paid by the Fund to related brokers are reported infootnote Brokerage Commissions and Fees on the Statements of Comprehensive Income of each Fund. In addition, the Manager may enter into commission recapture arrangements with certain dealers with respect tothe Funds. Any commission recaptured will be paid to the relevant Fund.
Custodian
The custodian holds all cash and securities for the Funds and ensures that those assets are kept separate from any other cash or securities that the custodian might be holding. The custodian also provides otherservices to the Funds including record keeping and processing of foreign exchange transactions. CIBC Mellon Trust Company is the custodian of the Funds (the Custodian). The Custodian may hire sub-custodians forthe Funds. The fees and spreads for services of the Custodian directly related to the execution of portfolio transactions by a Fund, or a portion of a Fund, are paid by CAMI and/or dealer(s) directed by CAMI up to theamount of the credits generated under soft dollar arrangements from trading on behalf of the Funds during that month. All other fees for the services of the Custodian are paid by the Manager, and charged tothe Funds on a recoverable basis. CIBC owns a 50% interest in CIBC Mellon Trust Company.
Service Provider
CIBC Mellon Global Securities Services Company (CIBC GSS) provides certain services to the Funds, including securities lending, fund accounting and reporting, and portfolio valuation. Such servicing fees are paid bythe Manager and charged to the Funds on a recoverable basis. CIBC indirectly owns a 50% interest in CIBC GSS.
The dollar amount paid by the Funds (including all applicable taxes) to CIBC Mellon Trust Company for custodial fees (net of absorptions) and to CIBC GSS for securities lending, fund accounting and reporting, andportfolio valuation (net of absorptions) for the six-month periods ended June 30, 2016 and 2015 is reported in footnote Service Provider on the Statements of Comprehensive Income.
10. Hedging
Certain foreign currency denominated positions have been hedged, or partially hedged, by forward foreign currency contracts as part of the investment strategies of certain Pools. These hedges are indicated by ahedging reference number on the Schedule of Investment Portfolio and a corresponding hedging reference number on the Schedule of Derivative Assets and Liabilities Forward Foreign Currency Contracts for thosePools.
11. Collateral on Specified Derivatives
Short-term investments may be used as collateral for futures contracts outstanding with brokers.x
25

Imperial Pools
CIBC
18 York Street, Suite 1300Toronto, Ontario
M5J 2T8
1-888-357-8777
Websitewww.cibc.com/mutualfunds