Imperial College London Department of Epidemiology and ...
27
Data processing strategies for large-scale untargeted metabolomics epidemiology Imperial College London Department of Epidemiology and Biostatistics Dr Ibrahim Karaman
Transcript of Imperial College London Department of Epidemiology and ...
Data processing strategies for large-scale
untargeted metabolomics epidemiology
Imperial College London
Department of Epidemiology and Biostatistics
Dr Ibrahim Karaman
Outline
• Introduction
– Characteristics of Metabolomics Data
– Challenges of large-scale data processing
– The COMBI-BIO Project
– The Airwave Study
• Workflow & Results
– NMR
– LCMS
• Outlook
2

Characteristics of Metabolomics Data
How to analyse?
High throughput
• High dimensionality
• N variables >> N samples
High degree of colinearity
• Biological / analytical correlations
Unknown number and identity of metabolites
• Contrast with microarray/sequence data
Multiple analytical methods
• NMR, LC-MS, GC-MS, CE-MS…
Sensitive to many effects
• Error & bias
• Confounders
3

NMR Metabolic Profiles: Problems
• Assignment
– Knowns
– Unknowns
• Peak overlap
• Peak shift
?
4

Succinate
Glutamine MalateGlutamate
Raw spectrum
Reduced spectrum
NMR preprocessing: Solutions
• Peak fitting
• Binning
• Full resolution spectrum
• With/without alignment
5
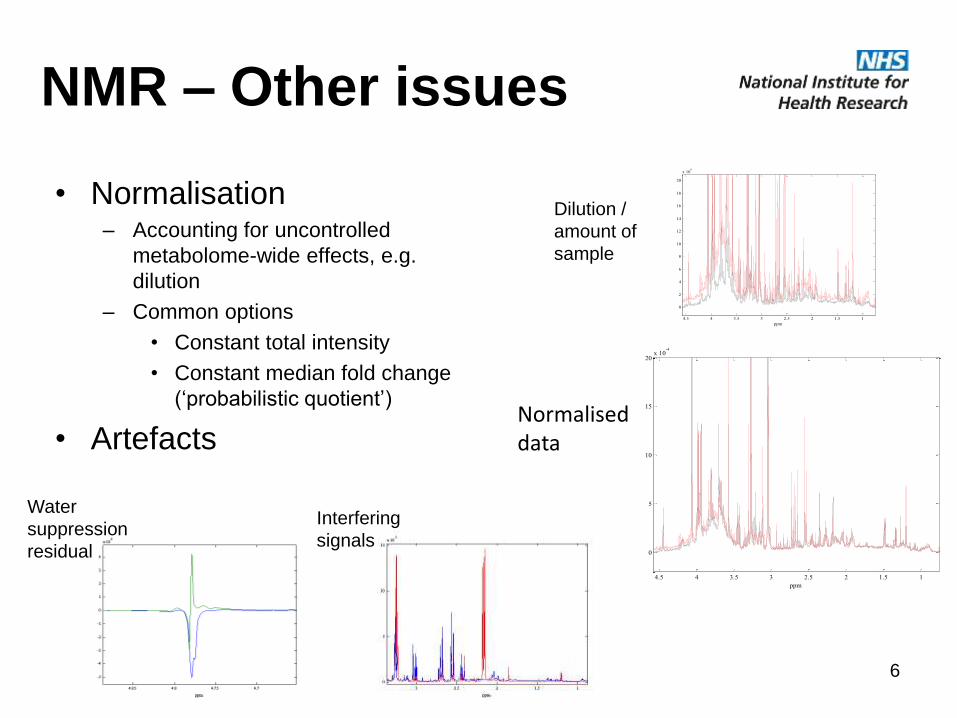
NMR – Other issues
• Normalisation– Accounting for uncontrolled
metabolome-wide effects, e.g.
dilution
– Common options
• Constant total intensity
• Constant median fold change
(‘probabilistic quotient’)
• Artefacts
Water
suppression
residual
Interfering
signals
11.522.533.544.5
0
2
4
6
8
10
12
14
16
18
20
x 106
ppm
Dilution /
amount of
sample
11.522.533.544.5
0
5
10
15
20x 10
-4
ppm
Normaliseddata
6

LC-MS preprocessingPeak detection Peak matching
Retention time
alignmentPeak table
Raw data
Peak integration
Peak filling
XCMS – Smith et al. Anal Chem 78, 779 (2006)
7

Quality Control Samples
• Representative biological sample, e.g. pool of study
samples
• Repeated analysis throughout analytical run
Gika, H. G., Theodoridis, G. A., Wingate, J. E., and Wilson, I. D.,
J. Proteome Res. 6 (8), 3291 (2007).
Study samples
Pooled
QC
sample
Run order
…
8

LC-MS: Quality Control and Data Filtering
Repeatability filter
• E.g. Filter out all features with CV<30% in QC samples
Dilution series filtering
• E.g. Filter out all features with r<0.8
Normalisation
• Correct global intensity drift
Drift correction
• Correct feature-specific drift within a batch
Batch correction
• Correct drift across batches
9
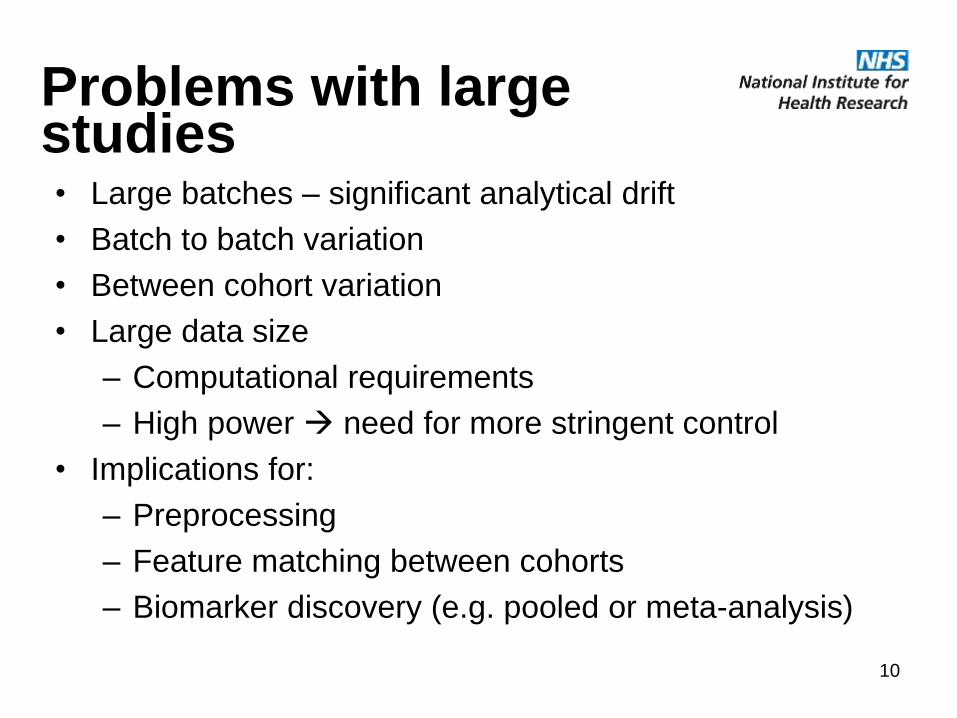
Problems with large studies• Large batches – significant analytical drift
• Batch to batch variation
• Between cohort variation
• Large data size
– Computational requirements
– High power need for more stringent control
• Implications for:
– Preprocessing
– Feature matching between cohorts
– Biomarker discovery (e.g. pooled or meta-analysis)
10

COMBI-BIO Project
• Development of COMBInatorial BIOmarkers for
subclinical atherosclerosis
– Outcomes coronary artery calcium & inter media thickness
• Serum from 3 Cohorts: MESA (4000), LOLIPOP
(2000), Rotterdam (2000)
• 3 NMR assays: NOESY + CPMG + JRES
• 4 UPLC-MS assays: LIPID & HILIC, +/- modes
• Each cohort split into 2 phases (1 cohort/phase = 1
batch)
http://www.combi-bio.eu
11
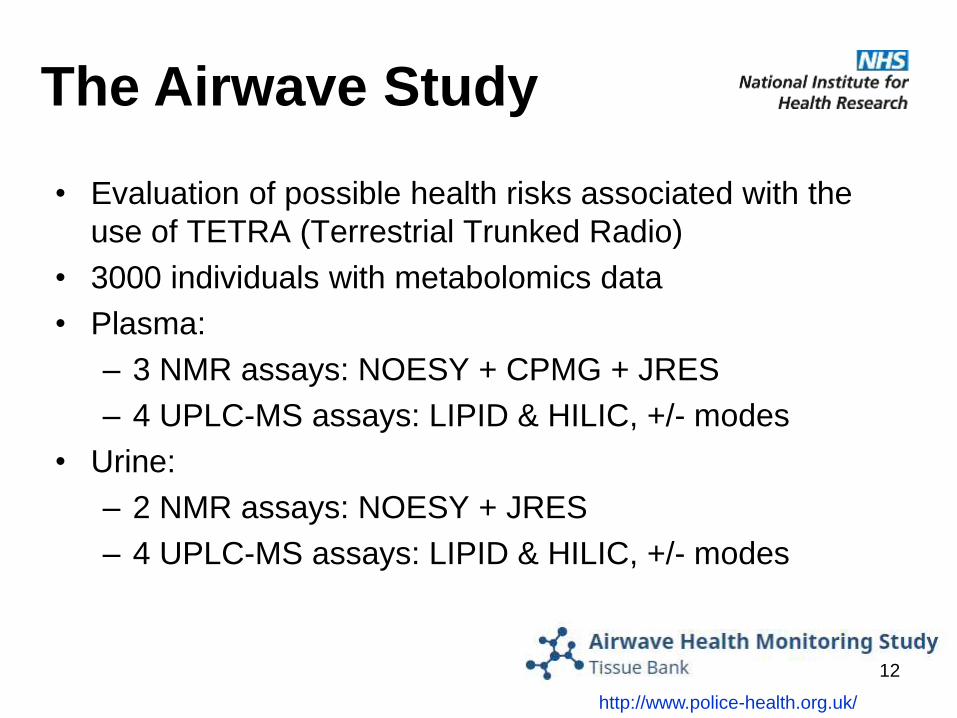
The Airwave Study
• Evaluation of possible health risks associated with the
use of TETRA (Terrestrial Trunked Radio)
• 3000 individuals with metabolomics data
• Plasma:
– 3 NMR assays: NOESY + CPMG + JRES
– 4 UPLC-MS assays: LIPID & HILIC, +/- modes
• Urine:
– 2 NMR assays: NOESY + JRES
– 4 UPLC-MS assays: LIPID & HILIC, +/- modes
http://www.police-health.org.uk/
12

NMR Workflow*
7) Cohort/batch adjustment
6) Spectral binning (optional)
5) Removal of outliers
4) Normalization
3) Removal of interfering signals
2) Spectral peak alignment
1) Integration of multi-cohort/batch data
High resolution spectra
Binned spectra
*Manuscript under review by Journal of Proteome Research
13

Alignment
befo
rea
fter
14
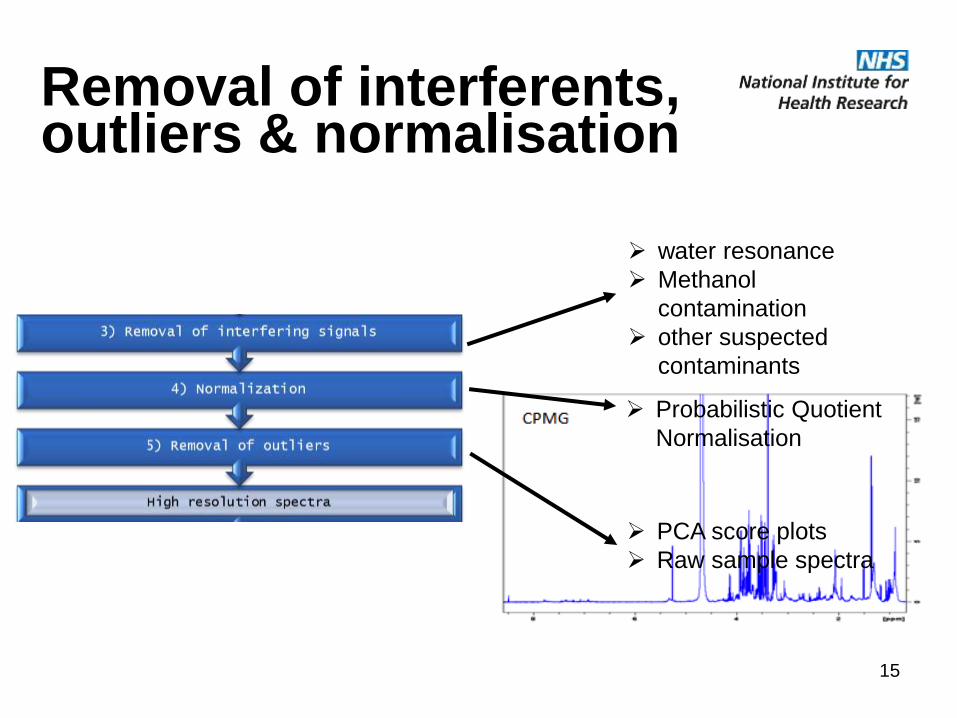
Removal of interferents, outliers & normalisation
water resonance
Methanol
contamination
other suspected
contaminants
Probabilistic Quotient
Normalisation
PCA score plots
Raw sample spectra
15
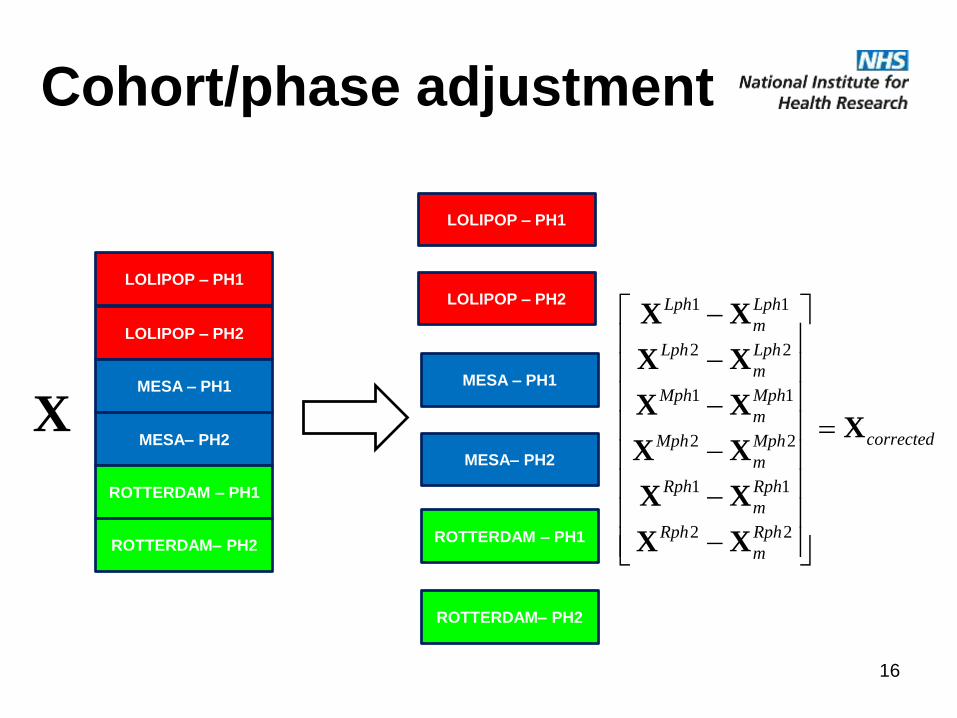
Cohort/phase adjustment
LOLIPOP – PH1
LOLIPOP – PH2
MESA – PH1
MESA– PH2
ROTTERDAM – PH1
ROTTERDAM– PH2
LOLIPOP – PH1
LOLIPOP – PH2
MESA – PH1
MESA– PH2
ROTTERDAM – PH1
ROTTERDAM– PH2
corrected
Rph
m
Rph
Rph
m
Rph
Mph
m
Mph
Mph
m
Mph
Lph
m
Lph
Lph
m
Lph
X
XX
XX
XX
XX
XX
XX
22
11
22
11
22
11
X
16
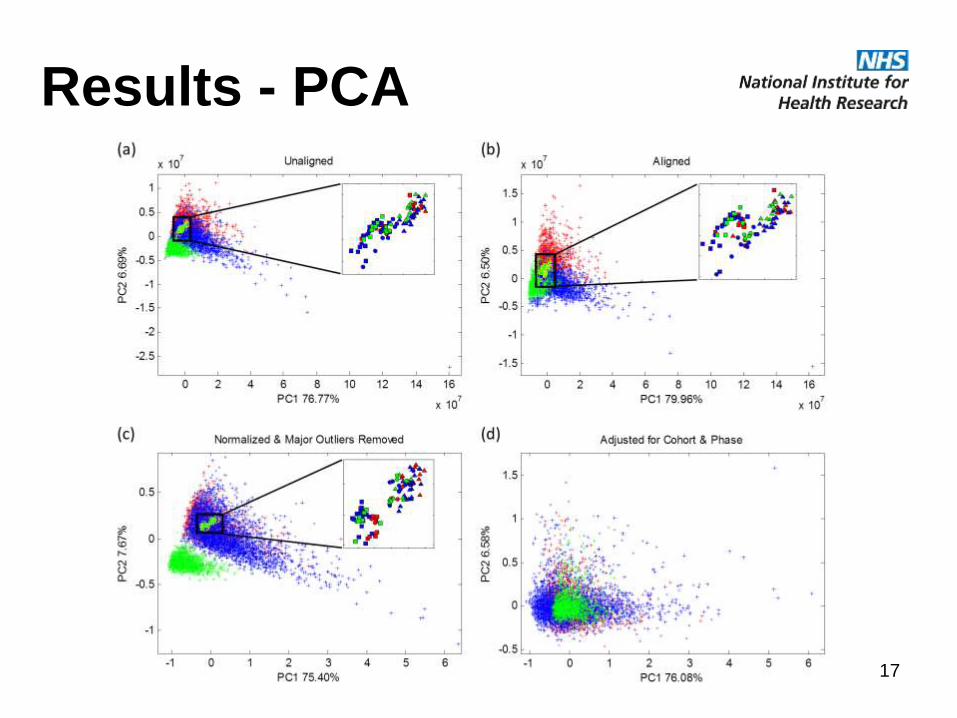
Results - PCA
17
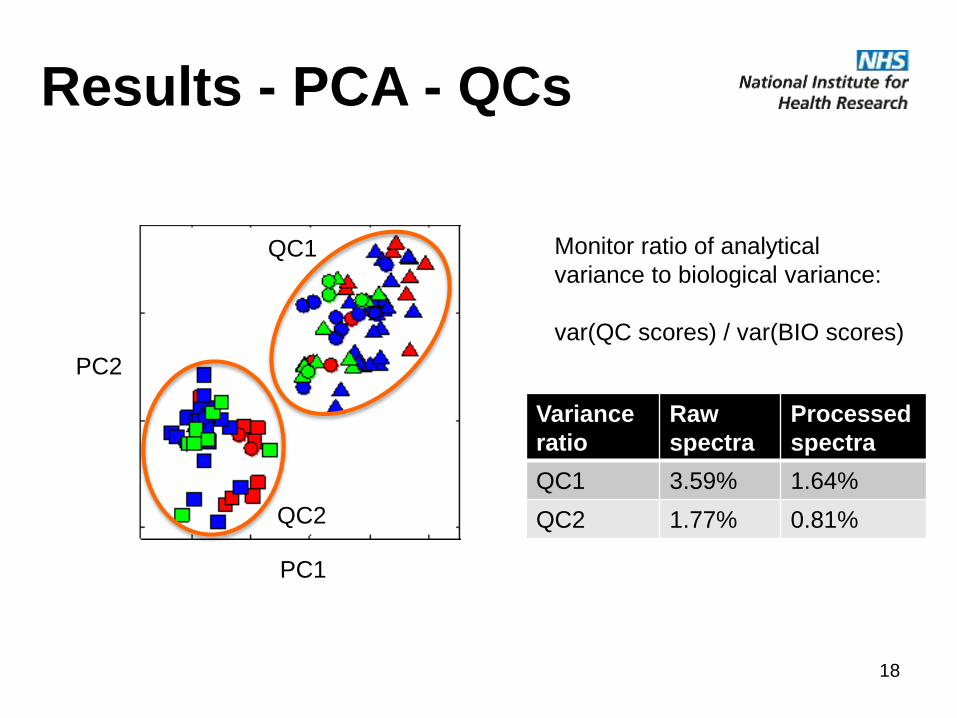
Results - PCA - QCs
PC1
PC2
QC1
QC2
Monitor ratio of analytical
variance to biological variance:
var(QC scores) / var(BIO scores)
Variance
ratio
Raw
spectra
Processed
spectra
QC1 3.59% 1.64%
QC2 1.77% 0.81%
18
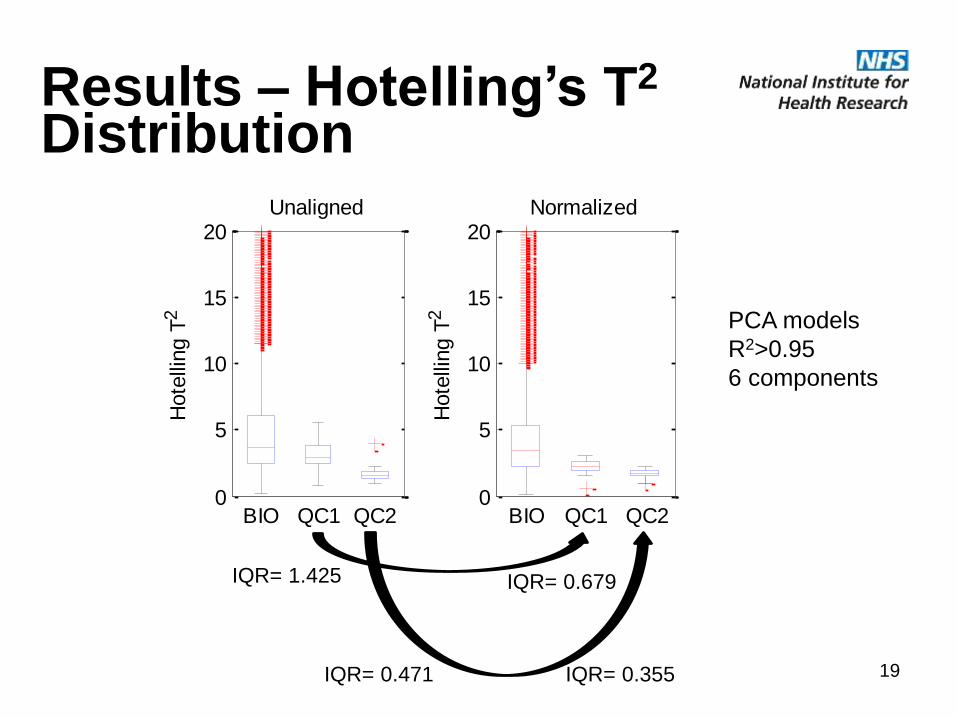
Results – Hotelling’s T2
Distribution
0
5
10
15
20
BIO QC1 QC2
Unaligned
Hote
lling T
2
0
5
10
15
20
BIO QC1 QC2
Normalized
Hote
lling T
2
IQR= 1.425 IQR= 0.679
IQR= 0.471 IQR= 0.355
PCA models
R2>0.95
6 components
19
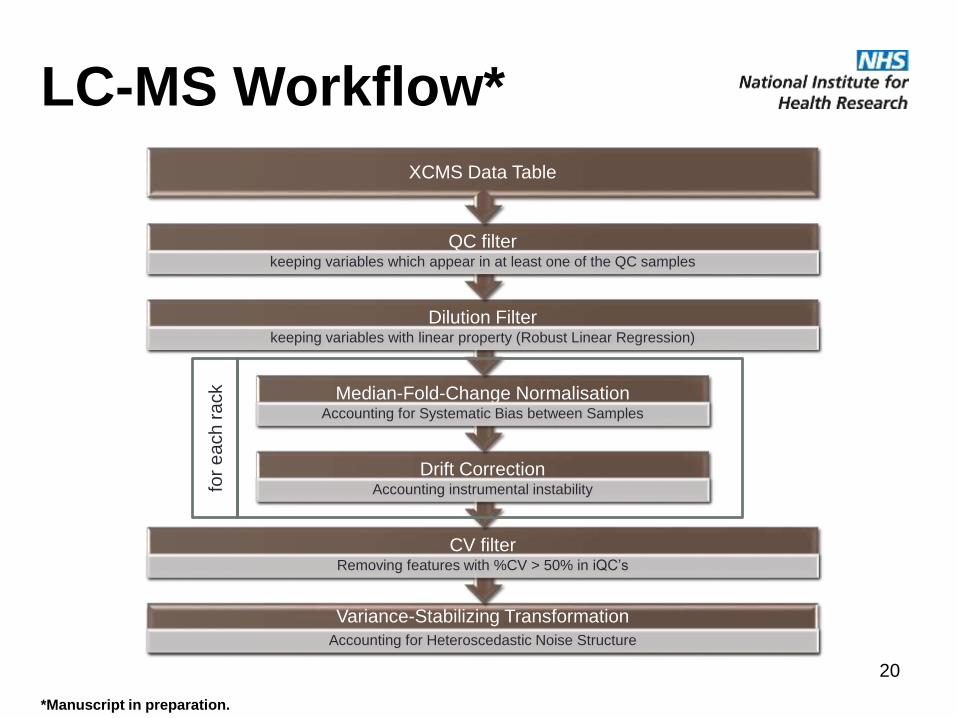
LC-MS Workflow*
*Manuscript in preparation.
Variance-Stabilizing Transformation
Accounting for Heteroscedastic Noise Structure
CV filterRemoving features with %CV > 50% in iQC’s
Drift CorrectionAccounting instrumental instability
Median-Fold-Change NormalisationAccounting for Systematic Bias between Samples
Dilution Filterkeeping variables with linear property (Robust Linear Regression)
QC filterkeeping variables which appear in at least one of the QC samples
XCMS Data Table
for
each r
ack
20
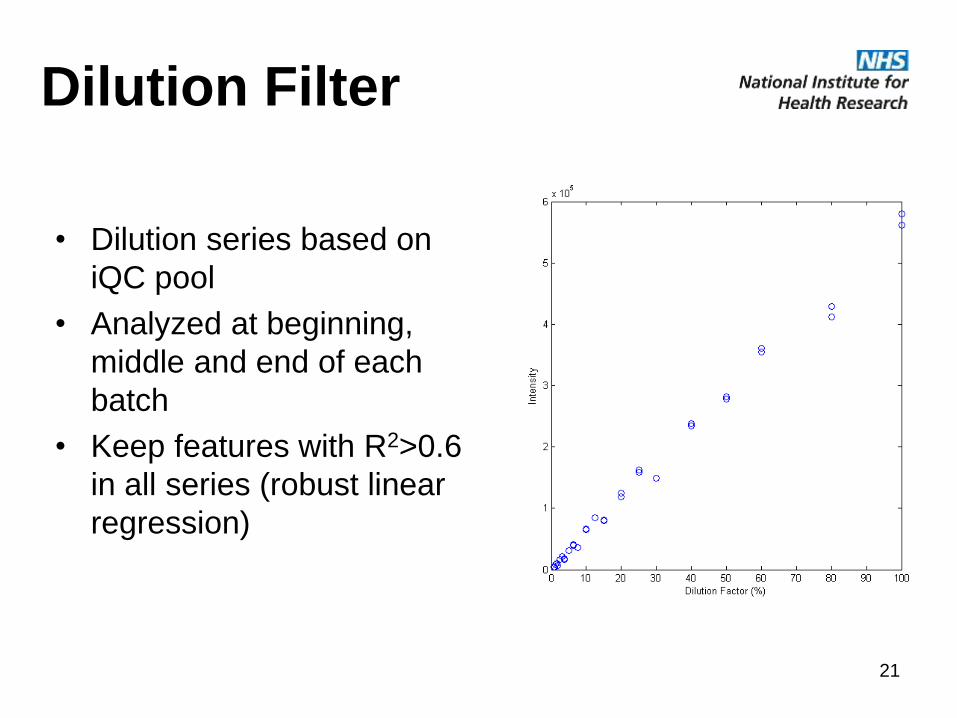
Dilution Filter
• Dilution series based on
iQC pool
• Analyzed at beginning,
middle and end of each
batch
• Keep features with R2>0.6
in all series (robust linear
regression)
21

Drift Correction
• For each feature, fit
LOESS curve to intensity
vs. run order in iQCs
• Use this estimate to
correct intensity in the
biological samples
• LOESS smoothing (span)
determined via cross-
validation
22
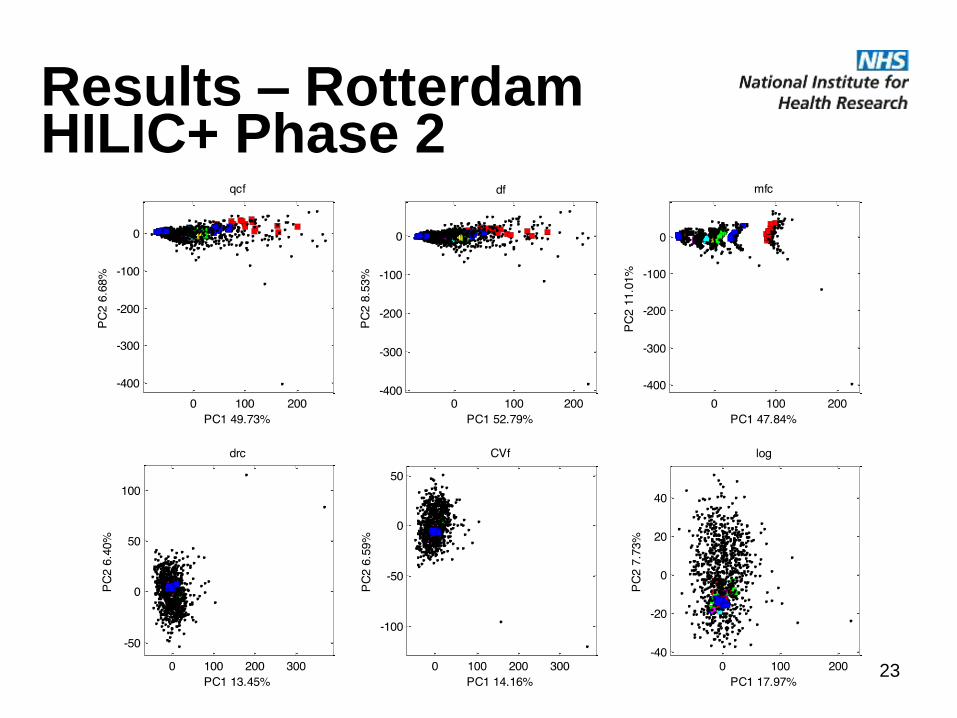
Results – Rotterdam HILIC+ Phase 2
23
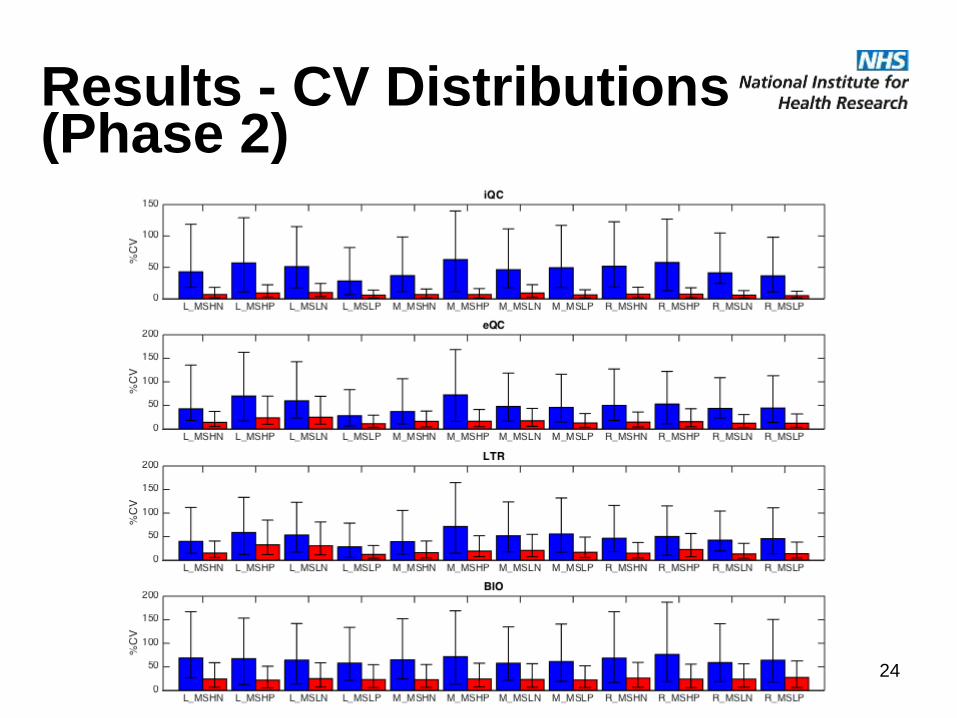
Results - CV Distributions (Phase 2)
24
Summary & Outlook
www.nihr.ac.uk 25
• Untargeted metabolomics poses special challenges
– Shifts in peak position, shape & intensity in both
NMR & LCMS
• Problems become acute with large studies
– Multi platform
– Multi cohort
• Proposed workflows improve stability & reliability of
data for further statistical analysis
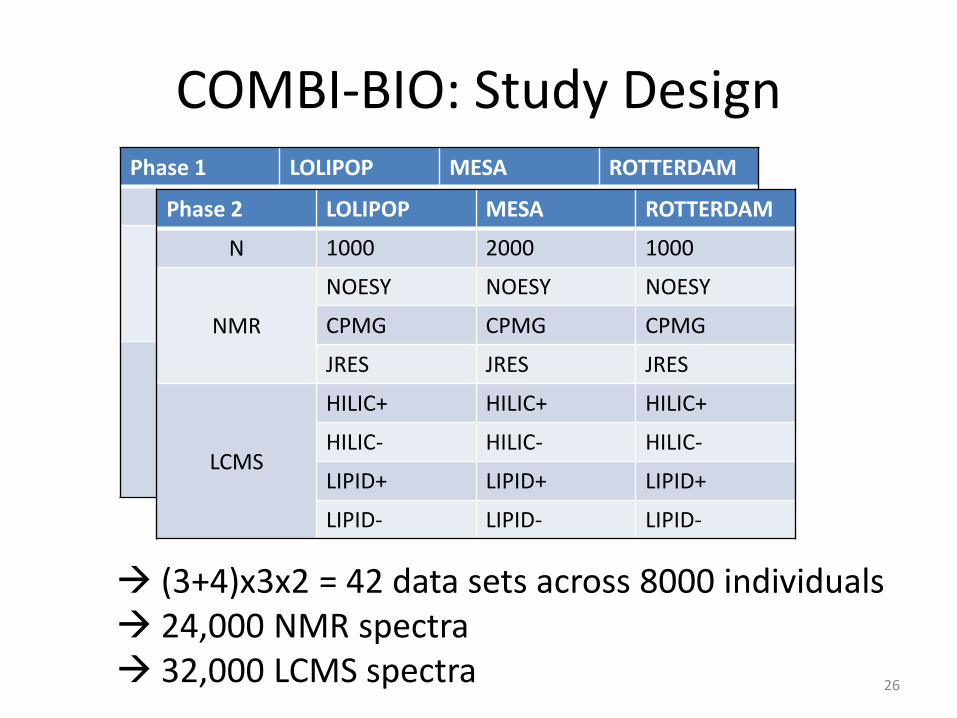
COMBI-BIO: Study Design
26
Phase 1 LOLIPOP MESA ROTTERDAM
N 1000 2000 1000
NMR
NOESY NOESY NOESY
CPMG CPMG CPMG
JRES JRES JRES
LCMS
HILIC+ HILIC+ HILIC+
HILIC- HILIC- HILIC-
LIPID+ LIPID+ LIPID+
LIPID- LIPID- LIPID-
Phase 2 LOLIPOP MESA ROTTERDAM
N 1000 2000 1000
NMR
NOESY NOESY NOESY
CPMG CPMG CPMG
JRES JRES JRES
LCMS
HILIC+ HILIC+ HILIC+
HILIC- HILIC- HILIC-
LIPID+ LIPID+ LIPID+
LIPID- LIPID- LIPID-
(3+4)x3x2 = 42 data sets across 8000 individuals 24,000 NMR spectra 32,000 LCMS spectra

COMBI-BIO – QC Design
27
NMR Description Phase 1 freq Phase 2 freq
QC1 Commercial serum 1/95 (1 per rack) 1/189 (1 per 2 racks)
QC2 Pool of LOLIPOP cohort - 1/95 (1 per rack)
LCMS
iQC Cohort specific pool 1/20 1/6
eQC External serum 1/20 1/24
LTR Long Term Reference (National Phenome Centre)
- 1/12