Impedance Spectroscopy as a Tool for Chemical and Electrochemical Analysis of Mixed Conductors: A...
19
Impedance Spectroscopy as a Tool for Chemical and Electrochemical Analysis of Mixed Conductors: A Case Study of Ceria Wei Lai and Sossina M. Haile w Materials Science, California Institute of Technology, Pasadena, California 91125 The AC impedance response of mixed ionic and electronic con- ductors (MIECs) is derived from first principles and quantita- tively compared with experimental data. While the approach is not entirely new, the derivation is provided in a unified and comprehensive manner. Using Sm 0.15 Ce 0.85 O 1:925d with Pt elec- trodes as a model system, a broad spectrum of electrical and thermodynamic properties is extracted solely from the measure- ment of impedance spectra over wide oxygen partial pressure and temperature ranges. Here, the oxygen partial pressure was varied from air [p O2 5 0.21 atm] to H 2 [p O2 5 10 31 atm], and the temperature was varied from 5001 to 6501C. It was essential for this analysis that the material under investigation exhibit, under some conditions, purely ionic behavior and, under others, mixed conducting behavior. The transition from ionic to mixed con- ducting behavior is recognizable not only from the oxygen partial pressure dependence of the total conductivity but also directly from the shape of the impedance spectra. Within the electrolytic regime, the impedance spectra (presented in Nyquist form) take the shape of simple, depressed arcs, whereas within the mixed conducting regime (under reducing conditions), the spectra ex- hibit the features associated with a half tear-drop-shaped element. Parameters derived from quantitative fitting of the impedance spectra include the concentration of free electron car- riers, the mobilities and activation energies for both ion and elec- tron transport, the electrolytic domain boundary, and the entropy and enthalpy of reduction. In addition, the electrochemical be- havior of O 2 and H 2 at the Ptjceria interface has been charac- terized from these measurements. Under oxidizing conditions, the data suggest an oxygen electrochemical reaction that is rate lim- ited by the dissociated adsorption/diffusion of oxygen species on the Pt electrode, similar to PtjYSZ (yttria-stabilized zirconia). Under reducing conditions, the inverse of the electrode resistivity obeys a p 1=4 O2 dependence, with an activation energy that is sim- ilar to that measured for the electronic conductivity. These re- sults suggest that ceria is electrochemically active for hydrogen electro-oxidation and that the reaction is limited by the rate of removal of electrons from the ceria surface. I. Introduction A C impedance spectroscopy is a valuable tool for studying both the bulk transport properties of a material and the electrochemical reactions on its surface. 1,2 . Well over 7000 pa- pers using this technique appear in the Institute for Scientific Information (ISI) database for the 20-years time period from 1985 to date, Fig. 1. 3 Of these, approximately two-thirds are devoted to bulk and electrode processes, approximately one- quarter to corrosion, and the remainder to other topics such as coatings and bio-electrical processes. For comparison, it is note- worthy that in this same time period, which covers the height of activity in superconductor research, approximately 6000 papers using the Hall effect appear. The value of AC impedance spec- troscopy derives from the effectiveness of the technique in iso- lating individual reaction/migration steps in a multistep process. That is, because each reaction or migration step has, ideally, a unique time constant associated with it, these steps can be sep- arated in the frequency domain. Experimentally, one applies a small sinusoidal current perturbation to an equilibrium system and measures the corresponding voltage response. The ratio of the voltage response to the current perturbation is the impedance. Typically, AC impedance experiments are carried out over a wide range of frequencies (several millihertz to several mega- hertz), and the interpretation of the resulting spectra is aided by analogy to equivalent circuits involving simple components such as resistors and capacitors. In general, such equivalent circuits are not unique, and indeed there exists an infinite set of circuits that can represent any given impedance. It is common to select a physically plausible circuit containing a minimal number of components and, in a somewhat ad hoc manner, assign physi- cal significance to the derived parameters. Often, a meaningful insight into material behavior can be gained from such analyses, which certainly explains the rise in popularity of impedance spectroscopy as a materials characterization tool, Fig. 1. How- ever, the ad hoc approach is lacking in mathematical and phys- ical rigor, and can lead one to overlook some of the more subtle, but significant, features of the data. A key characteristic of the impedance spectra collected from mixed ionic and electronic conductors (MIECs), where the MIEC is placed between two metal electrodes, is the presence of a half tear-drop-shaped feature in the Nyquist (Z imag versus Z real ) representation. The earliest treatment of a related problem is the classic work of Warburg, who studied diffusion under AC conditions in an electrolyte placed between two identical J ournal J. Am. Ceram. Soc., 88 [11] 2979–2997 (2005) DOI: 10.1111/j.1551-2916.2005.00740.x r 2005 The American Ceramic Society Feature D. Johnson—contributing editor Funding for this work has been provided by ONR, Office of Electrochemical Power Science and Technology through the MURI program. w Author to whom correspondence should be addressed. e-mail: [email protected] Manuscript No. 20634. Received June 2, 2005; approved August 23, 2005.
Transcript of Impedance Spectroscopy as a Tool for Chemical and Electrochemical Analysis of Mixed Conductors: A...

Impedance Spectroscopy as a Tool for Chemical and ElectrochemicalAnalysis of Mixed Conductors: A Case Study of Ceria
Wei Lai and Sossina M. Hailew
Materials Science, California Institute of Technology, Pasadena, California 91125
The AC impedance response of mixed ionic and electronic con-ductors (MIECs) is derived from first principles and quantita-tively compared with experimental data. While the approachis not entirely new, the derivation is provided in a unified andcomprehensive manner. Using Sm0.15Ce0.85O1:925�d with Pt elec-trodes as a model system, a broad spectrum of electrical andthermodynamic properties is extracted solely from the measure-ment of impedance spectra over wide oxygen partial pressure andtemperature ranges. Here, the oxygen partial pressure was variedfrom air [pO2
5 0.21 atm] to H2 [pO25 10
�31atm], and the
temperature was varied from 5001 to 6501C. It was essential forthis analysis that the material under investigation exhibit, undersome conditions, purely ionic behavior and, under others, mixedconducting behavior. The transition from ionic to mixed con-ducting behavior is recognizable not only from the oxygen partialpressure dependence of the total conductivity but also directlyfrom the shape of the impedance spectra. Within the electrolyticregime, the impedance spectra (presented in Nyquist form) takethe shape of simple, depressed arcs, whereas within the mixedconducting regime (under reducing conditions), the spectra ex-hibit the features associated with a half tear-drop-shapedelement. Parameters derived from quantitative fitting of theimpedance spectra include the concentration of free electron car-riers, the mobilities and activation energies for both ion and elec-tron transport, the electrolytic domain boundary, and the entropyand enthalpy of reduction. In addition, the electrochemical be-havior of O2 and H2 at the Ptjceria interface has been charac-terized from these measurements. Under oxidizing conditions, thedata suggest an oxygen electrochemical reaction that is rate lim-ited by the dissociated adsorption/diffusion of oxygen species onthe Pt electrode, similar to PtjYSZ (yttria-stabilized zirconia).Under reducing conditions, the inverse of the electrode resistivityobeys a p
�1=4O2
dependence, with an activation energy that is sim-ilar to that measured for the electronic conductivity. These re-sults suggest that ceria is electrochemically active for hydrogenelectro-oxidation and that the reaction is limited by the rate ofremoval of electrons from the ceria surface.
I. Introduction
AC impedance spectroscopy is a valuable tool for studyingboth the bulk transport properties of a material and the
electrochemical reactions on its surface.1,2. Well over 7000 pa-pers using this technique appear in the Institute for ScientificInformation (ISI) database for the 20-years time period from1985 to date, Fig. 1.3 Of these, approximately two-thirds aredevoted to bulk and electrode processes, approximately one-quarter to corrosion, and the remainder to other topics such ascoatings and bio-electrical processes. For comparison, it is note-worthy that in this same time period, which covers the height ofactivity in superconductor research, approximately 6000 papersusing the Hall effect appear. The value of AC impedance spec-troscopy derives from the effectiveness of the technique in iso-lating individual reaction/migration steps in a multistep process.That is, because each reaction or migration step has, ideally, aunique time constant associated with it, these steps can be sep-arated in the frequency domain. Experimentally, one appliesa small sinusoidal current perturbation to an equilibrium systemand measures the corresponding voltage response. The ratioof the voltage response to the current perturbation is theimpedance.
Typically, AC impedance experiments are carried out over awide range of frequencies (several millihertz to several mega-hertz), and the interpretation of the resulting spectra is aided byanalogy to equivalent circuits involving simple components suchas resistors and capacitors. In general, such equivalent circuitsare not unique, and indeed there exists an infinite set of circuitsthat can represent any given impedance. It is common to select aphysically plausible circuit containing a minimal number ofcomponents and, in a somewhat ad hoc manner, assign physi-cal significance to the derived parameters. Often, a meaningfulinsight into material behavior can be gained from such analyses,which certainly explains the rise in popularity of impedancespectroscopy as a materials characterization tool, Fig. 1. How-ever, the ad hoc approach is lacking in mathematical and phys-ical rigor, and can lead one to overlook some of the more subtle,but significant, features of the data.
A key characteristic of the impedance spectra collected frommixed ionic and electronic conductors (MIECs), where theMIEC is placed between two metal electrodes, is the presenceof a half tear-drop-shaped feature in the Nyquist (�Zimag versusZreal) representation. The earliest treatment of a related problemis the classic work of Warburg, who studied diffusion underAC conditions in an electrolyte placed between two identical
Journal
J. Am. Ceram. Soc., 88 [11] 2979–2997 (2005)
DOI: 10.1111/j.1551-2916.2005.00740.x
r 2005 The American Ceramic Society
Feature
D. Johnson—contributing editor
Funding for this work has been provided by ONR, Office of Electrochemical PowerScience and Technology through the MURI program.
wAuthor to whom correspondence should be addressed. e-mail: [email protected]
Manuscript No. 20634. Received June 2, 2005; approved August 23, 2005.

electrodes.4,5 The essence of Warburg’s analysis is to solve Fick’slaws of diffusion under the appropriate boundary conditions.
Since that early work, two parallel schools of thought haveappeared in the literature for rationalizing the the half tear-drop-shaped arc obtained from MIECs, both of which can beviewed as outgrowths of Warburg’s original analysis. The first,as proposed by Boukamp,6,7 is to account explicitly for the pos-sibility that there are sources and/or sinks in the material suchthat the overall rate of charge flux is co-limited by both chemicaland electrochemical reactions. Introduction of a source/sinkterm into the mathematical formalism results in the so-calledGerischer impedance element. An analogous approach has beenapplied by Adler8 for the case where the flux is co-limited by acombined chemical–electrochemical reaction sequence at theelectrode rather than within the bulk of the material. Here, theelectrolyte need not be a mixed conductor, and indeed the anal-ysis has been applied to the pure ionic conductor yttria-stabi-lized zirconia (YSZ). Furthermore, the electrode may be asimple metal, such as Pt, or a mixed conductor itself, such as(La,Sr)CoO3�d (LSC). This approach has its roots in earlierwork by Sluyters-Rehbach and Sluyters,9 Robertson and Mi-chaels,10 and the original work of Gerischer.11 Modeling im-pedance spectra in this manner (i.e., using the Gerischerelement) requires that some sort of chemical step, which mayor may not be known a priori, be invoked. For the case in whichthis step is presumed to occur at the electrode, adsorption anddiffusion are obvious candidates. In contrast, if this step is pre-sumed to occur within the mixed conducting electrolyte, it is notat all apparent what the reaction might be. As one alternative,Boukamp has suggested that the reaction might involve the for-mation of immobile complexes within the bulk of the MIEC.7
A second school of thought for understanding the half tear-drop-shaped arc in the impedance spectrum of MIECs followsfrom recent works of Jamnik and Maier12,13 and of Hornoet al.,14 and has its roots in earlier studies by Macdonald15 andby Brumleve and Buck.16 These authors explicitly account forthe fact that the diffusing charged species is exposed to an elec-trical as well as a chemical potential gradient. The flux equationscan then be mapped to an equivalent circuit, providing a firstprinciples representation of an MIEC. For a variety of reasonsoutlined below, this model, in which the influence of the internalelectric field gradient is treated in full, rather than the chemical–electrochemical reaction model, is taken to represent MIECbehavior, accurately as observed here.
In the present study, an alternate (and, we believe, morephysically intuitive) derivation of the equivalent circuit proposedby Jamnik and Maier13 is provided, and the analysis is then ap-plied to the evaluation of ceria. It is shown that not only can oneextract the important electrical parameters of an MIEC as in-dicated by the earlier work but also, from measurements carriedout over wide oxygen partial pressures and at a range of tem-peratures, essential thermodynamic parameters. The measure-
ments and analysis, furthermore, provide some indication as tothe rate-limiting step for hydrogen electro-oxidation at themetaljceria interface. A preliminary attempt to carry out a sim-ilar analysis (limited, however, to the behavior of ceria andnot addressing the Ptjceria interface) has recently been reportedby Atkinson et al.,17 and a comparison with the results of theseauthors is also presented here.
Ceria has been selected for study because of increasing inter-est in this material as an electrolyte for ‘‘reduced’’-temperaturesolid oxide fuel cells (SOFCs),18 that is, SOFCs in which thetraditional operating temperature of 8001–10001C has beenreduced to 5001–8001C. Samaria-doped ceria (SDC) andgadolinia-doped ceria (GDC) exhibit higher conductivity thanYSZ at 7001C, and it has been possible to obtain power densitiesas high as 1 W/cm2 from anode-supported SDC fuel cells at6001C using humidified hydrogen as the fuel and air as theoxidant.19 Fuel cell operation in this intermediate-temperatureregime has the potential for substantially lowering auxiliarycomponent costs and increasing the thermomechanical stabilityof the SOFC system. The large body of experimental data al-ready existent for acceptor-doped ceria20 as a consequence of itsvalue for fuel cell applications renders this an ideal model ma-terial against which to verify a new measurement approach,whereas the new insight that is to be gained from careful analysisof impedance data into electrocatalytic pathways is of greatvalue to the design of SOFC electrodes.
II. Theoretical Background
(1) AC Impedance of a Mixed Ionic and ElectronicConductor
(A) Fundamental Physics: Mass and charge transport insolids subjected to a combined electrical and chemical potentialgradient is governed by the so-called diffusion–drift equation (orNernst–Planck equation), the derivation of which is given inmany texts (cf. Richert21). For the one-dimensional case, thisequation has the form
Jmassi ðx; tÞ ¼ �Di
qciðx; tÞqx
� siðx; tÞzie
qfðx; tÞqx
(1)
where x is the position, t is the time, Jmassi is the mass flux of the
charged species i, Di is the diffusion coefficient, ci is the concen-tration, si is the conductivity, zie is the charge carried by thespecies, e is the charge of an electron, and f is the electrical po-tential. In general ci, si, and f can each vary with both time andposition. The first term in the diffusion–drift equation reflects astatement of Fick’s law, whereas the second reflects a statementof Ohm’s law, modified to translate charge flux (or current den-sity), J
chargei , to mass flux according to J
chargei ¼ zieJ
massi .
For an ideal solution, in which there is a simple relation-ship between the concentration and chemical potential, m, thediffusion–drift equation can be readily rewritten in terms of thegradient in a single quantity, the electrochemical potential,~m. Specifically, the chemical potential of an ideal solution isgiven as
miðx; tÞ ¼ m0i þ kBT ln ciðx; tÞ (2)
where m0i is the standard chemical potential, kB is the Boltzmannconstant, and T is the absolute temperature. Differentiating withrespect to x yields
qmiðx; tÞqx
¼ kBT
ciðx; tÞqciðx; tÞ
qx(3)
and substituting Eq. (3) into Eq. (1) yields
Jmassi ðx; tÞ ¼ �Diciðx; tÞ
kBT
qmiðx; tÞqx
� siðx; tÞzie
qfðx; tÞqx
(4)
Fig. 1. Number of papers published annually with the words ‘‘imped-ance spectroscopy’’ in the title, abstract, or key words list.
2980 Journal of the American Ceramic Society—Lai and Haile Vol. 88, No. 11

Now making use of the Nernst–Einstein relationship relatingconductivity to diffusivity
siðx; tÞ ¼ðzieÞ2ciðx; tÞ
kBTDi (5)
and combining the chemical and electrical contributions to thepotential via the electrochemical potential
~mi ðx; tÞ ¼ miðx; tÞ þ ziefðx; tÞ (6)
one obtains
Jmassi ðx; tÞ ¼ �siðx; tÞ
zieð Þ2q~miðx; tÞ
qx(7)
This form of the diffusion–drift equation is the first of threefundamental equations of relevance to the treatment here offluxes of charged species through a mixed conductor.
In the case where the concentration of species i changes withtime and there are no sources or sinks of mass, the variation inmass flux with position must balance the variation in concen-tration with time according to the continuity equation
q Jmassi ðx; tÞqx
þ qciðx; tÞqt
¼ 0 (8)
This relationship provides a second constraint in the descrip-tion of mass flow in the system. For an ideal solution (the chem-ical potential of which is described by Eq. (2)), the temporalderivative of concentration is obtained from
qmiðx; tÞqt
¼ kBT
ciðx; tÞqciðx; tÞ
qt(9)
and, thus, the continuity equation implies
q Jmassi ðx; tÞqx
¼ � ciðx; tÞkBT
qmiðx; tÞqt
(10)
This is the second fundamental equation describing the flux ofcharged species through a mixed conductor.
One must next consider the effect of a time-varying electricalfield (as is experimentally applied) on the flow of charge in thesystem. Charge flux must, like mass flux, obey the laws of con-tinuity. In order to rewrite Eq. (8) appropriately, one makes useof the previously noted relationship between charge and massflux
Jchargei ðx; tÞ ¼ zie J
massi ðx; tÞ (11)
to obtain
qqx
Jchargei ðx; tÞ þ q
qteziciðx; tÞ½ � ¼ 0 (12)
As Eq. (12) is true for any particular species, it must also be truefor the sum of all the species such that
qqx
Xi
Jchargei ðx; tÞ þ q
qt
Xi
eziciðx; tÞ" #
¼ 0 (13)
The sum of all the charges in the system,P
i eziciðx; tÞ, isrelated to the electrical potential via Poisson’s equations
�erðx; tÞe0q2fðx; tÞ
qx2¼Xi
eziciðx; tÞ (14)
where er is the relative permittivity of the material under con-sideration and e0 is the permittivity of vacuum. Insertion intoEq. (13) yields
qqx
Xi
Jchargei ðx; tÞ þ q
qx� qqt
erðx; tÞe0qfðx; tÞ
qx
� �� �¼ 0 (15)
which implies that the total charge flux is
JchargeT ðtÞ ¼
Xi
Jchargei ðx; tÞ þ J
chargedis ðx; tÞ (16)
where
Jchargedis ðx; tÞ ¼ � q
qterðx; tÞe0
qfðx; tÞqx
� �(17)
Thus, the time-varying electrical field produces what is termeda displacement flux, J
chargedis , and its behavior yields the third
fundamental equation describing the flux of charged speciesthrough a mixed conductor.
Rewriting Eqs. (7) and (10) in terms of charge ratherthan mass flux enables one to unify the three independent con-straints on the flow of charged species. This is achieved by mak-ing use of Eq. (11) and by also defining two new types ofpotentials. The first is the electrical equivalent of the chemicalpotential,
m�i ðx; tÞ ¼miðx; tÞzie
(18)
and the second the electrical equivalent of the electrochemicalpotential,
~m�i ðx; tÞ ¼ m�i ðx; tÞ þ fðx; tÞ (19)
both of which have units of electrical potential. Inserting Eqs.(11), (18), and (19) into Eqs. (7) and (10), respectively, yields
Jchargei ðx; tÞ ¼ �siðx; tÞ
q~m�i ðx; tÞqx
(20)
and
qqx
Jchargei ðx; tÞ ¼ � zieð Þ2ciðx; tÞ
kBT
qm�i ðx; tÞqt
(21)
which, along with Eq. (17), entirely describes the current flow inthe material system. From the additive nature of the fluxes, Eq.(16), it is apparent that the processes must exist in parallel withone another.
If the system is exposed to a uniform chemical potential en-vironment over the course of the impedance measurement, theposition dependence of the material properties (si, ci and er) canbe ignored. Furthermore, if the voltage perturbations are small,the time-dependent material properties can be replaced withtheir time-averaged values, and these averages are implied here-after. Thus, for small perturbations Df and D~mi, the fluxesD J
chargei and D J
chargedis obey the following equations:
D Jchargei ðx; tÞ ¼ �si
qqx
D~m�i ðx; tÞ (22)
qqx
D Jchargei ðx; tÞ ¼ � zieð Þ2ci
kBT
qqtDm�i ðx; tÞ (23)
D Jchargedis ðx; tÞ ¼ �ere0
qqx
qqt
Dfðx; tÞ (24)
November 2005 Impedance Spectroscopy for Analysis of Mixed Conductors 2981

(B) Equivalent Circuit Representation: As noted byJamnik and Maier12 and demonstrated earlier by Brumleveand Buck,16 the system of coupled differential equations givenabove can be mapped onto an equivalent circuit whose compo-nents correspond to physically significant quantities. For thecase where there are two mobile charge-carrying species (do-pants in this system are taken to be immobile), a differential (dx)portion of the circuit that represents Eqs. (22)–(24) is as shownin Fig. 2. The element has a cross-sectional area A. Species 1flows along rail 1 ðABÞ and species 2 flows along rail 2 ðEFÞ.The displacement current density flows along the central, dis-placement rail ðCDÞ, and additional flow between rails is, inprinciple, possible. The electrical potentials at branchpoints A,C, and E are given by D~m�1ðx; tÞ, Dfðx; tÞ and D~m�2ðx; tÞ, respec-tively, whereas at x1dx, branchpoints B, D, and F, have anal-ogous electrical potentials of D~m�1ðxþ dx; tÞ, Dfðxþ dx; tÞ, andD~m�2ðxþ dx; tÞ, respectively. From Eq. (19), it is apparent thatthe ‘‘voltage’’ difference between branchpoints A and C isDm�1ðx; tÞ and that between E and C is Dm�2ðx; tÞ. In fact, thereis no electric potential drop between these branchpoints and this‘‘voltage’’ is a mathematical consequence of having renormal-ized the chemical potential in terms of an electrical equivalence(Eq. (18)). Such a definition permits treatment of the circuit interms of the standard circuit theory.
For the equivalent circuit of Fig. 2, the voltage drop acrossresistor Ri is given as
D~m�i ðx; tÞ � D~m�i ðxþ dx; tÞ ¼ D Jchargei ðx; tÞARi (25)
The current flow along the displacement rail is described as
D Jchargedis ðx; tÞ ¼ Cdis
A
qqt
Dfðx; tÞ � Dfðxþ dx; tÞ½ � (26)
Applying Kirchoff’s second law (SJ5 0 at any branchpoint)to branchpoints A and E yields
DJchargei ðx� dx; tÞ � DJcharge
i ðx; tÞ ¼ Ci
A
qqt
Dm�i ðx; tÞ (27)
These differential forms, Eqs. (25)–(27), can be rewritten aspartial derivatives as
DJchargei ðx; tÞ ¼ � dx
ARi
qqx
D~m�i ðx; tÞ (28)
DJchargedis ðx; tÞ ¼ �Cdis dx
A
qqt
qqx
Dfðx; tÞ� �
(29)
qqx
DJchargei ðx; tÞ
h i¼ � Ci
A dx
qqtDm�i ðx; tÞ (30)
This set of equations has exactly the form required by Eqs. (22)–(24). Thus, the proposed equivalent circuit indeed maps directlyonto the physical reality, with the following correspondence be-tween elements in the circuit and material properties:
Ri ¼1
si
dx
A(31)
Cdis ¼ ere0A
dx(32)
and
Ci ¼zieð Þ2cikBT
A dx (33)
It is then apparent thatR1 andR2 are the resistances of carriers 1and 2 of the element, respectively, whereas Cdis is the dielectriccapacitance of the element. The quantities C1 and C2, discussedfurther below, are related to the ‘‘chemical capacitance,’’ of themixed conductor, as termed by Jamnik and Maier.12 These ca-pacitances represent the coupling between the multiple-currentflow rails.
The equivalent circuit of Fig. 2 is greatly simplified if localelectroneutrality is obeyed in the bulk. In this case,
ez1 dc1ðx; tÞ þ ez2 dc2ðx; tÞ ¼ 0 (34)
and
ez1qc1ðx; tÞ
qtþ ez2
qc2ðx; tÞqt
¼ 0 (35)
In writing Eq. (34), an explicit account for the contribution ofdopants to the charge distribution is not required because, asstated above, these species are taken to be immobile. Combiningthis with the continuity equation, Eq. (12), and noting that it isthe perturbations in flux that are of interest, one obtains
qDJcharge1 ðx; tÞqx
þ qDJcharge2 ðx; tÞqx
¼ 0 (36)
This result implies that any flux flowing from carrier rail 1 to thedisplacement rail is exactly balanced by that flowing to the dis-placement rail from carrier rail 2. As a consequence, there iseffectively no current flow between the carrier rails and the dis-placement rail (although flow between the two carrier rails re-mains possible). Accordingly, the circuit can be simplified to thatshown in Fig. 3, by removing the electrical connection betweenthe displacement rail and the two carrier rails. Doing so placesC1 and C2 directly in series with one another (with no inter-vening branchpoints) and, thus, they can be combined into asingle capacitance element defined according to the followingequations:
C12 ¼1
C1þ 1
C2
� ��1¼ e2
kBT
1
z21c1þ 1
z22c2
� ��1A dx (37)
Because of the isolated flow along the carrier and displace-ment rails, each of the displacement capacitor elements is di-rectly in series with one another and they can also be combinedinto one element:
CTotaldis ¼
Z L
0
1
Cdis
� ��1¼
Z L
0
dx
ere0A
� ��1¼ ere0A
L¼ Cdielec (38)
2R
C1
R1
C2
Cdis
∆J2 (x,t)
*~∆�1 (x,t)
*~∆�2 (x,t)
∆�(x,t)
∆�1 (x,t)
∆�2 (x,t)
∆�1(x+dx,t)
A
C
E
B
F
D
∆J1charge(x-dx,t)
∆J2 (x−dx,t)
∆Jdis (x−dx,t) ∆�(x+dx,t)
*~
∆�2(x+dx,t)*~
*
*
charge
charge
charge
∆Jdis (x,t)charge
∆J1 (x,t)charge
Fig. 2. Differential element of the equivalent circuit obeying the currentflow constraints Eqs. (22)–(24) for a system in which two charge-carryingspecies are mobile. The current associated with species 1 flows along thetop rail, whereas that associated with species 2 flows along the bottomrail. The central rail supports current flow because of capacitive effects.In principle, flow between rails is possible. The electrical potential ateach of the branchpoints is indicated as is the entering flux. The resistorsand capacitors in the system can have position-dependent values, butotherwise behave as standard resistor and capacitor elements. A is thecross-sectional area of the element and dx is its length.
2982 Journal of the American Ceramic Society—Lai and Haile Vol. 88, No. 11
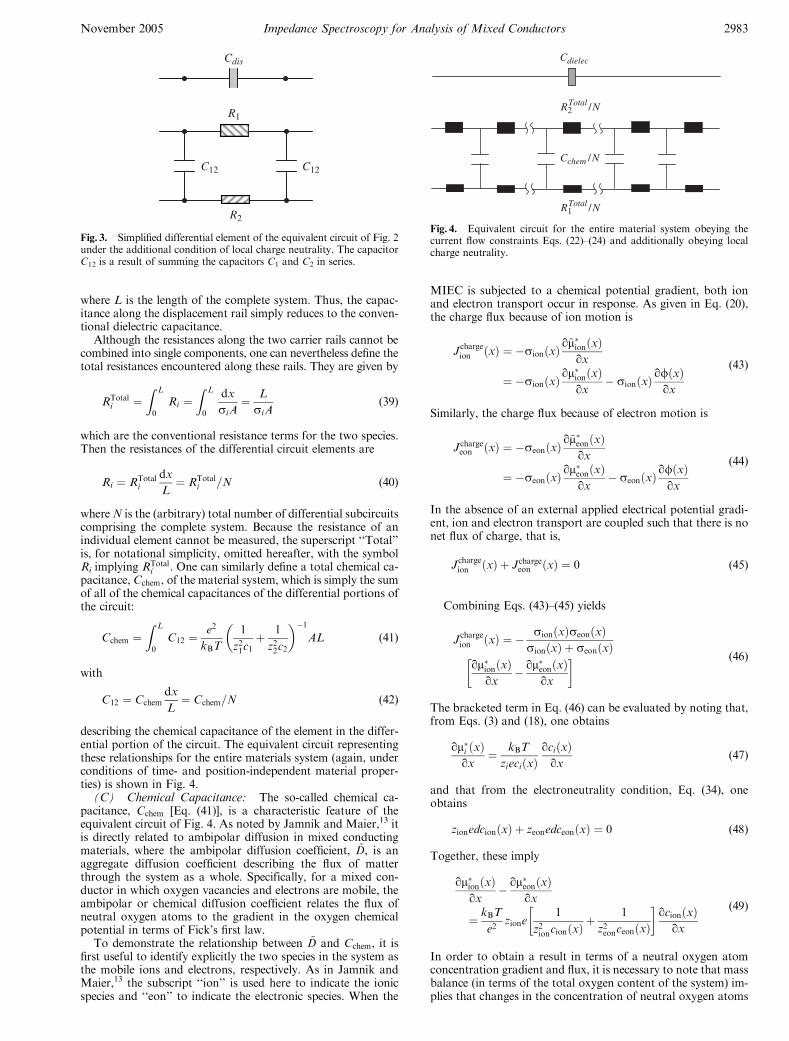
where L is the length of the complete system. Thus, the capac-itance along the displacement rail simply reduces to the conven-tional dielectric capacitance.
Although the resistances along the two carrier rails cannot becombined into single components, one can nevertheless define thetotal resistances encountered along these rails. They are given by
RTotali ¼
Z L
0
Ri ¼Z L
0
dx
siA¼ L
siA(39)
which are the conventional resistance terms for the two species.Then the resistances of the differential circuit elements are
Ri ¼ RTotali
dx
L¼ RTotal
i =N (40)
whereN is the (arbitrary) total number of differential subcircuitscomprising the complete system. Because the resistance of anindividual element cannot be measured, the superscript ‘‘Total’’is, for notational simplicity, omitted hereafter, with the symbolRi implying RTotal
i . One can similarly define a total chemical ca-pacitance, Cchem, of the material system, which is simply the sumof all of the chemical capacitances of the differential portions ofthe circuit:
Cchem ¼Z L
0
C12 ¼e2
kBT
1
z21c1þ 1
z22c2
� ��1AL (41)
with
C12 ¼ Cchemdx
L¼ Cchem=N (42)
describing the chemical capacitance of the element in the differ-ential portion of the circuit. The equivalent circuit representingthese relationships for the entire materials system (again, underconditions of time- and position-independent material proper-ties) is shown in Fig. 4.
(C) Chemical Capacitance: The so-called chemical ca-pacitance, Cchem [Eq. (41)], is a characteristic feature of theequivalent circuit of Fig. 4. As noted by Jamnik and Maier,13 itis directly related to ambipolar diffusion in mixed conductingmaterials, where the ambipolar diffusion coefficient, ~D, is anaggregate diffusion coefficient describing the flux of matterthrough the system as a whole. Specifically, for a mixed con-ductor in which oxygen vacancies and electrons are mobile, theambipolar or chemical diffusion coefficient relates the flux ofneutral oxygen atoms to the gradient in the oxygen chemicalpotential in terms of Fick’s first law.
To demonstrate the relationship between ~D and Cchem, it isfirst useful to identify explicitly the two species in the system asthe mobile ions and electrons, respectively. As in Jamnik andMaier,13 the subscript ‘‘ion’’ is used here to indicate the ionicspecies and ‘‘eon’’ to indicate the electronic species. When the
MIEC is subjected to a chemical potential gradient, both ionand electron transport occur in response. As given in Eq. (20),the charge flux because of ion motion is
Jchargeion ðxÞ ¼ �sionðxÞ
q~m�ionðxÞqx
¼ �sionðxÞqm�ionðxÞ
qx� sionðxÞ
qfðxÞqx
(43)
Similarly, the charge flux because of electron motion is
Jchargeeon ðxÞ ¼ �seonðxÞ
q~m�eonðxÞqx
¼ �seonðxÞqm�eonðxÞ
qx� seonðxÞ
qfðxÞqx
(44)
In the absence of an external applied electrical potential gradi-ent, ion and electron transport are coupled such that there is nonet flux of charge, that is,
Jchargeion ðxÞ þ Jcharge
eon ðxÞ ¼ 0 (45)
Combining Eqs. (43)–(45) yields
Jchargeion ðxÞ ¼ � sionðxÞseonðxÞ
sionðxÞ þ seonðxÞqm�ionðxÞ
qx� qm�eonðxÞ
qx
� � (46)
The bracketed term in Eq. (46) can be evaluated by noting that,from Eqs. (3) and (18), one obtains
qm�i ðxÞqx
¼ kBT
zieciðxÞqciðxÞqx
(47)
and that from the electroneutrality condition, Eq. (34), oneobtains
zionedcionðxÞ þ zeonedceonðxÞ ¼ 0 (48)
Together, these imply
qm�ionðxÞqx
� qm�eonðxÞqx
¼ kBT
e2zione
1
z2ioncionðxÞþ 1
z2eonceonðxÞ
� �qcionðxÞ
qx
(49)
In order to obtain a result in terms of a neutral oxygen atomconcentration gradient and flux, it is necessary to note that massbalance (in terms of the total oxygen content of the system) im-plies that changes in the concentration of neutral oxygen atoms
R2
C12
R1
Cdis
C12
Fig. 3. Simplified differential element of the equivalent circuit of Fig. 2under the additional condition of local charge neutrality. The capacitorC12 is a result of summing the capacitors C1 and C2 in series.
Cdielec
R2 /NTotal
R1 /NTotal
Cchem /N
Fig. 4. Equivalent circuit for the entire material system obeying thecurrent flow constraints Eqs. (22)–(24) and additionally obeying localcharge neutrality.
November 2005 Impedance Spectroscopy for Analysis of Mixed Conductors 2983
must be balanced by changes in the concentration of oxygenvacancies and the fluxes must be similarly balanced. That is
dcionðxÞ þ dcOðxÞ ¼ 0 (50)
where cO is the concentration of neutral oxygen atoms, and
Jmassion ðxÞ þ Jmass
O ðxÞ ¼ 0 (51)
where Jmassion is the (mass) flux of neutral oxygen atoms. Using
Eq. (50), it is possible to rewrite Eq. (49) in terms of the oxygenconcentration gradient, whereas using Eqs. (51) and (11), it ispossible to convert the charge flux of Eq. (46) into mass flux.The result is
JmassO ðxÞ ¼ � sionðxÞseonðxÞ
sionðxÞ þ seonðxÞkBT
e2
� 1
z2ioncionðxÞþ 1
z2eonceonðxÞ
� �qcOðxÞqx
(52)
and the proportionality constant between JmassO and qcO=qx is
the chemical or ambipolar diffusion coefficient, ~D. In a uniformchemical environment, the position dependence of the materialproperties can be ignored, yielding
~D ¼ sionseon
sion þ seon
kBT
e21
z2ioncionþ 1
z2eonceon
� �(53)
This can be readily rewritten in terms of the total ionic andelectronic resistances, Eq. (39), and the chemical capacitance,Eq. (41), to yield
~D ¼ L2
ðRion þ ReonÞCchem(54)
The chemical capacitance has certain similarities to conventionaldielectric capacitance. While the latter is a measure of the abilityof the system to store electrical energy in the form of polarizedelectric dipoles, the former is a measure of the ability of thesystem to store chemical energy in the form of changes in sto-ichiometry in response to changes in oxygen partial pressure.The analogy is made more explicit as follows: for a parallel platecapacitor with area A and length L, the conventional capaci-tance is
Cdielec ¼qqqDf
¼ ADdis
EL¼ Aere0
L(55)
where Ddis ¼ ere0E is the electrical displacement and E is theelectrical field. In the case of chemical capacitance, the storedcharge because of species i is
qi ¼ zieciAL (56)
The voltage drop across the capacitor is m�i (Fig. 2), definedpreviously as
m�i ¼m0izieþ kBT
zieln ci (57)
Defining the capacitance in analogy to Eq. (55) as qqi=qm�i ,and evaluating this quantity yield
Cchem;i ¼qqiqm�i¼ ðzieÞ
2
kBTciAL (58)
which, as implied by Eq. (33), is the total chemical capacitanceassociated with species i. As suggested previously, with this def-inition, it is possible to view a battery, in which energy is stored
chemically, as a chemical capacitor.12 A thermodynamic inter-pretation of chemical capacitance has also been discussed.22
(D) Introduction of Electrodes: In a real system, the ma-terial under investigation is placed between electrodes, the prop-erties of which establish the boundary conditions that apply tothe flux terms of Eq. (17) (the displacement rail) and of Eq. (20)(the two carrier rails).16 Treatment of this aspect of the overallproblem via a first principles approach requires a detailed un-derstanding of the electrochemical processes occurring at theelectrodejelectrolyte interface, at the electrodejgas interface, andwithin the electrode itself. Such an analysis is beyond the scopeof the present work. In the simplest case, the electrodes areidentical and, upon perturbation of the system, a step change inth concentration of species i across the electrodejelectrolyte in-terface, Dci, is generated, and the resulting flux across that in-terface is proportional to Dci via a rate constant ki. That is,DJmass
i ¼ �kiDci at x5 0(�), L(1). This behavior is equivalentto the assumption of Chang–Jaffe boundary conditions.15,23 Theexpression can be converted into one relating charge flux to m�i(the electrical equivalent of the chemical potential) using thedefinitions of Eqs. (11) and (18), and evaluating the differentialof Eq. (2). The result is
DJchargei ¼ �ðzieÞ
2kici
kBTDm�i (59)
where the minus sign applies at x5 0 and the plus sign applies atx5L. In the terminology of Fig. 2, this corresponds to the be-havior of a simple resistor that connects each of the carrier railsto the displacement rail and has resistance
R?i ¼kBT
ðzieÞ2kici(60)
where the superscript ? indicates the properties of the interface(with charge flow occurring perpendicular to that interface).
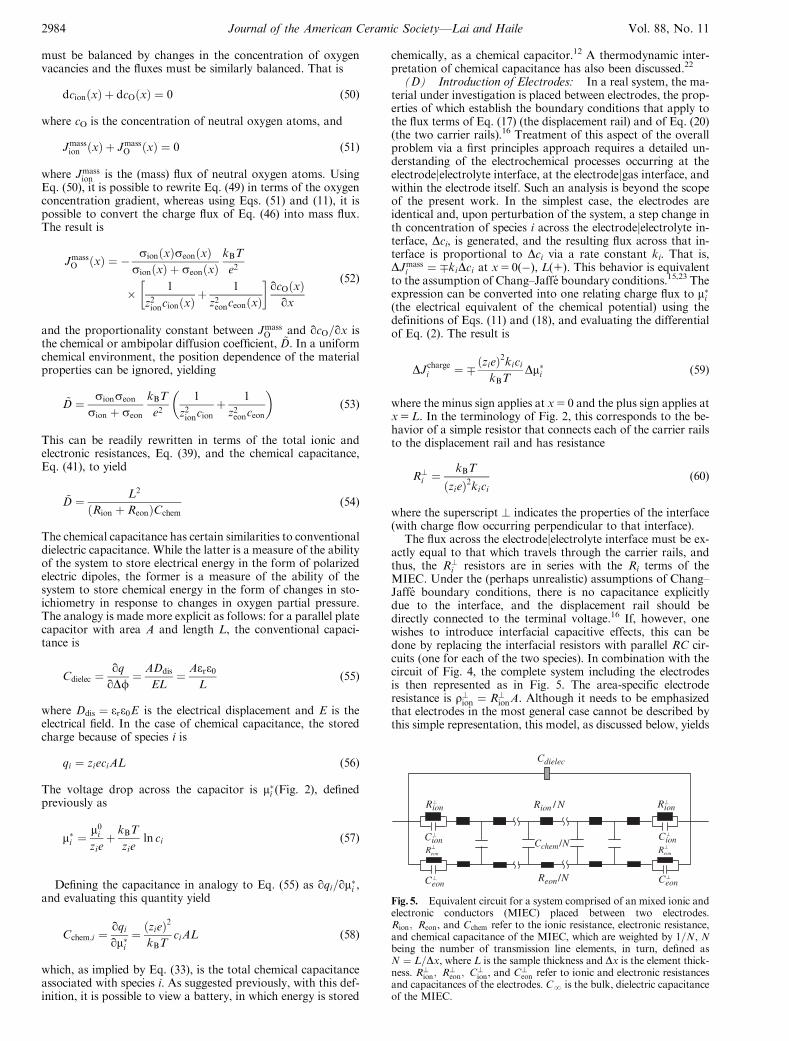
The flux across the electrodejelectrolyte interface must be ex-actly equal to that which travels through the carrier rails, andthus, the R?i resistors are in series with the Ri terms of theMIEC. Under the (perhaps unrealistic) assumptions of Chang–Jaffe boundary conditions, there is no capacitance explicitlydue to the interface, and the displacement rail should bedirectly connected to the terminal voltage.16 If, however, onewishes to introduce interfacial capacitive effects, this can bedone by replacing the interfacial resistors with parallel RC cir-cuits (one for each of the two species). In combination with thecircuit of Fig. 4, the complete system including the electrodesis then represented as in Fig. 5. The area-specific electroderesistance is r?ion ¼ R?ionA. Although it needs to be emphasizedthat electrodes in the most general case cannot be described bythis simple representation, this model, as discussed below, yields
Rion⊥
Cion⊥
eonR⊥
Cdielec
Rion / N
Cchem/N
Reon/N
Rion⊥
eonR⊥
Cion⊥
Ceon⊥Ceon
⊥
Fig. 5. Equivalent circuit for a system comprised of an mixed ionic andelectronic conductors (MIEC) placed between two electrodes.Rion; Reon, and Cchem refer to the ionic resistance, electronic resistance,and chemical capacitance of the MIEC, which are weighted by 1=N, Nbeing the number of transmission line elements, in turn, defined asN ¼ L=Dx, where L is the sample thickness and Dx is the element thick-ness. R?ion; R
?eon; C
?ion, and C?eon refer to ionic and electronic resistances
and capacitances of the electrodes. CN is the bulk, dielectric capacitanceof the MIEC.
2984 Journal of the American Ceramic Society—Lai and Haile Vol. 88, No. 11
an impedance that fits the experimental data obtained from thePtjceriajPt system exceptionally well. Finally, it must be notedthat Maya et al.14 have attempted a similar analysis, in which theflux equations for a system with multiple charged carriers aremapped to an equivalent circuit representation. The formalismused in that work does not lend itself to a straightforward com-parison with the work of Jamnik and Maier, although it doesappear that the two sets of results differ, possibly because of thedifferent boundary conditions used.
(E) Impedance Evaluation: The analytical expression forthe impedance of the circuit of Fig. 5 has been given by Jamnikand Maier,13 and is derived here in Appendix A. As in thatwork, for the remainder of the discussion, the impact of the bulkdielectric capacitance, Cdielec, on the impedance response is omit-ted for clarity. This element simply adds impedance 1=joCdielec,where o is the frequency and j is
ffiffiffiffiffiffiffi�1p
, to the total impedance ofthe system. Because Cdielec is typically small, it affects the im-pedance spectrum only at high frequencies, in most cases beyondthe high-frequency measurement limit. The result (correctedwith respect to a typographical omission of the termZ0 � Z1ð Þ in Eq. (7) of Jamnik and Maier13) is
ZðoÞ ¼Z1 þ Z0 � Z1ð Þ
�tanh
ffiffiffiffiffiffiffijoL2
4 ~D
qþ RionþReon
2 Z?ionþZ?eonð Þtanh
ffiffiffiffiffiffiffijoL2
4 ~D
qffiffiffiffiffiffiffijoL2
4 ~D
qþ RionþReon
2 Z?ionþZ?eonð Þtanh
ffiffiffiffiffiffiffijoL2
4 ~D
q (61)
1
Z0¼ 1
Rion þ 2Z?ionþ 1
Reon þ 2Z?eon(62)
Z1 ¼RionReon
Rion þ Reonþ 2
Z?ionZ?eon
Z?ion þ Z?eon(63)
Z?ion ¼R?ion
1þ joR?ionC?ion
(64)
Z?eon ¼R?eon
1þ joR?eonC?eon(65)
Jamnik andMaier13 have shown that this impedance adequatelyreproduces the exact impedance of an electrodejMIECjelectrodesystem with Chang–Jaffe boundary conditions,15 as long as thesample thickness, L, is significantly longer than the Debye
length LD ¼ffiffiffiffiffiffiffiffiffiffiffiffiffiffiffiffiffiffiffiffiffiffiffiffiffiffiffiffiffiffiffiffiffiffiffiffiffiffiffiffiffiffiere0kBT=
Pi ðzieÞ
2ci
q, of the MIECjelectrode in-
terface. Specifically, the error is typically less than a fraction of apercent for L >� 104LD. At small distances, space charge ef-fects become significant, violating the approximation of localelectroneutrality, and thus the displacement rail can no longerbe disconnected from the carrier rails.
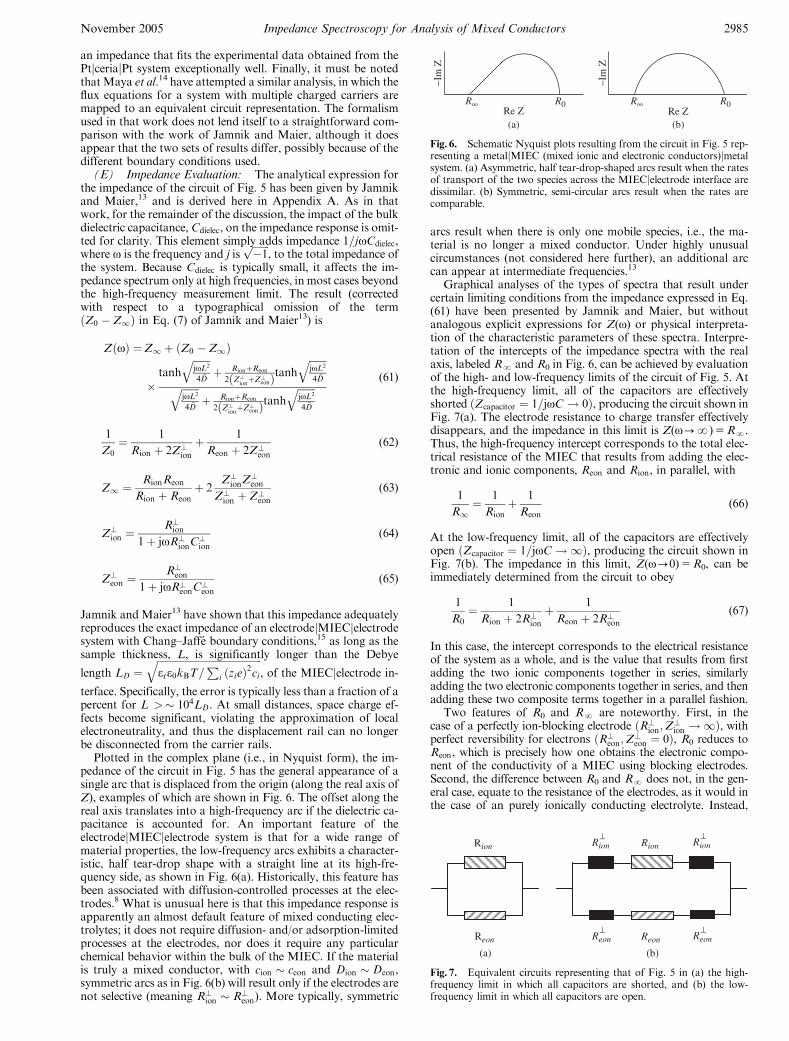
Plotted in the complex plane (i.e., in Nyquist form), the im-pedance of the circuit in Fig. 5 has the general appearance of asingle arc that is displaced from the origin (along the real axis ofZ), examples of which are shown in Fig. 6. The offset along thereal axis translates into a high-frequency arc if the dielectric ca-pacitance is accounted for. An important feature of theelectrodejMIECjelectrode system is that for a wide range ofmaterial properties, the low-frequency arcs exhibits a character-istic, half tear-drop shape with a straight line at its high-fre-quency side, as shown in Fig. 6(a). Historically, this feature hasbeen associated with diffusion-controlled processes at the elec-trodes.8 What is unusual here is that this impedance response isapparently an almost default feature of mixed conducting elec-trolytes; it does not require diffusion- and/or adsorption-limitedprocesses at the electrodes, nor does it require any particularchemical behavior within the bulk of the MIEC. If the materialis truly a mixed conductor, with cion � ceon and Dion � Deon,symmetric arcs as in Fig. 6(b) will result only if the electrodes arenot selective (meaning R?ion � R?eon). More typically, symmetric
arcs result when there is only one mobile species, i.e., the ma-terial is no longer a mixed conductor. Under highly unusualcircumstances (not considered here further), an additional arccan appear at intermediate frequencies.13
Graphical analyses of the types of spectra that result undercertain limiting conditions from the impedance expressed in Eq.(61) have been presented by Jamnik and Maier, but withoutanalogous explicit expressions for Z(o) or physical interpreta-tion of the characteristic parameters of these spectra. Interpre-tation of the intercepts of the impedance spectra with the realaxis, labeled RN and R0 in Fig. 6, can be achieved by evaluationof the high- and low-frequency limits of the circuit of Fig. 5. Atthe high-frequency limit, all of the capacitors are effectivelyshorted ðZcapacitor ¼ 1=joC ! 0Þ, producing the circuit shown inFig. 7(a). The electrode resistance to charge transfer effectivelydisappears, and the impedance in this limit is Z(o-N)5RN.Thus, the high-frequency intercept corresponds to the total elec-trical resistance of the MIEC that results from adding the elec-tronic and ionic components, Reon and Rion, in parallel, with
1
R1¼ 1
Rionþ 1
Reon(66)
At the low-frequency limit, all of the capacitors are effectivelyopen ðZcapacitor ¼ 1=joC !1Þ, producing the circuit shown inFig. 7(b). The impedance in this limit, Z(o-0)5R0, can beimmediately determined from the circuit to obey
1
R0¼ 1
Rion þ 2R?ionþ 1
Reon þ 2R?eon(67)
In this case, the intercept corresponds to the electrical resistanceof the system as a whole, and is the value that results from firstadding the two ionic components together in series, similarlyadding the two electronic components together in series, and thenadding these two composite terms together in a parallel fashion.
Two features of R0 and RN are noteworthy. First, in thecase of a perfectly ion-blocking electrode ðR?ion;Z?ion !1Þ, withperfect reversibility for electrons ðR?eon;Z?eon ¼ 0Þ, R0 reduces toReon, which is precisely how one obtains the electronic compo-nent of the conductivity of a MIEC using blocking electrodes.Second, the difference between R0 and RN does not, in the gen-eral case, equate to the resistance of the electrodes, as it would inthe case of an purely ionically conducting electrolyte. Instead,
Re Z Re Z
−Im
Z
R∞ R0 R∞ R0
(a)
−Im
Z
(b)
Fig. 6. Schematic Nyquist plots resulting from the circuit in Fig. 5 rep-resenting a metaljMIEC (mixed ionic and electronic conductors)jmetalsystem. (a) Asymmetric, half tear-drop-shaped arcs result when the ratesof transport of the two species across the MIECjelectrode interface aredissimilar. (b) Symmetric, semi-circular arcs result when the rates arecomparable.
Rion
Reon
(a)
Rion Rion⊥
Rion⊥
Reon Reon⊥
Reon⊥
(b)
Fig. 7. Equivalent circuits representing that of Fig. 5 in (a) the high-frequency limit in which all capacitors are shorted, and (b) the low-frequency limit in which all capacitors are open.
November 2005 Impedance Spectroscopy for Analysis of Mixed Conductors 2985

because R0 depends on all four resistance terms of the system,further analysis, as described below, must be performed in orderto extract the electrode resistance from the impedance data.
With this background, it is possible to consider the specific sit-uation for ceria placed between two metal electrodes. If the elec-trodes are perfectly reversible to electrons and partially blockingto oxygen ions, then R?eon ¼ 0, whereas R?ion and C?ion have finitevalues. Under these conditions, the equivalent circuit of Fig. 5 isreduced to that given in Fig. 8, and its impedance reduces to
ZðoÞ ¼R1 þ Z0 � R1ð Þ
�tanh
ffiffiffiffiffiffiffijoL2
4 ~D
qþ RionþReon
2Z?ion
tanhffiffiffiffiffiffiffijoL2
4 ~D
qffiffiffiffiffiffiffijoL2
4 ~D
qþ RionþReon
2Z?ion
tanhffiffiffiffiffiffiffijoL2
4 ~D
q (68)
where
R1 ¼RionReon
Rion þ Reon(69)
and Z0 reduces to
1
Z0¼ 1
Rion þ 2Z?ionþ 1
Reon(70)
The low-frequency intercept similarly reduces to
1
R0¼ 1
Rion þ 2R?ionþ 1
Reon(71)
While Eq. (68) has been used here for the analysis of themetaljceriajmetal system, it is noteworthy that under certain con-ditions, further simplifications occur. If Cchem is substantially larg-er than C?ion, then, C
?ion, can be ignored in the overall equivalent
circuit ðZ?ion ! R?ionÞ and the impedance becomes
ZðoÞ ¼R1 þ R0 � R1ð Þ
�tanh
ffiffiffiffiffiffiffijoL2
4 ~D
qþ RionþReon
2R?ion
tanhffiffiffiffiffiffiffijoL2
4 ~D
qffiffiffiffiffiffiffijoL2
4 ~D
qþ RionþReon
2R?ion
tanhffiffiffiffiffiffiffijoL2
4 ~D
q (72)
whereRN andR0 are as given in Eqs. (69) and (71). If, in addition,the resistance of the electrodes to ion transfer is high (i.e., ionblocking) such that 2R?ion � Rion þ Reon, Eq. (72) is still furtherreduced to
ZðoÞ ¼ R1 þ R0 � R1ð Þtanh
ffiffiffiffiffiffiffijoL2
4 ~D
qffiffiffiffiffiffiffijoL2
4 ~D
q (73)
where RN is unchanged and R0 is equal to Reon. The second termof this result has the same mathematical form as the well-knownfinite-length Warburg impedance.24
The equivalent circuit of Fig. 5 applies to a system in which asingle step dominates the entire electrochemical reduction/oxida-tion reaction. In many cases, however, multiple sequential steps
with differing time constants contribute to the overall process.Ideally, the impedance spectra yield detailed information regard-ing each of these reaction steps. In the present system, however,because Cchem � C?ion, the parallel resistor and capacitor of theelectrode impedance to ion transfer can readily be approximatedas a simple resistor (that is, C?ion � 0). Thus, the possible presenceof additional parallel RC subcircuits that are in series with oneanother cannot be observed; each RC subcircuit reduces to a re-sistor, and simple resistors in series cannot be individually meas-ured. Electrode processes at the interface with an MIEC are thusinherently masked by the material’s large chemical capacitance.This behavior is quite distinct from that of pure ionic conductors,in which multiple electrode arcs are routinely observed, and theirpresence is used to probe complex reaction pathways.25
From the impedance analysis of an MIEC with electron-re-versible electrodes, one can, according to Eq. (68), determine fiveindependent material parameters: the bulk ionic and electronicresistances (Rion and Reon), the interfacial capacitance C?ion andresistance R?ion of the electrodes to ion transfer, and the chemicaldiffusion coefficient ~D. With these data in hand, one can thenmake use of Eq. (54) to determine the value of the chemical ca-pacitance, Cchem. If, in addition, the concentration of the majoritycarriers (cion) is given from the material stoichiometry (i.e., extrin-sic dopant concentration), one can use the definition of the chem-ical capacitance, Eq. (41), to evaluate the concentration ofminority carriers (ceon). With both the resistances and concentra-tions of the mobile species known, one can then even establish themobilities. In this manner, it is possible to characterize completelythe electrical properties of MIECs simply from the measurementof AC impedance spectra.
In practice, directly fitting the impedance data to Eq. (68) isdifficult. The two resistance terms, RN and R0, which capture theessential features of the impedance spectrum are, as, respectively,defined in Eqs. (69) and (71), composite terms of the material pa-rameters. As a consequence, the material parameters derived arehighly correlated, and the refinement can easily fall into false localminima. A strategy for addressing this limitation is outlined belowas part of the experimental procedure implemented in the presentstudy. The key to the success of this strategy is the measurement ofthe impedance response over a broad range of oxygen partialpressures.
(F) Influence of Grain Boundaries: A complete descriptionof the impedance response of ceria requires, in principle, a modelfor the transport of ions and electrons through the grain bound-ary regions. For samples with typical, micron-scale grains placedunder moderately oxidizing conditions (where acceptor-dopedceria is a pure ionic conductor), it has been observed that thegrain boundaries, because they are depleted of oxygen vacancies,serve as barriers to ion transport. In the case of 10% Y-dopedceria, for example, the grain boundary activation energy is 1.02eV as compared with 0.97 eV for the bulk.26 Enhanced grainboundary resistance becomes more severe if samples are proc-essed at high temperatures at which impurity segregation tograin boundaries can occur.27 Accordingly, the impedance spec-trum in the high-frequency regime exhibits two arcs: one deriv-ing from the bulk (grain interior or lattice) properties, and onefrom the (serial or perpendicular) grain boundaries. The deple-tion of oxygen vacancies at grain boundaries is accompanied byan enhancement in the free electron carrier concentration and, inthe case of ceria with nanometer-scale grains, the space chargeregion of enhanced electronic conductivities deriving from grainboundaries on opposing sides of the grains can overlap. As aconsequence, the entire material can show enhanced conductiv-ity because of electron transport, even though the environmentalconditions would normally render the material a pure ionic con-ductor. In such an event, only one arc is observed in the im-pedance spectrum. These effects have now been documented byseveral workers, and the origins have been understood to someextent.28,29 A theoretical analysis of the impact of ion-blockinggrain boundaries on the impedance of MIECs has recently beenpresented by Jamnik,30 and a first set of experimental studies hasbeen carried out by Jasinski et al.27
Cchem/N
Rion/N
Reon/N
Rion⊥
ionC ⊥ionC ⊥
Rion⊥
Fig. 8. Equivalent circuit for the metaljceriajmetal system assumingmetal electrodes that are ideally reversible for electrons ðR?eon;Z?eon ¼ 0Þ.The analytical expression for the impedance of this circuit is given in Eq.(68).
2986 Journal of the American Ceramic Society—Lai and Haile Vol. 88, No. 11

In the present study, grain boundary effects are not treatedfor the primary reason that they are not observed in the exper-imental data. This is because sample processing has been carriedout by conventional routes that do not lead to nanostructuredgrains and at moderate sintering temperatures such that dopant(and impurity) segregation is minimized. Thus, anomalous con-ductivity enhancement does not occur and grain boundaries aremore resistive than the grain interiors but not dramatically so.Furthermore, because of the higher activation energy associatedwith ion transport across grain boundaries than through grains,the resistance because of grain boundaries falls more rapidly asthe temperature is increased than that because of the bulk.27
Consequently, at the moderately high temperatures of thepresent studies, the grain boundary contribution to RN can besafely ignored. At lower temperatures (or somewhat smallergrain sizes), approximating Rbulk by RN is no longer justifiedand a clear grain boundary arc becomes visible in the data.Treatment of this much more complex situation is beyond thescope of the present work, and, as already stated, not relevant tothe experimental conditions used.
(G) Alternative Approaches: The Finite-Length Warburgand Gerischer Elements: It is widely recognized that a diffu-sion-limited process can lead to an impedance response in theNyquist representation that appears as a straight line with a 451slope at the high-frequency side and a semi-circular arc at itslow-frequency side, that is, has a half tear-drop shape. Severalauthors have derived an impedance of a general functionalform24for specific situations
ZW ðoÞ ¼ ZW ð0Þtanh
ffiffiffiffiffijLpffiffiffiffiffijLp (74)
where L is a dimensionless quantity proportional to o, to de-scribe this observed response.
A typical derivation of this finite-length Warburg type of re-sponse applies to a supporting electrolyte placed between kinet-ically reversible electrodes,24 a case more often encountered inliquid rather than solid electrolytes, but nevertheless illustrative.The physical situation is as follows; the electrodes are perfectlyreversible to the transport of one type of charge carrier and en-tirely blocking to all others. Within the electrolyte, the mobilityand concentration of the blocked species approach infinity(hence the electrolyte is supported), whereas the conductivityof the non-blocked species is finite, and is typically the quantityto be determined from the impedance measurement. For a liquidelectrolyte, both blocked (i.e., supporting) and non-blocked spe-cies are typically ions, whereas for solids electronic carriers(electrons or holes) may constitute one of even both of the spe-cies. In such a supported electrolyte (or mixed conductor), theinternal electric field gradient is zero as a consequence of therapid response of the supporting species. Thus, the diffusion–drift equation reduces to Fick’s first law; the continuity equa-tion, again in the absence of sources or sinks, to Fick’s secondlaw; and the displacive flux (Eq. (17)) because of Poisson’s equa-tion becomes zero. The diffusion coefficient here is the self-dif-fusion coefficient of the species of interest (Di) as this propertyapproximates the chemical diffusion coefficient ð ~DÞ when themobility and concentration of the partner species are very large(Eq. (53)). One can then solve for the time-dependent charge fluxand apply the boundary conditions implied by the blocking/non-blocking behavior of the electrodes to obtain the result24
ZðoÞA ¼ 2kBT
z2ione2cionðjoDionÞ0:5
tanh½ðjo=DionÞ0:5ðL=2Þ� (75)
From the perspective of the equivalent circuit presented inFig. 5, a similar result can be readily obtained. Taking thebulk electronic resistance to be zero ðReon ! 0Þ [that is, theelectrons are the supporting species], the resistance to electrontransfer across the electrodejMIEC interface to be infinityðZeon !1Þ, and the resistance to ion transfer across the inter-
face to be zero ðZion ! 0Þ, the circuit reduces to that shown inFig. 9. Inserting these limiting values into Eq. (61) yields theimpedance
ZðoÞ ¼ Rion
tanh
ffiffiffiffiffiffiffiffiffiffiffiffiffiffiffiffiffiffiffijoL2=4 ~D
qffiffiffiffiffiffiffiffiffiffiffiffiffiffiffiffiffiffiffijoL2=4 ~D
q (76)
which is identical in form to Eq. (75). The exact equivalencebetween Eqs. (75) and (76) can be established by convertingfrom Rion to sion and making use of the Nernst–Einstein rela-tion, Eq. (5).
Explicit assignment of impedance values to the electrodeprocesses provides a means of revealing boundary conditionsthat are implicitly applied at the samplejelectrode interfaces. Forexample, in their treatment of a supported electrolyte, France-schetti et al.24 state that the voltage V across the system can bedescribed by Nernst’s equation:
DV ¼ kBT
zieD ln ci (77)
implying that there are no additional voltage drops because ofthe properties of the interface or of the electrodes. According tothe Jamnik–Maier model, this is to say that the electrodes areperfectly reversible to the non-blocked species, and perfectlyblocking to the supporting species.
In another example, Bisquert31 has treated the problem ofelectron diffusion in a semiconductor, where holes are the sup-porting species. The physical situation is asymmetric, unlike thecases considered above, and the two boundaries of the semi-conductor are treated separately. At one boundary, the flux istaken to be given by Fick’s first law (as applied to electrons).Such a statement, in fact, implies that the electrode at thisboundary is ideally reversible to electrons and apparently im-plies that the boundary is also ideally blocking to holes. Theopposite boundary is taken either to be (i) absorbing of theelectrons, such that they traverse the boundary unimpeded, or(ii) reflecting of the electrons, such that they cannot traverse it.These boundary conditions immediately correspond to (i) elec-trodes that are kinetically reversible to electrons, and (ii) elec-trodes that are ideally blocking to electrons. Also, it isapparently implied that the electrodes at this boundary are ide-ally reversible to holes (for both reflecting and absorbing bound-ary conditions). The final result for the absorbing boundarycondition is a finite-length Warburg impedance of a generalform as given in Eq. (74). For the reflecting boundary condition,the impedance has the general form
ZW ðoÞ ¼ ZW ð0Þcoth
ffiffiffiffiffijLpffiffiffiffiffijLp (78)
Again, each of these results can be directly obtained from theJamnik–Maier formalism simply by applying the appropriatevalues to the electrode properties.
It is to be noted that, as indicated by Eq. (75), the tear-drop-shaped impedance arc that results from a supported mixed con-ductor is not displaced from the origin because the high mobility
Rion/N
Cion/N
Fig. 9. Equivalent circuit of an ideally supported mixed conductor(Reon ! 0 placed between identical, ideally selective electrodes(Z?ion ! 0 and Z?eon !1).
November 2005 Impedance Spectroscopy for Analysis of Mixed Conductors 2987

of the electrons precludes any high-frequency capacitive effects.Furthermore, the low-frequency intercept directly yields thebulk resistance to ion transport. Overall, the impedance datacontain no information regarding the behavior of the electrodesas these were, a priori, taken to be ideally reversible with respectto ions and ideally blocking with respect to electrons.
An example of a case where the electrolyte is not fully sup-ported, that is, the conductivity of the partner species is not in-finite, has already been treated here via the Jamnik–Maierapproach in the discussion surrounding the specific case of ceriaplaced between two metal electrodes. An identical result can beobtained using an analytical method analogous to that describedabove for the treatment of a supported electrolyte. In this case,however, the internal field is not zero. Consequently, the drift–diffusion and continuity equations must be used in full(although, again, sources and sinks are taken to be absent inwriting down the latter) and must be applied to both species.The equations cannot be approximated by Fick’s laws. In ad-dition, one must also take into account the displacement fluxresulting from Poisson’s equation. One then again solves for thetime-dependent flux using the relevant boundary conditions:electrodes that are ideally blocking to one of the species andideally reversible to the other. Franceschetti et al.24 have appliedthis approach to the specific case in which the magnitude of thecharge of the two species is the same and obtained the result
ZðoÞA ¼ kBTL
z22e2c2ðD1 þD2Þ
þ 4t21kBT
z22e2c2ðjo ~DÞ0:5
tanh½ðjo= ~DÞ0:5ðL=2Þ�(79)
where species 1 is that which is blocked at the electrodes (species 2is unimpeded) and ti is the transference number, defined asti ¼ si=
Psi. The situation directly corresponds to that de-
scribed by Eq. (73), with the exception that the vacancies andelectrons in ceria have differing magnitudes of charge. Using theJamnik–Maier formalism, it is straightforward to obtain the re-sult for the more general case, and, again, there is a quantitativecorrespondence between the approaches. Specifically, the equiv-alence of the first terms in Eqs. (73) and (79) can be established byagain converting from Ri to si, making use of the Nernst–Ein-stein relation, Eq. (5), and now also taking into the account theassumption of local electroneutrality. That is, z1c15 z2c2, which,for a material where z15 z2, also implies c15 c2. Establishing theequivalence of the second terms in Eqs. (73) and (79) requires, inaddition to these steps, use of the definition of the chemical dif-fusion coefficient, as given in Eq. (53). It is to be emphasized that,once again, no information is available about the electrode prop-erties from the impedance spectrum of this type of system as theelectrodes are a priori assumed to behave ideally.
Of course, there is much to be learned about electrodes fromAC impedance spectroscopy, and the above statements regardingsystems with ideal electrodes are not meant to imply otherwise. Amixed conducting electrode can be treated straightforwardly byapplying asymmetric boundary conditions, in analogy to the sit-uation described by Bisquert31 for semiconductor materials. Aspecific example of interest to the solid-state ionics community,that of (La,Sr)CoO3�d on YSZ, has been explicitly treated byJamnik and Maier12 and used to explain the observed experi-mental results.
Up to this point in the discussion, the possibility of internalreactions that either generate or consume mobile species has notbeen considered. That is, the continuity equation, Eq. (8), hasbeen written down without regard to potential sources or sinks.In principle, it is possible to account for such effects by adding aterm with the form kriDci to the continuity equation, where kri is afirst-order rate constant for an irreversible reaction. Bisquert31
has pursued this approach to describe electron–hole pair annihi-lation in a semiconductor material, under the implicit assumptionof a supported ‘‘electrolyte’’ in which there is no internal field. Ofgreater relevance to the solid-state ionics community is the treat-
ment of Boukamp7 of heavily Tb-doped YSZ, a mixed conduc-tor. Here again, the material is implicitly assumed to be entirelysupported (that is, the internal field is zero and the migrationterm in the diffusion–drift equation is neglected) and an addi-tional source term of the form kriDci is added to Fick’s secondlaw, yielding the relevant continuity equation. As in the case ofthe supported electrolyte without sources or sinks, one can thensolve for the time-dependent charge flux and apply the relevantboundary conditions. Both Bisquert31 and Boukamp and Bouw-messter7 show that from an equivalent circuit perspective, thesource/sink introduces resistors in parallel with each of the chem-ical capacitors of Fig. 2. The resulting impedance (correcting by afactor of two from that derived by Boukampz) is
ZðoÞA ¼ 2kBT
z2ione2cion
tanh ðL=2Þffiffiffiffiffiffiffiffiffiffiffiffiffiffiffiffiffiffiffiffiffiffiffiffiffiffiffiffiffiffiffiffiffiðjoþ krionÞ=Dion
p� ffiffiffiffiffiffiffiffiffiffiffiffiffiffiffiffiffiffiffiffiffiffiffiffiffiffiffiffiffiffiðjoþ krionÞDion
p (80)
(for an ideal solution in which Eq. (2) applies). This impedanceclearly reduces to that given in Eq. (75) if krion ! 0. In addition,for Dion � L2krion, Eq. (80) reduces to a form in which the im-pedance is proportional to (k1jw)�0.5. This type of impedance(e.g., Z(o)B(k1jw)�0.5) is often termed the Gerischer imped-ance, after the author who first derived it in 1951.11 While theresult as given by Boukamp applies when the reaction occurswithin the bulk of the MIEC,6,7 such behavior also results whenthe electrode reactions are ‘‘co-limited’’ by diffusion and reac-tion.8
In the present study, the possibility that some internal reactionmight modify the continuity equation has not been explicitly ex-amined. Boukamp has suggested that in Tb-YSZ, the source termmight correspond to the release of oxygen vacancies otherwisetrapped at dopant sites.6,7 Defect trapping in ceria occurs at tem-peratures lower than those at which the material has been studiedhere.18 Furthermore, and perhaps more significantly, it is difficultto imagine an internal process in an ionic material that generatesor consumes mobile species at a constant rate. Such a concerndoes not arise for semiconductors in which electron–hole pairannihilation/generation can be balanced by the input or removalof energy from the system. Finally, it is noteworthy that for thepresent material, treatment of internal reactions by modificationof the continuity equation requires that this be done while re-taining the effect of an internal electrical field. In principle, sucha treatment (which has not yet appeared in the literature) ispossible, but is beyond the scope of the present study.
(2) Defect Chemistry and Electrical Properties ofDoped Ceria
While the defect behavior of mixed conductors has been de-scribed in several texts,32,33 the equations relevant to the specificsituation of ceria under mildly reducing conditions are brieflyreviewed here for completeness. The reduction reaction of ceria,involving the loss of oxygen and a change in the cerium oxida-tion state from 41 to 31, can be written as
O�O212O2 þ VO þ 2Ce0Ceð2e0Þ (81)
where the Kroger–Vink notation has been used, and VO�
andn5 [e0] are the concentrations of oxygen vacancies and electrons,respectively. The equilibrium constant, Kr, associated with thisreaction is
Kr ¼ VO�
n2p1=2O2
(82)
In the ionic regime of doped ceria, the concentration of elec-tronic charge carriers is negligible and the concentration of ox-ygen ion vacancies fixed by the acceptor dopant concentration
zBoukamp and Bouwmeester7 define the relevant voltage drop in Eq. (5) of as that atonly one of the electrode/electrolyte intefaces. In fact, the total voltage drop across bothinterfaces is the relevant quantity.
2988 Journal of the American Ceramic Society—Lai and Haile Vol. 88, No. 11

according to VO�
¼ 1=2 Sm0Ce½ �. Consequently, the total con-ductivity (essentially equal to the ionic conductivity) is independ-ent of oxygen partial pressure. Under slightly more reducingconditions, although the fixed concentration of oxygen vacanciesmay still be far greater than the concentration of mobile electrons,the concentration of the latter becomes significant enough toimpact the total conductivity. Combining the fixed vacancyconcentration with the equilibrium constant, Eq. (82), yields
n ¼ 2Kr
Sm0Ce½ �
� �1=2
p�1=4O2
(83)
from which one obtains the well-known �1/4 power law for thedependence of electronic conductivity on oxygen partial pressure.The total conductivity, sT (the sum of the ionic, sion, andelectronic, seon, conductivities), thus exhibits a oxygen partialpressure dependence given as
sT ¼ sion þ seon ¼ sion þ s0eonp
�1=4O2
(84)
where sion and s0eon are independent of oxygen partial pressure,
and they are, respectively, defined as
s0eon ¼ eueon
2Kr
Sm0Ce½ �
� �1=2
(85)
and
sion ¼ euion Sm0Ce½ � (86)
where uionand ueon denote ionic and electronic mobilities, respec-tively. From a plot of conductivity as a function of oxygen partialpressure, one can, by fitting to Eq. (84), determine the ionic andelectronic conductivities over the entire pO2
regime of interest,and such measurements are performed relatively routinely.34–36
Under the conditions of a fixed oxygen vacancy concentra-tion (as considered here), the temperature dependence of theionic conductivity derives from the temperature dependence ofthe ionic mobility :
uion ¼vion
Texp �DHion
kBT
� �(87)
where vion is a constant and DHion is the activation energy forion migration. Thus, an Arrhenius plot of the ionic conductivitydirectly yields DHion from its slope.
The electronic mobility exhibits a temperature dependenceanalogous to Eq. (87). However, because the concentration ofmobile electrons, Eq. (83), depends on temperature via the tem-perature dependence of Kr, the activation energy for electronmigration cannot be immediately evaluated. Specifically, Kr de-pends on temperature according to
Kr ¼ expDSr
kB
� �exp �DHr
kBT
� �(88)
where DSr and DHr are, respectively, the reduction entropy andenthalpy of reaction (81). Then, temperature dependence of s0
e is
s0eon ¼
weon
Texp �DHeon;o
kBT
� �
¼ weon
Texp �ðDHeon þ 1=2DHrÞ
kBT
� � (89)
where weon is a constant, and s0eon exhibits an apparent, or com-
bined, activation energy of DHeon;o ¼ DHeon þ 1=2DHr. It isthus not generally possible to determine independently themigration and reduction enthalpies (or, more broadly, the mobi-lity and concentration) of electronic defects from a measurementof MIEC conductivity even over wide temperature and oxygen
partial pressure ranges. It is shown below, however, that one canobtain the electronic defect concentration from a detailed anal-ysis of the impedance spectra obtained from the electrodejMIECsystem. That is, one can determine all the physically importantparameters of the sample under investigation directly fromimpedance spectroscopy, without resorting to, for example,Hall measurements to determine n or to thermogravimetry tomeasure Kr.
Another important property of an MIEC is the electrolyticdomain boundary (EDB), which demarcates the ionically andelectronically conducting regimes. From Eq. (84) the oxygenpartial pressure, p�O2
, at which the electronic conductivity equalsthe ionic conductivity is defined according to
sion ¼ s0eon p�O2
��1=4(90)
The smaller the p�O2, the wider the electrolytic (or ionic) domain,
and the more difficult it is for MIEC to be reduced. While theEDB implies a sharp distinction between ionic and electronicregimes, it is appropriate to consider the range of conditionsover which the transference number ðtspecies ¼ sspecies=stotalÞ ofthe minority carrier is 0.01 or greater as the mixed conductingregime.
III. Experimental Procedure
Commercial Sm0.15Ce0.85O1.925�d (SDC15) powders were pur-chased from NexTech Materials Ltd. The loose powders wereannealed at 9501C in air for 5 h in order to lower the surface areaand ensure the desired sintering behavior. Pellets were uniaxiallypressed at 300 MPa then sintered at 13501C for 5 h to obtain arelative density of over 95%. The sample used for measurementwas 0.78 mm thick with a diameter of 13 mm Pt ink (Engelhard6082) was applied to both sides of the pellets (so as to cover thefaces completely) and fired at 9001C for 2 h.
Two-probe AC impedance spectroscopy was performed usinga Solartron 1260 impedance analyzer with a voltage amplitudeof 10�40 mV and a frequency range spanning from 0.01 or0.001 Hz to 100 K or 1M Hz. The resistance of the Pt leads wasmeasured separately and subtracted from the raw sample dataprior to analysis. The impedance was measured at 5001, 5501,6001, and 6501C under atmospheres ranging from simulated airto 3%H2O saturated H2. Oxygen partial pressures from 10�6 to0.21 atm were obtained from mixtures of Ar and O2; lower ox-ygen partial pressures were achieved using mixtures of Ar, H2,and H2O, assuming a thermodynamic equilibrium between O2,H2, and H2O. The gas flow rates were fixed using mass flowcontrollers to a total flow rate of 100 sccm, which, for the di-mensions of the system utilized, implies a linear gas flow rate ofB0.74 cm/s. The whole system was allowed to stabilize undereach condition before the final measurement. The typical stab-ilization time was 1 h under high oxygen partial pressures and 8h under low oxygen partial pressures. In light of the small am-plitude of the applied voltage and the small sample size relativeto the overall flow rate and dimensions of the experimentalapparatus, the gas composition is safely assumed to be un-perturbed by the impedance measurement.
In order to address the challenges of directly fitting the im-pedance data collected under mixed conducting conditions so asto extract the five independent parameters, Rion; Reon; R
?ion;
C?ion, and Cchem, the analysis proceeded as follows: the ionic re-sistanceRion and the electrode properties,R?ion andC?ion, were firstobtained from the impedance spectra in the ionic region. Theelectrode behavior was evaluated by fitting the data using a con-stant phase element (CPE) with impedance ZCPE ¼ ðjoÞmY?½ ��1rather than a pure capacitor and then determining the capaci-tance2 according to C? ¼ ðY?Þ1=mðR?Þð1=m�1Þ. As discussedabove, Rion is independent of pO2
, and Cion can be, to a first ap-proximation, also taken to be independent of pO2
. Thus, the val-ues obtained for Rion, and C?ion under the ionic regime were used
November 2005 Impedance Spectroscopy for Analysis of Mixed Conductors 2989
as fixed parameters in the analysis of the spectra obtained undermixed conducting conditions. Those latter spectra were then fit-ted to Eq. (73) (i.e., simple finite-length Warburg behavior) toyield initial values for Reon; R
?ion and ~D, which were further re-
fined using a final fit to Eq. (68). It must be emphasized that sucha procedure works well for a material such as ceria in which boththe electrolytic and mixed conducting regimes are experimentallyaccessible. Alternative strategies may be required if only datafrom the mixed conducting regime are available.
IV. Results
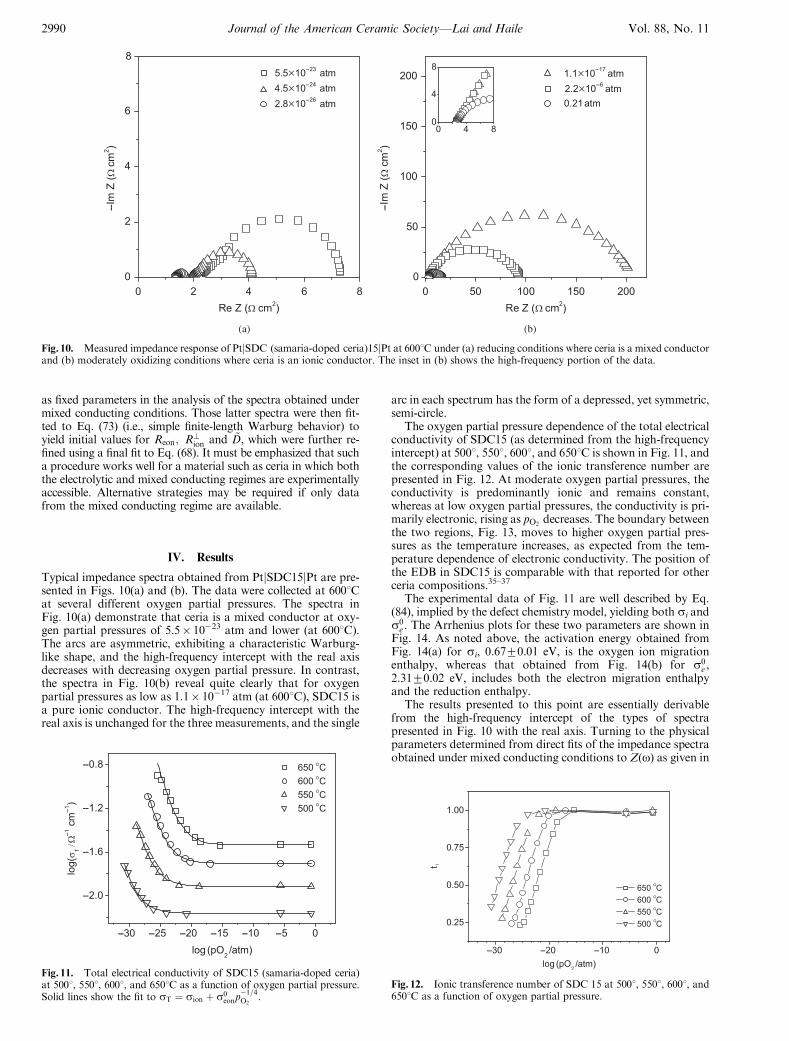
Typical impedance spectra obtained from PtjSDC15jPt are pre-sented in Figs. 10(a) and (b). The data were collected at 6001Cat several different oxygen partial pressures. The spectra inFig. 10(a) demonstrate that ceria is a mixed conductor at oxy-gen partial pressures of 5.5� 10�23 atm and lower (at 6001C).The arcs are asymmetric, exhibiting a characteristic Warburg-like shape, and the high-frequency intercept with the real axisdecreases with decreasing oxygen partial pressure. In contrast,the spectra in Fig. 10(b) reveal quite clearly that for oxygenpartial pressures as low as 1.1� 10�17 atm (at 6001C), SDC15 isa pure ionic conductor. The high-frequency intercept with thereal axis is unchanged for the three measurements, and the single
arc in each spectrum has the form of a depressed, yet symmetric,semi-circle.
The oxygen partial pressure dependence of the total electricalconductivity of SDC15 (as determined from the high-frequencyintercept) at 5001, 5501, 6001, and 6501C is shown in Fig. 11, andthe corresponding values of the ionic transference number arepresented in Fig. 12. At moderate oxygen partial pressures, theconductivity is predominantly ionic and remains constant,whereas at low oxygen partial pressures, the conductivity is pri-marily electronic, rising as pO2
decreases. The boundary betweenthe two regions, Fig. 13, moves to higher oxygen partial pres-sures as the temperature increases, as expected from the tem-perature dependence of electronic conductivity. The position ofthe EDB in SDC15 is comparable with that reported for otherceria compositions.35–37
The experimental data of Fig. 11 are well described by Eq.(84), implied by the defect chemistry model, yielding both si ands0e . The Arrhenius plots for these two parameters are shown in
Fig. 14. As noted above, the activation energy obtained fromFig. 14(a) for si, 0.6770.01 eV, is the oxygen ion migrationenthalpy, whereas that obtained from Fig. 14(b) for s0
e ,2.3170.02 eV, includes both the electron migration enthalpyand the reduction enthalpy.
The results presented to this point are essentially derivablefrom the high-frequency intercept of the types of spectrapresented in Fig. 10 with the real axis. Turning to the physicalparameters determined from direct fits of the impedance spectraobtained under mixed conducting conditions to Z(o) as given in
(a) (b)
Fig. 10. Measured impedance response of PtjSDC (samaria-doped ceria)15jPt at 6001C under (a) reducing conditions where ceria is a mixed conductorand (b) moderately oxidizing conditions where ceria is an ionic conductor. The inset in (b) shows the high-frequency portion of the data.
Fig. 12. Ionic transference number of SDC 15 at 5001, 5501, 6001, and6501C as a function of oxygen partial pressure.
Fig. 11. Total electrical conductivity of SDC15 (samaria-doped ceria)at 5001, 5501, 6001, and 6501C as a function of oxygen partial pressure.Solid lines show the fit to sT ¼ sion þ s0
eonp�1=4O2
.
2990 Journal of the American Ceramic Society—Lai and Haile Vol. 88, No. 11

Eq. (68), it is important to first establish whether or not the dataare well described by the Jamnik–Maier formalism. As evi-denced from Fig. 15, comparisons of the measured and fitteddata at 6001C and pO2
5 5.5� 10�23 atm, the fit to the Jamnik–Maier model is excellent. Fits to a simple Warburg expres-sion (Eq. (73)) were acceptable under some conditions where2R?ion � Rion þ Reon, but in most cases, the more generalimpedance expression given in given Eq. (68) (or Eq. (72)) wasrequired to model the data accurately.
The MIEC properties Cchem and ceon are shown in Figs. 16and 17, respectively, the former in comparison with C?ion. Asexpected from Eq. (41), the behavior of Cchem is dominated bythe concentration of electronic carriers. Furthermore, this pa-rameter is, under all the conditions examined, far greater thanC?ion, and C?ion as measured within the electrolytic regime is in-deed largely independent of pO2
. Because Cchem � C?ion, analysesperformed in which C?ion was omitted from the equivalent circuit(e.g., using Eq. (72)) had a negligible impact on the quality of thefits and the values derived for the other parameters. Thus, theassumption of a constant C?ion (independent of pO2
), even if inerror, would introduce negligible errors to the other terms.
Much as with Cchem, the electronic defect concentration ceonalso behaves as expected on the basis of the defect chemistrymodel. In particular, for the two lower temperature measure-ments, ceon obeys a clear�1/4 power law dependence on oxygenpartial pressure over the entire pO2
range examined. At highertemperatures, the electronic defect concentration begins to de-
viate from the expected pO2dependence as the oxygen partial
pressure is lowered. Under these conditions, the concentrationof oxygen vacancies generated by the reduction reaction, Eq.(81), becomes significant and the oxygen vacancy concentrationcan no longer be treated as constant. To ensure that the ap-proximation VO
� ¼ 1=2 Sm0Ce½ � is adequately obeyed, further
analysis is restricted to the region in which the electronic defectconcentration is less than one-fifth the (extrinsic) oxygen vacan-cy concentration. Taking this restriction into account and fittingceon to Eq. (83), one obtains the equilibrium constant, Kr, asa function of temperature, Fig. 18. From these data, the re-duction entropy DSr and enthalpy DHr are derived to be1.1870.05� 10�3 eV/K and 4.1870.05 eV, respectively.
Fig. 13. Electrolytic domain boundary (EDB) as a function of temper-ature. Data for SDC15 (samaria-doped ceria) are the results of thepresent study; the points at 7001 and 8001C are extrapolated values,presented to allow easy comparison with the literature data for GDC20(gadolinia-doped ceria)35,37 and SDC20.36
(a) (b)
Fig. 14. (a) Ionic conductivity, sion, and (b) oxygen partial pressure-independent term in the electronic conductivity, s0eon, of SDC15 (samaria-doped
ceria) as functions of temperature, plotted in an Arrenhius form.
(a)
(b)
Fig. 15. Comparisons of the measured and fit impedance obtainedfrom the PtjSDC (samaria-doped ceria)jPt system at 6001C and an ox-ygen partial pressure of 5.5� 10�23 atm. The fit is to Eq. (68) of the maintext. (a) Nyquist representation, and (b) Bode–Bode representation.
November 2005 Impedance Spectroscopy for Analysis of Mixed Conductors 2991

From the conductivities and charge carrier concentrations,Figs. 14 and 17, respectively, one can obtain both the ionic andelectronic mobilities, and these are presented in Fig. 19. To al-low comparison with the available literature data,18,34 the mob-ilities obtained in the present work have been extrapolated to7001C. The results clearly demonstrate that the mixed conduct-ing behavior of doped ceria results from the very high mobilityof electronic defects, which are present in much lower concen-trations than the ionic defects.
Turning to the electrode behavior, the area-specific resistivity(ASR) of the Pt electrode, rPt, on SDC15 at 6001C is presentedas a function of oxygen partial pressure in Fig. 20 in log–logform and compared with the behavior of SDC15 itself. Thedashed line gives the approximate demarcation of the ionic andmixed conducting regions. In the ionic (or electrolytic) region,the electrode ‘‘conductivity’’ (inverse of ASR) increases withincreasing oxygen partial pressure. In contrast, in the mixedconducting region, the electrode ‘‘conductivity’’ increases as theoxygen partial pressure is decreased. (At intermediate pressureswhere the electrode resistivity reached very large values, stablemeasurements could not be obtained.) The oxygen partial pres-
sure dependence of 1=rPt in the two regimes is summarized inFig. 21. Under the more oxidizing conditions of the ionic re-gime, the slope of log 1=rPt vs log pO2
changes, even changingsign, decreasing from 0.19 at 6501C to �0.11 at 5001C. In con-trast, under more reducing conditions, a �1/4 power law de-pendence is observed. Fitting the electrode ASR to 1=rPt ¼1=r0Ptp
�1=4O2
yields an associated activation energy for the elec-trode process of 2.6770.11 eV, Fig. 22. It is noteworthy thatSprague et al.38 similarly observed a p
�1=4O2
dependence for the Ptelectrode conductivity on mixed conducting (Gd0.98Ca0.02)2Ti2O7 in CO/CO2 atmospheres; however, a p
�1=6O2
dependencewas obtained from (Gd0.9Ca0.1)2 Ti2O7.
Overall, the quality of the fits of the data to the Jamnik–Ma-ier model presented here is significantly better than that reportedby Atkinson et al.17 in their study of PtjGd0:1 Ce0.9O1.95�dðGDC10ÞjPt. These workers investigated ceria under air andunder hydrogen, with the stated objective of evaluating the va-lidity of the Jamnik–Maier model. In addition, the sample thick-ness was varied so as to manipulate Cchem according to Eq. (41).The general observations of these authors are consistent withthe results presented here. Under the electrolytic regime, theelectrode arc of the PtjGDC10jPt system was found to be semi-circular in shape, whereas it exhibited a half tear-drop shapeunder reducing conditions. Furthermore, the electrode resistivityderived under reducing conditions reported by Atkinson is rea-sonably comparable with that measured here (B30 O cm2 vs
(a) (b)
Fig. 16. (a) Chemical capacitance Cchem, and (b) interfacial capacitance C?ion of SDC15 (samaria-doped ceria) as functions of oxygen partial pressure asdetermined from the measured impedance spectra with temperatures as indicated.
Fig. 17. Electron concentration in SDC15 (samaria-doped ceria) as afunction of oxygen partial pressure as determined from the measuredimpedance spectra with temperatures as indicated. Solid lines indicatefits of the data to ceon ¼ 2Kr= Sm
0Ce½ �ð Þ1=2p�1=4O2
. The upper dashed linecorresponds to the extrinsic vacancy concentration because of acceptordoping. The lower dashed line corresponds to an electron concentrationat which the approximation 2 VO
� ¼ Sm0Ce½ � � n is no longer valid.
Fig. 18. Equilibrium constant for the reduction of SDC15 (samaria-doped ceria) [Eq. (81)] as a function of temperature.
2992 Journal of the American Ceramic Society—Lai and Haile Vol. 88, No. 11

B84 O cm2 in the present study at TB5001C and a 10% H2
atmosphere). The poorer quality of the fit of their data to theJamnik–Maier model is (as pointed out by these authors) wasmost likely because of the fact that several materials parametersfor GDC10 were taken from the literature rather than beingadjusted to improve the fit, a procedure that would not havebeen justified given the limited dataset. Moreover, the measure-ments of Atkinson were performed at relatively low tempera-tures at which, as discussed above, complications because ofgrain boundary effects arise and the electrode resistance can be-come excessively large. While quantitative results could not beobtained because of these shortcomings, the qualitative featuresreported for PtjGDC10jPt are entirely in agreement with theobservations made here on the PtjSDC10jPt system. Finally, it isnoteworthy that Jasinski et al.27 similarly obtained asymmetriclow-frequency arcs from mixed conducting, undoped ceriaplaced between gold electrodes.
V. Discussion
(1) Properties of Ceria
The thermodynamic properties measured here for SDC15 byelectrochemical methods are in good agreement with those of
Fig. 19. Ionic and electronic mobilities as a function of temperatureplotted in an Arrhenius form. Closed symbols represent for ionic mo-bility, whereas open symbols represent electronic mobility. The points at7001C for SDC15 (samaria-doped ceria) represent extrapolated values,added to facilitate comparison with the literature data. Numbers insquare brackets indicate the source.
Fig. 20. Comparison of the electrolyte conductivity and inverse of theelectrode area-specific resistivity in PtjSDC (samaria-doped ceria)15jPtat 6001C as a function of oxygen partial pressure. Solid lines show thebest fits to equations given in the main text.
(a) (b)
Fig. 21. Area-specific electrode resistivity of PtjSDC (samaria-doped ceria)15jPt as a function of oxygen partial pressure and temperature in (a) thepure ionic region, and (b) the mixed conducting region. In (a) the solid lines represent linear regression fits to the data, with the slopes as indicated. In (b),the solid lines show the fits to 1=rPt ¼ 1=r0Ptp
�1=4O2
.
Fig. 22. Inverse of the oxygen partial pressure independent term in theelectrode-specific resistivity of the PtjSDC (samaria-doped ceria)15jPtsystem as a function of temperature. Data are plotted in an Arrheniusform.
November 2005 Impedance Spectroscopy for Analysis of Mixed Conductors 2993

related materials obtained by thermogravimetric methods. Inparticular, Kobayashi et al.39 measured DSr and DHr of bothSm0.1Ce0.9O2�d (SDC10) and Sm0.2Ce0.8O2�d (SDC20). The re-ported enthalpies are �4.15 and �3.99 eV for SDC10 andSDC20, respectively, and the entropies �1.10� 10�3 and�1.13� 10�3 eV/K, respectively. If one assumes a linear de-pendence of reduction enthalpy and entropy on the dopant level,then one interpolates values of 4.07 eV and 1.12� 10�3 eV/K,respectively, for the reduction enthalpy and entropy for SDC15,which are almost identical to the values of 4.18 eV and1.18� 10�3 eV/K, respectively, determined in this work. Giventhat the transport equations are derived under the assumptionthat the processes are not far from equilibrium, agreementbetween the methods is expected.
The mobilities determined here for both ions and electrons inSDC15 are also in good agreement with the literature values forrelated materials, Fig. 19, as are the corresponding activationenergies, Table I. Specifically, the ionic mobility for SDC15 falls,in the present study, between 10�5 and 10�4 cm2 (V s)�1, withan activation energy of 0.67 eV. The activation energy for elec-tron motion, 0.22 eV, is three times smaller than for ions, andthe absolute mobilities are approximately one order of magni-tude greater. The relatively low electronic mobility is consistentwith the usual interpretation that electron motion in ceria occursvia a small polaron-activated hopping process.40 Overall, thecorrespondence between the literature values of both the ther-modynamic and transport properties of SDC15 and the valuesmeasured here by AC impedance spectroscopy provides strongvalidation of the Jamnik–Maier model for the impedanceresponse of mixed conductors.
(2) Electrochemistry of the PtjCeria System
Two possible electrochemical reactions can be considered totake place on Pt under the experimental conditions used in thiswork. Under moderately oxidizing atmospheres (oxygen partialpressures of 10�6–1 atm), the oxidation/reduction of oxygen canbe described globally via the following reaction
12O2 þ 2e�2O2� (91)
Under more reducing conditions, achieved via introductionof hydrogen to the sample atmosphere, oxidation/reductioncould, in principle, also occur via reaction (91), and then befollowed by gas phase reaction between H2 and O2 to maintainan overall equilibrium between the three gaseous species (H2,O2, and H2O). However, the reaction directly involving all threespecies is more likely,
H2 þO2�2H2Oþ 2e� (92)
These two sets of conditions (moderate and reducing atmos-pheres) and corresponding electrochemical reactions ((91) and(92), respectively) are considered separately.
The kinetics and mechanistic pathways of reaction (91) havebeen studied extensively in the PtjYSZjPt system.8 There is gen-eral consensus that the overall reaction rate is limited by the rateof arrival of oxygen atoms to the reaction sites at the PtjYSZinterface. According to the model proposed byMizusaki et al.,41
at high temperatures and low oxygen partial pressures, the sur-face diffusion of absorbed oxygen atoms on Pt is the rate-lim-iting step and gives rise to a characteristic pO2
dependence of theelectrode resistance, obeying a p
�1=2O2
dependence at low oxygenpartial pressures and a p
1=2O2
dependence at high oxygen partialpressures. Thus, the electrode ‘‘conductivity’’ first increases andthen decreases, taking on a peak value at some intermediatepressure, p�O2
, which corresponds to the pressure at which the Ptcoverage by oxygen atoms is 1/2. The position of the peak istemperature dependent, moving to lower pO2
values as the tem-perature is decreased.41,42 At low temperatures, the surface dif-fusion of oxygen becomes exceedingly slow, and dissociativeadsorption of oxygen directly at the reaction sites become ratelimiting, resulting in an electrode resistance that is independentof pO2
. A transition between these two types of behavior is ev-ident at intermediate temperatures.41 A related model, as brieflynoted in the introduction, has been proposed by Robertson andMichaels10 and discussed further by Adler.8 In this case, bothsurface diffusion and dissociative adsorption simultaneouslycontrol the overall kinetics at all temperatures, and there is nosingle rate-limiting step for the behavior of the electrode. Anexplicit pO2
dependence for the electrode properties has not beenderived for this model.
Because SDC15 as measured here behaves as a pure ionicconductor at moderate oxygen partial pressures, it is likelythat the electrochemical reduction/oxidation of O2 in thePtjSDC15jPt system occurs by a mechanism similar to that ofthe PtjYSZjPt system. Although the limited dataset precludesdefinitive conclusions, the trend evident in Fig. 21(a), that of adecreasing slope with decreasing temperature, is consistent withthe model described above. The data imply that p�O2
is greaterthan 1 atm at 6501C and less than 10�6 atm at 5001C, not un-reasonable values in comparison with those reported for YSZ.43
In addition, the SDC system examined here is similar toYSZ42,44 in that both show only one electrode-related arc witha symmetric, semi-circular appearance in their respective imped-ance spectra, further supporting the conclusion that the mech-anisms must be similar. It is possible that upon treatment of theraw impedance data as described by Adler8 for porous Pt elec-trodes on single-crystal zirconia, an underlying finite-lengthWarburg or Gerischer type of response would be obtained, con-sistent with the proposal that diffusion/adsorption limits theelectrochemical reduction of oxygen. That the absolute magni-tude of the area-specific electrode resistance measured here, ap-proximately 5O cm2 at 6001C, is much lower than that reportedfor PtjYSZ,42,44 approximately 500 O cm2, is likely because ofdifferences in Pt microstructure that influence the diffusionlength and the density of the reaction sites.
Alternatively, one cannot rule out the possibility that thecharge transfer reaction, in which adsorbed oxygen atoms onthe Pt surface react with electrons and form oxygen ions on theelectrolyte surface, is the rate-limiting step. Such a mechanismwas proposed much earlier from the study of the polariza-tion phenomenon on Ptjceria, in particular, by Wang andNowick.45,46 In this case, a slope of �1/4 is expected at a lowoxygen partial pressure in a log–log plot of 1=r vs pO2
, whichgradually shifts to a value of 11/4 at a high oxygen partialpressure. As pointed out by Mizusaki et al.,41 the data presentedby Wang and Nowick have not been collected over a sufficientlywide oxygen partial pressure range to distinguish between slopes
Table I. Activation Energies for Ionic and Electronic Mobility, and for s0e
Substance DHi (eV) DHe (eV) DHe0 (eV)
Ce0:85Sm0.15O1.925�d (SDC15) 0.6770.01 0.2270.04 2.3170.02Ce0.8Sm0.2O1.9�d (SDC20)36 0.68w 2.30w
Ce0.8Sm0.2O1.9�d (SDC20)48 2.22Ce0.9Gd0.1O1.95�d (GDC10)18 0.64 0.25Ce0.8Gd0.2O1.9�d (GDC20)34 0.71 0.52
wFitted with given si and s0e in Godickemeier and Gauckler.36 SDC, Samaria-doped ceria; GDC, gadolinia-doped ceria.
2994 Journal of the American Ceramic Society—Lai and Haile Vol. 88, No. 11

of 71/2 from those of 71/4 and conclusively support thecharge transfer model. Thus, we propose that diffusion/dissoci-ative adsorptions of oxygen are the rate-limiting steps in thePtjSDC15jPt system under oxygen atmospheres, much as iswidely accepted for PtjYSZjPt.
In comparison with the behavior of O2 on Pt, the electro-chemistry of the H2–H2O system is quite complex because manymore active species can be involved in the electrochemical ox-idation/reduction steps. As a consequence, no real consensusas to the reaction pathway has emerged in the literature, evenfor PtjYSZjPt. While Mizusaki et al.,47 who observed only oneelectrode-related arc in their impedance spectra, have suggestedthat OH group transfer across the PtjYSZ is rate limiting, sev-eral other groups have argued that multiple, serial steps are nec-essary to describe the reaction on the basis of the observation ofmultiple (2–3) electrode-related responses by impedance spec-troscopy. In particular, a high-frequency arc has been attributedto the charge transfer step and a low-frequency arc to hydrogendissociative adsorption on the Pt surface.25 As noted above, it isnot possible to detect by impedance spectroscopy serial reactionsteps at the electrode–sample interface for a sample that isa mixed ionic and electronic conductor with a large value ofCchem. Thus, it is not possible to establish directly whetherPtjSDC15jPt exhibits a single or a multistep step mechanism.Nevertheless, from the pO2
-dependent behavior of rPt measuredhere, Fig. 21(b), we can immediately conclude that electro-ox-idation of hydrogen on Ptjceria occurs by a fundamentally dif-ferent mechanism than it does on Ptjzirconia. Indeed, in the caseof PtjYSZ, there is no reason to expect a direct dependence ofrPt on pO2
in the presence of H2. Instead, because adsorbed hy-drogen atoms and hydroxyl groups are presumed to participatein the reaction mechanism, dependencies on pH2
or pH2O aretypically probed (which only depend indirectly on pO2
via thegas-phase equilibrium).
The observation of a power law of p�1=4O2
here suggests that theelectrode reactions are correlated to the electronic conductivityof mixed conducting ceria, which exhibits precisely the samedependence on oxygen partial pressure. Furthermore, the acti-vation energy of 1=r0Pt, 2.6770.11 eV, is almost identical to thatmeasured for the electronic conductivity of SDC15, 2.3170.02eV. Based on these observations, we propose that the electro-chemical reaction 92 can occur via two parallel paths on oxygenion-conducting materials (Fig. 23). In the first path, dissociativehydrogen desorption occurs on the Pt surface, followed by mi-gration of protons to the Ptjoxide interface and subsequentelectrochemical reaction. In the second path, hydrogen desorpt-ion occurs directly on the oxide surface, which subsequently re-acts electrochemically with oxygen, yielding up electrons thatare then transported through the oxide to the Pt. Given the verylow electronic conductivity of zirconia, the second pathwayis not available for this electrolyte and the reaction is taken tooccur via the first path, with the exact rate-limiting step yet to bedetermined. In the case of ceria, we propose that although thefirst path is probably fast, the second path is faster. That is, wepropose that the electrochemical reaction occurs directly on theceria surface (i.e., that ceria is electrochemically active), and that
the reaction is limited by the rate of removal of electrons fromthe reaction sites (i.e., electronic conductivity).
VI. Summary and Conclusions
A rigorous derivation of the AC impedance of mixed conductingmaterials has been presented. Using PtjSm0:15Ce0:85O1:925�djPtas a model system, it is demonstrated that the impedance datayield a broad range of electrical and electrochemical propertiesof the mixed conductors. In particular, the concentration of freeelectron carriers, the mobilities and activation energies for bothion and electron transport, the EDB, and the entropy and enth-alpy of electrochemical reduction have all been measured. Thevalues are in good agreement with what would be expectedbased on the reported properties of Sm- and Gd-doped ceriawith differing compositions. The results not only validate themodel originally proposed by Jamnik and Maier but also dem-onstrate and exploit its full capabilities.
The oxygen reduction reaction on PtjSm0:15Ce0:85O1:925�d hasnot been extensively studied here, but the data nevertheless sug-gest that a mechanism similar to that on PtjYSZ is operative.Specifically, the data are consistent with a model in which ox-ygen surface diffusion to reaction sites is rate limiting. The hy-drogen oxidation reaction, in contrast, occurs by a mechanismquite distinct from that on YSZ. Here, the electrode ‘‘conduc-tivity’’ is found to obey a�1/4 power law dependence on oxygenpartial pressure, 1=rPt ¼ 1=r0Ptp
�1=4O2
, with an activation energyfor 1=r0Pt that is almost identical to that measured for the elec-tronic conductivity. Accordingly, it is postulated that ceria iselectrochemically active for hydrogen oxidation, with the reac-tion occurring directly on the ceria surface and limited by therate of removal of electrons from the reaction sites.
The geometric features of the impedance spectra measuredhere for SDC15 are in accord with the model put forth by Jam-nik and Maier. In the electrolytic regime, simple arcs are ob-tained in the complex plane, whereas under conditions whereceria behaves as a mixed conductor, the spectra are asymmetric,half tear-drop shaped. The large value of the chemical capaci-tance under mixed conducting conditions overwhelms the elec-trode capacitance and obscures any fine detail in the impedancespectra resulting from a possible multi-step process at the elec-trodes. This is precisely the oxygen partial pressure regime rel-evant for probing the hydrogen electro-oxidation process.Despite this limitation of the experimental data, the oxygen par-tial pressure dependence of the electrode resistance on oxygenpartial pressure provides strong evidence for the electrochemicalactivity of ceria.
Appendix
The impedance of the general electrodejMIECjelectrode systemrepresented in Fig. 5 (omitting the dielectric capacitance term,Cdielc) of the main text can be evaluated by first recasting thecircuit from one comprised of R and C to one comprised ofelements with arbitrary impedance in Fig. A1.
Here, ZA and ZB are the terminal impedances correspondingto the impedance of the electrodejMIEC to ion and electrontransfer, respectively. Z1 and Z2 are the unit impedances in rails1 and 2, respectively, whereas Z3 is the impedance between rails1 and 2. Va and Vb are the input and output voltages, respec-
O= conductor
Pt
H2 H2O
Pt
e−
e−
O=
H2
H2O
O=
path 1 path 2
Fig. 23. Schematic diagram showing the hydrogen electro-oxidationpathways (left) on PtjYSZ (yttria-stabilized zirconia) and (right)PtjSDC (samaria-doped ceria).
Z2
Z3
ZBZB
ZAZA
I2(x)VbVaI
I1(x)
V2(x)
Z1V1(x)
Fig. A1. Generalized circuit.
November 2005 Impedance Spectroscopy for Analysis of Mixed Conductors 2995
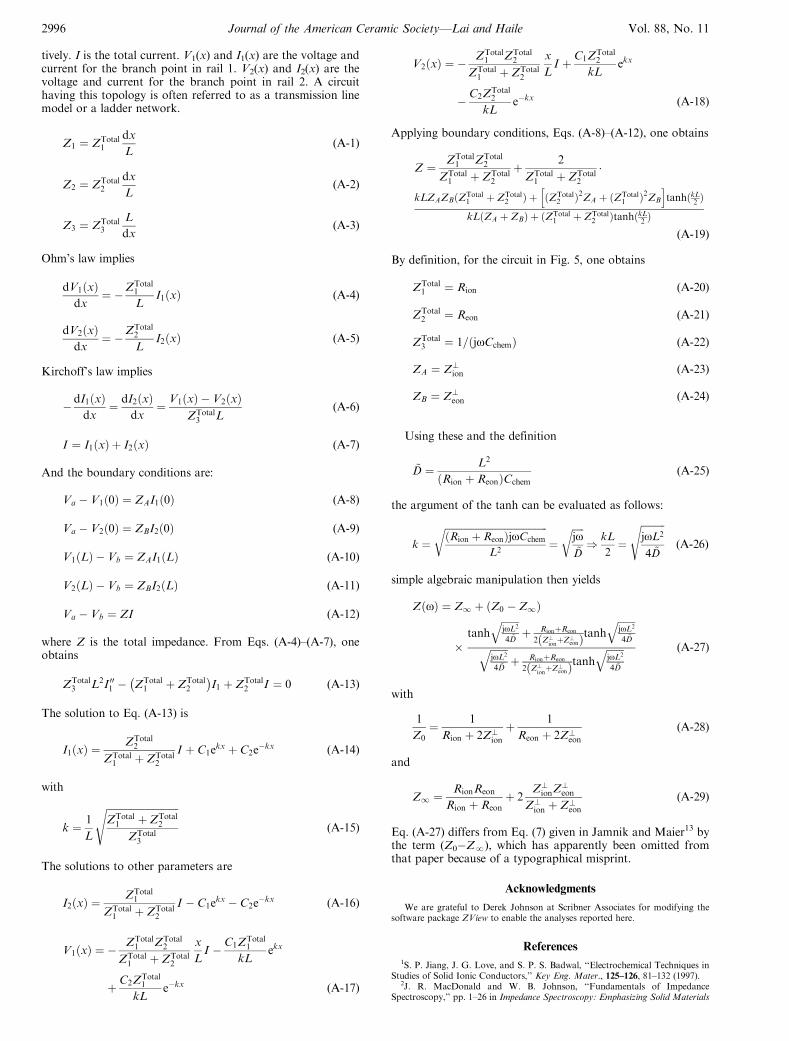
tively. I is the total current. V1(x) and I1(x) are the voltage andcurrent for the branch point in rail 1. V2(x) and I2(x) are thevoltage and current for the branch point in rail 2. A circuithaving this topology is often referred to as a transmission linemodel or a ladder network.
Z1 ¼ ZTotal1
dx
L(A-1)
Z2 ¼ ZTotal2
dx
L(A-2)
Z3 ¼ ZTotal3
L
dx(A-3)
Ohm’s law implies
dV1ðxÞdx
¼ �ZTotal1
LI1ðxÞ (A-4)
dV2ðxÞdx
¼ �ZTotal2
LI2ðxÞ (A-5)
Kirchoff’s law implies
� dI1ðxÞdx
¼ dI2ðxÞdx
¼ V1ðxÞ � V2ðxÞZTotal
3 L(A-6)
I ¼ I1ðxÞ þ I2ðxÞ (A-7)
And the boundary conditions are:
Va � V1ð0Þ ¼ ZAI1ð0Þ (A-8)
Va � V2ð0Þ ¼ ZBI2ð0Þ (A-9)
V1ðLÞ � Vb ¼ ZAI1ðLÞ (A-10)
V2ðLÞ � Vb ¼ ZBI2ðLÞ (A-11)
Va � Vb ¼ ZI (A-12)
where Z is the total impedance. From Eqs. (A-4)–(A-7), oneobtains
ZTotal3 L2I 001 � ZTotal
1 þ ZTotal2
� I1 þ ZTotal
2 I ¼ 0 (A-13)
The solution to Eq. (A-13) is
I1ðxÞ ¼ZTotal
2
ZTotal1 þ ZTotal
2
I þ C1ekx þ C2e
�kx (A-14)
with
k ¼ 1
L
ffiffiffiffiffiffiffiffiffiffiffiffiffiffiffiffiffiffiffiffiffiffiffiffiffiffiffiffiffiZTotal
1 þ ZTotal2
ZTotal3
s(A-15)
The solutions to other parameters are
I2ðxÞ ¼ZTotal
1
ZTotal1 þ ZTotal
2
I � C1ekx � C2e
�kx (A-16)
V1ðxÞ ¼ �ZTotal
1 ZTotal2
ZTotal1 þ ZTotal
2
x
LI � C1Z
Total1
kLekx
þ C2ZTotal1
kLe�kx (A-17)
V2ðxÞ ¼ �ZTotal
1 ZTotal2
ZTotal1 þ ZTotal
2
x
LI þ C1Z
Total2
kLekx
� C2ZTotal2
kLe�kx (A-18)
Applying boundary conditions, Eqs. (A-8)–(A-12), one obtains
Z ¼ ZTotal1 ZTotal
2
ZTotal1 þ ZTotal
2
þ 2
ZTotal1 þ ZTotal
2
kLZAZBðZTotal1 þ ZTotal
2 Þ þ ðZTotal2 Þ2ZA þ ðZTotal
1 Þ2ZB
h itanhðkL
2Þ
kLðZA þ ZBÞ þ ðZTotal1 þ ZTotal
2 ÞtanhðkL2Þ
(A-19)
By definition, for the circuit in Fig. 5, one obtains
ZTotal1 ¼ Rion (A-20)
ZTotal2 ¼ Reon (A-21)
ZTotal3 ¼ 1=ðjoCchemÞ (A-22)
ZA ¼ Z?ion (A-23)
ZB ¼ Z?eon (A-24)
Using these and the definition
~D ¼ L2
ðRion þ ReonÞCchem(A-25)
the argument of the tanh can be evaluated as follows:
k ¼ffiffiffiffiffiffiffiffiffiffiffiffiffiffiffiffiffiffiffiffiffiffiffiffiffiffiffiffiffiffiffiffiffiffiffiffiffiffiffiffiffiffiffiðRion þ ReonÞjoCchem
L2
r¼
ffiffiffiffiffijo~D
r) kL
2¼
ffiffiffiffiffiffiffiffiffiffijoL2
4 ~D
s(A-26)
simple algebraic manipulation then yields
ZðoÞ ¼ Z1 þ Z0 � Z1ð Þ
�tanh
ffiffiffiffiffiffiffijoL2
4 ~D
qþ RionþReon
2 Z?ionþZ?eonð Þtanh
ffiffiffiffiffiffiffijoL2
4 ~D
qffiffiffiffiffiffiffijoL2
4 ~D
qþ RionþReon
2 Z?ionþZ?eonð Þtanh
ffiffiffiffiffiffiffijoL2
4 ~D
q (A-27)
with
1
Z0¼ 1
Rion þ 2Z?ionþ 1
Reon þ 2Z?eon(A-28)
and
Z1 ¼RionReon
Rion þ Reonþ 2
Z?ionZ?eon
Z?ion þ Z?eon(A-29)
Eq. (A-27) differs from Eq. (7) given in Jamnik and Maier13 bythe term (Z0�ZN), which has apparently been omitted fromthat paper because of a typographical misprint.
Acknowledgments
We are grateful to Derek Johnson at Scribner Associates for modifying thesoftware package ZView to enable the analyses reported here.
References
1S. P. Jiang, J. G. Love, and S. P. S. Badwal, ‘‘Electrochemical Techniques inStudies of Solid Ionic Conductors,’’ Key Eng. Mater., 125–126, 81–132 (1997).
2J. R. MacDonald and W. B. Johnson, ‘‘Fundamentals of ImpedanceSpectroscopy,’’ pp. 1–26 in Impedance Spectroscopy: Emphasizing Solid Materials
2996 Journal of the American Ceramic Society—Lai and Haile Vol. 88, No. 11

and Systems, Edited by J. R. MacDonald. John Wiley and Sons, New York,1987.
3ISI Web of Knowledge, Thomson Scientific, 04/30/05.4E. Warburg, ‘‘Uber das Verhalten Sogenannter Unpolarisirbarer Elektroden
Gegen Wechselstrom,’’ Ann. Phys. Chem., 67 [3] 493–9 (1899).5E. Warburg, ‘‘Uber die Polarizationscapacitat des Plations,’’ Ann. Phys., 6,
125–35 (1901).6B. A. Boukamp, ‘‘Electrochemical Impedance Spectroscopy in Solid State
Ionics: Recent Advances,’’ Solid State Ionics, 169 [1–4] 65–73 (2004).7B. A. Boukamp and H. J. M. Bouwmeester, ‘‘Interpretation of the Gerischer
Impedance in Solid State Ionics,’’ Solid State Ionics, 157 [1–4] 29–33 (2003).8S. B. Adler, ‘‘Factors Governing Oxygen Reduction in Solid Oxide Fuel Cell
Cathodes,’’ Chem. Rev., 104 [10] 4791–43 (2004).9M. Sluyters-Rehbach and J. H. Sluyters, ‘‘A.C. Techniques,’’ p. 274 in Com-
prehensive Treatise of Electrochemistry, Vol. 9, Edited by E. Yeager, J. O’M.Bockris, B. E. Conway, and S. Sarangapani. Plenum, New York, 1984.
10N. L. Robertson and J. N. Michaels, ‘‘Oxygen-Exchange on Platinum-Electrodes in Zirconia Cells—Location of Electrochemical Reaction Sites,’’J. Electrochem. Soc., 137 [1] 129–35 (1990).
11H. Gerischer, ‘‘Wechselstrompolarisation von Elektroden mit einem Poten-tialbestimmenden Schritt beim Gleichgewichtspotential I,’’ Z. Phys. Chem., 198,286–313 (1951).
12J. Jamnik and J. Maier, ‘‘Generalised Equivalent Circuits for Mass andCharge Transport: Chemical Capacitance and its Implications,’’ Phys. Chem.Chem. Phys., 3 [9] 1668–78 (2001).
13J. Jamnik and J. Maier, ‘‘Treatment of the Impedance of Mixed Conductors—Equivalent Circuit Model and Explicit Approximate Solutions,’’ J. Electrochem.Soc., 146 [11] 4183–8 (1999).
14A. A. Moya, A. Hayas, and J. Horno, ‘‘Steady-State, Transient and Small-Amplitude AC Responses of an Electrochemical Cell with Immobile BackgroundCharge: A Network Approach,’’ Solid State Ionics, 130 [1–2] 9–17 (2000).
15J. R. Macdonald, ‘‘Theory of Space-Charge Polarization and Electrode-Discharge Effects,’’ J. Chem. Phys., 58 [11] 4982–5001 (1973).
16T. R. Brumleve and R. P. Buck, ‘‘Transmission-Line Equivalent-Circuit Modelsfor Electrochemical Impedances,’’ J. Electroanal. Chem., 126 [1–3] 73–104 (1981).
17A. Atkinson, S. A. Baron, and N. P. Brandon, ‘‘AC Impedance Spectra Aris-ing from Mixed Ionic Electronic Solid Electrolytes,’’ J. Electrochem. Soc., 151 [5]E186–93 (2004).
18B. C. H. Steele, ‘‘Appraisal of Ce1�yGdyO2�y/2 Electrolytes for IT-SOFCOperation at 5001C,’’ Solid State Ionics, 129 [1–4] 95–110 (2000).
19Z. P. Shao and S. M. Haile, ‘‘A High-Performance Cathode for the NextGeneration of Solid-Oxide Fuel Cells,’’ Nature, 431 [7005] 170–3 (2004).
20M. Mogensen, N. M. Sammes, and G. A. Tompsett, ‘‘Physical, Chemical andElectrochemical Properties of Pure and Doped Ceria,’’ Solid State Ionics, 129 [1–4]63–94 (2000).
21H. Richert, Electrochemistry of Solids pp. 79–87. Springer-Verlag, Berlin, 1982.22A. D. Pelton, ‘‘The Chemical Capacitance—A Thermodynamic Solution
Property,’’ J. Chim. Phys., 89 [10] 1931–49 (1992).23H. C. Chang and G. Jaff, ‘‘Polarization in Electrolytic Solutions. 1. Theory,’’
J. Chem. Phys., 20 [7] 1071–107 (1952).24D. R. Franceschetti, J. R. Macdonald, and R. P. Buck, ‘‘Interpretation of
Finite-Length-Warburg-Type Impedances in Supported and Unsupported Elect-rochemical-Cells with Kinetically Reversible Electrodes,’’ J. Electrochem. Soc., 138[5] 1368–71 (1991).
25S. P. Jiang and S. P. S. Badwal, ‘‘Hydrogen Oxidation at the Nickel and Plat-inum Electrodes on Yttria-Tetragonal Zirconia Electrolyte,’’ J. Electrochem. Soc.,144 [11] 3777–84 (1997).
26X. Guo, W. Sigle, and J. Maier, ‘‘Blocking Grain Boundaries in Yttria-Dopedand Undoped Ceria Ceramics of High Purity,’’ J. Am. Ceram. Soc., 86 [1] 77–87(2003).
27P. Jasinski, V. Petrovsky, T. Suzuki, andH. U. Anderson, ‘‘Impedance Studiesof Diffusion Phenomena and Ionic and Electronic Conductivity of CeriumOxide,’’J. Electrochem. Soc., 152 [4] J27–32 (2005).
28S. Kim and J. Maier, ‘‘On the Conductivity Mechanism of NanocrystallineCeria,’’ J. Electrochem. Soc., 149 [10] J73–83 (2002).
29A. Tschope, ‘‘Interface Defect Chemistry and Effective Conductivity inPolycrystalline Cerium Oxide,’’ J. Electroceram., 14 [1] 5–23 (2005).
30J. Jamnik, ‘‘Impedance Spectroscopy of Mixed Conductors with Semi-Block-ing Boundaries,’’ Solid State Ionics, 157 [1–4] 19–28 (2003).
31J. Bisquert, ‘‘Theory of the Impedance of Electron Diffusion and Recombi-nation in a Thin Layer,’’ J. Phys. Chem., 106 [2] 325–33 (2002).
32N. Q. Minh and T. Takahashi, ‘‘Electrical Conduction in Ceramics,’’ pp. 41–69in Science and Technology of Ceramic Fuel Cells. Elsevier Science, Amsterdam, 1995.
33Y. M. Chiang, D. P. Birnie III, and W. D. Kingery, ‘‘Defects in Ceramics, ’’ pp.101–81 in Physical Ceramics: Principles for Ceramics Science and Engineering. JohnWiley & Sons, New York, 1997.
34S. R.Wang, T. Kobayashi, M. Dokiya, and T. Hashimoto, ‘‘Electrical and IonicConductivity of Gd-Doped Ceria,’’ J. Electrochem. Soc., 147 [10] 3606–9 (2000).
35H. L. Tuller and A. S. Nowick, ‘‘Doped Ceria as a Solid Oxide Electrolyte,’’J. Electrochem. Soc., 122 [2] 255–9 (1975).
36M. Godickemeier and L. J. Gauckler, ‘‘Engineering of Solid Oxide Fuel Cellswith Ceria-Based Electrolytes,’’ J. Electrochem. Soc., 145 [2] 414–21 (1998).
37S. Lubke and H. D. Wiemhofer, ‘‘Electronic Conductivity of Gd-Doped Ceriawith Additional Pr-Doping,’’ Solid State Ionics, 117 [3–4] 229–43 (1999).
38J. J. Sprague, O. Porat, and H. L. Tuller, ‘‘Mixed Conducting Gas Sensors:Atmosphere Dependent Electrode Impedance,’’ Sens. Actuators B, 36 [1–3] 348–52(1996).
39T. Kobayashi, S. R. Wang, M. Dokiya, H. Tagawa, and T. Hashimoto, ‘‘Ox-ygen Nonstoichiometry of Ce1�ySmyO2�0.5y�x (y5 0.1, 0.2),’’ Solid State Ionics,126 [3–4] 349–57 (1999).
40H. L. Tuller, ‘‘Mixed Conduction in Nonstoichiometric Oxides,’’ pp. 310–5 inNonstoichiometric Oxides, Edited by O. T. Sorensen. Academic Press, New York,1981.
41J. Mizusaki, K. Amano, S. Yamauchi, and K. Fueki, ‘‘Electrode-Reaction atPt,O2(g)/Stabilized Zirconia Interfaces. 1. Theoretical Consideration of ReactionModel,’’ Solid State Ionics, 22 [4] 313–22 (1987).
42J. Vanherle and A. J. McEvoy, ‘‘Impedance Characteristics of Platinum-Electrodes on Yttria-Stabilized Zirconia,’’ Ber. Bunsen. Phys. Chem., 97 [3] 470–4(1993).
43J. Mizusaki, K. Amano, S. Yamauchi, and K. Fueki, ‘‘Electrode-Reaction atPt,O2 (g)/Stabilized Zirconia Interfaces. 2. Electrochemical Measurements andAnalysis,’’ Solid State Ionics, 22 [4] 323–30 (1987).
44W. F. Zhang, P. Schmidt-Zhang, and U. Guth, ‘‘Electrochemical Studies onCells M/YSZ/Pt (M5Pt, Pt-Ga2O3) in NO, O2, N2 Gas Mixtures,’’ Solid StateIonics, 169 [1–4] 121–8 (2004).
45D. Y. Wang and A. S. Nowick, ‘‘Cathodic and Anodic Polarization Phenom-ena at Platinum-Electrodes with Doped CeO2 as Electrolyte. 1. Steady-StateOverpotential,’’ J. Electrochem. Soc., 126 [7] 1155–65 (1979).
46D. Y. Wang and A. S. Nowick, ‘‘Cathodic and Anodic Polarization Phenom-ena at Platinum-Electrodes with Doped CeO2 as Electrolyte. 2. Transient Over-potential and AC Impedance,’’ J. Electrochem. Soc., 126 [7] 1166–72 (1979).
47J. Mizusaki, H. Tagawa, K. Isobe, M. Tajika, I. Koshiro, H. Maruyama, andK. Hirano, ‘‘Kinetics of the Electrode-Reaction at the H2–H2O Porous PtStabilized Zirconia Interface,’’ J. Electrochem. Soc., 141 [6] 1674–83 (1994).
48Y. P. Xiong, K. Yamaji, T. Horita, N. Sakai, and H. Yokokawa, ‘‘Hole andElectron Conductivities of 20 mol%-ReO1.5 Doped CeO2 (Re5Yb, Y, Gd, Sm,Nd, La),’’ J. Electrochem. Soc., 151 [3] A407–12 (2004). &
Sossina M. Haile is Associate Pro-fessor of Materials Science and ofChemical Engineering at the Cali-fornia Institute of Technology. Sheearned her Ph.D. in Materials Sci-ence and Engineering from theMassachusetts Institute of Technol-ogy in 1992. As part of her doctoralstudies, Haile spent a year as a Ful-bright Fellow at the Max Plank In-stitute for Solid State Research,Stuttgart, Germany. She then held
a postdoctoral appointment at this same institution as a Hum-boldt Fellow. Before assuming her present position at Caltech in1996, Haile was a member of the faculty at the University ofWashington. Her research broadly encompasses solid state ionicmaterials and devices, with particular focus on fuel cells. She hasestablished a new class of fuel cells based on solid acid electro-lytes, and demonstrated record power densities for solid oxidefuel cells. Haile has published over 60 papers on these topics andhas been an invited speaker at several national and internationalconferences. In 1992 she was awarded a National Young Inves-tigator Award from the National Science Foundation. Her othermajor awards include the 1997 Robert L. Hardy Award of theMinerals, Metals andMaterials Society (TMS), the 2000 RobertL. Coble Award of the American Ceramic Society and the 2001J. Bruce Wagner Jr. Young Investigator Award of the Electro-chemical Society. Haile has served as a principal editor for theJournal of Materials Research (1997–2001), and is presently amember of the National Materials Advisory Board of the Na-tional Academies of Sciences and Engineering.
Wei Lai is a graduate student inMaterials Science at the CaliforniaInstitute of Technology. He re-ceived his B.S. (1998) and M.S.(2001) in Materials Science and En-gineering from the University ofScience and Technology of China,China. His research work focuseson the electrochemistry and micro-structure of materials for interme-diate temperature solid oxide fuelcells. His recent awards include the
2005 Graduate Excellence inMaterials Science Diamond Awardof the Basic Science Division of the American Ceramic Societyand the 2005 Li Ming Scholarship of the California Institute ofTechnology.
November 2005 Impedance Spectroscopy for Analysis of Mixed Conductors 2997