Impedance Measurement of a Thermoacoustic Engine...
32
Impedance Measurement of a Thermoacoustic Engine Constructed from a Helmholtz Resonator by Holly Ann Smith In Partial Fulfillment of Departmental Honors Requirements University of Central Arkansas Conway, Arkansas 72032 Spring 2008
-
Upload
truongtruc -
Category
Documents
-
view
220 -
download
3
Transcript of Impedance Measurement of a Thermoacoustic Engine...

Impedance Measurement of a Thermoacoustic EngineConstructed from a Helmholtz Resonator
by
Holly Ann SmithIn Partial Fulfillment of Departmental Honors Requirements
University of Central ArkansasConway, Arkansas 72032
Spring 2008

Abstract
A thermoacoustic engine was constructed from a 5-Liter Helmholtz flaskby inserting a ceramic stack into the lower portion of the flask’s neck. Acold heat exchanger and hot heat exchanger located on opposing faces of thestack provided very large temperature differences across the stack, and if thetemperature difference was great enough then the system would produce sound.A previous experiment investigated how the resistance in the system changedas the temperature difference increased by observing changes in the qualityfactor; however, due to the nature of the measurements, it was not possible toobserve how the imaginary part of the resistance changed as the temperaturedifference increased. This thesis focuses on how impedance measurements atthe opening of the flask’s neck might be analyzed in order to determine thefrequency and temperature difference at which this system would reach onsetand to see if this calculation for the onset temperature difference correspondsto the experimentally observed onset for the engine at 207C from the priorexperiment. This thesis will also focus on the behavior of the incident soundwave as the temperature difference across the engine’s stack increases.
Contents
1 Theory 51.1 Helmholtz Resonators . . . . . . . . . . . . . . . . . . . . . . . . . . 51.2 Thermoacoustic Engines . . . . . . . . . . . . . . . . . . . . . . . . . 61.3 Experimental Results from a Prior Investigation . . . . . . . . . . . . 81.4 Impedance Measurements . . . . . . . . . . . . . . . . . . . . . . . . 111.5 Reflected and Transmitted Sound Waves. . . . . . . . . . . . . . . . . 13
2 Experimental Setup 15
3 Results and Analysis 18
4 Conclusion 21
Appendix A: Derivation of Euler’s Equation 23
Appendix B: Summary of the Results from a Prior Experiment 25
Appendix C: Mathematica Notebook 30
Acknowledgements
I am extremely grateful for the support of my research advisor and mentor, Dr.William Slaton, whose enthusiasm and dedication inspired me to explore thermoa-coustics.
I am also thankful for the encouragement that I received from the faculty, staff, andmy peers from the Department of Physics and Astronomy.

1 Theory
1.1 Helmholtz Resonators
Figure 1: The behavior
of air inside a Helmholtz
resonator.
When a person blows air into a bottle, the air blown
into the bottle causes the air inside the bottle to oscillate.
If the person blows too hard or too softly, the air inside
the bottle oscillates, but the amplitude of the oscillation
is small. However, when a person blows into a bottle “just
right,” the amplitude becomes increasingly large, and the
bottle will produce sound.
A bottle is a special kind of resonator known as a
Helmholtz resonator. A Helmholtz resonator consists of a
hollow neck attached to an empty volume. The air inside
a Helmholtz resonator experiences pressure oscillations towards the bottom of the
flask and velocity oscillations towards the opening.[1] For example, consider a mass
bouncing on a spring. The air oscillating in the neck is comparable to the mass, and
the air inside the cavity is comparable to the spring (see Figure 1). If the mass ex-
periences friction, then its motion will become damped due to this added resistance.
The air oscillating in the neck experiences friction due to its contact with the walls
of the neck. The air inside a Helmholtz flask with a large resistance will experience
a very weak response when driven at its natural frequency whereas a flask with little
or no resistance will experience a very strong response.
5
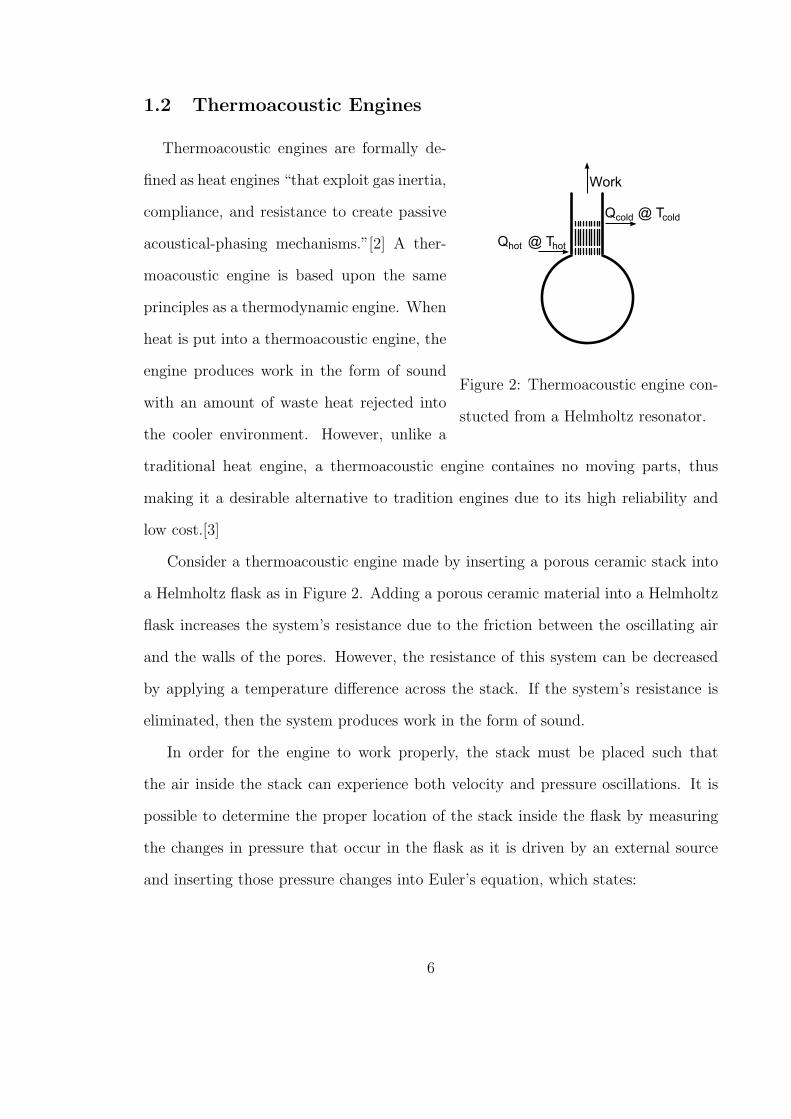
1.2 Thermoacoustic Engines
Figure 2: Thermoacoustic engine con-
stucted from a Helmholtz resonator.
Thermoacoustic engines are formally de-
fined as heat engines “that exploit gas inertia,
compliance, and resistance to create passive
acoustical-phasing mechanisms.”[2] A ther-
moacoustic engine is based upon the same
principles as a thermodynamic engine. When
heat is put into a thermoacoustic engine, the
engine produces work in the form of sound
with an amount of waste heat rejected into
the cooler environment. However, unlike a
traditional heat engine, a thermoacoustic engine containes no moving parts, thus
making it a desirable alternative to tradition engines due to its high reliability and
low cost.[3]
Consider a thermoacoustic engine made by inserting a porous ceramic stack into
a Helmholtz flask as in Figure 2. Adding a porous ceramic material into a Helmholtz
flask increases the system’s resistance due to the friction between the oscillating air
and the walls of the pores. However, the resistance of this system can be decreased
by applying a temperature difference across the stack. If the system’s resistance is
eliminated, then the system produces work in the form of sound.
In order for the engine to work properly, the stack must be placed such that
the air inside the stack can experience both velocity and pressure oscillations. It is
possible to determine the proper location of the stack inside the flask by measuring
the changes in pressure that occur in the flask as it is driven by an external source
and inserting those pressure changes into Euler’s equation, which states:
6

ρo∂~u
∂t= −−→∇p (1)
Rearranging Euler’s equation to find the magnitude of the acoustic velocity gives:
uAC =
∣∣∣∣1
ρoωo
∆Po
∆x
∣∣∣∣ (2)
where uAC is the acoustic velocity, ρo is the ambient air density, ωo is the angular
frequency, ∆Po is the change in pressure, and ∆x is the distance over which the
pressure change occurs.1 Therefore, if the pressure varies with position within a
certain region of the flask, then the air contained in this volume will experience mainly
velocity oscillations. If the pressure does not significantly vary with position within
a certain region of the flask, then the air contained in this volume will experience
mainly pressure oscillations. If there is no temperature difference across the stack
and the stack is placed in a region that has both velocity and pressure oscillations,
then a parcel of gas located within the stack will oscillate back and forth due to
the velocity changes and also expand and contract as it travels due to the pressure
changes.
If heat is applied to one end of the stack, then the parcel will now transfer this
added heat energy down the stack. If the parcel is cooler than the hot end of the
stack, it will absorb heat energy and thermally expand. This expansion of the parcel
does net work on its environment. As it travels down the stack, the gas parcel will
transfer its heat energy to the cooler stack, contract, and will repeat the process for
as long as heat is provided into the system. The motion of this gas parcel is shown
in Figure 3. This gas parcel along with its neighbors will act as a bucket brigade,
transferring the heat energy from the hot end to the cooler end of the stack. The
1A simplified derivation of Equation 2 starting from Newton’s Second Law can be seen in Ap-pendix A.
7
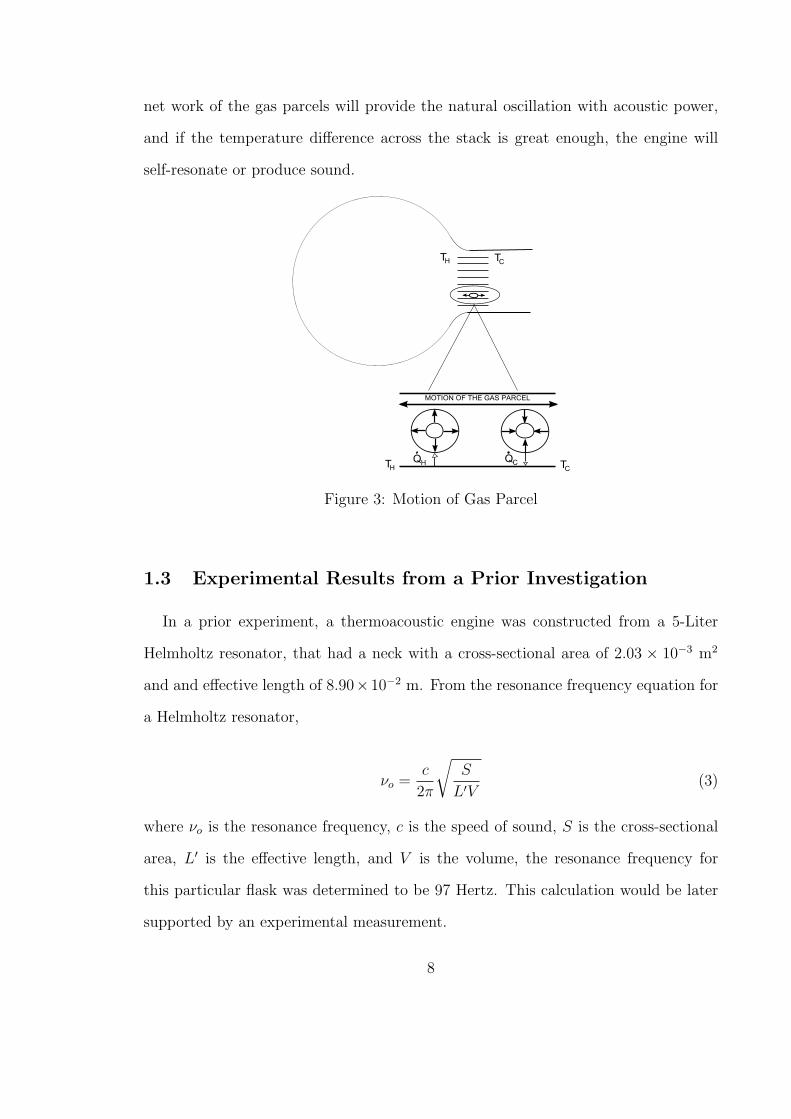
net work of the gas parcels will provide the natural oscillation with acoustic power,
and if the temperature difference across the stack is great enough, the engine will
self-resonate or produce sound.
Figure 3: Motion of Gas Parcel
1.3 Experimental Results from a Prior Investigation
In a prior experiment, a thermoacoustic engine was constructed from a 5-Liter
Helmholtz resonator, that had a neck with a cross-sectional area of 2.03 × 10⁻³ m2
and and effective length of 8.90×10⁻² m. From the resonance frequency equation for
a Helmholtz resonator,
νo =c
2π
√S
L′V(3)
where νo is the resonance frequency, c is the speed of sound, S is the cross-sectional
area, L′ is the effective length, and V is the volume, the resonance frequency for
this particular flask was determined to be 97 Hertz. This calculation would be later
supported by an experimental measurement.
8
From Newton’s Second Law, the mass of air moving within the neck of the flask
when driven by an external sinusoidal driving force can be represented by the equa-
tion:
md2x
dt2+ R
dx
dt+ kx = SPeiωt (4)
where m is the mass of the air, R is the resistance, k is the spring constant, and
SPeiωt is the sinusoidal driving force. One assumes a particular solution of the form:
xp(t) = xeiωt (5)
Inserting this solution into Equation 4 and solving for the magnitude of the displace-
ment yields:
|x| = SP
ν0νQ
√1 + (ν0
ν)2Q2[1− ( ν
ν0)2]2
(6)
In this equation, the resonance frequency, νo, and the quality factor. Q, are given by:
ωo =
√k
m(7)
and
Q =ω0m
R(8)
At resonance, or when ν=νo, Equation 6 can be written as:
xmax =SPQ
ω2=
SPm
ωR(9)
Inserting the value for xmax into Equation 6 gives:
9

x
xmax
=1√
1 +(
f0
f
)2
Q2
[1−
(ff0
)2]2
(10)
Equation 6 is the general solution for a simple harmonic oscillator. From the adiabatic
equation of state, the displacement of the mass, x, can be written in terms of the
pressure:
x =Vo
ρoc2SP (11)
Therefore, Equation 6 can be written in terms of the amplitude of the pressure within
the flask, A, to the maximum amplitude at resonance, Amax:
A
Amax
=1√
1 +(
f0
f
)2
Q2
[1−
(ff0
)2]2
(12)
A thermoacoustic engine was created from the Helmholtz flask by inserting a
porous ceramic stack2 into the bottom portions of the flask’s neck. Measurements
of the pressure within the volume of the thermoacoustic engine were taken as it was
swept over a range of frequencies. This setup can be viewed in Figure 4.
The measurements were then plotted and fit to Equation 12. From the fit, the
resonance frequency and the quality factor of the system were determined. A total
of eight different measurements for the quality factor were made for eight increasing
temperature differences across the stack, and the quality factor was shown to increase
as the temperature difference increased. At a temperature difference of 207C, the
thermoacoustic engine reached onset. A summary of the results from this experiment
can be viewed in Appendix B.
2The ceramic stack used in this experiment is identical to the stack described in Section 2.
10
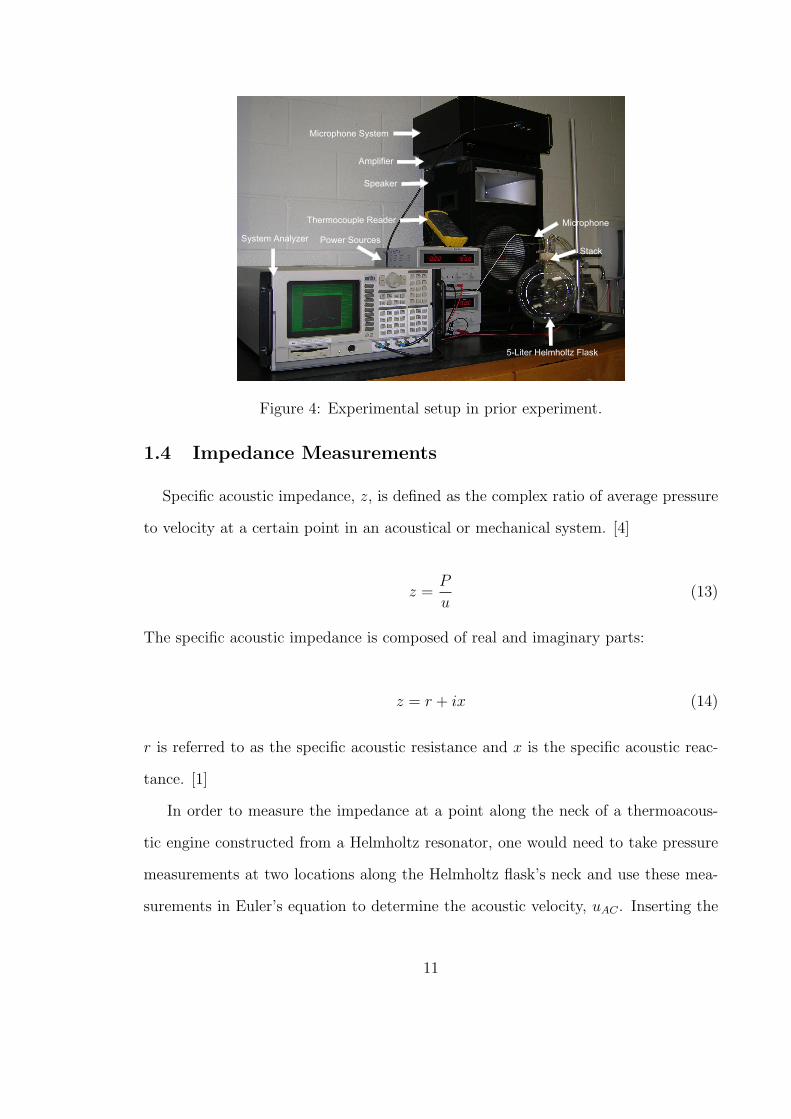
Figure 4: Experimental setup in prior experiment.
1.4 Impedance Measurements
Specific acoustic impedance, z, is defined as the complex ratio of average pressure
to velocity at a certain point in an acoustical or mechanical system. [4]
z =P
u(13)
The specific acoustic impedance is composed of real and imaginary parts:
z = r + ix (14)
r is referred to as the specific acoustic resistance and x is the specific acoustic reac-
tance. [1]
In order to measure the impedance at a point along the neck of a thermoacous-
tic engine constructed from a Helmholtz resonator, one would need to take pressure
measurements at two locations along the Helmholtz flask’s neck and use these mea-
surements in Euler’s equation to determine the acoustic velocity, uAC . Inserting the
11
average of these two pressure measurements and the acoustic velocity into Equation
13 yields:
z =PAV G
uAC
(15)
This expression gives the specific acoustic impedance at a specific location between
the two microphones.
In order to calculate the impedance at the opening of the flask’s neck, one needs
to invoke the Impedance Translation Theorem. For a duct with air driven by a source
at one end, the equations for the complex pressure and velocity can be written as:
p/ρ0c
vx
= (aeikx ± be−ikx)eiωt (16)
In Equation 16, a and b are constants that are dependent upon the boundary condi-
tions and k is the wave number. [5] Setting x = 0 to be the point equidistant from
the two microphones, as seen in Figure 5, yields:
p(0) = pAV G = ρ0c(a + b)eiωt (17)
and
vx(0) = uAC = (a− b)eiωt (18)
Inserting Equations 17 and 18 into Equation 15 for the impedance at the position
between the two microphones gives:
z = ρ0ca + b
a− b(19)
Letting L be the distance from x = 0 to the opening of the neck, as shown in
Figure 5, we can define the impedance at the opening to be:
12

Z =p(L)
vx(L)
Z = ρ0caeikL + be−ikL
aeikL − be−ikL(20)
Inserting the exponential definitions for sine and cosine3 into Equation 20 and
simplifying yields:
Z
ρ0c=
z cos(kL) + iρ0c sin(kL)
ρ0c cos(kL) + iz sin(kL)(21)
This equation gives the impedance at the opening of the thermacoustic engine’s neck.
Figure 5: For the experimental setup, x=0 is defined to be the point equidistant fromthe two microphones, and x=L is at the opening of the flask’s neck.
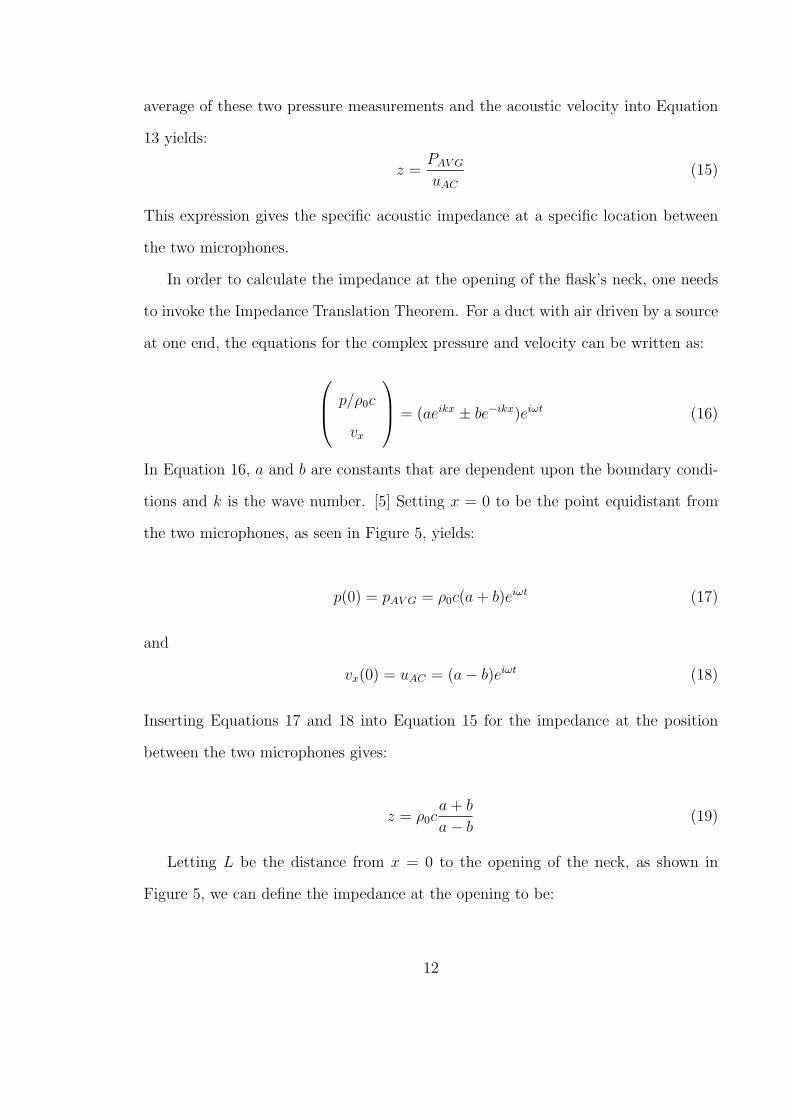
1.5 Reflected and Transmitted Sound Waves.
In order to take measurements of the impedance at the opening of the engine’s
neck, a closed system must be created by attaching a speaker to the engine with
a length of pipe, which houses microphones to measure pressures at two different
locations. A schematic of this setup can be seen in Figure 6.
The air within this system is driven by the speaker, which sends an incident sound
wave along the length of the pipe. When this incident wave encounters the stack,
3sin θ= eiθ−e−iθ
2i and cos θ= eiθ+e−iθ
2
13
Figure 6: Overview of the closed-system setup used to measure impedance at theopening of the Helmholtz flask.
part of the wave is transmitted and the rest is reflected. The microphones along the
length of pipe will therefore measure not only the pressure of the incident wave but
a superposition of the pressures of the incident wave and the reflected wave.
PB = Pincident + Preflected (22)
The reflection coefficient, R, describes how much of the incident wave is reflected:
R =PreflectedPincident
(23)
If the incident wave encounters a solid boundary, then R=1, and the incident wave is
entirely reflected. However, if no boundary exists, R=0, and the incident wave will
continue to propagate through the system. In this setup to measure the impedance,
the ceramic stack cannot be treated as a solid boundary because it is porous. However,
a portion of the incident wave is reflected upon encountering the stack, while another
portion continues to propagate through the system. This reflection and transmission
of the incident wave is illustrated in Figure 7.
14
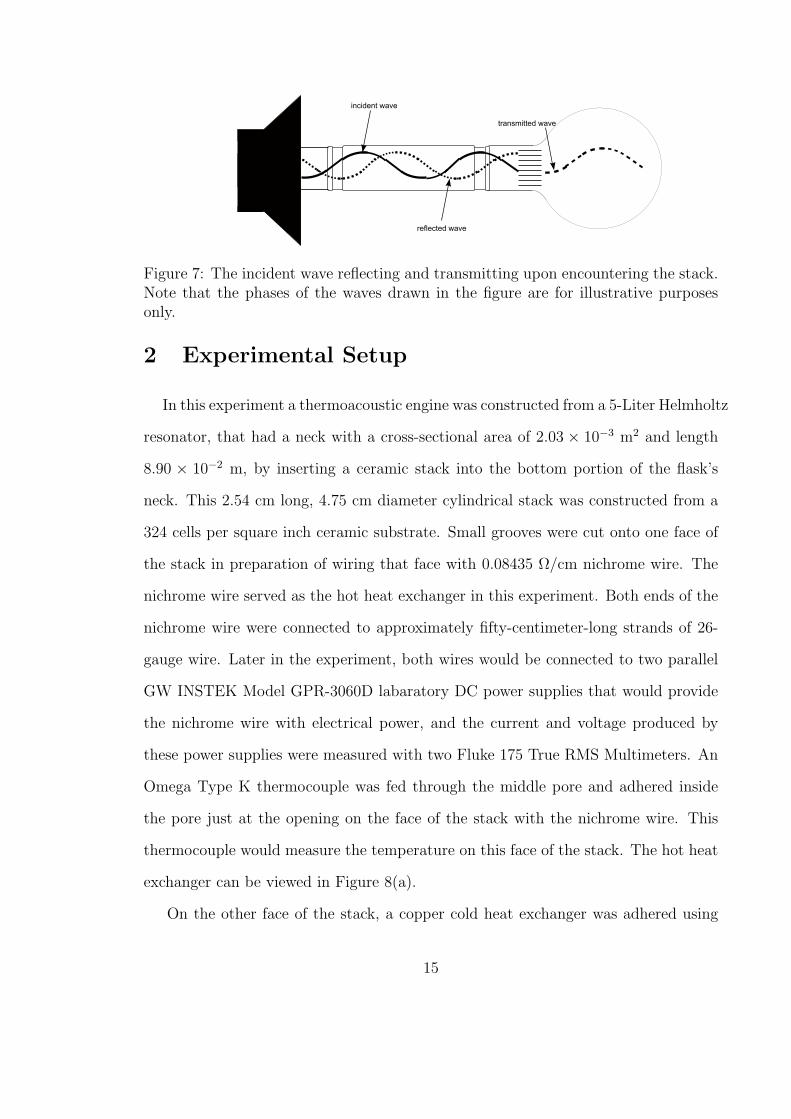
Figure 7: The incident wave reflecting and transmitting upon encountering the stack.Note that the phases of the waves drawn in the figure are for illustrative purposesonly.
2 Experimental Setup
In this experiment a thermoacoustic engine was constructed from a 5-Liter Helmholtz
resonator, that had a neck with a cross-sectional area of 2.03 × 10⁻³ m2 and length
8.90 × 10⁻² m, by inserting a ceramic stack into the bottom portion of the flask’s
neck. This 2.54 cm long, 4.75 cm diameter cylindrical stack was constructed from a
324 cells per square inch ceramic substrate. Small grooves were cut onto one face of
the stack in preparation of wiring that face with 0.08435 Ω/cm nichrome wire. The
nichrome wire served as the hot heat exchanger in this experiment. Both ends of the
nichrome wire were connected to approximately fifty-centimeter-long strands of 26-
gauge wire. Later in the experiment, both wires would be connected to two parallel
GW INSTEK Model GPR-3060D labaratory DC power supplies that would provide
the nichrome wire with electrical power, and the current and voltage produced by
these power supplies were measured with two Fluke 175 True RMS Multimeters. An
Omega Type K thermocouple was fed through the middle pore and adhered inside
the pore just at the opening on the face of the stack with the nichrome wire. This
thermocouple would measure the temperature on this face of the stack. The hot heat
exchanger can be viewed in Figure 8(a).
On the other face of the stack, a copper cold heat exchanger was adhered using
15

(a) Hot heat exchanger. (b) Cold heat exchanger.
Figure 8: Bottom and top views of the ceramic stack.
four strands of 30-gauge wire. The cold heat exchanger consisted of a circular portion
of copper mesh approximately the diameter of the stack. A 0.3175 cm outer diameter
copper tube lined the outer rim of the mesh. During the course of the experiment, 0C
water, provided by a Thermo Fisher Scientific’s NESLAB RTE 7 Refrigerated Bath,
would be pumped through the tube in order to achieve large temperature differences
across the stack. Beneath the cold heat exchanger another thermocouple was placed
just within the opening of the middle pore in order to measure the temperature on
this face of the stack. The cold heat exchanger can be viewed in Figure 8(b).
The thermoacoustic engine was then attached to an eight inch long, two inch inner
diameter PTFE plastic pipe with the use of a pipe connector. Two half-inch diameter
holes were drilled four inches apart in the pipe so that two Endevco Model 8510B-1
microphones, that had a flat-frequency response, could take pressure measurements
at two different locations in the pipe. Detailed measurements of the pipe can be
viewed in Figure 9.
After connecting the thermoacoustic engine to the pipe, the pipe was then attached
to a twelve-inch-diameter audio speaker, which would serve to drive the air within the
pipe and thermoacoustic engine. The speaker was connected to a Stanford Research
Systems SR785 signal analyzer, which controlled the frequency and amplitude of
the sine wave created by the speaker. During the entirety of the experiment, the
16

Figure 9: Pipe Connecting Audio Speaker to Thermoacoustic Engine.
amplitude of the signal produced by the signal generator was set to 1.5 Volts, and
the thermoacoustic engine was swept through a range of frequencies, 90-150 Hertz.
Figure 10 displays the entire experimental setup.
Before water or power were provided to the ceramic stack, the thermoacoustic
engine was swept from 90 to 150 Hertz. The signal analyzer recorded the pressure of
both microphones as a function of frequency. This procedure was repeated two more
times, and the measurements recorded for each microphone were averaged separately.
Afterwards, 0C water from the refrigerated bath was circulated through the cold
heat exchanger, and the temperatures at both faces of the ceramic stack were given
time to equilibriate. As before, the thermoacoustic engine was swept from 90 to 150
Hertz, and the procedure was repeated for a total of three trials. The measurements
from the three trials for each microphone were then averaged separately.
While the 0C water circulated through the cold heat exchanger, the power sources
were set to provide 0.4 Watts of power to the hot heat exchanger. The temperatures on
side of the ceramic stack were given time to equilibriate, and a temperature difference
of 9C was produced. The thermoacoustic engine was then swept over the 90-150
Hertz range. A total of three experimental trials were performed at this temperature
17
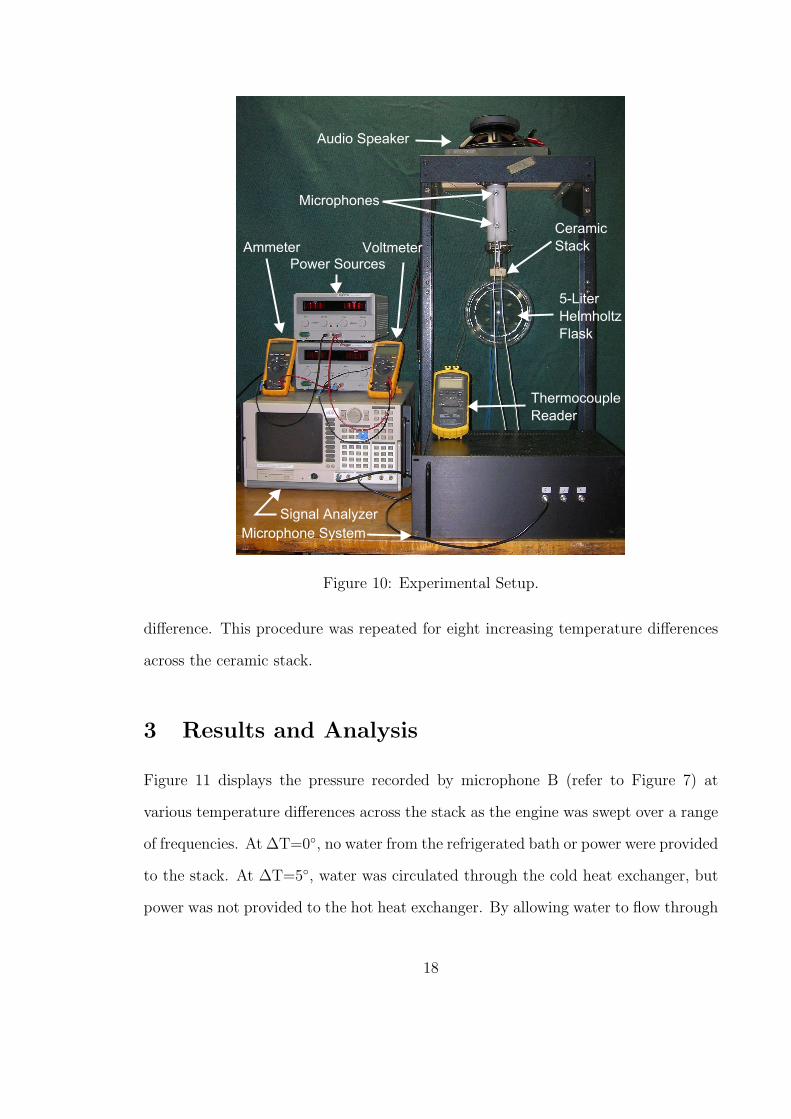
Figure 10: Experimental Setup.
difference. This procedure was repeated for eight increasing temperature differences
across the ceramic stack.
3 Results and Analysis
Figure 11 displays the pressure recorded by microphone B (refer to Figure 7) at
various temperature differences across the stack as the engine was swept over a range
of frequencies. At ∆T=0, no water from the refrigerated bath or power were provided
to the stack. At ∆T=5, water was circulated through the cold heat exchanger, but
power was not provided to the hot heat exchanger. By allowing water to flow through
18

∆T Across the Stack (C) TH (C) TC (C) Power (Watts)0 22 22 05 13 8 09 19 10 0.39621 38 17 1.6040 67 27 1.4865 107 42 6.6691 148 57 10.6116 189 73 15.8136 223 87 21.9150 246 96 27.7176 283 107 36.1
Table 1: Thermocouples on either side of the ceramic stack measured the tempera-tures and ∆T was calculated from their difference. TH corresponds to the temperatureon the side of the stack with the hot heat exchanger whereas TC corresponds to thetemperature on the side with the cold heat exchanger. The column with the powervalues corresponds to the amount of electrical power provided to the nichrome wirein order to achieve the different temperature differences.
the cold heat exchanger, the density and speed of sound of the air decreased from their
values at ∆T=0, causing the pressure recorded by microphone B to shift upwards.
However, one can see that the overall range for the acoustic pressure amplitudes
is decreasing as the temperature difference across the stack increases from ∆T=5.
Referring to Equation 22, the incident pressure does not change because the speaker
is driving the air within the system at a set amplitude from the signal analyzer;
therefore, the reflected wave must decrease in order to correspond with this decrease
in total acoustic pressure. Essentially, the reflecion coefficient, R, for this system is
decreasing as the temperature difference increases. Therefore, one can assume that
by increasing the temperature difference of the stack, the resistance in the system is
being eliminated.
A Mathematica notebook, which can be viewed in Appendix C, has been created
to calculate the impedance at the neck of the thermoacoustic engine. At this time, the
impedance at the opening of the flask has not been calculated because measurements
19

2
4
6
8
10
12
14
16
18
20
22
24
90 100 110 120 130 140 150
Pre
ssur
e (P
a)
Frequency (Hz)
Pressure Measurements for Microphone B
∆T=0oC∆T=5oC∆T=9oC
∆T=21oC∆T=40oC∆T=65oC∆T=91oC
∆T=116oC∆T=136oC∆T=150oC∆T=176oC
Figure 11: Pressure measured by microphone B as a function of frequency. Pressuremeasurements were made for eleven increasing temperature differences across thestack.
of the phase for the recorded pressure are still being collected.
20

4 Conclusion
A thermoacoustic engine is a heat engine that uses heat energy to perform work in the
form of sound. A prior experiment showed that this particular engine reached onset
at a temperature difference of 207C across its stack. The measurements taken during
this prior experiment showed that the quality factor for this system increased as the
temperature differences increased towards the onset temperature difference. This
increase in the quality factor corresponds to a decrease in the system’s resistance.
However, the measurements made in the prior experiment primarily were directly
related to the specific acoustic resistance, or the real part of the impedance, and were
not easily relatable to the specific acoustic reactance. In order to explore both the
real and imaginary parts of the impedance, a closed system was created such that two
different microphone measurements could collect two different pressure measurements
simultaneously as the engine was swept over a range of frequencies. By calculating
the average pressure and the acoustic velocity at a point between these two micro-
phones, it is possible to determine the impedance at the opening of the engine’s neck
by invoking the Impedance Translation Theorem. During this time a Mathematica
notebook has been created to calculate the impedance at the opening of the engine’s
neck; however; measurements for the pressure’s phase within the system are currently
being collected.
At temperature differences below the onset temperature, the incident sound wave
is partially reflected upon encountering the ceramic stack, while being partially trans-
mitted. Pressure measurements from microphone B show that as the temperature dif-
ference across the stack increases, the pressure is decreasing. Because this recorded
pressure is a superposition of the incident and reflected wave, the reflected pressure
must be decreasing as the temperature difference increases. Therefore, as the temper-
ature difference increases, the reflection coefficient is decreasing, and one can assume
21

that the resistance in the system is decreasing.
22

Appendix A: Derivation of Euler’s Equation
Figure 12: Pipe with pressures P1 and P2
at either openings.
Consider a pipe as shown in Fig-
ure 12. Assume that the pressure P2
is greater than the P1; therefore, the
change in pressure, ∆P , is negative. Be-
cause pressure is defined as the force per
unit area, A, Newton’s Second Law can
be written in terms of the pressure.
Σ~F = m~a
−A∆P = ma (24)
Because acceleration is the first derivative of the velocity, Equation 24 can be written
as:
−A∆P = mdv
dt(25)
Considering a pressure change over a small volume in the pipe, V = A(xf − xi) =
A∆x, and dividing both sides of Equation 25 by this volume yields:
−A∆P
A∆x=
m
A∆x
dv
dt
−∆P
∆x=
m
A∆x
dv
dt(26)
The density of the air for ambient conditions, ρo, is defined as the mass per unit
23

volume of air:
ρo =m
V
ρo =m
A∆x(27)
Inserting this value for the ambient air density into Equation 26 gives:
−∆P
∆x= ρo
dv
dt(28)
Due to the sinusoidal nature of the pressure and velocity, the pressure and velocity
are represented by P = Po(x)eiωot and v = uAC(x)eiωot, respectively. Inserting this
value for pressure and the derivative of the velocity with respect to time into Equation
28 yields:
−∆Po(x)eiω0t
∆x= (iωoρo)(uAC(x)eiω0t)
−∆Po(x)
∆x= (iωoρo)(uAC(x))
uAC =
∣∣∣∣1
ρoωo
∆Po
∆x
∣∣∣∣ (29)
24
Appendix B: Summary of the Results from a Prior
Experiment
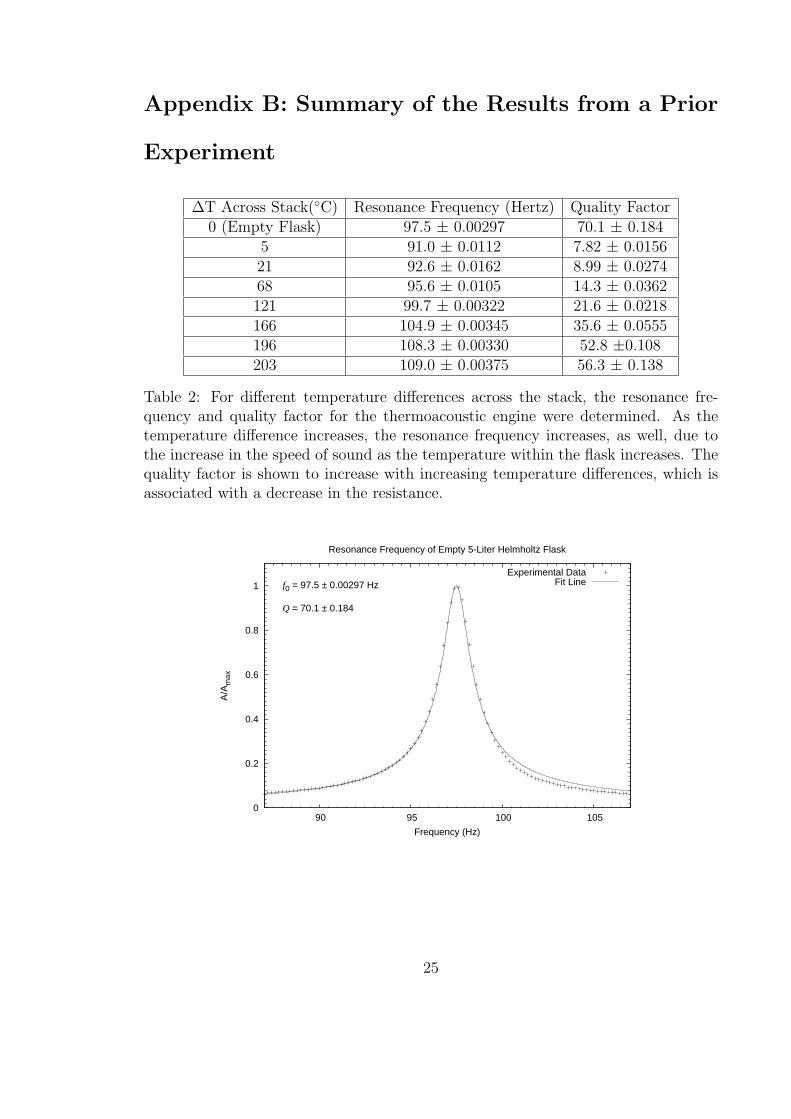
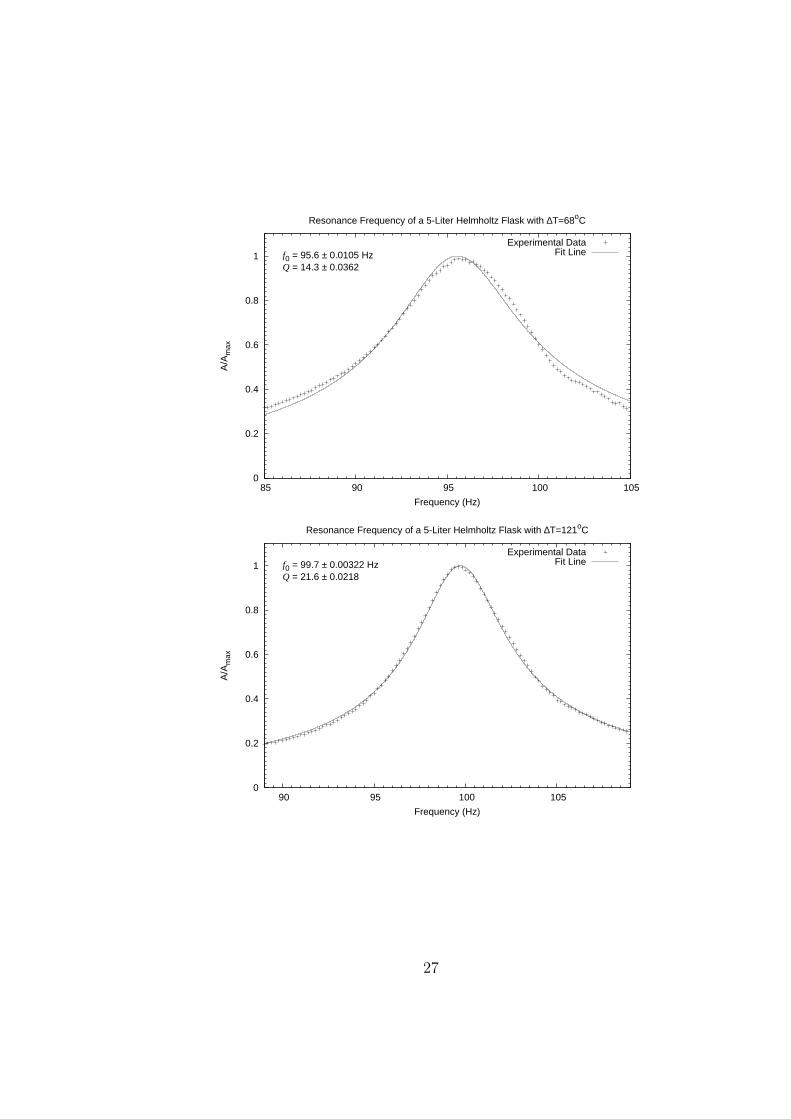
∆T Across Stack(C) Resonance Frequency (Hertz) Quality Factor0 (Empty Flask) 97.5 ± 0.00297 70.1 ± 0.184
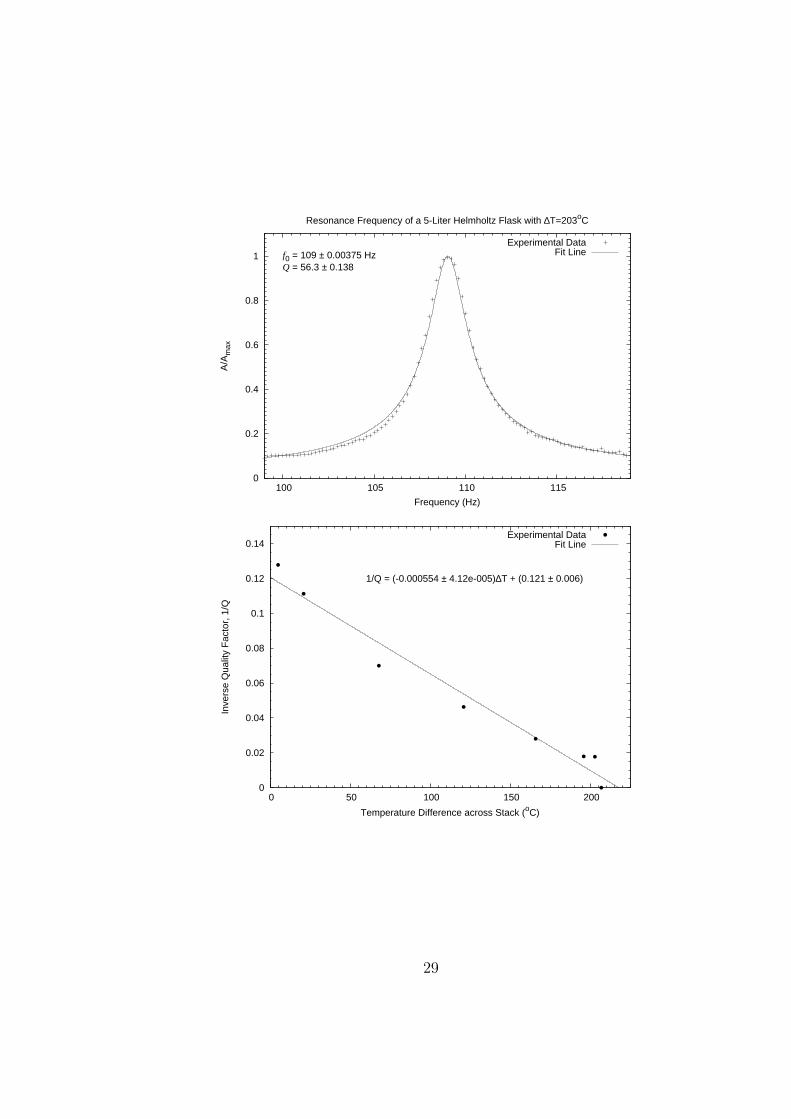
5 91.0 ± 0.0112 7.82 ± 0.015621 92.6 ± 0.0162 8.99 ± 0.027468 95.6 ± 0.0105 14.3 ± 0.0362121 99.7 ± 0.00322 21.6 ± 0.0218166 104.9 ± 0.00345 35.6 ± 0.0555196 108.3 ± 0.00330 52.8 ±0.108203 109.0 ± 0.00375 56.3 ± 0.138
Table 2: For different temperature differences across the stack, the resonance fre-quency and quality factor for the thermoacoustic engine were determined. As thetemperature difference increases, the resonance frequency increases, as well, due tothe increase in the speed of sound as the temperature within the flask increases. Thequality factor is shown to increase with increasing temperature differences, which isassociated with a decrease in the resistance.
0
0.2
0.4
0.6
0.8
1
90 95 100 105
A/A
max
Frequency (Hz)
Resonance Frequency of Empty 5-Liter Helmholtz Flask
f0 = 97.5 ± 0.00297 Hz
Q = 70.1 ± 0.184
Experimental DataFit Line
25
0
0.2
0.4
0.6
0.8
1
1.2
85 90 95 100
A/A
max
Frequency (Hz)
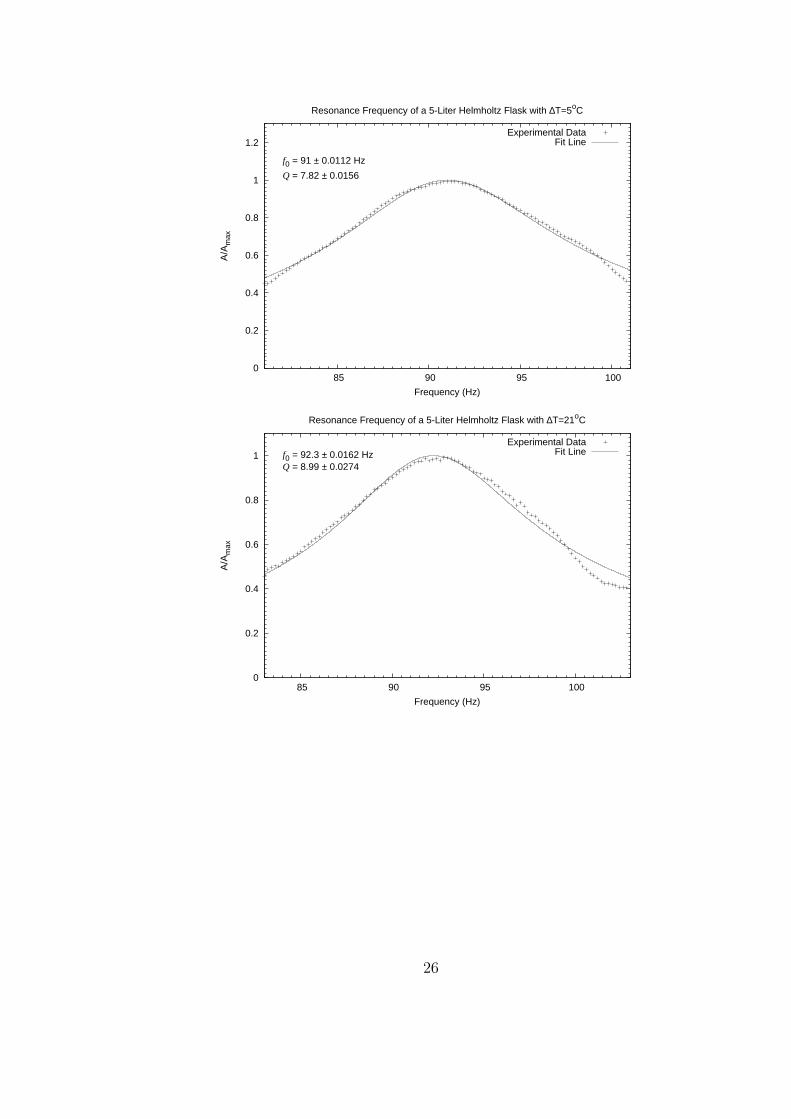
Resonance Frequency of a 5-Liter Helmholtz Flask with ∆T=5oC
f0 = 91 ± 0.0112 Hz
Q = 7.82 ± 0.0156
Experimental DataFit Line
0
0.2
0.4
0.6
0.8
1
85 90 95 100
A/A
max
Frequency (Hz)
Resonance Frequency of a 5-Liter Helmholtz Flask with ∆T=21oC
f0 = 92.3 ± 0.0162 HzQ = 8.99 ± 0.0274
Experimental DataFit Line
26
0
0.2
0.4
0.6
0.8
1
85 90 95 100 105
A/A
max
Frequency (Hz)
Resonance Frequency of a 5-Liter Helmholtz Flask with ∆T=68oC
f0 = 95.6 ± 0.0105 HzQ = 14.3 ± 0.0362
Experimental DataFit Line
0
0.2
0.4
0.6
0.8
1
90 95 100 105
A/A
max
Frequency (Hz)
Resonance Frequency of a 5-Liter Helmholtz Flask with ∆T=121oC
f0 = 99.7 ± 0.00322 HzQ = 21.6 ± 0.0218
Experimental DataFit Line
27

0
0.2
0.4
0.6
0.8
1
95 100 105 110
A/A
max
Frequency (Hz)
Resonance Frequency of a 5-Liter Helmholtz Flask with ∆T=166oC
f0 = 105 ± 0.00345 HzQ = 35.6 ± 0.0555
Experimental DataFit Line
0
0.2
0.4
0.6
0.8
1
100 105 110 115
A/A
max
Frequency (Hz)
Resonance Frequency of a 5-Liter Helmholtz Flask with ∆T=196oC
f0 = 108 ± 0.0033 HzQ = 52.8 ± 0.108
Experimental DataFit Line
28
0
0.2
0.4
0.6
0.8
1
100 105 110 115
A/A
max
Frequency (Hz)
Resonance Frequency of a 5-Liter Helmholtz Flask with ∆T=203oC
f0 = 109 ± 0.00375 HzQ = 56.3 ± 0.138
Experimental DataFit Line
0
0.02
0.04
0.06
0.08
0.1
0.12
0.14
0 50 100 150 200
Inve
rse
Qua
lity
Fac
tor,
1/Q
Temperature Difference across Stack (oC)
1/Q = (-0.000554 ± 4.12e-005)∆T + (0.121 ± 0.006)
Experimental DataFit Line
29

Appendix C: Mathematica Notebook
This sample from the Mathematic notebook creates a file that lists the frequency at
which the engine is being driven, the real impedance, and the imaginary impedance.
30

31
References
[1] L.E. Kinsler, A.R. Frey, A.B. Coppens, and J.V. Sanders. Fundamentals of
Acoustics, 3rd edition. John Wiley & Sons, New York, NY, 1982.
[2] Steven L. Garrett. ”Resource Letter: TA-1: Thermoacoustic engines and refrig-
erators,” American Journal of Physics 72(1), 11-17 (2004).
[3] G.W. Swift. Thermoacoustics– A Unifying Perspective for Some Engines and
Refrigerators, Acoustical Society of America, Melville, NY, 2002.
[4] Beranek, Leo L. Acoustics, Acoustical Society of America, Woodbury, NY, 1996.
[5] Pierce, Allan D. Acoustics: An Introduction to Its Physical Properties and Ap-
plications, 2nd Edition, Acoustical Society of America, Melville, NY, 1989.
32