Impacts of Tobacco Taxation on Income Equity in Vietnam · PDF fileThe paper tries to find out...
33
Cu Chi Loi, Ph.D. The Collaborative Funding Program for Southeast Asia Tobacco Control Research Financial support from The Rockefeller Foundation and Thai Health Promotion Foundation IMPACTS OF TOBACCO TAXATION ON INCOME EQUITY IN VIETNAM
Transcript of Impacts of Tobacco Taxation on Income Equity in Vietnam · PDF fileThe paper tries to find out...

Cu Chi Loi, Ph.D.
The Collaborative Funding Program for Southeast Asia Tobacco Control Research
Financial support from The Rockefeller Foundation and
Thai Health Promotion Foundation
IMPACTS OF TOBACCO TAXATION ON INCOME
EQUITY IN VIETNAM

1
IMPACTS OF TOBACCO TAXATION ON INCOME EQUITY IN VIETNAM
Cu Chi Loi, PhD Vietnam Institute of Economics
Hanoi, Vietnam
Supported by
Southeast Asia Tobacco Control Alliance (SEATCA) Under The Collaborative Funding Program for Tobacco Contorl Research
Financial support from
The Rockefeller Foundation and Thai Health Promotion Foundation (ThaiHealth)
February 2008

2
TABLE OF CONTENTS
Acknowledgements 6
Executive Summary 7
1. Introduction 9
2. Tobacco Taxation and its Role in Budget Revenue 11
3. Tobacco Consumption in Vietnam 14
4. Impacts of Tobacco Taxation on Income Equity: Methodology and Data 17
4.1. Methodology 17
4.2. Data 21
5. Results and Comments 23
6. Conclusions 26
References 27
Appendices 28

3
LIST OF TABLES
Table 1 Special tax rates for cigarettes in Vietnam in 1999 12 Table 2 State budget contribution in the 1995-2000 period 12 Table 3 Smoking prevalence rate categorized by gender and area in 2002 14 Table 4 Consumption of over 10 cigarettes per day, by gender and urban/rural areas in 2002 among current smokers 15 Table 5 Average price per pack of cigarettes, purchase rate under VND 2000 per pack (%), categorized by living standards and gender (smokers) 15 Table 6 Special tax rate 21 Table 7 Average Expenditure (of tobacco) per capita, share of tobacco expenditure in total expenditure, average excise duty, share of excise duty in total expenditure, and average expenditure net of excise duty 23 Table 8 Share of consumption expenditure by each group in total consumption expenditure 24

4
LIST OF FIGURES/DIAGRAMS
Figure 1 Tax rate as percentage of retail price of Vietnam and selected countries in late 1990s 13 Diagram I Lorenz Curve 18
5
ABBREVIATIONS
VHS – Vietnam National Health Survey
GSO – General Statistical Office
VHLSS – Vietnam Household Living Standards Survey
VASS – Vietnamese Academy of Social Sciences
VND – Vietnamese Dong
WHO – World Health Organization
GDP – Gross Domestic Product
CPI – Consumer Price Index
6
ACKNOWLEDGEMENTS
This study is carried out under the joint grant from The Rockefeller Foundation and the Thai Health Promotion Foundation (ThaiHealth) with technical assistance from the University of Illinois at Chicago (UIC). The report benefited from fruitful discussions with many Vietnamese government officials, the Vietnam Steering Committee on Smoking and Health (VINACOSH), foreign and national experts. The completion of this report would not have been possible without the assistance of many officials from the Ministry of Finance, Ministry of Industry, and General Statistical Office, who helped in providing data required for this study. We wish to express our sincere thanks to Ms. Menchi G. Velasco, Program Manager of The Collaborative Funding Program for Tobacco Control Research for all her support. We also wish to acknowledge the valuable comments from Dr. Hana Ross, the Deputy Director of International Tobacco Evidence Network (ITEN). Cu Chi Loi, PhD Vietnam Institute of Economics Hanoi, February 2008

7
EXECUTIVE SUMMARY
Tobacco use is a social phenomenon in Vietnam. A significant share of the population, especially men, consumes tobacco products. Although the tobacco use prevalence rate in Vietnam seems to have declined in the past decade, nonetheless the rate is still high - about 56% among men and 2% among women (Vietnam Household Survey, VHS 2001-2002). In confronting this problem, the Vietnamese Government launched a campaign against smoking through the issuance of a Government Resolution on “National Tobacco Control Policy” in the period of 2000-2010 in 2000 with the aim of bringing down tobacco use prevalence rate to 20% for male and 2% for female by 2010. One of the most powerful instruments in controlling smoking is tax. Although tax can be used to discourage and limit smoking, it can negatively impact on the poor and subsequently on income inequality. The tax of tobacco products in Vietnam is quite low compared to other countries, about 35% of retail price while it is more than 50% in many other countries. The low tobacco taxation has resulted in the price of tobacco in general and cigarette in particular in Vietnam to be relatively low compared to cigarette price in other countries. In comparing Vietnam’s local brand cigarette price with similar ones in other countries (posted in Tobacco Control Country Profiles by America Cancer Society, 2000), we found that the price of Vietnam’s local brand cigarette in 1999 was much lower than in many other developing countries. For example, the price of local brand cigarettes in Vietnam was about 66% that in Indonesia, 55% in Thailand, 50% in Kenya, 47% in Bangladesh, and 44% in India. Even if one compares the cigarette price of that year with that of the current cigarette price in Vietnam (2006-2007), the cigarette price in Vietnam is still lower than in other countries in 1999. The low tax (and as a result, a low price) of tobacco products in Vietnam is believed to be the main reason causing the high rate of smoking prevalence (see below), and this also suggests that the tax increase of tobacco products could be a good measure to control smoking in country. Although some sources indicate the declining of tobacco use prevalence rate, the rate is still high. Smoking prevalence rate is highest in the poorest group and the lower the rate was, the higher the income was. By 2002, the rates were 62.3 percent for men and 4.3 percent for women in the poorest group while these rates were 50.7 percent and 1.4 percent in the rich group, respectively (VHS 2001-2002). The share of tobacco consumption expenditure in total expenditure was not high, about 1% of the total household expenditure. The share of tobacco expenditure of the richest group was lowest, 0.79% while the share of the poorest group was 1.13% (VHS 2001-2002). The poor usually smoke cheaper cigarettes, which can be either water pipe, chewing, roll-up, non-filter or filter cigarette produced by domestic material. Conversely, the rich often consume expensive cigarette produced by imported materials and even cigar. The higher the income of household is, the higher the amount of tobacco tax paid is. Mean excise duties that quintiles (from bottom to top) pay are VND 3.5; 6.7; 8.5; 11.1; and 13.9 thousands (VHS 2001-2002). As a result, the poorer pay tax lower and the richer pay higher tax.

8
Imposing excise tax on tobacco product probably causes negative impact on income equity. In order to investigate this possibility, the estimation on Gini, Atkinson, and Theil indexes have been carried out using Vietnam Household Survey data for 2001-2002 by Vietnam General Statistic Office for two categories of households: with and without tax imposition. All estimates of inequality indices are slightly higher for category of with-tax-imposition, but the differences of these indices are not so significant, and if one rounds up these figures to two decimals, the differences are zero. By the estimation results one can make conclusion that the impact of tobacco taxation on the income inequality is trivial. This means that the imposing the (current) tobacco taxation does not cause any bad impact on income inequality. From this estimation result and with other evidences (on smoking prevalence and the relative low tax and low price of cigarettes in Vietnam around the paper) the most important conclusion needs to be made is that the current tobacco taxation in Vietnam should be reformed in the manner of imposing a higher tax rate for both types of cigarettes to bring down smoking prevalence for all groups of smokers and much more higher tax rate on imported and luxury cigarettes to bring down the income gap between the rich and the poor.

9
INTRODUCTION Tobacco use is a social phenomenon in Vietnam. A significant share of the population, especially men, consumes tobacco products. Although the tobacco use prevalence rate in Vietnam seems to have declined in the past decade, nonetheless the rate is still high - about 56% among men and 2% among women (VHS 2001-20021). Like the smoking patterns in many other developing countries, the smoking prevalence rate in Vietnam is also higher for disadvantaged groups, ie. 62.3% for men and 4.3% for women in the poorest group (VHS 2001-2002). Cigarette smoking impacts negatively on health. According to WHO’s (World Health Organisation) prediction, 10% of Vietnamese will die prematurely from tobacco-use-related diseases and half of them will die in their productive middle age (Eozenon, 2004). Moreover, cigarette smoking affects more severely the poor because the money they spend on tobacco can be used to buy food and non-food items as well as medicine and health services to treat diseases that are caused by tobacco use. In confronting this problem, the Vietnamese Government launched a campaign against smoking through the issuance of a Government Resolution on “National Tobacco Control Policy” in the Period of 2000-2010 in 2000 which aim to bring down tobacco use prevalence rate to 20% for male and 2% for female by 20102. One of the most powerful instruments in controlling smoking is tax. Although tax can be used to discourage and limit smoking, it can negatively impact on the poor and subsequently on income inequality. On one hand, the existing tobacco tax can exacerbate income inequality because tobacco tax can be regressive. On the other hand, a tax increase can reduce income inequality because lower income population is more price sensitive, therefore will reduce expenditures on tobacco products (and related tax payment) more compared to high income population. In addition, higher cigarette taxes will increase budget revenue that can be further used to diminish the income inequality. Thus, it is necessary to know whether or not the impact of tobacco taxation on income equity in Vietnam is regressive or progressive, especially when the income inequality has been increasing in the period of 1993-2004 (VASS, 2007) and Vietnamese Government is saving every opportunity to reduce income inequality. The paper tries to find out impacts of tobacco taxation on income equity (or income inequality) in Vietnam. Besides Introduction, Section 2 describes tobacco tax and its role in budget revenue. Section 3 indicates tobacco consumption in Vietnam. Although we can divide the consumption pattern by gender, age, area, occupation, education level, ethnic group and so on, we mainly consider the spending pattern by income quintiles because we are investigating the impact of tobacco taxation on income equity. Part 4
1 Vietnam National Health Survey 2001-2002 will be described in more detail in Appendix because of the many tables collected from this survey. 2 Government Resolution on “National Tobacco Control Policy” in the period 2000-2010, No. 12/2000/NQ-CP.

10
shows the methodology and data that will be applied to consider the impacts of tobacco taxation on income inequality. The idea behind the methodology is simple: we measure some indices of income inequality with and without tobacco tax to know whether or not tobacco taxation affects income inequality. Part 5 indicates results and comments. Finally, Part 6 gives conclusions and findings.

11
TOBACCO TAXATION AND ITS ROLE IN BUDGET REVENUE
Tobacco producers in Vietnam are subject to three types of taxes: Value-added tax (VAT), corporate tax, and special sales tax. Value-added Tax (VAT) VAT was introduced in 1999 for replacing revenue tax, which was promulgated in 1990. It has four tax rates: 0%; 5%; 10% and 20%. Zero tax rate is applied for exporting firms, 5% applied for basic service or basic product, 10% applied for manufacturing or consumption goods; and 20% is for special businesses such as hotel, restaurant, jewelry products and the likes. However, the firms that are subject to special sale tax are exempted from VAT, and therefore tobacco production firms in Vietnam in fact are not subject to VAT. Corporate Income Tax Corporate income tax law was introduced in 1999 for replacing profit tax, which was promulgated in 1990. In general, in order to promote foreign investment in the country, some incentives have been made and given to foreign invested firms, and in this sense foreign invested firm can enjoy the soft corporate income tax. Domestic firms are subject to three tax rates: 25% for firms in heavy industry, 35% for firms in light industry and 45% for firms in commercial and service sector. Foreign invested firms are subject to a lower tax rate of 25%. Special Sales Tax Special sales tax was formed in 1990 and amended two times in 1993 and 1995. In 20 May 1998, the new Law on Special Sale Tax has been promulgated. The Special Sales Tax has 12 tax lines with the range between 15% and 100%. Eight products and 4 services are subject to the Special Sales Tax. The special sale (excise) tax in Vietnam is a main tax that tobacco production is subject to. Tobacco special sale tax in fact has been adjusted for several times in past decades. Despite the adjustment, the nature of tobacco special sales tax does not change that the tax rate is set based on type of tobacco material use in order to produce cigarette. The one that uses imported material is subject to the highest tax rate, and one that uses local material is subject to the lowest tax rate. As stipulated in the Law on Excise Tax (No. 05/1998/QH10) approved by National Assembly in 20 May 1998, the excise tax imposed on cigarette is as follow:

12
Table 1. Special tax rates for cigarettes in Vietnam in 1999
Tax rate (% of sale value)
Filter cigarette produced by imported material and cigar:
Filter cigarette produced by domestic material:
Non-filter cigarette:
65
45
25 Source: According to Law on Excise Tax approved by the Vietnamese National Assembly in 20 May 1998. The adjustment in past years over the special sale tax mostly is on the tax rate for cigarettes with different types of material use3. The motivation of setting different tax rate is to promote local material production such as tobacco leaves. As shown in the Table 1, the non-filter cigarettes are subject to the lowest tax rate. In fact, the non-filter cigarettes mostly are produced by very low quality of local materials and generally the production of this type of cigarette is not so profitable, and therefore these cigarettes are subject to the lowest rate of special tax. Although the shares of tobacco industry output to total industrial output (3% of year 2000) and manufacturing output (3.5% of year 2000) were not so dominant, the industry contributed a significant share to total state budget revenue. As indicated in Table 2, the industry contributed about 3% of total state budget revenue in 2000. This is comparable to tax collected on housing and land.
Table 2. State budget contribution in the 1995-2000 period
Unit: billion VND
1995 1996 1997 1998 1999 2000
Total state revenue 60,844 62,766 70,822 76,128 88,764 84,375
State budget contribution of tobacco industry
1,461.6
1,727.2
1,889.2
2,072.4
2,378.6
2,708.2
Share of the industry of tobacco in total state revenue (%)
2.4 2.7 2.4 2.7 2.7 3.2
Source: Tobacco General Corporation (1998, 2001).
For Vietnam, tobacco industry is an important source of state budget revenue. However, the tax contribution of the industry could be higher if the tax rate in Vietnam is as high as 3 Prior to 1999, filtered cigarettes produced mainly by imported materials were imposed a tax rate of 70 percent. Filtered cigarettes produced mainly by domestic materials were imposed a tax rate of 52 percent. And a tariff rate on imported cigars was 70 percent (Hoang Van Kinh et al, 2006).

13
in other countries. The data from the World Bank indicate that Vietnam is one country that has very low tax rate compared to many other countries around the world.
Figure 1. Tax rate as percentage of retail price of Vietnam and selected countries in late 1990s
Source: Frank J. Chaloupka et. al, The Taxation of Tobacco Products (2000)
The Figure 1 shows that the tax of tobacco products in Vietnam is quite low compared to other countries. The low tobacco taxation has resulted in the price of tobacco in general and cigarette in particular in Vietnam to be relatively low compared to cigarette prices in other countries. In comparing Vietnam’s local brand cigarette price with similar ones in other countries (posted in Tobacco Control Country Profiles by American Cancer Society, 2000) we found that the price of Vietnam’s local brand cigarette in 1999 was much lower than in many other developing countries. For example, the price of local brand cigarettes in Vietnam was about 66% that of in Indonesia, 55% in Thailand, 50% in Kenya, 47% in Bangladesh, and 44% in India. Even if one makes a comparison of the cigarette price of that year with current cigarette price in Vietnam (2006-2007), the cigarette price in Vietnam is still lower than in other countries in 1999. The low tax (and as a result, a low price) of tobacco products in Vietnam is believed to be the main reason for the high rate of smoking prevalence (see below), and this also suggests that the tax increase of tobacco products could be a good measure to control smoking in the country.
0
10
20
30
40
50
60
70
80
Cambo
diaSr
i Lan
kaBan
glade
shZam
biaInd
ones
iaUnit
ed St
ates
VIET N
AMChin
aBulg
aria
ElSalv
ador
Jamaic
aTur
key
Colombia
Armen
iaVen
ezue
laSw
itzerl
and
Japa
n
Korea
,Rep
ublic
ofBoli
viaTha
iland
Phili
ppine
sNew
Zealan
dSw
eden
Albania
Netherl
ands
Spain
Pakis
tan Italy

14
TOBACCO CONSUMPTION IN VIETNAM Smoking was a long and traditional habit in Vietnam. The smoking includes several products of tobacco such as water pipe smoking, chewing, and cigarette. Using water pipe smoking and chewing is very popular among old people, while cigarette smoking is favor of young generation. The smoking, due to its convenience to consume, has become the most popular way of tobacco consumption, even for old people nowadays. In early 1990s, tobacco control campaign was launched out not only with some economic measures (e.g., import control), but also with some other non-economic measures (e.g., propagandas on the negative impact of tobacco use, tobacco advertising prohibition). As a result, the observed tobacco use prevalence rate in Vietnam reduced in last decade, from 63% in 1993 to 56% in 2002 among men and from 5% in 1993 to 1.8% in 2002 among women (WHO, 1997; VHS 2001-2002). However, some of this decline might be the result of differences in the methodology of data collection. Smoking prevalence rate was highest in the poorest group and the lower the rate was, the higher the income was. The rates were 62.3% for men and 4.3% for women in the poorest group while these rates were 50.7% and 1.4% in the rich group, respectively. It is interesting to note that smoking prevalence rate among men was higher in the urban area than that in the rural area except for the richest group.
Table 3. Smoking prevalence rate categorized by gender and area in 20024
Unit: Percent
Man
Man Woman Number of man(15+)
Number of woman(15+) Urban Rural
General (15+) 55.1 56.4 56.1 1.8 48256 55781 Poorest 69.3 61.6 62.3 4.3 8321 9734 Near-poor 64.1 59.3 59.8 1.7 8510 9927 Middle 60.6 54.8 55.7 1.4 9520 10881 Quite 57.2 53.3 54.3 1.4 10619 12383 Rich 49.9 51.7 50.7 0.9 11219 12787
Source: VHS 2001-2002
Although Table 3 indicates the smoking prevalence rate in terms of gender and area, it does not show the intensity of smoking. The table below expresses the proportion of man and woman who smoke more than 10 cigarettes per day among smokers.
4 Smoking prevalence includes use of cigarettes, pipes, and hand rolled.

15
Table 4. Consumption of over 10 cigarettes per day, by gender and urban/rural areas in 2002 among current smokers
Unit: percent Man
Man (4)
Woman (5) Only cigarette
(1)
Only pipe tobacco, roll-up
(2)
Both (3)
General 34.9 51.7 73.2 41.7 17.5 Living standards Poor 39.2 55.2 78.8 48.8 21.3 Near-poor 38.8 52.7 70.9 46.2 11.4 Middle 35.7 48.5 69.3 42.4 20.7 Quite 33.3 50.7 75.4 39.1 13.2 Rich 31 40.2 74.5 33.2 15.1 Urban/Rural Urban 32.1 46.2 78.5 35.5 16.7 Rural 38.4 52.3 73.3 45.4 17.7
Note that columns (1) and (2) show the proportion of male smokers smoking over 10 cigarettes per day and over 10 tobacco pipes and roll-ups per day, respectively. Column (3) indicates the proportion of those consuming over 10 cigarettes per day among male smokers using both types of tobacco. Columns (4) and (5) include the smoking prevalence rates of those smoking more than 10 cigarettes per day (either cigarettes, pipes, or hand rolled) among all smokers. One cigarette is equivalent to one pipe tobacco or one roll-up.
Source: VHS 2001-2002.
The proportion of male smokers smoking more than 10 tobacco pipes and roll-ups was much higher than the proportion of male smoking more than 10 cigarettes, at 52% and 35%, respectively. Based on Table 3, it can be seen that the lower the smoking prevalence, the higher the living standards. In other words, the relationship between smoking prevalence rate and income was negative. Table 5. Average price per pack of cigarettes, purchase rate under VND 2000 per pack (%), categorized by living standards and gender (smokers)
Man Woman
Average price
(thousand dongs)
Purchase rate under VND 2000
per pack (%)
Average price(thousand
dongs)
Purchase rate under VND 2000
per pack (%) General 3.9 24.2 2.7 41.2 Poor 2.2 41.4 1.9 55.6 Near Poor 2.5 34.3 2.2 49.1 Middle 2.9 27.4 2.4 47.4 Quite 3.8 21.6 3.1 33 Rich 6.3 9.2 3.9 18.2
Source: Estimated from VHS 2001-2002.

16
The higher the income that the consumer has, the higher the price of tobacco he (she) consumes. This is normal because when the consumer’s income is higher, he (she) tends to consume higher-quality products which are at higher price. On average, women consumes cheaper cigarette than men in the same quintile and the proportion of women spending on cheap pack is higher than the proportion of men in all quintiles. For example, in the bottom quintile, men spend on average VND 2.2 thousands on a pack while women spend on average VND 1.9 thousands on a pack. The proportion of men consuming a less than VND 2000 pack is 41.4%, but this proportion is 55.6% for woman.

17
METHODOLOGY AND DATA
4.1. Methodology5
To know the impacts of tobacco taxation on income equity, our idea is straightforward: First, estimating some important indexes of income inequality (e.g., Gini, Atkinson, Theil, and mean logarithmic deviation) with and without tobacco taxation. Then, comparing these respective indices with and without the excise tax. Before estimating these indices, it is necessary to discuss which quantity (income or expenditure) will be used to examine the indices. In many research papers, expenditure is usually used to measure income inequality; this stems from two reasons. Firstly, income often fluctuates over years (or seasons and even months). Thus, income cannot be the best measure to reflect household welfare. Contrary to income, expenditure fluctuates less due to some of the following reasons. Household’s expenditure bases much on permanent income but not on transitory income and pattern of expenditure does not change much over the years. If expenditure exceeds income, household can borrow from formal financial institutions (banks, funds) or informal institutions (relatives, friends, or lenders)6. Anyways, households usually want to smooth their consumption expenditure and thus the consumption expenditure can be used as a proxy for household welfare. Secondly, in household surveys, measurement of income often contains many errors. It is difficult for household to remember sources of income while it is much easier for them to remember destinations of expenditure. For these reasons, in the following section, we will use consumption expenditure data instead of income in measuring inequality. In our estimation, the inequality will be measured through different indices, for example Gini (G), Atkinson (A, for e = 0.5 and e = 2), Theil (T), and the mean logarithmic deviation (N). - The Gini coefficient: The Gini coefficient is used widely to measure income inequality. It has a value from nil to unit. If it is unit, the income is completely unequal and this means one person (or household) holds all society’s income. If it is nil, the income is distributed equally among households. Gini coefficient can be defined through Lorenz curve diagram. It is the ratio of two areas, one is between the line of perfect equality and Lorenz curve and the other is the area of the triangle.
5 In this paper, the methodology used is based on that in Tsakloglou and Mitrakos (1998)’s paper. 6 Consumption expenditure is less fluctuated when financial market there is operated well or in place. Household can borrow easily from financial institutions, relatives, and friends.

18
Diagram I: Lorenz Curve
As indicated in the Diagram I, let A be area between the line of perfect equality and Lorenz curve (the red one) and let B be area under the Lorenz curve, the Gini coefficient can be calculated as:
)/( BAAG +=
However, 5.0=+ BA ,
so
BAAG 2125.0/ −===
Suppose that Lorenz curve has function )(Xff = , the Gini coefficient can be expressed in the form:
∫−=1
0
)(21 dXXfG
In general, the Gini coefficient is given by
( )( )⎥⎦
⎤⎢⎣
⎡+−⎟
⎠⎞
⎜⎝⎛−⎟
⎠⎞
⎜⎝⎛+= ∑
=
n
iiyiN
NmNG
12 1
.211 , (1)
A B

19
where persons are ranked in ascending order of iy (income or consumption expenditure
of ith person), N is sum of weights over person (or household) ( ∑=
=n
iiwN
1), m is
average income, iw is weight of ith person.
Gini coefficient has characteristics that it is most sensitive to income differences about the mode.
- The Atkinson index: The Atkinson index is a supplementary index of income inequality to Gini coefficient. It is developed by Anthony Barnes Atkinson to measure the economic income inequality.
The Atkinson indices can be defined by
en
i
eii yf
meA
−
=
−⎥⎦
⎤⎢⎣
⎡−= ∑
11
1
1.11)( for 1≠e and 0>e (2)
where m is average income of population, ( )Nwf ii = , and e is the value of the weighting parameter that measures aversion of inequality.
The larger e is, the more sensitive )(eA is to income differences at the bottom of the distribution.
- Generalized Entropy:
In addition to Gini or Atkinson indices, one can use the Generalized Entropy (GE) class to estimate the income distribution. GE class of inequality indices can be expressed as:
⎥⎥⎦
⎤
⎢⎢⎣
⎡−⎟
⎠⎞
⎜⎝⎛
−= ∑
=
n
i
ii m
yfGE
11
)1(1)(
α
ααα , 0≠α , 1≠α (3)
where α is the parameter in the GE class that indicates the weight given to distances between incomes at different groups of the income distribution. The more negative α is, the more sensitive GE class is to differences at the bottom of the distribution. The mean logarithmic deviation can be derived from GE class when 0=α and the Theil index can also be derived from GE class when 1=α . The mean logarithmic deviation and the Theil index can be written as follows:
∑=
⎥⎦
⎤⎢⎣
⎡⎟⎟⎠
⎞⎜⎜⎝
⎛==
n
i ii y
mfMLDGE1
log)0( (4)
∑=
⎥⎦
⎤⎢⎣
⎡⎟⎠⎞
⎜⎝⎛
⎟⎠⎞
⎜⎝⎛==
n
i
iii m
ymy
fTGE1
log)1( (5)

20
All above indices satisfy the basic axioms of inequality measure, namely:7 Mean independence (the index of inequality is unchanged if all consumption expenditures are doubled); Population size independence (index of inequality is unchanged if the population is to change, ceteris-paribus); Symmetry (index of inequality is unchanged if consumption expenditures are swapped between two different individuals); and Pigou-Dalton Transfer sensitivity (inequality will be reduced if income is transferred from the rich to the poor). It is easy to calculate the above indices with tobacco taxation. However, it is quite difficult when indices are calculated without tobacco taxation because we must subtract tobacco tax from expenditure on tobacco and then from total consumption expenditure. In other words, we must know how much tax in the tobacco price that the household must pay.8. This question is quite thorny. In other countries, when the tobacco taxation is uniform, it is straightforward to examine proportion of tobacco tax that consumer must pay in price of tobacco. But it is extremely difficult to know exactly the tobacco tax the consumer must pay when there exist three kinds of tax rates which depends on the types of material used to produce the tobacco (see Table 1). Thus, we will use some techniques to solve the problem. We know, according to VHS 2002, the proportion of men who buy cigarettes at less than VND 2000 per pack and the proportion of men who buy them at above VND 2000 per pack. We also know, according to Table 1, special tax rates for each kind of cigarette (divided by material input). There are three special tax rates, but we just know two kinds of tobacco basing on their prices. If the price is higher than VND 2000, we can assume that it must incur special tax rates, either 65% or 45%. In the tobacco market, the cigarettes that are priced at more than VND 2000 are mostly filtered ones which used imported materials. We average the special tax rates, 65% and 45% for these cigarettes to arrive at a rate of 55%. If the price of of a pack is lower than VDN 2000, we can assume that it must incur special tax rates of either 45% or 25%. This kind of cigarettes includes those that are produced by domestic material and/or non-filter cigarette. The average of 45% and 25% is 35% which is a special tax rate imposed on a tobacco pack of under 2000 dong. As mentioned above, we have information on the proportions of men who buy a pack under VND 2000 and over 2000 VND (divided by income group, e.g., poor group, near-poor group, middle group, quite group, and rich group). We can consider these proportions as probability that one household who consumes the product of tobacco encounters. Thus, we can eventually calculate the special tax rate that one household must incur when buying tobacco. For example, the simulated special tax rate of the poor group can be calculated by the sum of products of 0.414*35(%) and of 0.586*55%. The results is 46.7(%) as indicated in column (3) of Table 6.
7 See World Bank (2005). 8 In this paper, similar to many other papers (e.g., Haughton et al, 2004), we assume the consumer must pay entirely tobacco tax.

21
Table 6. Special tax rate
Male percentage buying tobacco under 2000 dong per pack (%)
(1)
Male percentage buying tobacco above 2000 dong per pack (%)
(2)
Simulated special tax rate
(%) (3)
Poor 41.4 58.6 46.7 Near-poor 34.3 65.7 48.1 Middle 27.4 72.6 49.5 Quite 21.6 78.4 50.7 Rich 9.2 90.8 53.2
Source. Columns (1) and (2) collect from VHS 2001-2002 and column (3) are calculated by authors.
To know how much the tobacco tax one household must pay, we multiply the expenditure on tobacco with the ratio of the simulated tax rate over unit plus the simulated tax rate9. And then, we subtract the amount of tobacco tax from total expenditure to obtain the consumption expenditure without tax. Finally, we calculate indices of inequality with and without the tobacco tax. After examining the indices of inequality with and without tobacco tax, we compare them and consider whether or not the impact of tobacco taxation on income equity is good (tax is progressive).
4.2. Data
In Vietnam, there are several databases which can be used for analyzing the income distribution such as Vietnam Household Living Standards Surveys (VHLSS) 1992-93; 1997-98; 2001-2002; and 2004. In this report, the 2001-2002 VLSS is used. The reason to choose 2001-2002 VLSS is that it was conducted at the same time with the Vietnam Health Survey for which the data on tobacco use has been used for this report. VHLSS 2001-2002 carried out by General Statistic Office (GSO) with the funding of UNDP and technical support from World Bank over 61 central cities, provinces. The survey was divided into two sample types: income and expenditure questionnaire (for 30,000 household samples) including income and expenditure section; and only income questionnaire (for 45,000 household samples).
In this paper, the small sample (30,000 households) will be used to estimate the impact of tobacco taxation on income inequality. The sample reflects living standard of each member of household and the basic socio-economic conditions - both information about income and expenditure at central and provincial levels. These samples were distribution in the provinces and cities and square root method was applied. The samples were not
9 See Appendix 2 to understand the method used for calculating the amount of tobacco tax the household incurred.

22
distribution of households by direct ratio to population of each province but these were higher ratio to smaller population in the provinces and were inversely proportional.
The VHLSS 2002 questionnaire comprised 9 sections including: Section 1 (List of household members), Section 2 (Education), Section 3 (Employment), Section 4 (Health), Section 5 (Income), Section 6 (Expenditure), Section 7 (Fixed assets and durable things), Section 8 (Housing), and Section 9 (Participation in poverty alleviation programs). The expenditure section collected information of expenditure on food and drink, non-food and non-drink, and other from self-made products consumed and bought in market (quantity and total expenditure for each good). The expenditure for tobacco consumption can be extracted from this section. Each commodity in expenditure section is coded by a number with the first three digits. To adjust for household size, we calculate total consumption expenditure per capita (divide household size by total expenditure). Moreover, the weight of individual is taken into account. The individual weight is calculated by multiplying household weight and household size. It is equal to the inverse of probability that individual is chosen. The individual weights were employed to calculate the indices of inequalities.

23
RESULTS AND COMMENTS The share of tobacco consumption expenditure in total expenditure was not high, about 1% of the total household expenditure. The share of tobacco expenditure of the richest group was lowest, 0.79% while the share of the poorest group was 1.13%.10 If tobacco consumption is considered to be “bad”, the worse the poor household was, the higher the share. When the income is higher, the household spends more on tobacco in absolute terms, meaning that tobacco is a superior good. The bottom quintile had average tobacco expenditure per capita of VND 11 thousands. The second quintile was VND 21 thousands, the third quintile was VND 26 thousands, the fourth quintile was VND 33 thousands, and the fifth quintile was VND 40 thousands. The poor usually smoke cheaper cigarettes, which can be either be water pipe, chewing, roll-up, non-filter or filter cigarette produced by domestic material. Conversely, the rich often consume expensive cigarette produced by imported materials and even cigar. The relationship between the income and the amount of tobacco tax paid is similar to the relationship between the income and the tobacco consumption expenditure. The higher the income of household is, the higher the amount of tobacco tax paid. Mean excise duties that quintiles (from bottom to top) pay are VND 3.5; 6.7; 8.5; 11.1; and 13.9 thousands11, respectively. As mentioned above, the poor usually consume filter cigarettes (produced by domestic material), non-filter cigarette, water pipe smoking, chewing, and cigarette smoking. All of them have low taxes. Inversely, the rich consume high quality cigarettes produced by imported materials or cigar that are taxed high. As a result, the poor pays lower tax and the rich pays higher tax.
Table 7. Average expenditure (of tobacco) per capita, share of tobacco expenditure in total expenditure, average excise duty, share of excise duty in total expenditure, and average expenditure net of excise duty12
Quintile Mean expenditure
per capita (‘000 VND)
Mean expenditure of tobacco per capita
(‘000 VND)
Share of tobacco expenditure in total
expenditure (%)
Mean excise duty
Share of excise duty in total
expenditure (%)
Mean expenditure net of excise duty
1 1431 11.15 0.78 3.55 0.25 1427 2 2099 20.72 0.99 6.73 0.32 2092 3 2762 25.71 0.93 8.51 0.31 2753 4 3872 32.99 0.85 11.1 0.29 3861 5 8365 40.19 0.48 13.96 0.17 8351
Source: Estimated by using VLHSS 2002 data
10 These figures are only calculated for the households which have expenditure on tobacco. 11 See Appendix 2. 12 All numbers are calculated including all households with or without consuming tobacco products. Here, we pay much attention to level of quintiles other than level of households. If calculating only the households spending on tobacco products, the numbers would be different, but the trends and conclusions are unchanged.

24
When looking at the expenditure of tobacco per capita and the amount of excise tax paid, it is easy to see the expenditure pattern of household. The richer household spends more on tobacco product with higher price (and thus higher the amount of tax paid). However, it is more difficult to find any similar pattern trend when referring to share of tobacco expenditure in total expenditure (%) and share of excise duty in total expenditure (%). The top quintile has lowest share of tobacco expenditure in total expenditure, 0.48%. Bottom quintile has second-lowest one, 0.78%. And the second and third quintiles have the shares of tobacco expenditure, 0.99% and 0.93%, respectively.
Table 8: Share of consumption expenditure by each group in total consumption expenditure
Quintile Mean expenditure (%) (1)
Mean expenditure net of excise duty (%)
(2) 1 7.7230 7.7221 2 11.3282 11.3187 3 14.9064 14.8957 4 20.8970 20.8865 5 45.1454 45.1770
Gini (G) 0.37917 0.37950 (0.00087)
Atkinson (A, 5.0=e ) 0.11726 0.11746 (0.0017)
Atkinson (A, 1=e ) 0.20663 0.20694 (0.0015)
Atkinson (A, 2=e ) 0.33056 0.33092 (0.0011)
Theil (T) 0.26769 0.26822 (0.0019)
Mean log deviation (MLD) 0.23146 0.23186
(0.0017)
Note: figures in quotation mark are proportion between figures in column (2) and (1).
Source: Authors’ estimation from VLSS 2002.
Table 8 indicates the share of the expenditure by each group in total expenditure. First column of the upper part shows the share of each group in total consumption expenditure. The bottom quintile makes up 7.7%. The second, third, and fourth quintiles are of 11%, 15%, 21%, respectively. However, the richest group makes up 45% of total consumption expenditure of all quintiles. Second column of the upper part expresses the share of each group in total consumption expenditure when the amount of tax paid by household is subtracted from the total expenditure. There is no big difference between figures in the columns of the upper part. This is understandable because tobacco expenditure is quite small in total consumption expenditure of household. At the glance, all expenditure shares in the total expenditure
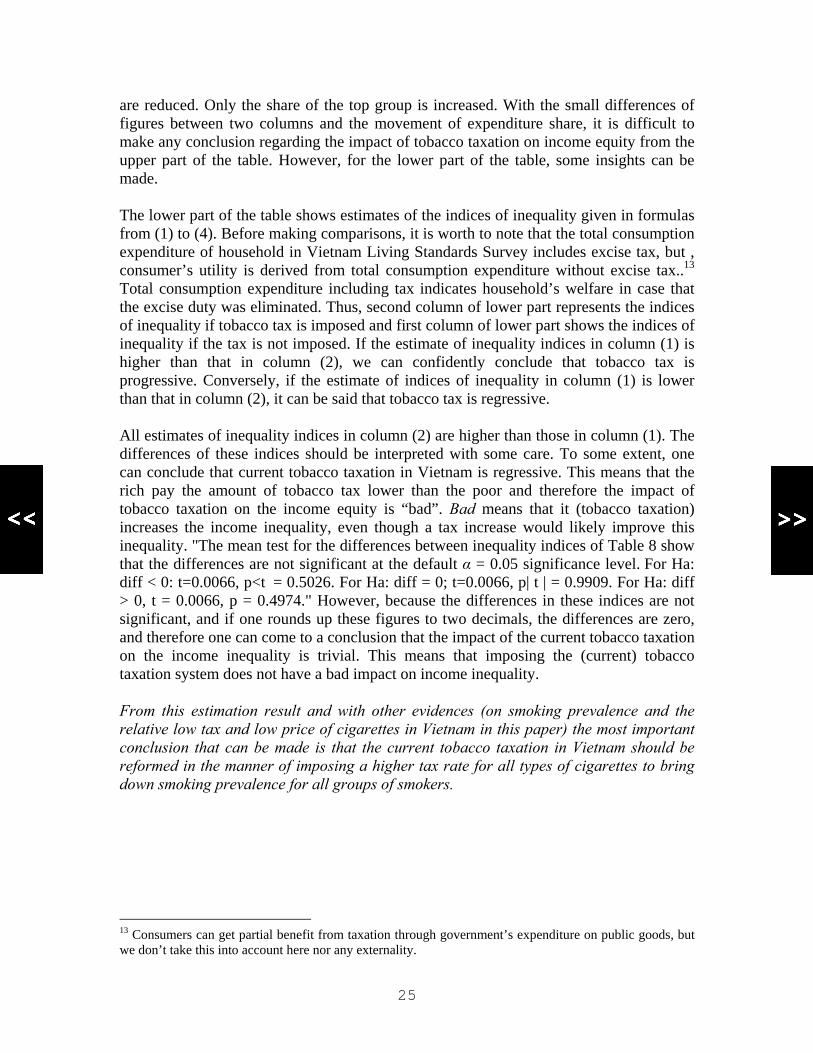
25
are reduced. Only the share of the top group is increased. With the small differences of figures between two columns and the movement of expenditure share, it is difficult to make any conclusion regarding the impact of tobacco taxation on income equity from the upper part of the table. However, for the lower part of the table, some insights can be made. The lower part of the table shows estimates of the indices of inequality given in formulas from (1) to (4). Before making comparisons, it is worth to note that the total consumption expenditure of household in Vietnam Living Standards Survey includes excise tax, but , consumer’s utility is derived from total consumption expenditure without excise tax..13 Total consumption expenditure including tax indicates household’s welfare in case that the excise duty was eliminated. Thus, second column of lower part represents the indices of inequality if tobacco tax is imposed and first column of lower part shows the indices of inequality if the tax is not imposed. If the estimate of inequality indices in column (1) is higher than that in column (2), we can confidently conclude that tobacco tax is progressive. Conversely, if the estimate of indices of inequality in column (1) is lower than that in column (2), it can be said that tobacco tax is regressive. All estimates of inequality indices in column (2) are higher than those in column (1). The differences of these indices should be interpreted with some care. To some extent, one can conclude that current tobacco taxation in Vietnam is regressive. This means that the rich pay the amount of tobacco tax lower than the poor and therefore the impact of tobacco taxation on the income equity is “bad”. Bad means that it (tobacco taxation) increases the income inequality, even though a tax increase would likely improve this inequality. "The mean test for the differences between inequality indices of Table 8 show that the differences are not significant at the default α = 0.05 significance level. For Ha: diff < 0: t=0.0066, p<t = 0.5026. For Ha: diff = 0; t=0.0066, p| t | = 0.9909. For Ha: diff > 0, t = 0.0066, p = 0.4974." However, because the differences in these indices are not significant, and if one rounds up these figures to two decimals, the differences are zero, and therefore one can come to a conclusion that the impact of the current tobacco taxation on the income inequality is trivial. This means that imposing the (current) tobacco taxation system does not have a bad impact on income inequality. From this estimation result and with other evidences (on smoking prevalence and the relative low tax and low price of cigarettes in Vietnam in this paper) the most important conclusion that can be made is that the current tobacco taxation in Vietnam should be reformed in the manner of imposing a higher tax rate for all types of cigarettes to bring down smoking prevalence for all groups of smokers.
13 Consumers can get partial benefit from taxation through government’s expenditure on public goods, but we don’t take this into account here nor any externality.

26
CONCLUSIONS Cigarette smoking is harmful to health. Tobacco use impacts not only on individuals (and households) but also on society. Instead of spending money on smoking, the individual can spend that money on food and foodstuff or other useful goods and services (e.g., education). Moreover, the individual also can “lose” money by consuming medicine and health services that relate to tobacco use. In society, when young people (and old people as well) smoke, their health is harmed and therefore their productivity is reduced. This influences negatively on domestic production in general. In confronting the high tobacco use prevalence rate, the Vietnamese Government has introduced a number of measures to discourage and limit cigarette users including through taxation. Although the estimation that tobacco tax increase has an impact on income inequality is not a good indication, nonetheless, the differences in the indicators are too small to conclude that tobacco tax in Vietnam has a negative impact on income inequality. The estimation results and other evidences found in this paper suggest that the current tobacco taxation in Vietnam should be further reformed. The tobacco tax in Vietnam needs be increased for all types of cigarettes and this increase can narrow the income gap between the rich and the poor. The higher tax on cigarettes will bring down the smoking prevalence rate and the government budget can be enlarged to fund the infrastructure, education, and other poverty reduction programs which can bring benefit to the poor.

27
REFERENCES
American Cancer Society, (2000), Tobacco Control Country Profile.
Chaloupka F. J, Hu T, Warner K. E., Jacobs R, Yurekli A., (2000), “The taxation of tobacco products,” in Tobacco Control in Developing Countries, edited by Jha. P, Chaloupka. F., 2000, 237-272.
Eozenon, P., (2004), Price Elasticity Estimation for Cigarette Demand in Vietnam, Centre d’Etudes et de Recherches sur le Dévelopment International.
Haughton J., Nguyen The Quan, and Nguyen Hoang Bao, “Tax Incidence in Vietnam,” Asian Economic Journal, Volume 20, No 2.
Hoang Van Kinh, Ross, H., Levy, D. T., Nguyen Thac Minh, and Vu Thi Bich Ngoc (2006), The Effect of Imposing a Higher, Uniform Tobacco Tax in Vietnam, Health Research Policy and Systems 2006, 4: 6.
Jha, P. & Chaloupka, F., (2000), Tobacco Control In Developing Countries, Oxford University Press
Nguyen Trong Khoa, Ly Ngoc Kinh, Dang Huy Hoang, Nguyen Tuan Lam, Phan Thi Hai, Ngo Le Thu, Nguyen Ngoc Khang (2005), Danh gia tinh hinh su dung thuoc la o Viet Nam theo dieu tra y te quoc gia nam 2001-2002, (Translated: Examining Tobacco Use Situation in Vietnam in accordance with National Health Survey in 2001-2002), [Accessed in http://www.vinacosh.gov.vn/nghiencuu/bai_11.asp].
Tobacco General Corporation, (1998, 2001), Annual Reports (unpublished).
Tsakloglou, P. and Mitrakos, T., (1998), “On the distributional impact of excise duties: Evidence from Greece,” Public Finance/Finances Publiques 53, pp. 78-101.
VASS (2007), The Poor Updated Report 2006: The Poor and Poor Reduction in Vietnam in the period 1993-2004, National Political Publisher, Hanoi.
Vietnam Household Survey, VHS 2001-2002.
World Bank (2005), Introduction to Poverty Analysis. WBI Social Protection Program.

28
APPENDICES

29
APPENDIX 1 Introduction to Vietnam National Health Survey14
Objectives
The Ministry of Health undertook the VNHS to collect information necessary to assess the effectiveness of policies implemented in the past and those currently being implemented (at the time of the survey) and to provide information for making new policy decisions. The VNHS provides the most abundant database on the health sector at this time which will help the Ministry of Health and other experts assess equity and efficiency in an objective manner as the data were collected from the households, who are the beneficiaries of the policies.
Contents Prior to designing the VNHS, with technical assistance of international health experts recruited through the World Bank, health information needs of the various Departments, offices and leaders of the Ministry of Health were laid out and a group of Ministry of Health experts were mobilized to write the policy framework, describing the future orientation of health policies and information needs to conduct research on those problems. The VNHS provides much information necessary to analyze policies of current interest including monitoring health goals, coverage of public health programs, health care utilization patterns and health service expenditures, quality of health care, use of private sector health services, effect of health insurance and reduction/exemption policies on health care utilization and expenditures. One large contribution of the VNHS is that it did not only provides information on utilization and provision of health services, but it also provides information on the socio-economic-geographic context which allows one to assess equity in health care services and contribute substantially to new policies being designed to increase access to health services by the poor.
The VNHS includes three components; a household survey, survey of commune leadership and survey of health care providers. Thus one can exploit information on the household in relation to health facilities to analyze the correlation between provider characteristics and health service use. The purpose of the survey is to collect information to assist in evaluating and designing appropriate policies in the health sector. The content of the survey is very comprehensive. In the household questionnaires information on household background including living standards, disabilities, use of medications, preventive medicine, living environment, mortality, reproductive health, childcare, illness, inpatient, out-patient and self-treatment health insurance, lifestyles and anthropometric measures. The commune leadership form collects information on finance, environment, population and infrastructure in the communities where the survey was implemented. The provider survey collects information on facilities, equipment, staff, 14 This is cited in Report of Vietnam National Health Survey 2001-2002, [www.moh.gov.vn/solieu/defaultE.htm]

30
training, medicine, finances, services provided, supervision and using a vignette approach it assesses knowledge in diagnosing and treating some common illnesses.
Survey sample and survey implementation The VNHS uses a sample selected through multi-stage random sampling with the first stage being the commune/ward. From a list of communes in 61 provinces and cities, 1200 communes/wards were selected using probability of selection proportional to size (PPS); The second stage sample is the census enumeration areas (EA) in each commune/ward, two EAs are selected in each commune/ward through systematic sampling. The third stage is systematic random sampling of 15 households in each EA. A total of 36000 households were selected in 1200 communes/wards and 1195 commune health facilities (5 communes/wards in the sample didn't have a facility). A total of 1187 health workers, 837 private western practitioners, 652 private traditional practitioners and 1171 village health workers were selected to be interviewed in the survey.
To collect data, 62 survey teams were fielded to work from November 2001 through November 2002. Each field team consisted of a team leader, two interviewers and one anthropometrics (a doctor). In addition, 20 regional supervisors were assigned to different regions and several central supervision teams were sent out during the survey fieldwork. The Central Data Processing Center of the GSO created the data entry program and undertook the data entry after manual checking at the VNHS office of the Ministry of Health.
Survey instruments consisted of 6 questionnaires with over 700 questions. The survey was implemented in 2 visits to the household with an interval of 4 weeks between visits. During the first visit, the interviewer collected background information on the household, information on knowledge of health care and prevention, reproductive health of married women in childbearing ages, living environment, mortality and child health care. During the second visit, the interviewer collected information on illnesses and utilization of health care services, assets and food expenditures during the 4 previous weeks. The anthropometrics (doctor) collected information on lifestyles, health insurance, and took anthropometric and blood pressure measurements for household members as well as collecting information from health care providers. The scale, measuring board and anthropometric techniques were according to instructions from the National Institute of Nutrition. Blood pressure was measured according to instructions from the Cardiology institute. The team leader collected information from the commune leadership on the general context of the commune/ward.
31
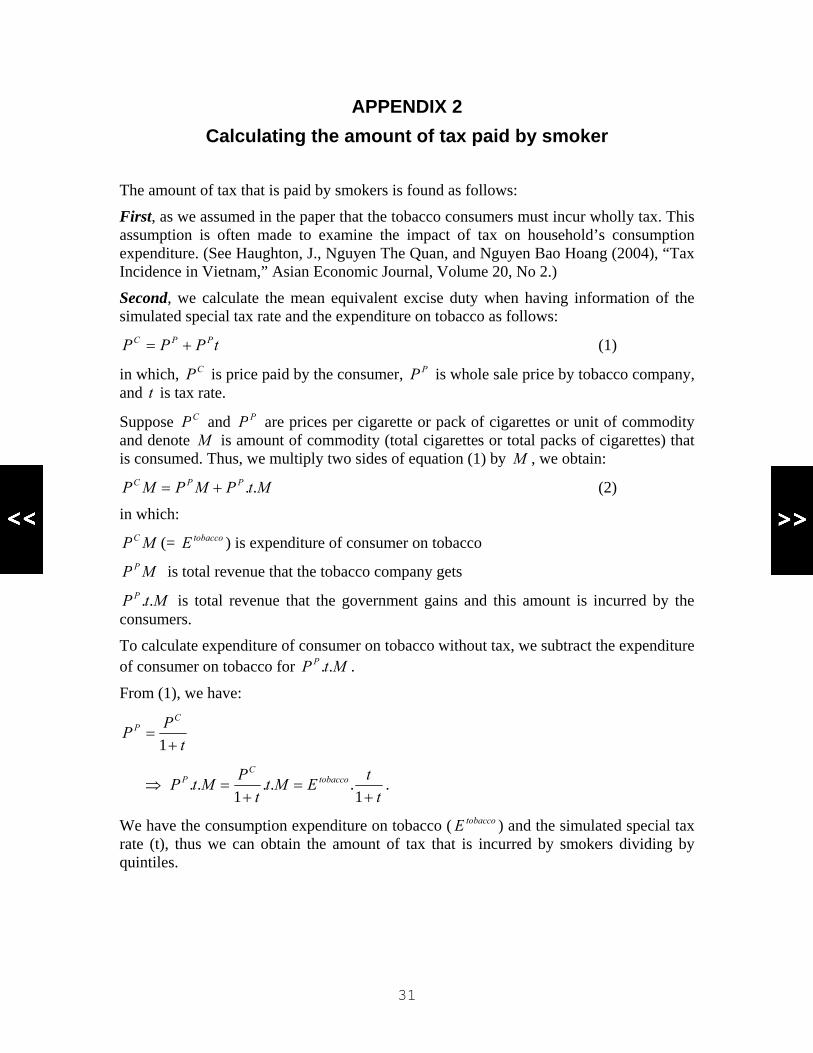
APPENDIX 2 Calculating the amount of tax paid by smoker
The amount of tax that is paid by smokers is found as follows:
First, as we assumed in the paper that the tobacco consumers must incur wholly tax. This assumption is often made to examine the impact of tax on household’s consumption expenditure. (See Haughton, J., Nguyen The Quan, and Nguyen Bao Hoang (2004), “Tax Incidence in Vietnam,” Asian Economic Journal, Volume 20, No 2.)
Second, we calculate the mean equivalent excise duty when having information of the simulated special tax rate and the expenditure on tobacco as follows:
tPPP PPC += (1)
in which, CP is price paid by the consumer, PP is whole sale price by tobacco company, and t is tax rate.
Suppose CP and PP are prices per cigarette or pack of cigarettes or unit of commodity and denote M is amount of commodity (total cigarettes or total packs of cigarettes) that is consumed. Thus, we multiply two sides of equation (1) by M , we obtain:
MtPMPMP PPC ..+= (2)
in which:
MPC (= tobaccoE ) is expenditure of consumer on tobacco
MP P is total revenue that the tobacco company gets
MtP P .. is total revenue that the government gains and this amount is incurred by the consumers.
To calculate expenditure of consumer on tobacco without tax, we subtract the expenditure of consumer on tobacco for MtP P .. .
From (1), we have:
tPP
CP
+=
1
⇒ t
tEMtt
PMtP tobaccoC
P
+=
+=
1...
1.. .
We have the consumption expenditure on tobacco ( tobaccoE ) and the simulated special tax rate (t), thus we can obtain the amount of tax that is incurred by smokers dividing by quintiles.

…………………………………………………………………………………………………..About SEATCA The Southeast Asia Tobacco Control Alliance (SEATCA) works closely with key partners in ASEAN member countries to generate local evidence through research programs, to enhance local capacity through advocacy fellowship program, and to be catalyst in policy development through regional forums and in-country networking. By adopting a regional policy advocacy mission, it has supported member countries to ratify and implement the WHO Framework Convention on Tobacco Control (FCTC)
Contact persons:Ms. Bungon Ritthiphakdee: SEATCA Director Email: [email protected]. Menchi G. Velasco: SEATCA Research Program ManagerEmail: [email protected]; [email protected] Asia Tobacco Control Alliance (SEATCA) Address: Thakolsuk Apartment Room 2B, 115 Thoddamri Rd., Nakornchaisri
Dusit, Bangkok 10300, THAILAND Tel./Fax: +662 241 0082
Website: http://www.seatca.org …………………………………………………………………………………………………..