Impacts of Objective and Subjective Social Inclusion on ...
96
Philadelphia College of Osteopathic Medicine DigitalCommons@PCOM PCOM Psychology Dissertations Student Dissertations, eses and Papers 2015 Impacts of Objective and Subjective Social Inclusion on the Quality of Life of Individuals with Schizophrenia Spectrum Disorders and Major Depressive Disorder Katie A. Johanning-Gray Philadelphia College of Osteopathic Medicine, [email protected] Follow this and additional works at: hp://digitalcommons.pcom.edu/psychology_dissertations Part of the Clinical Psychology Commons , Mental Disorders Commons , Psychiatric and Mental Health Commons , Quantitative Psychology Commons , and the Social Psychology and Interaction Commons is Dissertation is brought to you for free and open access by the Student Dissertations, eses and Papers at DigitalCommons@PCOM. It has been accepted for inclusion in PCOM Psychology Dissertations by an authorized administrator of DigitalCommons@PCOM. For more information, please contact [email protected]. Recommended Citation Johanning-Gray, Katie A., "Impacts of Objective and Subjective Social Inclusion on the Quality of Life of Individuals with Schizophrenia Spectrum Disorders and Major Depressive Disorder" (2015). PCOM Psychology Dissertations. Paper 339.
Transcript of Impacts of Objective and Subjective Social Inclusion on ...

Philadelphia College of Osteopathic MedicineDigitalCommons@PCOM
PCOM Psychology Dissertations Student Dissertations, Theses and Papers
2015
Impacts of Objective and Subjective SocialInclusion on the Quality of Life of Individuals withSchizophrenia Spectrum Disorders and MajorDepressive DisorderKatie A. Johanning-GrayPhiladelphia College of Osteopathic Medicine, [email protected]
Follow this and additional works at: http://digitalcommons.pcom.edu/psychology_dissertations
Part of the Clinical Psychology Commons, Mental Disorders Commons, Psychiatric and MentalHealth Commons, Quantitative Psychology Commons, and the Social Psychology and InteractionCommons
This Dissertation is brought to you for free and open access by the Student Dissertations, Theses and Papers at DigitalCommons@PCOM. It has beenaccepted for inclusion in PCOM Psychology Dissertations by an authorized administrator of DigitalCommons@PCOM. For more information, pleasecontact [email protected].
Recommended CitationJohanning-Gray, Katie A., "Impacts of Objective and Subjective Social Inclusion on the Quality of Life of Individuals withSchizophrenia Spectrum Disorders and Major Depressive Disorder" (2015). PCOM Psychology Dissertations. Paper 339.

Philadelphia College of Osteopathic Medicine
Department of Psychology
IMPACTS OF OBJECTIVE AND SUBJECTIVE SOCIAL INCLUSION ON THE
QUALITY OF LIFE OF INDIVIDUALS WITH SCHIZOPHRENIA SPECTRUM
DISORDERS AND MAJOR DEPRESSIVE DISORDER
Katie A. Johanning-Gray
Submitted in Partial Fulfillment of the Requirements of the Degree of
Doctor of Psychology
June 2015

PHILADELPHIA COLLEGE OF OSTEOPATHIC MEDICINE DEPARTMENT OF PSYCHOLOGY
Dissertation Approval
This is to certify that the thesis presented to us by Xa hi.. Job.£tna1.~ ~G()Ly on the J~-!:ll day of_.M__._,GI...~\jf---------' 20 !5, in partial fulfillment of the
requirements for the degree of Doctor of Psychology, has been examined and is
acceptable in both scholarship and literary quality.
Committee Members' Signatures: Petra Kottsieper, PhD, Chairperson Bruce S Zahn, EdD, ABPP Mark Salzer, PhD Robert A DiTomasso, PhD, ABPP, Chair, Department of Psychology
iii
Acknowledgements
I would like to thank my dissertation committee for all of the
commitment they showed to this process. Petra Kottsieper, Ph.D., my
dissertation chair, was very dedicated to ensuring I made it through this
undertaking, despite all of the life changes and obstacles which occurred
during it. She has been a wonderful example of how one can maintain
professionalism while using disclosure to enhance relationships and
outcomes. I am grateful to Mark Salzer, Ph.D. for the special permission he
granted me so I could use the data for this study. The data used came from
the study, “Reducing disparities in mental health services for severely
mentally ill African-Americans” that was funded by the Commonwealth of
Pennsylvania Tobacco Relief Fund (Hadley, Rothbard, & Salzer; 3/1/03 –
2/28/07). I would also like to thank him for the vast knowledge base he
brought to this project. Since I began in this program I have seen Bruce
Zahn, Ed.D., A.B.P.P., be a constant representation of a professional
psychologist and to work tirelessly to train future psychologists. I thank him
for his commitment to my development throughout my clinical training and
especially in this project. I would like to express my sincere thanks to
Eugene Brusilovskiy, M.U.S.A, for his help with the use of the data. His help
was always speedy and astute. I am truly grateful to my parents who first
instilled in me the values of faith and education which led me to, and allowed
me to reach, where I am today. Through teaching me faith they showed me

iv
the importance of all of God’s creation and our role to uphold its grandeur.
By teaching me how consequential education is, my parents enabled me to
become a trained professional who can serve out my faith. Words cannot
express my appreciation for my husband who has embodied the definition of
love from 1 Corinthians Chapter 13 throughout my graduate studies. He has
been patient and kind and has shown trust and hope in enduring the obstacles
which were presented. When God made him, I know God was considering
everything I would need. Throughout my life my dogs have kept me from
being just any person; they have shown me friendship, trust, and pure joy
that bring out compassion and patience from me and make me a better
person. Since beginning this project, I do not think a day has gone by when
my ‘rescues’ have not rescued me. Finally, I’d like to offer a note of thanks
to all of my family and friends who have offered words of wisdom and
support during this process. I hope someday I can return the gift and help
raise you to your goals as well.
v
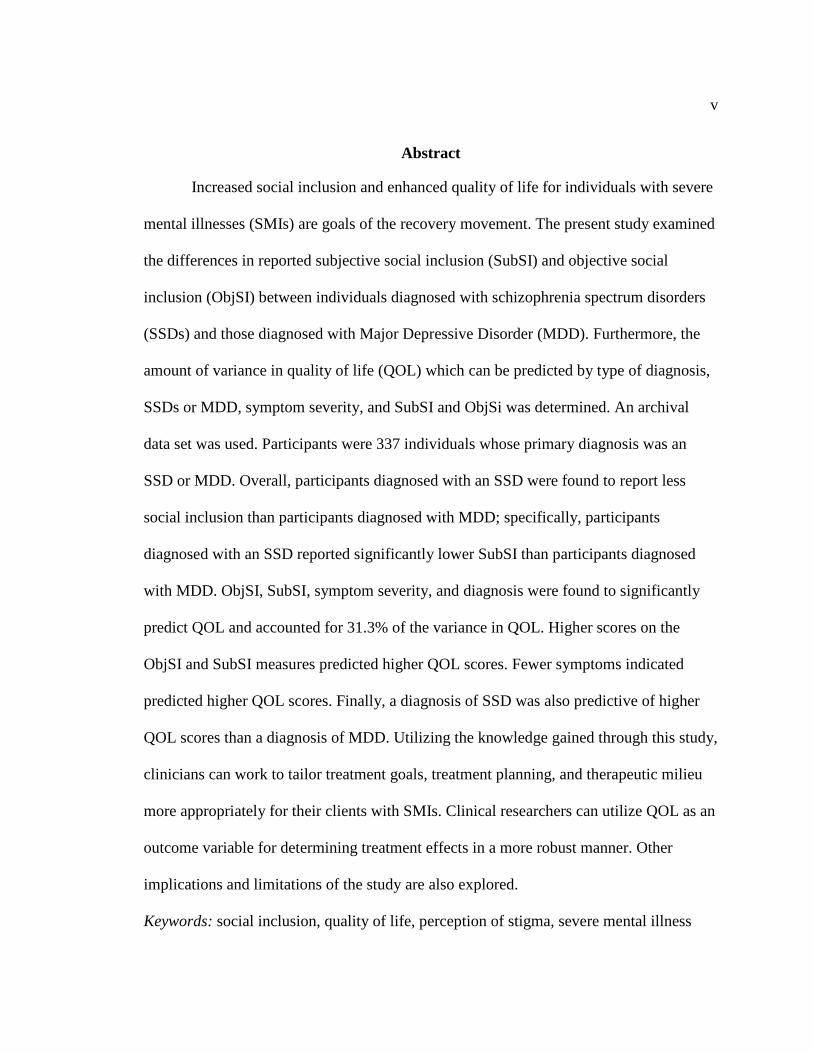
Abstract
Increased social inclusion and enhanced quality of life for individuals with severe
mental illnesses (SMIs) are goals of the recovery movement. The present study examined
the differences in reported subjective social inclusion (SubSI) and objective social
inclusion (ObjSI) between individuals diagnosed with schizophrenia spectrum disorders
(SSDs) and those diagnosed with Major Depressive Disorder (MDD). Furthermore, the
amount of variance in quality of life (QOL) which can be predicted by type of diagnosis,
SSDs or MDD, symptom severity, and SubSI and ObjSi was determined. An archival
data set was used. Participants were 337 individuals whose primary diagnosis was an
SSD or MDD. Overall, participants diagnosed with an SSD were found to report less
social inclusion than participants diagnosed with MDD; specifically, participants
diagnosed with an SSD reported significantly lower SubSI than participants diagnosed
with MDD. ObjSI, SubSI, symptom severity, and diagnosis were found to significantly
predict QOL and accounted for 31.3% of the variance in QOL. Higher scores on the
ObjSI and SubSI measures predicted higher QOL scores. Fewer symptoms indicated
predicted higher QOL scores. Finally, a diagnosis of SSD was also predictive of higher
QOL scores than a diagnosis of MDD. Utilizing the knowledge gained through this study,
clinicians can work to tailor treatment goals, treatment planning, and therapeutic milieu
more appropriately for their clients with SMIs. Clinical researchers can utilize QOL as an
outcome variable for determining treatment effects in a more robust manner. Other
implications and limitations of the study are also explored.
Keywords: social inclusion, quality of life, perception of stigma, severe mental illness

vi
Table of Contents
List of Tables………………………………………………………………………… ix
Chapter 1: Introduction……………………………………………………………..... 1
Statement of the Problem………………………………………………………... 1
Purpose of the Study……………………………………………………………... 4
Literature Review………………………………………………………………... 4
Deinstitutionalization………………………………………………………… 5
Public Policies, Organizations, and Other Reform Movements……………... 6
True Social Inclusion………………………………………………………… 7
Stigma………………………………………………………………………... 8
Stigma and Social Distance………………………………………………….. 14
Labeling Theory……………………………………………………………... 18
Social Inclusion……………………………………………………………… 25
Quality of Life……………………………………………………………….. 28
Summary…………………………………………………………………………. 33
Hypotheses……………………………………………………………………….. 34
Chapter 2: Method…………………………………………………………………… 35
Design and Design Justification…………………………………………………. 35
Participants………………………………………………………………………. 36
Measures…………………………………………………………………………. 36
Quality of Life……………………………………………………………….. 36
Objective Social Inclusion…………………………………………………… 37

vii
Subjective Social Inclusion………………………………………………….. 38
Symptom Severity Measures………………………………………………… 40
Procedure………………………………………………………………………… 42
Statistical Plans and Analysis……………………………………………………. 43
Statistical Plan for Hypothesis I……………………………………………... 43
Statistical Plan for Hypothesis II…………………………………………….. 45
Chapter 3: Results……………………………………………………………………. 47
Participants………………………………………………………………………. 47
Excluded Participants………..………………………………………………. 47
Descriptive Statistics………………………………………………………… 47
Descriptive Statistics of Variables……………………………………………….. 50
Social Inclusion……………………………………………………………… 50
Quality of Life……………………………………………………………….. 51
Symptom Severity…………………………………………………………… 52
Multivariate Analyses……………………………………………………………. 54
Statistical Methods Employed in Testing Hypothesis I……………………… 54
Statistical Methods Employed in Testing Hypothesis II…………………….. 56
Chapter 4: Discussion………………………………………………………………... 60
Social Inclusion Measures……………………………………………………….. 60
Social Inclusion and Diagnoses………………………………………………….. 61
The Prediction of Quality of Life………………………………………………... 62
Implications……………………………………………………………………… 66

viii
Limitations……………………………………………………………………….. 68
Future Directions………………………………………………………………… 70
Models of Social Inclusion…………………………………………………... 70
Proposed Approaches………………………………………………………... 71
Public Education……………………………………………………………... 72
Advocacy…………………………………………………………………….. 74
Summary…………………………………………………………………………. 74
References……………………………………………………………………………. 77
ix
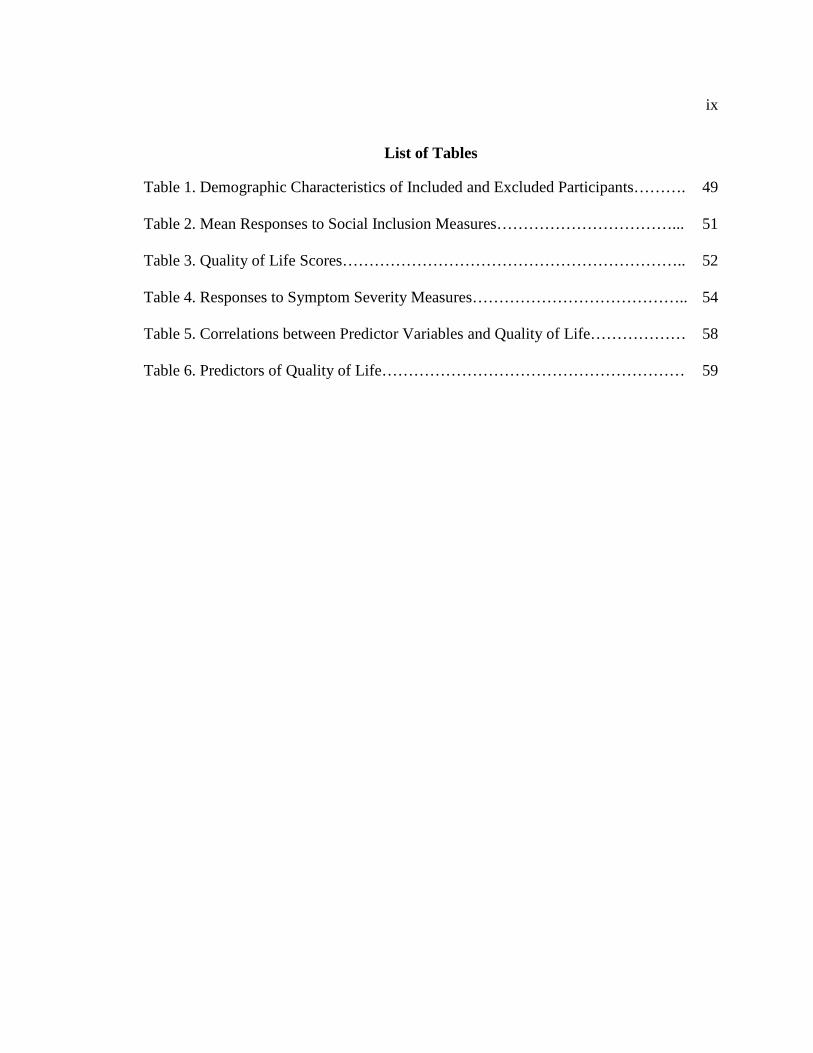
List of Tables
Table 1. Demographic Characteristics of Included and Excluded Participants………. 49
Table 2. Mean Responses to Social Inclusion Measures……………………………... 51
Table 3. Quality of Life Scores……………………………………………………….. 52
Table 4. Responses to Symptom Severity Measures………………………………….. 54
Table 5. Correlations between Predictor Variables and Quality of Life……………… 58
Table 6. Predictors of Quality of Life………………………………………………… 59

Chapter 1: Introduction
Statement of the Problem
How community members interact with each other can be significantly influenced
by knowledge of other members’ mental health diagnoses, including their behavior. In a
random sample of 240 Ohio residents with 152 respondents, Link, Cullen, Frank, and
Wozniak (1987) found that approximately 40% of their sample reported that they would
be less socially engaged with a person described in a vignette as a “former mental
hospital patient” as compared with the same person labeled as a “back patient.” The
authors also manipulated behavioral dimensions in vignettes and found that the behavior
of a fictional male character played a key role in the social desirability of the person.
Link et al. (1987) found that approximately 24% of the variance in how socially engaged
people reported that they would be with the fictional character was predicted by the level
of behavior (no, mild, or severely objectionable) that the individual evidenced in the
vignette. The amount of variance predicted increased to approximately 50% when scores
indicating the perceptions of people, relative to how dangerous former psychiatric
hospital patients could be, were added into the equation.
People’s perception of others’ mental health seems to determine if and to what
extent they choose to interact with a person. Lack of interaction between individuals with
mental health conditions and other community members may, in turn, contribute to the
social exclusion of individuals with mental health conditions. Indeed, Bonner, Barr, and
Hoskins (2002) found that people with mental health diagnoses are over-represented in
groups which are socially excluded; therefore, they are not partaking in social interaction

SOCIAL INCLUSION AND QUALITY OF LIFE 2
with the same frequency as are other people. This is important to address because
community inclusion facilitates access to ways of meeting one’s needs and also promotes
healing (Lloyd, Tse, & Deane, 2006).
Whether or not one feels accepted by others may influence how willing the person
is to engage in community activities. Troublesome effects of stigma on those with mental
health diagnoses have been demonstrated in the research literature (Weinstein, 1983).
Any perceived lack of acceptance may decrease community inclusion and quality of life
(QOL).
The negative correlation between perceived stigma and individuals’ social
inclusion was demonstrated in a study of individuals diagnosed with Bipolar I and
Bipolar II disorders (Perlick et al., 2001). Individuals who reported higher levels of
perceived stigma were significantly less engaged in social activities outside of family
networks than those who reported lower levels of perceived stigma. In the same study,
the negative correlation between perceived stigma and level of social engagement within
family networks also approached significance. It may be hypothesized that the
relationships between perceived stigma and social inclusion, and social inclusion and
access to resources may contribute to individuals feeling stigmatized, resulting in lower
QOL.
In a community outpatient sample of 120 individuals with schizophrenia, over 8%
of the variance in level of QOL was predicted by the individuals’ levels of satisfaction
with their social networks (Bengtsson-Tops & Hansson, 2001). Participants reported that
their social networks were less supportive and close, and that they were having fewer

SOCIAL INCLUSION AND QUALITY OF LIFE 3
relationships with which to share happiness as compared with community norms for these
constructs. Measures on QOL assess “enjoyment and life satisfaction associated with
various activities” (Rapaport, Clary, Fayyad, & Endicott, 2005, p. 1171). Individuals with
Major Depressive Disorder (MDD) have been found to have significantly lower QOL
scores as compared with community norms. In one sample, 63% of individuals with
MDD had QOL scores in the severely impaired range and only 10% of their scores fell
within the normal range (Rapaport et al.).
Perceptions of one’s community acceptance may be different across people
diagnosed with different mental health disorders. Part of this difference in self-perception
may be due to the how the public views these different diagnoses. A nationwide,
representative sample of 1444 individuals living in the United States reported perceiving
individuals with schizophrenia as significantly more dangerous than individuals with
MDD and also reported being significantly less likely to engage socially with individuals
with schizophrenia as compared with individuals with MDD (Link, Phelan, Bresnahan,
Stueve, & Pescosolido, 1999). Furthermore, diagnostic criteria for these two groups of
people differ in terms of overt behaviors, possibly contributing to differing levels of
actual and perceived social acceptance and inclusion. For example, in the active phase of
their illnesses, individuals with schizophrenia spectrum disorders (SSDs) primarily
present with psychotic features, which include delusions and hallucinations. Behaviors
exhibited during these episodes may be viewed as more unstable, unpredictable, or
dangerous to other community members than are behaviors exhibited by individuals with
MDD.

SOCIAL INCLUSION AND QUALITY OF LIFE 4
Purpose of the Study
The present study will examine if there is a difference in reported subjective and
objective experiences of social inclusion between individuals diagnosed with SSDs and
those diagnosed with MDD. Furthermore, the amount of variance in QOL which can be
predicted by type of diagnosis, SSDs or MDD, in addition to reported subjective and
objective experiences of social inclusion will be determined. The determination of any
relationships between diagnoses, social inclusion, and QOL would then allow the field to
address these differing problems more completely across diagnostic categories.
Literature Review
Increased social inclusion/social acceptance is a goal that many stakeholders
envision for individuals with serious mental illnesses (SMI; e.g., Leff & Warner, 2006;
Perlick, 2001). However, although increasing numbers of individuals with SMI have been
de-institutionalized and are living in the community, they are not partaking in social
activities with the same frequency as are other individuals. Research has shown that
individuals with SMI face and perceive ongoing discrimination and stigma in society
(e.g. Ertugrul & Uluğ, 2004, Link et al., 1999, Link, Struening, Neese-Todd, Asmussen,
& Phelan, 2001, Perlick, 2001, Perlick et al., 2001). It has also been shown that, for
individuals with SMI, discrimination and stigmatization can contribute to the
internalization of stigma and decrease their participation in social activities (Perlick et al.,
2001). High levels of self-stigmatization and perceived social exclusion may also be
related to lower levels of QOL. QOL in individuals with mental health conditions has
been characterized by lower levels of enjoyment and satisfaction with such areas as social
SOCIAL INCLUSION AND QUALITY OF LIFE 5
relationships, physical health, work, daily activities, economic status, and sense of well-
being (Rapaport et al., 2005).
This literature review will discuss the history of deinstitutionalization, the
relationships between stigma and mental health conditions, impacts of social
inclusion/exclusion, the importance of QOL, and differences in the experiences of
individuals with SSDs as compared with those with MDD. However, several theories
have been proposed as explanatory frameworks for the relationships between these
factors. Therefore, even though these theories are not the focus of the current study, the
author will review these theories to give the reader a stronger framework for
understanding the empirical work which has already been done in this area as well as the
rationale for the current study.
Deinstitutionalization. Bachrach (1976) defined deinstitutionalization as “a
process involving two elements: (1) the eschewal of traditional institutional settings—
primarily State hospitals—for the care of the mentally ill, and (2) the concurrent
expansion of community-based services for the treatment of these individuals” (p. 1).
Bachrach went on to state that the process involves two parts, removing individuals who
are currently hospitalized from institutions and preventing the hospitalization of
individuals in the future. Although the deinstitutionalization movement can be traced
further back in time, it gained momentum in the United States in the 1960s (Bachrach,
1983). The aim of the movement was “improving the lot of individuals perceived as
helpless in gaining access to life’s entitlements” by providing services to individuals in
their own communities rather than in large, socially excluded mental hospitals in order to

SOCIAL INCLUSION AND QUALITY OF LIFE 6
make treatment “more humane and more therapeutic” (Bachrach, 1983, p. 7). More
recently, the deinstitutionalization movement can be seen in laws, public policies, and
organizations committed to increasing the social inclusion of individuals with mental
health illnesses. For example, in their 1999 Olmstead decision, the U.S. Supreme Court
stated that individuals “must be treated in the least restrictive setting possible, in the
community instead of institutional settings whenever feasible” (State of California, 2007,
p. 22). The importance of social inclusion of individuals with mental health illnesses can
also more recently be seen in the Substance Abuse and Mental Health Services
Administration’s (SAMHSA) National Consensus Statement on Mental Health Recovery
(United States Department of Health and Human Services, 2006).
Public policies, organizations, and other reform movements. The Community
Mental Health Center Act of 1963 formally began deinstitutionalization in the United
States (Swarbick, 2009). As deinstitutionalization started, reform of the mental health
services system began in other ways as well; consumers of mental health programming
assembled their own consumer movement; the Community Support Program (CSP) was
created within the National Institute of Mental Health (NIMH), and the National Alliance
for the Mentally Ill (NAMI) was created by family members of individuals with mental
health illnesses (Swarbick).
Despite the efforts of deinstitutionalization and other movements, the ongoing
negative impact of stigma continues to have an effect on the social inclusion of
individuals with SMI. In SAMHSA’s statement on recovery, the importance of social
inclusion is highlighted in numerous areas including the following statement, “Societal

SOCIAL INCLUSION AND QUALITY OF LIFE 7
acceptance and appreciation of consumers—including protecting their rights and
eliminating discrimination and stigma—are crucial in achieving recovery” (United States
Department of Health and Human Services, 2006, p.2). In California in 2007, the Mental
Health Services Oversight and Accountability Commission’s Stigma and Discrimination
Advisory Committee’s created a 63 page report and 10-year plan to address how to
increase the social inclusion of individuals with mental health illnesses through the
elimination of stigma (State of California, 2007). Within the U.S. Department of
Education, The National Institute on Disability and Rehabilitation Research (NIDRR)
funds research and activities to promote the social inclusion of individuals with mental
health illnesses through The Temple University Collaborative on Community Inclusion
of Individuals with Psychiatric Disabilities (TU Collaborative).
True social inclusion. Although some community-based programs have been
able to provide appropriate services and treatment options for individuals with SMI,
deinstitutionalization has had mixed success. (Bachrach, 1983). Some programs have
been successful in meeting the needs of a minority of individuals with SMI; however, a
significant failure of the movement has been the inability of many individuals to access
treatment (Bachrach). Also, despite the work of patient advocacy groups, the stigma of
mental health conditions contributes to less social support availability in the new
community based service system as compared with the availability in institutional
settings (Bachrach).
The current literature is replete with descriptions of how, despite their physical
location in the community, individuals with mental health conditions are not fully a part
SOCIAL INCLUSION AND QUALITY OF LIFE 8
of their communities. In 2009, while reviewing the history and movement towards the
social inclusions of individuals with mental health illnesses, Swarbick stated, “The
mental health service delivery system continues to need an overhaul in terms of creating a
culture that is based on self-determination, empowering relationships, and opportunities
for persons in recovery to fully participate in all facets of community living” (pp. 206-
207). According to the TU Collaborative,
“For many living in the community has been an enormous benefit…For others,
however, living in the community has meant only a change in address rather than the
chance to develop a sense of genuine participation and integration in the day-to-day life
around them.”
Ware, Hopper, Tugenberg, Dickey, and Fisher (2007) described individuals with
psychiatric disabilities as “in the community, but not of it” (p. 469). Based on interviews
with 56 adults with psychiatric disabilities in 5 sites where social integration is a service
goal, the authors go on to give the following new definition of social integration, “a
process, unfolding over time, through which individuals who have been psychiatrically
disabled increasingly develop and exercise their capacities for connectedness and
citizenship” (p. 471). Although deinstitutionalization has generally succeeded in its literal
goal of providing the best treatment within the community, numerous barriers, including
stigma, prevent the true social inclusion of individuals with mental illnesses.
Stigma. Research over several decades has shown that numerous individuals and
groups within society are stigmatized when they deviate from societal notions of
“normality” (Towler & Schneider, 2005). The following brief definition of stigma was
SOCIAL INCLUSION AND QUALITY OF LIFE 9
offered by Hayward and Bright (1997), “the negative effects of a label placed on any
group” (p. 346). Crocker and Major (1989) define stigmatized individuals as being within
“social categories about which others hold negative attitudes, stereotypes, and beliefs, or
which, on average, receive disproportionately poor interpersonal or economic outcomes
relative to members of the society at large because of discrimination against members of
the social category” (p. 609). Crocker and Major go on to clarify differences between a
“stigmatized group” and an “outgroup.” They stated that a stigmatized group cannot be
the dominant group in a society whereas an out group could be. Furthermore, the authors
noted that stigmatized groups are demeaned by the vast majority of individuals within the
society, whereas out groups are demeaned by particular in groups. Stigmatized social
categories or groups vary widely in type and include skin color, weight, intellectual
disability, gender, sexual orientation, homelessness, and mental illness (Crocker &
Major; Towler & Schneider).
Link and Phelan’s (2001) conceptualization of stigma is considered to be one of
the most significant in regard to research on the stigma of mental illness (Rüsch,
Angermeyer, & Corrigan, 2005). In their conceptualization of stigma towards any group
of individuals, Link and Phelan describe the following steps. Initially, differences
amongst people are perceived. These differences are simplified into discrete categories
with given labels into which individuals are then assigned. The dominant cultures then
create relationships between the labels and negative stereotypes which become so strong
that the relationships are available at a preconscious level, allowing individuals in the
culture to make instantaneous decisions based upon them. Individuals in the dominant

SOCIAL INCLUSION AND QUALITY OF LIFE 10
culture create a split between themselves and individuals in the other sub-groups through
the use of the different labels. The final step consists of assigning labeled individuals to
lower societal roles, causing them to have less access to desirable elements of the culture.
The stigma surrounding the grouping or categorization of individuals with mental
illnesses in our society is especially undesirable and the saliency of the stigma
surrounding these individuals is overpowering. Towler and Schneider (2005) had 70
undergraduate student participants sort 54 cards, each with the name of a stigmatized
group, into 5-10 piles based on their similarity to each other; the participants were then
asked to rate how well 20 different traits applied to each of the piles. Overall, 7 clusters
were created based on the participants’ piles and were labeled by the researchers as:
physically disabled, mental, physical appearance, sexual identity, racial identity, social
deviants, and economically disadvantaged. The stigma cluster of “mental” included: the
depressed, mental patients, the suicidal, people who have had a nervous breakdown,
schizophrenics, obsessive people, and neurotics.
In their second study, Towler and Schneider (2005) had 40 participants rate their
reactions to social situations with exemplars from 6 of the 7 clusters; “obsessive people”
and “depressed people” were used for the mental cluster. Comfort and evaluation ratings
were lowest for the mental cluster. Also, the evaluation ratings for the mental cluster
were significantly lower than those for the physically disabled, racial identity, and sexual
identity clusters, and comfort ratings for the mental cluster were significantly lower than
those for the physically disabled, social deviants, racial identity, and sexual identity
clusters. Based on this research, it can be hypothesized that the stigma surrounding

SOCIAL INCLUSION AND QUALITY OF LIFE 11
mental illness could contribute to less social inclusion of these individuals, as compared
with other stigmatized groups or categories.
Stigma and mental health conditions. The significantly negative stigma of
individuals with mental health conditions has been researched and well-documented for
several decades. In a review of stigma and mental illness, the general consensus of
studies in the 1950s and 1960s was that “The general public feared and disliked the
mentally ill, and wished to avoid them at all costs” (Hayward & Bright, 1997, p. 346).
The impact of stigma on the recovery of individuals with mental health conditions
remained substantial enough more recently to warrant a special section of Psychiatric
Services on the topic in 2001. According to Perlick (2001), stigma detrimentally impacts
the self-esteem and social functioning of individuals with mental health conditions across
diagnoses. In a study of individuals with a variety of SMIs, most participants agreed or
strongly agreed that current and former psychiatric patients experience rejection in
multiple ways (Link et al., 2001).
The stigma of mental health conditions. Investigations into public conceptions of
what mental illness entails have revealed a number of findings. In a review of the
literature on mental illness and stigma, Hayward and Bright (1997) cited perceptions of
dangerousness, attribution of responsibility, poor prognosis, and disruption of social
interaction as possible causes for the stigma of mental illness. Most prevalent is the
impact of community members’ perceptions of dangerousness.
In a 1996 nationwide sample of 653 adults in the United States, who were asked
an open-ended question regarding what the term “mentally ill” meant to them, the
SOCIAL INCLUSION AND QUALITY OF LIFE 12
following perceptions of mental illness were found (Phelan, Link, Stueve, & Pescosolido,
2000). Behaviors suggestive of psychosis were included in approximately 35% of
descriptions of the term, “mentally ill,” with 20% of all descriptions being composed of
only psychotic behaviors and 12% of all the descriptions being considered violent
psychosis. Also, over 15% of the descriptions included socially deviant behaviors and
14% included cognitive impairment descriptors. The only significantly associated
sociodemographic variable to mentions of violence found by Phelan and colleagues was
race, with non-whites rather than whites, making greater mention of violence in their
descriptions of mental illness. These descriptions show the remarkably negative
associations that individuals have with the label of mental illness; it logically follows that
individuals perceived with such labels might be negatively impacted.
Perceptions of mental illness stigma on labeled individuals. As outlined in Link
and Phelan’s conceptualization of stigma (2001), stigma can have many deleterious
effects. Individuals in stigmatized groups are frequently aware of societal opinions of
them. Individuals with mental health conditions may have varying levels of perceived
stigma, dependent on a number of factors.
Symptoms of their disorders may contribute to the accuracy of perceptions of
individuals with mental health conditions. Also, symptom severity may influence the
level of stigma experienced by individuals. In a sample of 60 individuals being treated for
schizophrenia in an outpatient clinic, perception of stigma was positively associated with
severity of symptoms, specifically the symptoms of emotional withdrawal, passive social
withdrawal, delusions, and suspiciousness (Ertugrul & Uluğ, 2004).

SOCIAL INCLUSION AND QUALITY OF LIFE 13
Reactions to perceptions of mental illness stigma on labeled individuals. Due to
the particularly negative nature of the stigma surrounding individuals with mental health
conditions, the perceptions of these beliefs by individuals with mental health problems is
related to numerous negative impacts on these individuals. Research on specific negative
impacts on individuals with mental health conditions related to their perceptions of their
stigmatization will be discussed in the following sections.
Social isolation. In one study of 70 participants in a clubhouse program for
individuals with mental illnesses, 63% of the respondents indicated that they would avoid
interactions with people that they perceive as thinking differently about them because of
their psychiatric treatment (Link et al., 2001). In another study involving 264 individuals
in treatment for bipolar disorders, baseline stigma concerns significantly predicted
psychological isolation and behavioral avoidance scores at a 7-month follow-up. In
addition, psychological isolation, behavioral avoidance, and rejection sensitivity scores
combined to explain approximately 54% of the variance in social leisure scores of the
same individuals (Perlick et al., 2001).
Relationships. In the same sample of 70 participants in a clubhouse program for
individuals with a variety of SMI diagnoses, the majority of participants felt that former
psychiatric patients would be discriminated against in dating relationships (81%), close
friendships (66%), and would be perceived as less trustworthy (69%). Other relationship
variables of significance included 59% feeling that former psychiatric patients were
viewed as less intelligent, and 67% indicating that their opinions would be taken less
seriously (Link et al., 2001).
SOCIAL INCLUSION AND QUALITY OF LIFE 14
Self-esteem. In the sample from the clubhouse program previously reviewed,
perception of devaluation-discrimination and stigma-withdrawal accounted for 13% of
the variance in self-esteem scores at 6-months and 19% of the variance at 24-month
follow-ups. By dichotomizing self-esteem scores into low and high, with the cut-off
being the mid-point of the scale and controlling for baseline self-esteem, sex, and
diagnosis, an individual scoring at the 90th percentile of the devaluation-discrimination
scale would be 8.8 times more likely to have low self-esteem than an individual at the
10th percentile. The same analysis for stigma-withdrawal showed that an individual at the
90th percentile would be 7 times more likely to have low self-esteem than one at the 10th
percentile (Link et al., 2001).
Employment. Perceptions of employers was also explored in the sample of 70
individuals from the clubhouse program reviewed previously; 52 (74%) felt employers
would discriminate against former psychiatric patients (Link et al., 2001). Even with
severity of the condition being controlled for, individuals who had been diagnosed with a
mental health condition were less likely to be employed and also earned less income than
individuals who met criteria for mental health conditions but had never received
treatment (Link, 1982).
Stigma and Social Distance. Along with the negative outcomes related to
perceptions of stigma by the stigmatized group as described previously, numerous studies
have shown how the stigma of mental health conditions impacts the relationships
between individuals in this stigmatized group and with other community members (e.g.,
Angermeyer, Matschinger, & Corrigan, 2004; Link, 1982; Link et al., 1999; Perlick et al.,
SOCIAL INCLUSION AND QUALITY OF LIFE 15
2001). In a review of 35 articles on the attitudes of individuals who have received
psychiatric treatment, the majority of participants endorsed interpersonal difficulties,
social rejection, and job discrimination; also, most individuals who had been
psychiatrically hospitalized report problems with social re-integration due to stigma
(Weinstein, 1983). In an effort to assess the impact of community members’ stigma on
how willing they would be to and to what extent they would interact with individuals
with mental health conditions, researchers coined the term social distance.
Assessing social distance. Vignettes describing behaviors of individuals with
mental health conditions are frequently used in research to determine the effects of
stigma on participants’ attitudes while minimizing response patterns based on social
acceptability (Leff & Warner, 2006). Social distance scales seek to determine how
closely engaged an individual would be with another individual, using descriptions of
fictitious individuals. In order to measure engagement, researchers describe the fictitious
individual and then use dichotomous and/or Likert scale items such as: 1) “Would you
discourage your children from marrying someone like this?” 2) Would you be willing to
have someone like this join a favorite club or organization of yours?” (Phillips, 1963,
p.967), 3) “How would you feel about having someone like Jim Johnson as a neighbor?”
and 4) “How would you feel about recommending someone like Jim Johnson for a job,
working for a friend of yours?” (Link et al., 1987). By utilizing these vignettes,
researchers have sought to determine the factors that contribute to social distance and
which of the factors are most salient.
SOCIAL INCLUSION AND QUALITY OF LIFE 16
Determinants of social distance. The coping strategies that individuals who are
stigmatized utilize may contribute to decreased social inclusion. In addition, numerous
studies have also shown that the stigma surrounding individuals with mental health
conditions contributes to the perceptions and behaviors of other community members.
These perceptions and behaviors of community members may, in turn, contribute to a
decreased amount of social interaction between them and individuals with mental health
conditions.
Behavior. Link et al. (1987) found that descriptions of behaviors were
significantly more effective in predicting social distance than labels were in 10 of the 12
studies reviewed. In their subsequent study, over 23% of the variance in social distance
scores was attributable to the behavior of the individual in the vignette (Link et al.).
Phillips (1963) found that the variance in social distance scores was chiefly attributable to
the descriptions of the individuals’ behaviors, with the description of a ‘paranoid
schizophrenic’ having the greatest social distance scores and the description of a ‘normal
individual’ having the lowest. Perceptions of the dangerousness of individuals with
mental health conditions may be strengthened by symptoms including disorganized
behavior and flat affect and impact social distance (Ertugrul & Uluğ, 2004).
Label. Although the difference was not significant, over 39% of respondents
indicated greater social distance from the individual with a mental health condition when
vignettes described an individual in the same way, except when the reason given for a
hospitalization was for mental health or for a back problem. There was a significant
interaction for social distance between the hospitalization type and how dangerous

SOCIAL INCLUSION AND QUALITY OF LIFE 17
participants perceived individuals with current or past histories of mental illness to be
(Link et al., 1987).
Although community members may not always be aware of other individuals’
diagnoses, or lack thereof, this finding is important in conjunction with information
previously discussed. That is, that the majority of adults in the United States may be able
to identify behaviors related to MDD and SSDs as being behaviors of someone with a
mental illness and that over 12% of descriptions of individuals with mental illnesses
involved behaviors congruent with violent psychosis (Link et al., 1999; Phelan et al.,
2000). Therefore, community members may ascertain the presence of a mental illness
without being told and many people continue to associate violence strongly with
individuals who have mental health conditions.
Perception of dangerousness. In one study, community members’ perceptions of
the dangerousness of individuals who have had or are currently receiving psychiatric
treatment accounted for over 25% of the variance expressed in social distance measures,
based on vignettes of an individual who had been hospitalized for a back problem or had
been at a mental health institution (Link et al., 1987). Participants’ responses on measures
of likelihood of violence and social distance based on vignettes created to meet DSM-IV
criteria for schizophrenia, MDD, Alcohol Dependence, and Cocaine Dependence, along
with one describing an individual with subclinical problems showed a statistically
significant correlation between perception of dangerousness and social distance scores
(Link et al., 1999).

SOCIAL INCLUSION AND QUALITY OF LIFE 18
Based on this information, community members’ descriptions of individuals with
mental illnesses include significantly deviant and violent behaviors; individuals with
mental health conditions perceive a significant stigma against individuals receiving
psychiatric care, and the psychiatric diagnostic labeling of individuals is associated with
poor outcomes. This combination of stigma, perceptions of stigma, and behavioral
avoidance contributes to individuals with mental health conditions being less socially
accepted and subsequently less involved.
Labeling Theory. Labeling theory was offered, in part, as an explanatory
framework for the social exclusion of individuals with mental health conditions. It
proposed that individuals who have been psychiatrically hospitalized will face stigma and
rejection; therefore, other individuals will seek increased social distance from them
(Scheff, 1966, 1974). In his sample of 300 systematically selected, married, white
women, Phillips (1963) found that individuals reported being less willing to engage
socially with an individual, described in a vignette, who sought help from mental health
professionals, as compared with an individual who sought no help even though the
descriptions of their behaviors were the same in all other ways. Later studies used
comparisons, determining whether the label of a mental health condition or an
individual’s behavior was more predictive in causing participants to report a desire for
increased distance between themselves and the individual being described. In their review
of the literature, Link et al. (1987) found behavior to be a significantly stronger predictor
of desire for social distance than labels. This finding resulted in a revision of traditional
labeling theory.

SOCIAL INCLUSION AND QUALITY OF LIFE 19
Modified labeling approach. A modified labeling approach was proposed more
than thirty years after the original, with revisions based on results from empirical studies
of the steps (Link, Struening, Dohrenwend, Cullen, & Shrout, 1989). The studies, their
results, and the new approach were reported together. This approach is strongly related to
Link and Phelan’s (2001) conceptualization of the formation of stigma towards any group
discussed previously; however, it is focused on the stigma of mental illness. The new
modified labeling approach is characterized by several steps.
As noted, Link and colleagues (1989) conducted empirical studies on each step of
the approach they proposed. The studies involved data from a stratified sample of 429
community residents and 164 psychiatric patients at inpatient and out-patient facilities.
Within their sample, there were 11 out-patient psychiatric patients during their first
treatment recruited from the community and 56 first treatment inpatients or out-patients
recruited from facilities; 9 out-patient psychiatric patients with a history of treatment
recruited from the community, and 108 inpatients or out-patients with treatment histories
recruited from facilities; 96 individuals from the community with a history of treatment
who were no longer in treatment; 142 individuals from the community who met
diagnostic criteria for mental health conditions but had never been diagnosed as having
one, and 171 individuals from the community without a treatment history who did not
meet diagnostic criteria for a diagnosis. Participants who currently or had previously met
diagnostic criteria for MDD or SSDs were specifically recruited from facilities for the
studies. Therefore, 98 individuals in the sample were diagnosed with MDD, 50 of whom
SOCIAL INCLUSION AND QUALITY OF LIFE 20
were experiencing their first episodes and 65 individuals were diagnosed with SSDs, 21
of whom were experiencing their first psychotic episodes.
Link and colleagues’ (1989) participants with a history of psychiatric treatment
completed a measure to determine how they responded to their perceptions of their
positions in society. The measure looked at methods including: hiding the diagnosis,
limiting interactions, and/or teaching others. All participants completed measures of how
strongly individuals with a history of psychiatric treatment are devalued or discriminated
against and also the breadth of their social networks (Link, et al.). Subsequent paragraphs
will describe the specific steps of this theory which are pertinent to the current study.
Step 1. The first step states that all individuals form an idea of their community’s
views of individuals with a mental health label, the stigma of mental illness. Two features
of the idea formed are specifically significant, (a) how much an individual feels that
people with mental health conditions are devalued, and (b) how much he or she feels
people with mental health conditions are discriminated against; both of these features are
components of the stigma surrounding mental illness (Perlick et al., 2001). Another pre-
condition to this step, noted by Rüsch et al. (2005), is that the differences between
individuals with and without mental health conditions have to be noticed and be viewed
as relevant by society before mental illness can be formed into a stigmatized group.
Evidence in support of individuals generating a negative view of individuals with
mental health conditions in step 1 of the modified labeling approach has been found in
numerous studies including Link et al. (1989). The Towler and Schneider (2005) article
discussed previously also substantiates the fact that individuals with mental health

SOCIAL INCLUSION AND QUALITY OF LIFE 21
conditions are grouped together because the authors discovered the stigma cluster of
“mental” included: the depressed, mental patients, the suicidal, people who have had a
nervous breakdown, schizophrenics, obsessive people, and neurotics. The second study in
their article goes on to show how salient and negative the stigma is surrounding mental
illness (Towler & Schneider). A review of 35 articles evaluating the attitudes of
individuals receiving psychiatric treatment showed that these individuals, who are also
members of society, frequently endorsed perceptions of mental health patients which are
negative; these include characteristics and behaviors such as “worthless, unpredictable,
immoral, foolish, weak, sick, dangerous, irresponsible” (Weinstein, 1983, p.80). A more
recent review of mental illness stigma reported that the stigma surrounding mental health
conditions remains and continues to be negative (Rüsch et al., 2005).
Step 2. The second step of the approach is that an individual is labeled as having a
mental health condition by a professional. According to the theory, this process of
labeling contributes to the individual’s idea of how his or her community negatively
views individuals with mental health conditions to now be applied to him or herself (Link
et al., 1989). Evidence supporting this step is mixed because 57% of measures of self-
perceptions of individuals who had received psychiatric treatment showed that the
individuals endorsed positive views of themselves across 35 studies (Weinstein, 1983).
However, the validity of Weinstein’s assertion that the views were positive is
questionable. Items which were considered to be favorable self-perceptions included
characteristics such as clean and safe, which typically would be more neutrally viewed
characteristics in society, with only their opposites, dirty and dangerous, being perceived

SOCIAL INCLUSION AND QUALITY OF LIFE 22
negatively. Also, there is no information on how the participants felt about themselves
prior to the diagnosis in order to compare the later perception scores. Finally, should
Weinstein’s analysis of “favorable self-perceptions” be accepted, this would still leave a
significant minority of studies showing overall negative self-perceptions of individuals
with mental health conditions.
In accordance with Link and colleagues (1989) on Step 2, Rüsch and colleagues
(2005) state that “some people with mental illness may accept the common prejudices
about mental illness, turn them against themselves, and lose self-confidence” in
describing the meaning of self-stigma. However, they also point out that awareness of
having a mental illness is required for this to occur; therefore, this step may not be
possible for significantly impaired individuals.
Step 3. The next three steps of the modified labeling approach involve responses
to the label and also its consequences. In the third step, the individuals respond to their
perceptions of their positions in society by attempting to hide the diagnosis, reducing the
range of their social interactions to include only individuals who are aware of their
diagnoses or who have similar diagnoses, and/or try to teach others about mental health
conditions. In Link and colleagues’ study component related to this, participants who
were currently involved with, and those who had had previous psychiatric treatment,
significantly endorsed items regarding social withdrawal and items related to attempts to
educate the community; also, endorsement of items regarding secrecy trended towards
significance for these same individuals (1989).

SOCIAL INCLUSION AND QUALITY OF LIFE 23
In an evaluation of 264 individuals participating in treatment for bipolar disorder,
those who reported greater concern with the stigma of mental health conditions when
discharged from a psychiatric hospital, or when they began a new outpatient treatment,
were significantly less engaged with non-family social networks than were those
reporting less concern with stigma at a seven month follow-up (Perlick et al., 2001).
Therefore, the amount of concern about stigma was negatively correlated with reports of
social inclusion 7 months later. Also, overall stigma concerns at baseline were
statistically significant, positive predictors of variance in isolation (p < .01) and
avoidance (p < .001) scores at follow-up (Perlick et al.).
The idea in step 3 that individuals attempt to hide their diagnoses was upheld in a
nationwide survey of 1,301 mental health consumers (Wahl, 1999). Many respondents
reported secrecy around their mental health diagnoses. Specifically, 74% of respondents
reported that they “sometimes, often, or very often avoided telling others outside their
immediate families about their mental illnesses” (Wahl, p. 471).
Step 4. The fourth step involves negative impacts on the individuals with mental
health conditions, including low levels of social inclusion; this is due to their beliefs
about how others will devalue and/or discriminate against them and how they alienate
themselves in step three. Link and colleagues found that when education, age, marital
status, and employment status were controlled for there was still a significant, positive
relationship between amounts of alienation strategies used and amount of reliance on
household support; however, there was a significant negative relationship between
amount of withdrawal and size of non-household social networks (1989). In their study

SOCIAL INCLUSION AND QUALITY OF LIFE 24
with 264 individuals who had bipolar disorders, Perlick and colleagues found that
isolation, avoidance, and rejection sensitivity scores accounted for over 50% of the
variance in engagement in social leisure activities (2001).
Step 5. Finally, by step five, the theory asserts that most individuals with mental
health conditions will have lower self-esteem, limited community connections, and
inferior employment opportunities (Link et al., 1989). Therefore, individuals with mental
health conditions were hypothesized to have lower QOL, as described by Rapaport et al.
(2005). As predicted, Rapaport and colleagues found that individuals with depressive and
anxiety disorders including MDD, Dysthymic Disorder, Panic Disorder, Obsessive
Compulsive Disorder, Social Phobia, and Post-traumatic Stress Disorder had significantly
lower QOL scores than other individuals in their sample.
Because of the consequences outlined in step five, Link and colleagues asserted
that individuals with mental health conditions are at increased risk for other mental health
problems (1989). Indeed there does appear to be an increase in symptoms influenced by
stigma. Wahl (1999) stated that, “Experiences have led many consumers to maintain a
secrecy that not only is uncomfortable but also may contribute to the very symptoms—
anxiety, depression, paranoia—from which they are struggling to recover” (pp. 475-476).
In Wahl’s study of 1,301 mental health consumers, only 21% reported “that they seldom
or never worried that others would view them unfavorably if their status as a mental
health consumer were disclosed”; however, 55% reported that they had this concern often
or very often (p. 471). Along with concerns, 57% of mental health consumers reported
lower self-esteem and self-confidence. Rüsch et al. (2005) acknowledge that self-stigma

SOCIAL INCLUSION AND QUALITY OF LIFE 25
results in decreased self-esteem and self-efficacy but caution that such reductions must be
parceled out from those caused by depressive symptoms of mental illnesses.
Social inclusion. The influences of mental illness stigma on behavioral avoidance
and social distance, discussed previously, contribute to decreased social inclusion of
individuals with mental health conditions. Social inclusion has been defined in a variety
of ways. Reviewing the literature on social inclusion/exclusion of individuals with mental
health conditions, Morgan, Burns, Fitzpatrick, Pinfold, and Priebe found that the concept
is generally considered to be multidimensional; however, the dimensions included in its
definitions vary between and among researchers (2007). Social inclusion is important for
individuals because feeling socially excluded leads to physical and to mental health
problems; conversely, social inclusion aides in restorative processes (Lloyd et al., 2006).
Definitions of social inclusion. In the mental health literature Lloyd and
colleagues (2006) defined social inclusion as “being able to rejoin or participate in
leisure, friendship, and work communities” (p. 1). Ware and colleagues (2007) broadened
the concept into social integration, defining it as “a process, unfolding over time, through
which individuals who have been psychiatrically disabled increasingly develop and
exercise their capacities for connectedness and citizenship” (p. 471). The idea of social
inclusion/exclusion is also cited in many other fields including economics and sociology.
In the Review of Income and Wealth, Chakravarty and D’Ambrosio (2006) state that
socially excluded individuals cannot “participate in the basic economic and social
activities of the society in which he lives” (p. 377).
SOCIAL INCLUSION AND QUALITY OF LIFE 26
Social inclusion compared to social capital. The concepts of social capital and
social inclusion/exclusion are strongly interrelated in the literature (Morgan et al., 2007).
Social relationships and networks are crucial components of each concept. However,
social capital is focused on the use of social relationships for economic and/or material
reasons, whereas, social inclusion/exclusion looks at the use of social relationships for
these reasons and also for others. Therefore, according to Morgan and colleagues, the use
of social inclusion/exclusion is more applicable to the study of societal experiences of
individuals with mental health conditions because it considers that relationships serve
many valuable purposes. Based on this conclusion, this review will focus on social
inclusion/exclusion rather than on social capital.
Dimensions of social inclusion. Due to the breadth of the concept and given the
fact that the construct of social inclusion is studied in a variety of fields, a number of
dimensions have been proposed to measure social inclusion. In a more specifically socio-
economic model, Chakravarty and D’Ambrosio (2006) offered the following list of sub-
domains: constitutional/political rights, social rights, civil rights, access to paid
employment, quality of employment, health services, housing, education, social care,
financial services, transportation, commercial facilities, leisure services, friendships,
neighborhood participation, and family life. In a review of social inclusion in mental
health literature, dimensions of social inclusion included employment, housing, income,
social relationships and networks, and education; the review also highlighted the
importance of using both objective and subjective reports to measure social inclusion
(Morgan et al. 2007).
SOCIAL INCLUSION AND QUALITY OF LIFE 27
Social inclusion of individuals with mental health conditions. As reviewed in
the section on deinstitutionalization, today, individuals with mental health conditions are
“in the community, but not of it” (Ware et al., 2007, p. 469) despite the facts that social
inclusion is considered to be of significant benefit to individuals and that there are
numerous public policies, organizations, and movements towards increasing social
inclusion for this stigmatized group. Stigma can lead to social exclusion of individuals
with mental health conditions. The discriminatory views of community members may
lead to fewer opportunities for social engagement for individuals with mental health
conditions; also, the stigma that individuals with mental health conditions perceive from
other community members may deter them from being involved in the activities which
are available to them (Morgan et al., 2007).
Individuals with SMI have problems obtaining and maintaining steady
employment, with many being reliant on government aid; therefore, they have minimal
funds for social activities or new clothes in order to appear well-groomed in public (Leff
& Warner, 2006). Lacking funds for leisure activities may directly contribute to fewer
opportunities for social interactions. In an indirect way, lacking funds for new clothing
may also contribute to fewer social experiences because the impact of stigma regarding
appearance is layered on top of the stigma of mental illness. Because of these reasons and
others, the number of individuals with mental health conditions in socially excluded
groups, such as those who are homeless or poor, is larger than would be expected by the
percentage of the total population they account for (Bonner et al., 2002).

SOCIAL INCLUSION AND QUALITY OF LIFE 28
Based on their review of the literature on social inclusion/exclusion, Morgan and
colleagues (2007) recommended that objective and subjective measures should be used to
assess the construct. Using objective and subjective measures allows for a consideration
of the frequency and quality of dimensions of the social lives of individuals with mental
health conditions. The Social Inclusion scale used by the SAMHSA/MHD Multisite
Research Initiative utilizes reports of frequency ratings for social interactions, and the
Social Acceptance scale used ratings of frequency of feelings about other’s viewpoints
due to having a mental health diagnosis. In this manner, both quality (subjective reports)
and quantity (objective reports) measurements were garnered along with information
about how available the individuals believe social groups are to them.
Quality of life. The negative impact of stigma on social inclusion may contribute
to a lower QOL. QOL considers, minimally, an individual’s functional status and his or
her access to resources and opportunities (Lehman, 1996). Due to the wide variety of
impacts that SMIs have on the individuals diagnosed with such conditions, it is important
to investigate the QOL experienced in these populations.
Definitions and domains. QOL has been defined in a variety of overlapping
ways. Lehman (1996) suggested that, “at a minimum, QOL covers persons’ sense of
well-being; often it also includes how they are doing (functional status) and what they
have (access to resources and opportunities)” (p. 78). Measures of QOL assess
“enjoyment and life satisfaction associated with various activities” (Rapaport, et al.,
2005, p. 1171). Based on these descriptions, QOL is significantly related to individuals’
happiness and success.

SOCIAL INCLUSION AND QUALITY OF LIFE 29
Quality of life and mental health conditions. QOL is considered an important,
humanistic outcome of treatment services (Lehman, 1996). In a sample of 120 individuals
with schizophrenia seeking treatment in an out-patient setting, over 8% of the variance in
levels of QOL was predicted by the individuals’ levels of satisfaction with their social
networks (Bengtsson-Tops & Hansson, 2001). Overall, study participants reported that
their social networks were less supportive and close and that they had fewer relationships
to share happiness with, as compared with community norms for these constructs. In
another sample, 63% of individuals with MDD had QOL scores in the severely impaired
range, two or more standard deviations below the community norm; only 10% of their
scores fell within the normal range (Rapaport, et al., 2005).
According to Evans, Banerjee, Leese, and Huxleys (2007), few investigations
considered whether or not QOL models vary across types of mental illnesses. To address
this research gap, they mailed a survey to a sample of community dwelling adults in
England (18 to 65 years old). Based on responses, 794 individuals were separated into a
“common mental disorder” (CMD) group, made up primarily of anxiety and depressive
disorders, and 1,119 respondents made up the “healthy population” group. The “SMI”
group was made up of 149 individuals, currently living in the community, who had a
history of psychotic illness of at least 2 years in duration and at least 2 psychiatric
hospital admissions, at least one of which occurred in the previous 2 years. The authors
considered the following QOL components in their analysis: life in general, life overall,
work, leisure, finance, living situation, safety, family, social, and health.

SOCIAL INCLUSION AND QUALITY OF LIFE 30
At baseline, Evans and colleagues (2007) found that the SMI group’s ratings were
significantly lower than all of the ratings of the “healthy population” group for all areas
except for finance; the CMD groups’ ratings were all significantly lower than those of the
“healthy population.” In comparing the SMI and CMD groups’ ratings, the SMI groups’
ratings were significantly higher for general health, family, and living situation;
significantly lower ratings were seen with mental health and life overall.
Sociodemographic factors and quality of life. Hansson (2006) reported that only
weak relationships have been found between sociodemographic variables and QOL in
individuals with SMI and that more research has focused on the clinical variables, which
have been more predictive of QOL. In the study reviewed previously, Evans and
colleagues (2006) found the following significant sociodemographic factors (p < .05) for
the SMI group: age, restricted living situation opportunities, restricted family
opportunities, income and benefit receipt, employment status, and restricted mental
health opportunities. Significant factors (p < .05) for the CMD group included: income,
age, gender, restricted financial opportunities, home ownership, and frequency of contact
with family. In a study of 418 individuals with schizophrenia seeking treatment in out-
patient settings in Nordic countries, the following factors were considered, among others,
as possible objective predictors of QOL: age, sex, living situation (living alone or not),
employment situation, frequency of family contact, and having a close friendship
(Hansson et al., 1999). The only variable which was found to predict variance in QOL
was having a close friendship, which predicted approximately 5% of the variance.
SOCIAL INCLUSION AND QUALITY OF LIFE 31
Social inclusion of individuals with depression and schizophrenia. Based on the
literature reviewed thus far, labels lead to stigma. Symptoms of mental health conditions
and perceptions of stigma, held by individuals with mental health conditions and other
community members, contribute to decreased amounts of social inclusion. The
combination of social distance by community members and withdrawal of individuals
with mental health conditions leads to lower social inclusion. It could be hypothesized
that individuals with SSDs would have different perceptions about levels of social
inclusion than individuals with MDD due to differences in stigma, behaviors, perceived
dangerousness, and insight of the individuals.
Individuals with schizophrenia. Ertugrul and Uluğ (2004) gave the following
interpretations for their results of a positive correlation between experiences of stigma
and symptom severity in a sample of 60 individuals with schizophrenia being treated in
an outpatient setting:
“Patients with schizophrenia may prefer to be distant to others due to their
delusions and suspicions and may perceive more stigmatization as they expect more
negative attitudes from others. It may also be true that symptoms like delusions and
suspiciousness may cause florid behavioral change and are attention-taking, which may
be scary for others and cause more public reaction” (p.76).
Depression. In Ertugrul and Uluğ’s (2004) study involving 60 individuals with
schizophrenia, reported level of depression was positively correlated with answers to an
item on the World Health Organization-Disability Assessment Schedule—II. This item
which purportedly measures perception of stigmatization is as follows, “In the last 30
SOCIAL INCLUSION AND QUALITY OF LIFE 32
days, how much of a problem did you have because of barriers or hindrances in the world
around you” (p. 74). Reported level of depression was the only predictor variable for this
item and predicted 33% of the variance in responses.
Differences due to behaviors. It has been found that individuals with MDD and
those with schizophrenia spectrum disorders are perceived differently (Link et al., 1999).
Also, diagnostic criteria for these two groups of people differ in terms of overt behaviors.
For example, in the active phase of their illness, individuals with schizophrenia spectrum
disorders primarily present with psychotic features including delusions and hallucinations
which may manifest in overt behaviors. Behaviors exhibited during these episodes may
be viewed as more objectionable by other community members than behaviors exhibited
by individuals with MDD (Link et al.). An individual with MDD may be able to limit his
or her experience of stigma by limiting the knowledge of who is informed about the
condition; however, it is harder for individuals with psychotic symptoms to mask their
behavior(s) or appearance(s) which illustrate the symptoms they are experiencing (Leff &
Warner, 2006). Significantly more social distance was shown in response to a vignette
describing an individual with schizophrenia as compared with one describing an
individual with MDD (Link et al.).
Differences due to perceived dangerousness. Despite indications of decreasing
stigma surrounding mental illnesses in the United States, perceptions of dangerousness of
individuals with these illnesses increased between 1950 and 1996, with the vast majority
of violent descriptors being used along with psychotic descriptors (Phelan et al., 2000).
One possibility for these findings given by the researchers is that Americans have
SOCIAL INCLUSION AND QUALITY OF LIFE 33
become more accepting of less severe mental illnesses, but stigma has been less
diminished for individuals with psychosis.
Summary
The Community Mental Health Center Act of 1963 formally began
deinstitutionalization in the United States (Swarbick, 2009). Since then, numerous public
policies, organizations, and movements have aimed to increase the social inclusion of
individuals with mental health conditions, e.g. Supreme Court’s 1999 Olmstead decision,
SAMHSA National Consensus Statement on Mental Health Recovery, CSP, NAMI, and
NIDRR (State of California, 2007; Swarbick, 2009; TU Collaborative; United States
Department of Health and Human Services, 2006). Despite all of these efforts, the stigma
surrounding mental illness contributes to behavioral avoidance and social distance, which
in turn contribute to decreased social inclusion of individuals with mental health
conditions.
Today, the stigma of mental illness continues to impact, detrimentally, the self-
esteem and social functioning of individuals with mental health conditions across
diagnoses (Perlick, 2001). Social inclusion is important for individuals because feeling
socially excluded leads to physical and to mental health problems and, conversely, social
inclusion aids in restorative processes (Lloyd et al., 2006). Less social inclusion may
contribute to a lower QOL, which is considered to be an important, humanistic outcome
of treatment services (Lehman, 1996). QOL considers, minimally, an individual’s
functional status and to his or her access to resources and opportunities (Lehman).
SOCIAL INCLUSION AND QUALITY OF LIFE 34
Despite the salience of QOL as an outcome, according to Evans and colleagues
(2007), few investigations considered whether or not QOL models vary across types of
mental illnesses. Therefore, it is important to determine if individuals diagnosed with
different mental health conditions perceive different amounts of social inclusion. If so,
the determination of how greatly the perception of social inclusion and the type of
diagnosis may impact QOL in individuals diagnosed with different mental health
conditions will aid the field in addressing these factors more completely in their
treatment.
Hypotheses
1. Individuals diagnosed with schizophrenia spectrum disorders report less
subjective and objective experiences of inclusion in social activities than individuals
diagnosed with Major Depressive Disorder.
2. Quality of life is predicted by diagnosis, schizophrenia spectrum disorders
or Major Depressive Disorder, symptom severity, reported subjective experience of social
inclusion, and reported objective social inclusion.

SOCIAL INCLUSION AND QUALITY OF LIFE 35
Chapter 2: Method
This study utilized archival data obtained from baseline interviews of the
Substance Abuse and Mental Health Services Administration/Mental-health Disparities
(SAMHSA/MHD) Multisite Research Initiative (Salzer, Brusilovskiy, Rothbard, &
Haley, 2007). Information regarding methods and data specific to the Philadelphia region
sites was garnered from personal communication with the study’s statistician, E.
Brusilovskiy (January 11, 2012). Participants were consumers at four mental health
agencies who had been diagnosed with a schizophrenia spectrum disorder or major
depression. The participants completed the Quality of Life Scale (QOL Interview
excerpts, Lehman, 1983), Subjective Social Inclusion Scale (QOL Interview excerpts,
Lehman, 1983), Social Acceptance Scale (Well-Being Project, Campbell and Schraiber,
1989), Hopkins Symptoms Checklist (Derogatis et al., 1974), and Colorado Symptom
Index (Shern et al., 1994), as part of the baseline measures. Subjective baseline reports
were compiled and coded into the Statistical Package for the Social Sciences (SPSS) and
statistical analyses were completed.
Design and Design Justification
The study utilized an archival, cross-sectional correlational design using data
from self-report questionnaires. This enabled the use of a multiple regression analysis to
determine if diagnosis, self-reports of frequency of social inclusion, and self-reported
perception of quality of social inclusion are factors in QOL scores.
Archival data analysis was used because it is unobtrusive and imposes no further
burden on the populations from whom the information has been collected. Archival data
SOCIAL INCLUSION AND QUALITY OF LIFE 36
provides a larger and higher-quality database than would be feasible for an individual
researcher to collect on his/her own. Therefore, in order to look for factors in QOL scores
utilizing a secondary data set, a cross-sectional correlational explanatory design was
used.
Participants
Participants in the original dataset took part in the SAMHSA/MHD Multisite
Research Initiative at 4 sites in the Philadelphia area. Lists of individuals meeting
eligibility criteria were compiled and chart reviews were conducted to verify that
eligibility had not changed. Inclusion criteria of the original study were:
a. a primary diagnosis of a schizophrenia spectrum disorder or major
depression
b. being categorized as White or African American, based on administrative
records,
c. over the age of 18,
d. ability to knowledgeably provide consent,
e. and currently receiving psychiatric medication prescriptions at the site,
Recruiting information is provided in the procedures.
Measures
Quality of life. According to Lehman, the QOL Interview was created to evaluate
the QOL experienced by individuals with chronic mental illnesses (1988). To this end it
is focused on the individual’s current functioning and the questions are short and specific.
Pilot trials were conducted until clients were able to understand and answer all items.
The QOL Interview incorporates many facets of life which may affect one’s sense of
welfare and it is structured to reduce the opportunity for interviewer effects. It has been
SOCIAL INCLUSION AND QUALITY OF LIFE 37
used in studies with men, women, Caucasian and minority groups, with those aged 18-65,
individuals who are outpatients, inpatients, chronically mentally ill, and non-patients
(Lehman, 1996).
In this study, QOL will be measured by the use of the QOL Scale used by the
SAMHSA/MHD Multisite Research Initiative; the QOL Scale was made up of 11 of the
54 items of the QOL Interview Subjective QOL Subscales (QOL Interview excerpts,
Lehman, 1983). In 1983, Lehman found that these subscales had internal consistencies,
Cronbach’s alpha, ranging from .74 - .88 across all subscales and locations which were
studied. The one-week test-retest correlations ranged from r = .41 - .95. The QOL
Interview Subjective QOL Subscales measure individuals’ subjective feelings regarding
their well-being across many facets of life. In regard to each item’s content, the
participants answered whether they felt terrible, unhappy, mostly dissatisfied, mixed,
mostly satisfied, pleased or delighted; these answers were scored from 1 to 7,
respectively, along with options for the item not being asked and not being answered. An
example of an item is “How do you feel about the amount of fun you have?” (E.
Brusilovskiy, personal communication, January 11, 2012).
Objective social inclusion. The QOL Interview Frequency of Social Contacts
subscale has individuals report their frequency of engagement with others. In this study,
Objective Social Inclusion (ObjSI) will be measured with the SAMHSA/MHD Multisite
Research Initiative scale, which was made up of 6 of the 10 items of the Quality of Life
Interview Frequency of Social Contacts subscale (QOL Interview excerpts, Lehman,
1983). It is important to note that this scale focuses on social participation; however,

SOCIAL INCLUSION AND QUALITY OF LIFE 38
many researchers consider social inclusion to be multi-dimensional and include such
factors as employment, housing, income, and education (e.g., Morgan et al., 2007).
For each item of the scale, the participants answered whether or not they engage
in the described activity at least once a day, at least once a week, at least once a month,
less than once a month, or not at all; these answers were scored from 5 to 1, respectively,
along with options for the item not being asked and not being answered. An example of
an item is, “visit with someone who does not live with you” (E. Brusilovskiy, personal
communication, January 11, 2012). In 1983, Lehman found that the Social Contacts
subscale had an internal consistency, Cronbach’s alpha, of .70 at both locations which
were studied. The one-week test-retest correlation was r = .69. Although the entire
subscale was not used, Lehman does describe the ability to subdivide some of the scales.
Subjective social inclusion. In this study Subjective Social Inclusion (SubSI), or
individuals’ feelings about their frequency of social inclusion, will be measured by
participants’ ratings of 7 of the 136-item California Well-Being Project Client Interview
(CWBPCI; Well-Being Project, Campbell & Schraiber, 1989). The SAMHSA/MHD
Multisite Research Initiative used these items as a “Social Acceptance Scale.” The
CWBPCI creates a well-being quotient score as a measure of subjective well-being. It has
been used with men, women, Caucasian and minority groups, outpatients, inpatients, the
chronically mentally ill, and with a median age of 35 (Lehman, 1996). According to
Lehman, the Well-Being Project was a consumer designed and consumer run, 3-year
project to better understand well-being concerns of those being treated for mental
illnesses; however, no information was provided on the CWBPCI’s psychometric
SOCIAL INCLUSION AND QUALITY OF LIFE 39
properties. Despite this, because it was consumer-generated, its face validity is strong
(Lehman). Because the SubSI Scale was created from items of the CWBPCI, no
psychometric information regarding reliability or validity is available.
For the first item of the SubSI Scale, the participants indicated how frequently
they felt that they were treated differently when others knew they had received a mental
health diagnosis or had received mental health services. Answers for frequency were:
most of the time, sometimes, seldom or rarely, or never; these answers were scored from
1 to 4, respectively, along with options for no opinion, and for the items not being asked
or not being answered. The remaining 6 items began with “As an individual who has
received mental health services, do you think others…”; response options were, all of the
time, most of the time, sometimes, seldom, and never; the answers were scored from 1 to
5, respectively, along with options for no opinion, and for the items not being asked or
not being answered. An example of an item is “feel or treat you like you are
unpredictable?” (E. Brusilovskiy, personal communication, January 11, 2012). This scale
could also be operationally considered as “perceived stigma” because the items are
related to different aspects of the stigma of mental illness.
Due to differences in how the responses of the SubSI Scale were scored, the data
for the first question of the scale were converted in the following way: responses
previously scored a 1 (Most of the Time) were changed to 2s (Most of the Time on the
scale for questions 2-8). Those previously scored a 2 (Sometimes) were changed to 3s
(Sometimes on the scale for questions 2-8). Responses previously scored a 3 (Seldom or
Rarely) were changed to 4s (Seldom on the scale for questions 2-8). After excluding

SOCIAL INCLUSION AND QUALITY OF LIFE 40
participants with less than an 80% response rate, there were no 4 or ‘Never’ responses to
question 1; therefore, no 4 responses were converted.
Symptom severity measures. In order to control for the level of current
symptoms being experienced by the participants, two symptom measures were utilized,
the Colorado Symptom Index (CSI; Shern et al., 1994) and Hopkins Symptom Checklist
– 25 (HSC; Derogatis et al., 1974).
Colorado Symptom Index. The CSI is widely used in research as a self-report
measure of psychiatric symptomatology; specifically, the symptoms measured by the CSI
can be broadly viewed as anxiety-related and psychotic (Boothroyd & Chen, 2008). It has
been used with homeless adults receiving treatment for substance abuse or mental health
issues, for dually diagnosed populations, and in other studies involving individuals with
SMIs (Boothroyd & Chen). Several studies have shown the CSI to be a reliable and valid
measure of severity of symptoms for individuals with SMIs (Boothroyd, & Chen; Levitt
et al., 1999). Boothroyd and Chen’s study of the CSI involved 3,874 adult Medicaid
recipients in Florida; therefore, some, but not their entire sample was made up of
individuals with psychiatric disabilities. They found the internal consistency,
Chronbach’s alpha, to be between .91 and .92 across the disability sub-groups, with the
overall estimate at .92. Test-retest reliability scores were done with an average of 381
days between administrations, and the correlations ranged from r = .61 - .73 for the sub-
groups, with an overall r = .71 (Boothroyd & Chen). The SAMHSA/MHD Multisite
Research Initiative specifically utilized the Psychosis subscale of the CSI; there is no
reliability or validity information available for the subscale.
SOCIAL INCLUSION AND QUALITY OF LIFE 41
There are 10 items which make up the CSI Psychosis subscale. For each item, the
participants were asked how often he/she had experienced the problem during the
previous month. Answers for frequency were: once during the month, several times
during the month, several times a week, or at least every day; these items were scored
from 1 to 4, respectively, along with options for no opinion, and for the item not being
asked or not being answered. An example of an item is “How often have you heard
voices, or heard or seen things that other people didn’t think were there?” Therefore,
higher scores indicate more frequent psychotic symptoms.
Hopkins Symptom Checklist – 25. This is a 25-item version of the original 90-
question checklist which measures only for depression and anxiety (Feightner & Worrall,
1990). Various forms of this checklist have been created, including forms intended to be
used in primary care settings, forms translated into several languages, and forms used in
therapy to assess changes in symptom severity. Numerous studies have been done on the
different forms with Chronbach’s alpha for internal consistency as high as .95 (Feightner
& Worrall).
For each of the 25 items on the HSC, the participants were asked how bothered or
distressed he/she had been during the past week by a problem or complaint. Answers for
frequency were: not at all, a little, quite a bit, and extremely; these items were scored
from 1 to 4, respectively, along with options for, no opinion, and for the item not being
asked or not being answered. An example of an item is “feeling fearful.” Therefore,
higher scores indicate more severe depression and anxiety symptoms.

SOCIAL INCLUSION AND QUALITY OF LIFE 42
Procedure
This is a secondary data analysis obtained as a de-identified data set; the data
were originally obtained in the following way. The four sites of the SAMHSA/MHD
Multisite Research Initiative in the Philadelphia area recruited consumers from traditional
mental health providers. The following information was obtained from Brusilovskiy:
Four lists were created from each agency, each with the names of individuals
meeting the preceding criteria and separated by race and diagnosis: 1) White and
schizophrenia spectrum DO, 2) African American and schizophrenia spectrum DO, 3)
White and a Major Depression Diagnosis, and 4) African American and a Major
Depression Diagnosis. Chart Reviews were conducted to verify the fact that eligibility
had not changed. The names on each list were then randomly ordered.
Research staff directed agency staff at each agency to approach their clients in
order to inform them about the study and to gain their permission for research staff to
contact them. Agency staff completed a “Consent-to-Contact” (CTC) form that was then
returned to the research staff. All individuals who consented to speak to the research
staff were contacted and informed about the study. Those who agreed to participate were
provided with written consent forms, completed a baseline, and were randomized either
to the experimental or to the control condition. Each participant enrolled in the study was
assigned a sequential Participant ID#. Each participant had an equal probability (50%-
50%) of being assigned either to the experimental or to the control group.
Randomization occurred within site (i.e., each site had its own random assignment list)
and was done in blocks of 10 to avoid runs. A random number sequencer was used, in
SOCIAL INCLUSION AND QUALITY OF LIFE 43
which the sequence of five 1s (i.e., experimental group assignment) and five 2s (i.e.,
control group assignment) were randomly determined for each Participant ID#.
Participants assigned to the experimental condition were referred to the
interventionists at their agency, for the Self-Care Intervention. Additional follow-up
interviews were conducted at 6- and 12-months intervals after the baseline interview.
Each participant received $20 for completion of each individual interview and an
additional $20 if they completed all three interviews (personal communication, 2012).
A common assessment protocol composed of 27 scales was administered at
baseline; of these scales, 5 were included in the current study’s analyzed data. Accuracy
of administration was preserved through the following means: interviewing training
received by all interviewers, interviewers were given directions on how to score each
item, and a manual with a script of the interview that included every item was followed.
An automated data entry system was supplied to each site; this system conducted
consistency checks, locked out any out-of-range responses, and confirmed data with
double entry.
Statistical Plans and Analysis
Two statistical tests were completed. According to Weinfurt (1995), the
Bonferroni inequality states that the overall alpha will be less than or equal to the sum of
the alpha levels from both tests. Therefore, in order to keep the alpha set at α = 0.05, the
alpha level for each test was set at α = 0.025.
Statistical plan for hypothesis I. Hypothesis I states that individuals diagnosed
with schizophrenia spectrum disorders report fewer subjective and objective experiences
SOCIAL INCLUSION AND QUALITY OF LIFE 44
of inclusion in social activities than do individuals diagnosed with Major Depressive
Disorder. To test this hypothesis a multivariate analysis of variance (MANOVA) was
performed. In the MANOVA, type of disorder was the independent variable with 2 levels
(schizophrenia spectrum disorder or Major Depressive Disorder); perceived frequency of
social inclusion (ObjSI) and perceived quality of social inclusion (SubSI) were the 2
dependent variables.
In order to run an F test for MANOVA, a check that the assumptions of the test
are met had to be done, initially. The F test requires that the dependent variables are
correlated (Weinfurt, 1995); therefore, a Pearson product-moment correlation coefficient
was used to determine if ObjSI and SubSI are linearly related. However, if there is a high
correlation between the dependent variables, r ≥ 0.7, then there is multicollinearity and
the variables will be combined into a single measure (Sheskin, 2007). The F test assumes
a normal distribution and is not as robust when used with dependent variables with
extreme outliers (Sheskin). Thus, tests for outliers on the dependent variables were run.
First, boxplots were inspected; if outliers were found, the original mean and trimmed
mean were to be compared. If extreme outliers impacted the mean, the data from the
participant(s) were to be examined and any removal of extreme outliers would be
reviewed in the discussion.
The F test also assumes homogeneity of variances for the dependent variables
(Sheskin, 2007). Levene’s Test of Equality of Error Variances was used to test for
homoscedasticity. Another assumption of the F test is that there is homogeneity of
covariance (Sheskin). To test for homogeneity of covariance, Box’s Test of Equality of

SOCIAL INCLUSION AND QUALITY OF LIFE 45
Covariance Matrices was utilized. The multivariate test statistic was determined by any
violations of assumptions for the F test.
Because Wilks’ lambda is frequently recommended, this statistic would have been
used unless there are unequal sample sizes for the two levels of the independent variable
or if there is heterogeneity of covariance; if either of these conditions is present, Pillai’s
trace would be used as it is the most robust F statistic (Sheskin, 2007).
Statistical plan for hypothesis II. Hypothesis II states that QOL is predicted by
diagnosis, schizophrenia spectrum disorders or Major Depressive Disorder, symptom
severity, reported subjective experience of social inclusion (SubSI), and reported
frequency of social inclusion (ObjSI). To test this hypothesis, a multiple regression was
run. For this test, there is an assumption that multicollinearity does not exist between the
predictor variables and that there is a linear relationship between each predictor variable
and QOL (Sheskin, 2007). Therefore, a Pearson product-moment correlation coefficient
was completed initially to determine if there are any high, linear relations between the
predictor variables, r ≥ 0.7 and to determine if QOL is linearly related to each of the
predictor variables. If multicollinearity had been found, one of the variables would have
been removed from the regression.
Multiple regression also assumes homoscedasticity (Sheskin, 2007). To test for
this, that the errors, or residuals, are normally distributed for any combination of values
on the predictor variables, a scatterplot of the standardized residuals and standardized
predicted values for QOL was analyzed. Outliers can also strongly and negatively impact
the results of a multiple regression (Williams, Grajales, & Kurkiewicz (2013). If outliers

SOCIAL INCLUSION AND QUALITY OF LIFE 46
were found during the inspection of boxplots, the original mean and trimmed mean would
be compared. If extreme outliers impact the mean, the data from the participant(s) would
be examined and any removal of extreme outliers would be addressed in the discussion.

SOCIAL INCLUSION AND QUALITY OF LIFE 47
Chapter 3: Results
Participants
Excluded Participants. There were 1,771 eligible consumers at sites in the
Philadelphia area of the MHD study; of these, 501 were approached and 396 consented
and were enrolled in the original study. In this study, if a participant responded to more
than 20% of the questions on a scale with a ‘No Opinion’ or ‘No Answer,’ the
participant’s data were removed from the statistical analysis(es) involving that scale
because the scale was deemed incomplete and possibly invalid (Schlomer, Bauman, &
Card, 2010). Based on this, 57 participants were excluded because of incomplete
responses on the SubSI scale. Two participants were excluded because of incomplete
responses on the ObjSI scale, and two more participants were excluded because of
incomplete responses on the QOL scale. Furthermore, two more participants were
excluded because their responses were greater than 3 SDs from the mean of the HSC; this
will be discussed further in the statistical analysis section for Hypothesis II.
Therefore, the data from 59 participants were excluded from the statistical
analyses completed for Hypothesis 1, leaving 337 participants’ data. The data from 4
additional participants were excluded from the statistical analyses completed for
Hypothesis 2, leaving 333 participants’ data in the analysis.
Descriptive statistics. Of the participants included in the analysis of Hypothesis
1, 131 were male and 206 were female (39% and 61%, respectively). One hundred
twenty-six participants self-identified as White, 206 identified as Black, and 5 self-
identified as both White and Black (37.4%, 61.1%, and 1.5% respectively). Based on

SOCIAL INCLUSION AND QUALITY OF LIFE 48
their reports, 35 participants were married (10%); 39 were separated (12%); 62 were
divorced (18%); 32 were widowed (9%); 78 had a non-spouse significant other (23%),
and 203 reported being single or never married (60%); these categories exceed 100% in
total because some participants reported falling into multiple categories of the marital
status question. Finally, 199 participants reported having children (59%).
Further information regarding the participants whose data was utilized in the
testing of Hypothesis I is as follows. Vocationally, 39 participants reported working for
pay, 69 participants reported they were involved in volunteer work, and 5 of these
participants reported doing both volunteer and work for pay (12%, 20%, and 1%,
respectively). Furthermore, 264 participants reported being disabled; 287 were
unemployed; 282 participants reported having received Social Security income in the
previous 30 days, and 53 reported being retired (78%, 85%, 84%, and 16% respectively).
Again, these categories exceed 100% in total because some participants reported falling
into multiple categories vocationally.
The participants educational attainment is as follows: 46 completed less than 9
years of school, 99 completed 9-12 years of school but did not graduate, 108 graduated
from high school or completed his/her GED, 58 had some college/vocational training,
and 19 were Associate, vocational, or college graduates; 7 participants did not respond to
this question (14%, 29%, 32%, 17%, 6%, and 2%, respectively). Table 1 presents
demographic characteristics of the participants who were included in the testing of both
hypotheses, characteristics of those who were excluded from the testing of Hypothesis 1,
and the characteristics of those who were excluded from the testing of Hypothesis 2.
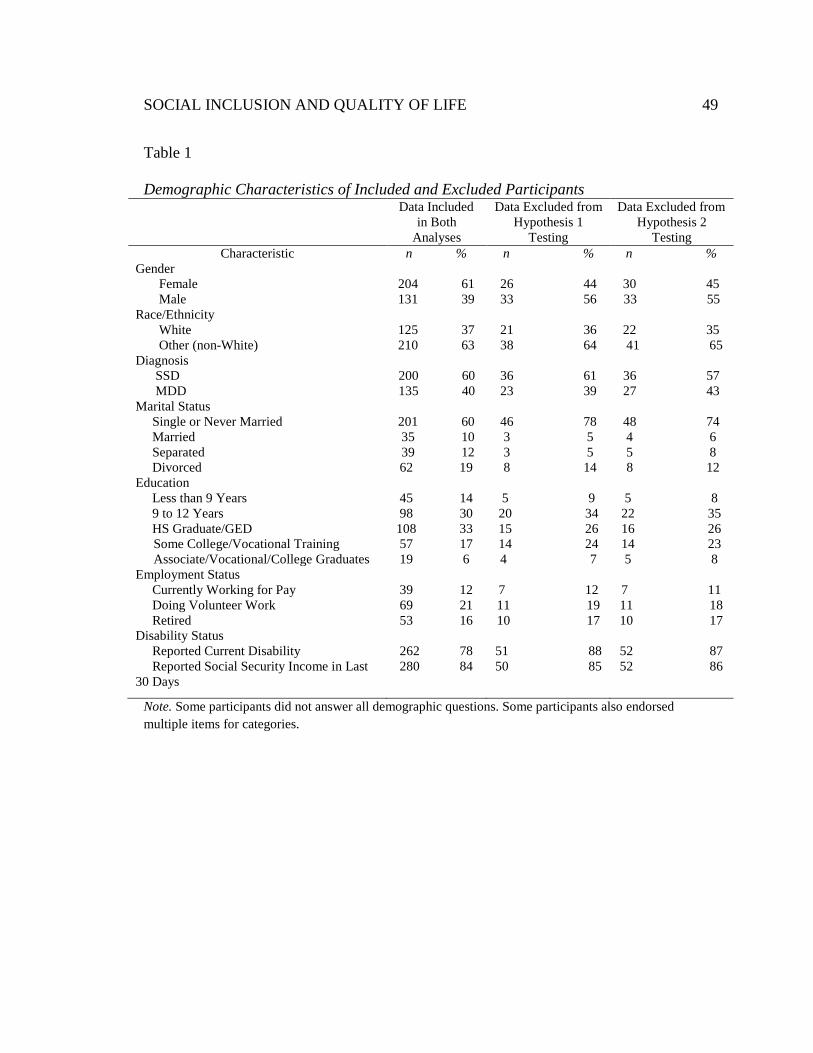
SOCIAL INCLUSION AND QUALITY OF LIFE 49
Table 1
Demographic Characteristics of Included and Excluded Participants Data Included
in Both Analyses
Data Excluded from Hypothesis 1
Testing
Data Excluded from Hypothesis 2
Testing Characteristic n % n % n %
Gender Female Male
204 61 131 39
26 44 33 56
30 45 33 55
Race/Ethnicity White Other (non-White)
125 37 210 63
21 36 38 64
22 35
41 65 Diagnosis
SSD MDD
200 60 135 40
36 61 23 39
36 57 27 43
Marital Status Single or Never Married Married Separated Divorced
201 60 35 10 39 12
62 19
46 78 3 5 3 5
8 14
48 74 4 6 5 8 8 12
Education Less than 9 Years 9 to 12 Years HS Graduate/GED
Some College/Vocational Training Associate/Vocational/College Graduates
45 14 98 30
108 33 57 17
19 6
5 9
20 34 15 26 14 24 4 7
5 8
22 35 16 26 14 23 5 8
Employment Status Currently Working for Pay Doing Volunteer Work Retired
39 12 69 21 53 16
7 12 11 19 10 17
7 11 11 18 10 17
Disability Status Reported Current Disability Reported Social Security Income in Last 30 Days
262 78 280 84
51 88 50 85
52 87 52 86
Note. Some participants did not answer all demographic questions. Some participants also endorsed multiple items for categories.
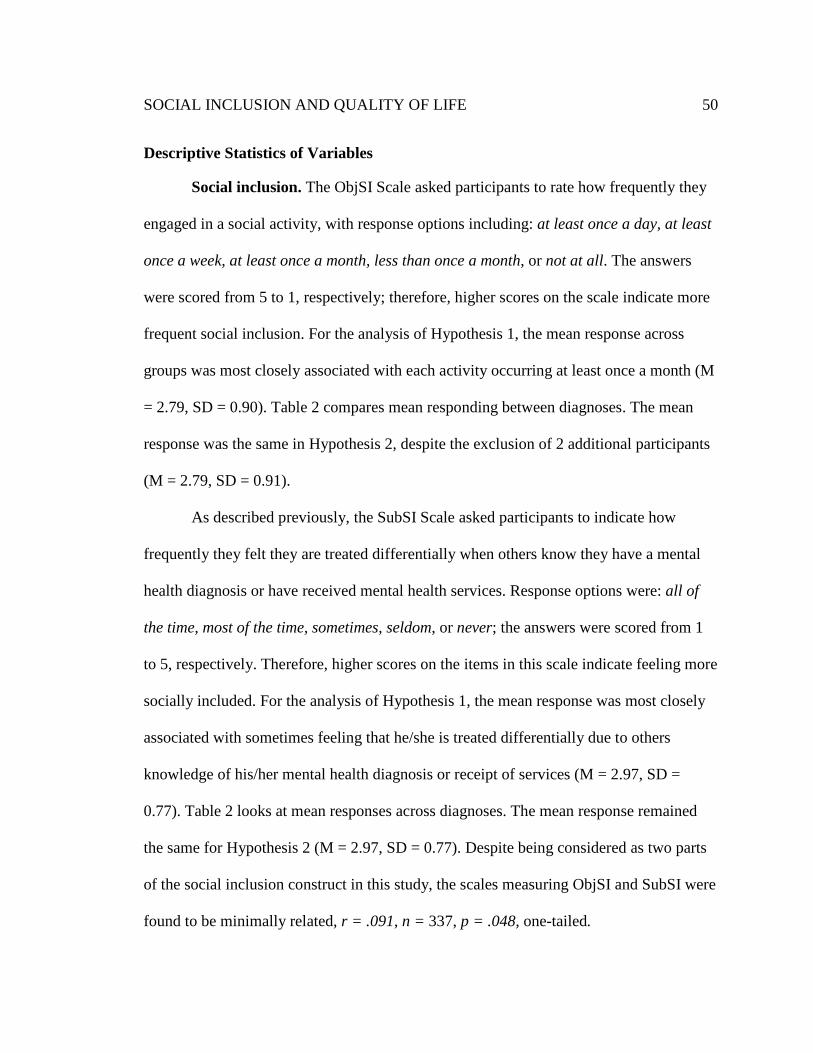
SOCIAL INCLUSION AND QUALITY OF LIFE 50
Descriptive Statistics of Variables
Social inclusion. The ObjSI Scale asked participants to rate how frequently they
engaged in a social activity, with response options including: at least once a day, at least
once a week, at least once a month, less than once a month, or not at all. The answers
were scored from 5 to 1, respectively; therefore, higher scores on the scale indicate more
frequent social inclusion. For the analysis of Hypothesis 1, the mean response across
groups was most closely associated with each activity occurring at least once a month (M
= 2.79, SD = 0.90). Table 2 compares mean responding between diagnoses. The mean
response was the same in Hypothesis 2, despite the exclusion of 2 additional participants
(M = 2.79, SD = 0.91).
As described previously, the SubSI Scale asked participants to indicate how
frequently they felt they are treated differentially when others know they have a mental
health diagnosis or have received mental health services. Response options were: all of
the time, most of the time, sometimes, seldom, or never; the answers were scored from 1
to 5, respectively. Therefore, higher scores on the items in this scale indicate feeling more
socially included. For the analysis of Hypothesis 1, the mean response was most closely
associated with sometimes feeling that he/she is treated differentially due to others
knowledge of his/her mental health diagnosis or receipt of services (M = 2.97, SD =
0.77). Table 2 looks at mean responses across diagnoses. The mean response remained
the same for Hypothesis 2 (M = 2.97, SD = 0.77). Despite being considered as two parts
of the social inclusion construct in this study, the scales measuring ObjSI and SubSI were
found to be minimally related, r = .091, n = 337, p = .048, one-tailed.
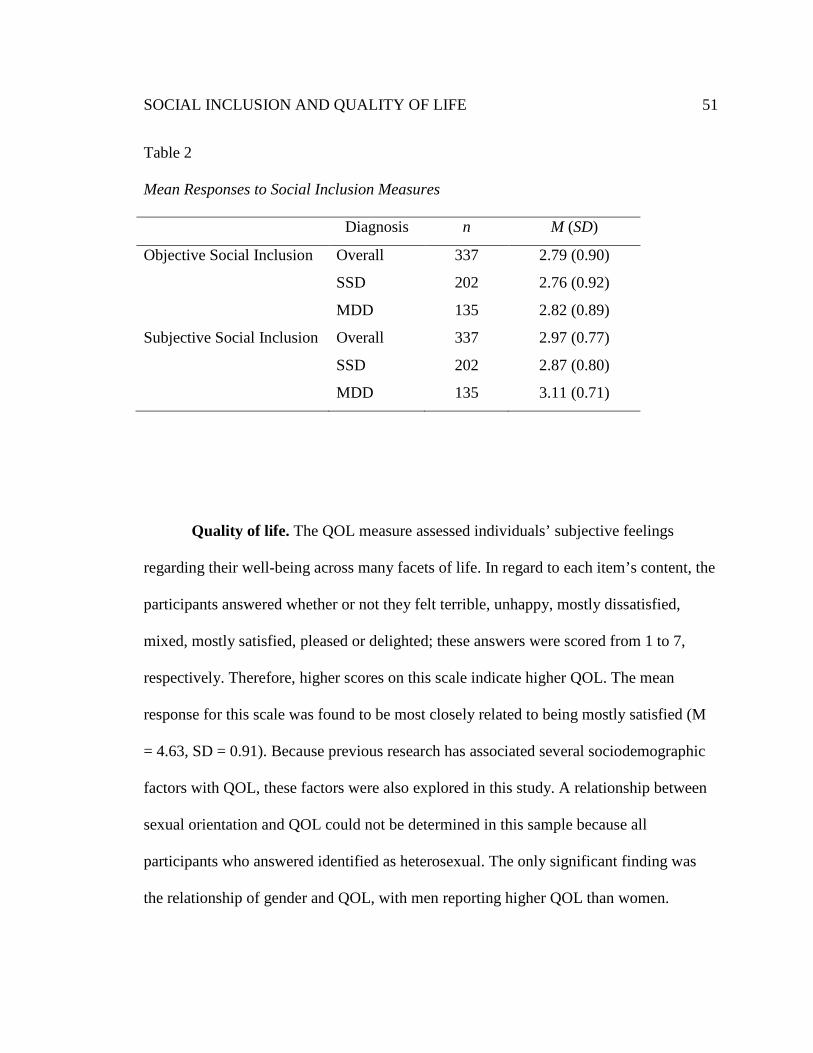
SOCIAL INCLUSION AND QUALITY OF LIFE 51
Table 2
Mean Responses to Social Inclusion Measures
Diagnosis n M (SD)
Objective Social Inclusion Overall
SSD
MDD
337
202
135
2.79 (0.90)
2.76 (0.92)
2.82 (0.89)
Subjective Social Inclusion Overall
SSD
MDD
337
202
135
2.97 (0.77)
2.87 (0.80)
3.11 (0.71)
Quality of life. The QOL measure assessed individuals’ subjective feelings
regarding their well-being across many facets of life. In regard to each item’s content, the
participants answered whether or not they felt terrible, unhappy, mostly dissatisfied,
mixed, mostly satisfied, pleased or delighted; these answers were scored from 1 to 7,
respectively. Therefore, higher scores on this scale indicate higher QOL. The mean
response for this scale was found to be most closely related to being mostly satisfied (M
= 4.63, SD = 0.91). Because previous research has associated several sociodemographic
factors with QOL, these factors were also explored in this study. A relationship between
sexual orientation and QOL could not be determined in this sample because all
participants who answered identified as heterosexual. The only significant finding was
the relationship of gender and QOL, with men reporting higher QOL than women.

SOCIAL INCLUSION AND QUALITY OF LIFE 52
Table 3
QOL Scores
N M(SD) Gender*
Male Female
131 204
4.82 (0.89) 4.50 (0.90)
Race/Ethnicity White Other (non-White)
124 211
4.55 (0.87) 4.67 (0.93)
Marital Status Single/Never Married Other
201 132
4.64 (0.93) 4.59 (0.86)
Children Yes No
198 136
4.58 (0.94) 4.69 (0.86)
Working for Pay Yes No
39 295
4.79 (0.91) 4.61 (0.89)
Currently Disabled Yes No
262 72
4.59 (0.92) 4.78 (0.82)
*p = .001
To determine if there was a difference between male and female participants’
reports of QOL, Levene’s test to measure homogeneity of variances was first performed.
It revealed that variances were unequal, F(333) = 0.75, p = .001. Therefore, the t-test for
two independent samples with equal variances not assumed was run, revealing that
female participants’ QOL scores (M = 4.50, SD = 0.90) were significantly different from
male QOL scores (M = 4.82, SD = 0.89), t(278.397) = 3.217, p = .001, two-tails. Table 3
summarizes the possible relationships which were explored.
Symptom severity. As discussed previously, the CSI is widely used in research
as a self-report measure of psychiatric symptomatology. This study utilized the Psychosis

SOCIAL INCLUSION AND QUALITY OF LIFE 53
subscale of the CSI; the participants were asked how often he/she had experienced
different problems related to psychotic symptoms during the previous month. Answers
for frequency were: once during the month, several times during the month, several times
a week, or at least every day; these items were scored from 1 to 4, respectively.
Therefore, higher scores indicated more frequent psychotic symptoms. The mean
response (M = 2.25, SD = 0.95) was most closely associated with having each problem
several times during the month. Table 4 looks at mean responses across diagnoses.
Although individuals with MDD reported more frequent symptoms on the CSI than did
individuals diagnosed with SSDs, the difference was not significant, t(331) = -1.399, p =
.163 , two-tails.
The HSC, as described previously, is a self-report checklist which focuses on
depression and anxiety. For each of the 25 items on the HSC, the participants were asked
how bothered or distressed he/she had been during the past week by a problem or
complaint. Answers for frequency were: not at all, a little, quite a bit, and extremely;
these items were scored from 1 to 4, respectively. Therefore, higher scores indicate more
severe depression and anxiety symptoms. The mean response (M = 1.80, SD = 0.56) was
most closely associated with being bothered/distressed by each symptom, ‘a little’, during
the previous week. Table 4 looks at mean responses across diagnoses. Individuals with
MDD reported significantly more frequent symptoms on the HSC than did individuals
diagnosed with SSDs, t(331) = -3.872, p < .001, two-tails.

SOCIAL INCLUSION AND QUALITY OF LIFE 54
Table 4.
Responses to Symptom Severity Measures
Diagnosis n M(SD)
CSI Overall
SSD
MDD
333
202
131
2.25 (0.95)
2.19 (0.99)
2.34 (0.88)
HSC Total*
Anxiety Subscale
Depression Subscale
Somatic Subscale
Overall
SSD
MDD
Overall
SSD
MDD
Overall
SSD
MDD
Overall
SSD
MDD
333
202
131
333
202
131
332
201
131
333
202
131
1.80 (0.56)
1.70 (0.53)
1.94 (0.57)
1.77 (0.63)
1.70 (0.58)
1.87 (0.68)
1.82 (0.62)
1.71 (0.59)
2.00 (0.61)
1.74 (0.60)
1.67 (0.60)
1.85 (0.59)
*p < .001
Multivariate Analyses
Statistical methods employed in testing hypothesis I. Hypothesis I examined if
individuals diagnosed with schizophrenia spectrum disorders reported fewer subjective
and objective experiences of inclusion in social activities than individuals diagnosed with

SOCIAL INCLUSION AND QUALITY OF LIFE 55
Major Depressive Disorder. To test this hypothesis a multivariate analysis of variance
(MANOVA) was performed. In the MANOVA, type of disorder was the independent
variable with 2 levels (schizophrenia spectrum disorder or Major Depressive Disorder),
and SubSI and ObjSI were 2 dependent variables.
In order to run an F test for MANOVA, a check of the assumptions for
MANOVA was conducted. The F test requires that the dependent variables are correlated
(Weinfurt, 1995); the dependent variables, ObjSI and SubSI, were found to be
significantly, linearly related with r = .091, n = 337, p = .048, one-tailed. The F test for
MANOVA also assumes a normal distribution and is not as robust when used with
dependent variables with extreme outliers (Sheskin, 2007). Thus, boxplots for ObjSI and
SubSI were examined. Because no outliers were found, no further testing of outliers was
needed.
Another assumption of the F test is homogeneity of variances for the dependent
variables (Sheskin). In the case of ObjSI, Levene’s Statistic indicated that this variable
met the homogeneity of variance assumption F(1,335) = 1.007, p = .316. However,
homoscedasticity was not found through Levene’s Test of Equality of Error Variances for
SubSI, F(1, 335) = 6.026, p = .015. A final assumption of the F test is that there is
homogeneity of covariance (Sheskin). To test for homogeneity of covariance, Box’s Test
of Equality of Covariance Matrices was utilized and homogeneity of covariance was
found, F(3, 4625414.841) = 0.791, p = .499. Sheskin (p. 1439) recommends using a
more robust test if the homogeneity of variance assumption is not met; therefore, Pillai’s
Trace was used as it is the most robust F statistic (Sheskin).

SOCIAL INCLUSION AND QUALITY OF LIFE 56
Pillai’s Trace rejected the null hypothesis for Hypothesis I and revealed that there
was an effect of diagnosis on social inclusion F(2, 334) = 3.870, p = .022. Tests of
between-subjects effects showed a statistically significant effect of diagnosis on SubSI, p
= .006; however, there was not a significant effect of diagnosis on ObjSI, p = .593.
Overall, participants diagnosed with an SSD were found to report less social inclusion
than participants diagnosed with MDD; specifically, participants diagnosed with an SSD
reported significantly lower SubSI than participants diagnosed with MDD.
Statistical methods employed in testing hypothesis II. Hypothesis II tested if
QOL was predicted by diagnosis, SSD or MDD, symptom severity (measured by the
HSC and CSI), reported SubSI, and reported ObjSI. Because some sociodemographic
variables have been found to be related to QOL, several t-tests were completed to see if
any such variables should be added to the regression equation. None of the following
group divisions met significance: white/non-white, marital status, having children or not,
educational attainment, employment status, or whether or not they reported that they were
currently disabled. The only sociodemographic variable found to have a significant
difference between groups was gender; the significance of this difference will be
discussed in a succeeding paragraph. Therefore, in the final regression equation used for
predicting QOL, diagnosis (SSD or MDD), SubSI, ObjSI, HSC, CSI, and gender were the
6 predictor variables.
When completing a multiple regression, there is an assumption that
multicollinearity does not exist between the predictor variables (Sheskin, 2007).
Therefore, Pearson Product-moment correlations were completed between all predictor

SOCIAL INCLUSION AND QUALITY OF LIFE 57
variables. The results are summarized in Table 5. Although there were many significant
relationships between the predictor variables, none was large enough, r > .7, to indicate
that there was any multicollinearity between them. There is also an assumption of
linearity, that there is a linear relationship between each predictor variable and QOL
(Sheskin). Therefore, Pearson product-moment correlation coefficients were determined
for QOL and each of the predictor variables; all of the predictor variables were found to
be significantly, linearly related to QOL. These results are also shown in Table 5.
Multiple regression also assumes homoscedasticity (Sheskin, 2007). To test for
this, that the errors, or residuals, are normally distributed for any combination of values
on the predictor variables a scatterplot of the standardized residuals and standardized
predicted values for QOL was analyzed. Visual inspection revealed that the residuals
were normally distributed. Boxplots of all of the predictor variables were also inspected
for the presence of outliers. Because 2 of the participants’ scores were more than 3 SDs
above the mean for the HSC (more than 3.2 and 3.5), the data from these participants
were removed from the regression analysis.
Utilizing linear regression, the null hypothesis was rejected for Hypothesis II.
Combined, the final six predictor variables accounted for about 31.3% of the variability
in QOL, F(6, 326) = 26.252, p <.001, adjusted r2 = .313. ObjSI, SubSI, HSC, and
diagnosis were found to significantly predict QOL. However, gender and CSI did not
significantly predict QOL. Specifically, higher scores on the ObjSI and SubSI measures
predicted higher QOL scores. Fewer symptoms indicated on the HSC predicted higher
QOL scores. Finally, a diagnosis of SSD was also predictive of higher QOL scores than

SOCIAL INCLUSION AND QUALITY OF LIFE 58
was a diagnosis of MDD. The standardized beta coefficients and t-test results are shown
in Table 6. Without the exclusions of the HSC outliers, the finding for the model was
F(6, 328) = 25.228, p <.001, adjusted r2 = .303.
Table 5
Correlations between Predictor Variables and QOL for Hypothesis II
Gender SubSI ObjSI Diagnosis HSC CSI QOL Gender Pearson Correlation Significance, 1-tailed N
1 333
.002 .488 333
-.012 .414 333
-.321 <.001*** 333
-.210 <.001*** 333
-.123 .012* 333
.167 <.001*** 333
SubSI Pearson Correlation Significance, 1-tailed N
.002 .488 333
1 333
.094 .044* 333
.163 .001*** 333
-.417 <.001*** 333
-.414 <.001*** 333
.424 <.001*** 333
ObjSI Pearson Correlation Significance, 1-tailed N
-.012 .414 333
.094 .044* 333
1 333
.037 .253 333
-.129 .009** 333
-.118 .016* 333
.268 <.001*** 333
Diagnosis Pearson Correlation Significance, 1-tailed N
-.321 <.001*** 333
.163 .001*** 333
.037 .253 333
1 333
.208 <.001*** 333
.077 .081 333
-.147 .004** 333
HSC Pearson Correlation Significance, 1-tailed N
-.210 <.001*** 333
-.417 <.001*** 333
-.129 .009** 333
.208 <.001*** 333
1 333
.657 <.001*** 333
-.418 <.001*** 333
CSI Pearson Correlation Significance, 1-tailed N
-.123 .012* 333
-.414 <.001*** 333
-.118 .016* 333
.077 .081 333
.657 <.001*** 333
1 333
-.273 <.001*** 333
QOL Pearson Correlation Significance, 1-tailed N
.167 <.001*** 333
.424 <.001*** 333
.268 <.001*** 333
-.147 .004** 333
-.418 <.001*** 333
-.273 <.001*** 333
1 333
Note. For the gender analyses, female was coded as 0 and male was coded as 1. For the diagnosis analyses, SSD was coded as 1 and MDD was coded as 2
* p < .05. ** p < .01. ***p < .001.
SOCIAL INCLUSION AND QUALITY OF LIFE 59
Table 6.
Predictors of QOL
β T
SubSI .36** 6.73
ObjSI .22** 4.75
HSC -.25** -3.89
Diagnosis -.14* -2.82
Gender .08 1.67
CSI .09 1.39
Note. df = 326. For the gender analyses, female was coded as 0 and male was coded as 1. For the diagnosis analyses, SSD was coded as 1 and MDD was coded as 2 * p < .01. **p < .001.
SOCIAL INCLUSION AND QUALITY OF LIFE 60
Chapter 4: Discussion
Bonner, Barr, and Hoskins (2002) found that people with mental health problems
are over-represented in groups which are socially excluded; therefore, they are not
partaking in community activities with the same frequency as other people. Despite these
findings, few studies have explored differences in social inclusion across diagnoses. Less
social inclusion may contribute to a lower QOL, which is considered to be an important,
humanistic outcome of treatment services (Lehman, 1996). Therefore, the present study
examined differences in reported SubSI and ObjSI between individuals diagnosed with
SSDs and those diagnosed with MDD. Furthermore, the amount of variance in QOL
which can be predicted by type of diagnosis, SSDs or MDD, level of symptoms, gender,
and reported SubSI and ObjSI was studied.
Social Inclusion Measures
The scales used to measure SubSI and ObjSI in this study were created in the
1980s, i.e., 1989 and 1983 respectively (QOL Interview excerpts, Lehman, 1983; Well-
Being Project, Campbell and Schraiber, 1989). Since that time, the understanding of
social inclusion within the field of mental health has evolved. Today, the SubSI scale
may be more appropriately called and understood as “perceived stigma” and the ObjSI
scale may be seen as only one part of social inclusion, more specifically, “social
participation.” The impact of these possible, alternative interpretations on the results of
the analyses will be discussed further.

SOCIAL INCLUSION AND QUALITY OF LIFE 61
Social Inclusion and Diagnoses
It was found that individuals diagnosed with an SSD reported lower SubSI and
lower ObjSI than individuals diagnosed with MDD. Follow up tests revealed that,
specifically, participants diagnosed with an SSD reported significantly lower SubSI than
participants diagnosed with MDD. This means that although rates of social participation
are similar across diagnoses, individuals with SSDs report significantly higher perceived
stigma than individuals with MDD.
This finding fits with research conducted on attitudes that both the public and
professionals have toward individuals with serious mental illnesses (e.g., Latalova,
Kamaradova, & Prasko, 2014; Mittal et al., 2014). The stigma literature has found that
SSDs continues to elicit higher levels of prejudice, when compared with MDD and other
mental health conditions (Mittal et al., 2014; Pescosolido, Medina, Martin, & Long,
2013). Amongst respondents who defined a person who is ‘mentally ill’ as behaving
psychotically, the perception of dangerousness of individuals with mental health illnesses
has actually increased between 1950 and 1996. Participants who defined a ‘mentally ill’
person with descriptors indicating breaks with reality and bizarre behavior often used
violent descriptors as well (Phelan et al., 2000). Phelan and colleagues also argued that
these findings are due to Americans having become more accepting of less severe mental
illnesses, such as MDD in this study; however, stigma has been less diminished for
individuals with psychosis, such as those with SSDs in the current study.
Wahl (2004) has written extensively about the media depictions of mental
illnesses, which often involve stereotyped characterizations, leading to more

SOCIAL INCLUSION AND QUALITY OF LIFE 62
stigmatization of this population. Morgan and colleagues (2007) discuss how the
discriminatory views of community members may lead to fewer opportunities for social
engagement for individuals with mental health conditions; therefore, there would be
fewer opportunities for individuals with SSDs than for those with MDDs in this study.
Discriminatory behaviors have also made it very difficult for individuals with SMIs to
obtain and keep steady employment, obtain housing, and participate in social and/or
leisure activities (Bonner et al., 2002; Leff & Warner, 2006; Stuart, 2006).
In addition to public stigma, research has also indicated that individuals with
serious mental illnesses at times endorse the public’s stigmatizing beliefs and attitudes
with regard to individuals with mental health problems (Link & Phelan, 2001). This
internalization of stigma, termed self-stigma, often leads to feelings of shame and
embarrassment as well as to poor self-esteem and sense of self-worth. Self-stigma has
also been suggested to contribute to individuals not setting goals and to not taking risks
because they expect to fail (Corrigan, Larson, & Rüsch 2009; Latalova et al., 2014). This
same mechanism of self-stigma is thought to deter individuals from being involved in the
activities which are available to them (Morgan et al., 2007). In this study, individuals
with SSDs may be experiencing more self-stigma than those with MDDs, thus dissuading
individuals with SSDs from greater involvement in community activities.
The Prediction of Quality of Life
Hypothesis II, that QOL is predicted by diagnosis, SSD or MDD, ObjSI, and
SubSI, symptom severity (as measured by the HSC and CSI), and any sociodemographic
variables, was found to be supported. Diagnosis, ObjSI, SubSI, and symptom severity

SOCIAL INCLUSION AND QUALITY OF LIFE 63
were found to be significant predictors of QOL. Specifically, higher scores on the ObjSI
and SubSI measures predicted higher QOL scores. Also, a diagnosis of a SSD was
predictive of higher QOL scores than was a diagnosis of MDD. Experiencing fewer
symptoms, as measured by the HSC, was also found to be predictive of higher QOL
scores.
Although predicting QOL from ObjSI and SubSI had not been specifically
considered previously, it does follow from earlier research. In a review of research on
QOL in individuals with SMIs, Hansson discusses the fact that significant associations
have been found in this population between QOL and size and quality of one’s social
network (2006). Although overall ObjSI and SubSI have not been used to predict QOL
for individuals with SMIs previously, information related to social inclusion and
contained within the constructs of social inclusion have been considered. Specifically, in
an outpatient sample of individuals with schizophrenia, the only variable which was
found to predict variance in QOL was having a close friendship, which predicted
approximately 5% of the variance (Hansson et al., 1999). Also, in another outpatient
sample of individuals with schizophrenia, over 8% of the variance in level of QOL was
predicted by the individuals’ levels of satisfaction with their social networks (Bengtsson-
Tops & Hansson, 2001).
Many people, including professionals in the field of mental health, would argue
that diagnosis and/or severity of symptoms would be the largest predictors of QOL for
individuals with SMIs. However, this was not found in this study. The predictor variable
with the highest correlation with QOL in this study was SubSI, or perceived stigma.

SOCIAL INCLUSION AND QUALITY OF LIFE 64
SubSI was also more highly correlated with QOL than ObjSI or social participation. This
would suggest that clinicians and researchers may need to be more closely focused on the
impact that the perception of stigma has on individuals with SMIs than is currently the
case. The lack of relationships between QOL and sociodemographic factors is also
consistent with previous research in samples with mental health illnesses. Hansson (2006)
reported that only weak relationships had been found between such variables and QOL.
In this study, the only sociodemographic factor which was found to be related to QOL
was gender, with men reporting higher QOL scores than women. Although this difference
was statistically significant, the correlation between gender and QOL was small and
gender was not significantly predictive of QOL when it was entered in the linear
regression analysis.
Individuals with schizophrenia reported higher QOL scores as compared with the
study participants who had a diagnosis of MDD; this may at first seem counterintuitive.
However, Gladis, Gosch, Dishuk, and Crits-Christoph (1999) stated that self-report
ratings of QOL appeared to be dependent on the affective state of the individual. If a
negative affective state causes one to report lower scores for QOL, it would follow that
individuals with MDD would have lower QOL scores in this study. Hansson also
discusses the impact of severity of depressive symptoms on QOL; in his review of QOL
research for individuals with SMIs, he states that severity of depressive symptoms is the
strongest psychopathologic feature related to QOL (2006). He also reports that symptoms
of anxiety also negatively impact QOL. In contrast, Hansson reports that the impacts of

SOCIAL INCLUSION AND QUALITY OF LIFE 65
negative symptoms and positive symptoms, such as hallucinations and delusions, have
not been found, consistently, to predict QOL.
In this sample, individuals with MDD reported significantly more frequent
symptoms on the HSC than did individuals with SSDs. Because the HSC focuses on
depressive symptoms, the possibility that affective state may bias self-reporting for QOL
may also be related to the predictive ability of the HSC for QOL in this study. Although
the difference only approached significance, the finding that individuals with MDD in
this sample also had higher scores on the CSI Psychosis subscale than did individuals
with SSDs also supports the idea that affective state may impact self-reporting. Another
possible interpretation argued by Hansson (2006) is that depressive symptoms may be
impacting other things in the individual’s life, such as information processing; therefore,
the scores reported are a valid representation of the individual’s assessment of
him/herself, including QOL and frequency of symptom experience.
Differences in QOL scores, specifically between MDD and SSD populations, had
not been compared prior to this study. However, Evans and colleagues (2007) compared
QOL scores of individuals with SMIs, defined as having had a psychotic illness for over
2 years and having had at least 2 psychiatric hospitalizations with at least 1 of the
hospitalizations occurring in the previous 2 years, with QOL scores of individuals with
common mental disorders, defined as having significant non-psychotic symptoms while
living in the community, these individuals primarily exhibited depression and anxiety
symptoms. In contrast to the current study, the SMI group in their study had significantly
lower ratings for life overall than the common disorders group.

SOCIAL INCLUSION AND QUALITY OF LIFE 66
There are several possible reasons for this contrast in findings, including the
following. It is possible that the measure used by Evans and colleagues for “life overall”
is significantly different in scope from the QOL measure in this study (2007). It is also
possible that the magnitude of depressive symptoms measured in this study was
significantly greater than in their common disorders group. There may be a threshold at
which depressive symptoms seen in MDD predict QOL, whereas a grouping of
depressive symptoms seen in a community sample, as measured by Evans and colleagues,
does not significantly predict QOL.
Implications
The knowledge that individuals diagnosed with an SSD report lower social
inclusion than individuals diagnosed with MDD is important to clinicians, advocates and
policy makers for several reasons. It should be highlighted, however, that although there
was a significant difference in scores between the groups, there was also overlapping of
scores; therefore, many of these statements may also apply to individuals with MDD.
When working with individuals with SSDs, clinicians should be aware that their clients’
perceptions of, and actual levels of social inclusion may have several consequences.
Significantly greater social distance has been shown in response to vignettes
describing an individual with schizophrenia as compared with ones describing an
individual with MDD (Angermeyer et al., 2004; Link et al., 1999). Despite the increase in
knowledge about the etiology of mental health disorders, social distance remains
prevalent throughout the world, even within healthcare providers, especially towards
individuals with psychotic illnesses (e.g., Angermeyer et al., 2004; Evans-Lacko, Corker,

SOCIAL INCLUSION AND QUALITY OF LIFE 67
Williams, Henderson, & Thornicroft, 2014; Mittal et al., 2014; Pescosolido et al., 2013).
Due to social distance, access to natural support networks, such as family, friends, and
community groups, to aid in their recovery are less available to individuals with SSDs.
Discriminatory behaviors have also made it very difficult for individuals with
SSDs to obtain and keep steady employment; limited employment opportunities are
interrelated with other problems that individuals with SSDs have; these include limited
income, obtaining housing, limited educational opportunities, and minimized ability to
participate in social and/or leisure activities (Bonner et al., 2002; Leff & Warner, 2006;
Stuart, 2006). The knowledge of these consequences of reduced social inclusion in
individuals with SSDs, as compared with those who have MDD, can help clinicians tailor
treatment goals, treatment planning, and therapeutic milieu more appropriately for their
clients.
For example, a client with SMI may have an employment goal; however, s/he
does not complete objectives related to job searching. As part of treatment, the clinician
should consider and discuss with the client, past experiences s/he has had; individuals
who do not feel that they are accepted by their social environment may lack the
motivation to become more involved in his/her community due to fear of future
rejections.
QOL is a frequently used outcome variable for treatment (Gladis et al., 1999). The
knowledge of predictor variables, including their strength, garnered from this study
should influence the use of QOL as an outcome variable in future research. Specifically,

SOCIAL INCLUSION AND QUALITY OF LIFE 68
levels of social inclusion and diagnosis may need to be controlled for in order to
determine treatment effects.
In order to customize treatment to improve QOL in individuals with SMIs,
clinicians should consider the following factors (Hansson, 2006). Treatment should
emphasize enhancing the individual’s social network; this will probably require the
consideration of past discriminatory experiences and unsuccessful attempts at engaging in
social activities. Because future negative encounters are probable, treatment should focus
on assertiveness skills and the creation of a sense of self-efficacy through pre-planned in
vivo experiences.
It is also important for clinicians to consider both public stigma and self-stigma
when working with individuals with SMIs. As noted previously, the SubSI scale was the
most highly correlated with QOL and probably should be understood as perceived
stigma. Because the predictive ability of public stigma and of self-stigma cannot be
parsed out in this study, clinicians should explore the impacts of both with their clients
and future studies should look at the effects of these variables separately. Research
regarding effective interventions and anti-stigma campaigns to address both public stigma
and self-stigma will be discussed in subsequent paragraphs.
Limitations
The first limitation of the study involves the actual differences in SubSI mean
scores between individuals diagnosed with SSDs and those diagnosed with MDD.
Although the result was statistically significant, the clinical significance may be
negligible. As described previously, the SubSI Scale asked participants to indicate how

SOCIAL INCLUSION AND QUALITY OF LIFE 69
frequently they have felt that they are treated differentially when others know they have a
mental health diagnosis or have received mental health services. The mean score for the
SSD group was 2.87 and the mean score of the MDD group was 3.11. For the SubSI
scale, most of the time was scored as a 2, sometimes as a 3, and seldom or rarely was
scored as 4. Due to the amount of overlap in mean scores between the groups, along with
how closely most of the time and sometime’ may be considered to be, the difference in
SubSI between the groups may be too small to be felt subjectively.
Two limitations of this study are related to its design. First, the study utilized an
archival data set. Accordingly, the determination of what data would be collected was not
based on the current study’s hypotheses and therefore more appropriate measures may
have been available to test the hypotheses. Also, the data utilized were obtained from
self-report questionnaires. There are several possible problems with this, including
fatigue effects due to the length of the interview in the original data collection and the
problems with lack of responding to items.
Another significant limitation of the current study is related to the lack of
consensus in the field of human services on the meaning of social inclusion; therefore,
reliable and valid measures of this concept are lacking. Therefore, the reliability and
validity of the subjective measure of social inclusion, despite strong face validity, are
questionable.
The diagnostic accuracy in this study also cannot be ensured. Participants were
grouped by diagnostic category based upon diagnoses available in their charts at their

SOCIAL INCLUSION AND QUALITY OF LIFE 70
respective treatment centers. No formal diagnostic procedure was completed by the
researchers.
A final limitation of this study is the exclusion of some of the participants from
the data set. Although no significant differences were seen across sociodemographic
factors of individuals included and excluded from analyses, as displayed in Table 2, the
need to make exclusions does limit the study’s generalizability.
Future Directions
Models of social inclusion. Many researchers have called for the
operationalization of the concept of social inclusion to enhance research and enhance its
use in clinical care (e.g., Morgan et al., 2007; Ware et al., 2007). The development of
models of social inclusion would lead to a stronger definition of the concept and promote
consensus (Ware et al., 2007). The validity and reliability of objective and subjective
measures of social inclusion could then be measured to ensure that they are
psychometrically sound. Ware et al. caution that in defining social inclusion, either
individuals with mental illnesses or societal groups may be implicated as being the source
of the problem; therefore, that group, individuals with mental illnesses or a societal
group, is then named as the sole group which should work to change the current state of
inclusion. However, both groups need to take steps to change; societal groups need to
increase opportunities for the individuals and individuals with mental illnesses need to
work on skill building to maximize their opportunities. Also, the idea of social inclusion
as a process and not just an outcome needs to be considered.

SOCIAL INCLUSION AND QUALITY OF LIFE 71
Proposed approaches. Hayward and Bright (1997) outline cognitive behavioral
strategies which can be utilized to contend with the effects of stigma. Maladaptive
cognitions of an individual with mental illness may be related to the causes of his/her
illness, his/her prognosis, how greatly his/her behaviors can improve symptoms, and
efficacy of treatment. Along with skill development, they recommend hierarchical
exposures to social interactions.
Because increasing social interaction is likely to expose individuals with mental
illnesses to rejection, Perlick et al. (2001) recommend “buffered exposures” to “inoculate
them against the adverse effects of future experiences of discrimination or rejection”
(p.1631). They use the idea of supported employment as an example of the beginning of
social engagement within an accommodating atmosphere where the individuals can learn
to recognize and respond to stigma with the aid of their peers and encouraging
instructors.
The peer support model has also been beneficial in reducing self-stigma of
individuals with mental illnesses. For example, Corrigan (2004) noted that the ability of
consumers to provide psychoeducation about symptoms, skills, and resources illustrates
to others, including other consumers, that individuals with mental illness are capable and
knowledgeable. Empowerment has been discussed as being a way to counteract the
effects of stigma. In a study of 1,824 individuals with psychiatric disabilities, those who
had participated in peer support services during the previous four months reported greater
scores across nine of ten empowerment factors than those who had not participated in
such services (Corrigan, 2006). Another study also found that peer support services

SOCIAL INCLUSION AND QUALITY OF LIFE 72
enhanced the self-evaluations of individuals with mental health illnesses (Verhaeghe,
Bracke, & Bruynooghe, 2005).
Public education. Many researchers have discussed the need for appropriate
public education in order to decrease stigma and increase opportunities for social
inclusion (e.g., Hayward & Bright, 1997; Link et al., 1999). Pescosolido and colleagues
further discuss the idea that public education, based on the etiology of mental illnesses,
has increased understanding of the diseases but has not changed discrimination against
the individuals with the illnesses (2013). Link et al. indicate that public education should
be aimed at the perception that individuals with mental illness are dangerous and work to
change that perception so it is more closely related to actual risk. Hayward and Bright
detail the need for media portrayals of individuals with mental illnesses as whole
individuals who have the ability to be treated effectively. Despite these needs, Wahl
(2004) has written extensively about the media depictions of mental illnesses, which
often involve stereotyped characterizations, leading to continued stigmatization of this
population.
Several studies have found that different types of anti-stigma campaigns increase
the understanding of SMI etiology, but discrimination towards the individuals with the
illnesses continues to exist. The Time to Change Campaign in England has found that
tolerance of individuals with mental illnesses has improved over time, indicating a dose-
effect relationship between the campaign and community awareness; however, intended
behavior, or social distance, has not changed (Evans et al, 2014). Evans and colleagues
assert that this is due to the campaign discouraging prejudice but not enhancing support

SOCIAL INCLUSION AND QUALITY OF LIFE 73
of individuals with SMIs. A study on the impact of a theatrical production for schools,
Walk in Our Shoes, found that high school students expressed statistically greater
willingness to interact with students with mental health illnesses following the
performance than before it (Wong, Cerully, Collins, & Roth, 2014). However, the sizes
of the social distance changes were minimal. Also, possibly due to the emphasis in the
play, on the ability to recover, students were more likely, following the performance, to
endorse the idea that an individual with a mental health problem was to blame for the
illness (Wong et al.).
Corrigan commented that multiple, not singular, contacts with someone with
mental illness is important for creating lasting changes in negative perceptions which lead
to stigma (SAMHSA, 2008). In order for people to realize that they are in regular contact
with someone with a mental illness, Corrigan reported that in order to change stigma,
people with mental illnesses need to ‘come out of the closet.’ He stated further, that
according to research, seeing people in one’s own community “coming out” has a much
larger impact on stigma than seeing famous people “come out”.
Others have argued that SAMHSA needs to develop guidelines regarding self-
disclosure (Hyman, 2008). These guidelines would work to make the process of self-
disclosure smoother for the individuals disclosing. Hyman also recommended that
following the development of these guidelines, consumer driven educational programs
should be launched to encourage individuals to share their stories with the community. In
fact, a consumer-driven and facilitated public education program, did positively impact

SOCIAL INCLUSION AND QUALITY OF LIFE 74
the attitudes of high school students towards individuals with SMIs (Spagnolo, Murphy,
& Librera, 2008).
Advocacy. It has been argued that clinical psychology has not been significantly
involved in the fight against stigma; specifically, clinical psychology has historically not
been greatly involved in the research on the stigma of mental illnesses (Corrigan &
Shapiro, 2010). Because clinical psychologists are specifically trained in the symptoms of
mental illnesses, the lack of involvement in anti-stigma efforts is problematic. Clinical
psychologists have a significantly greater understanding of the etiology, presentation and
treatment of mental illnesses, compared with the general public; therefore, the field has
an obligation to address the existing stigma about these illnesses.
Three types of advocacy are recommended by Corrigan and Shapiro: education,
contact, and protest (2010). Protest efforts involve bringing attention to and rebuking
stigma and discrimination resulting from stigma when it occurs. Education involves
countering erroneous information about individuals with mental illnesses with accurate
facts. Finally, clinical psychologists, who are also consumers, can join other mental
health professionals in ‘coming out’ in order to increase the public’s awareness of regular
contacts that they have with people who have mental illnesses (Corrigan & Shapiro;
Salzer, 2001).
Summary
The present study examined the differences in reported SubSI and ObjSI between
individuals diagnosed with SSDs and those diagnosed with MDD. Furthermore, the
SOCIAL INCLUSION AND QUALITY OF LIFE 75
amount of variance in QOL which can be predicted by type of diagnosis, SSDs or MDD,
symptom severity, and SubSI and ObjSi was determined.
There was an effect of diagnosis on social inclusion showing a statistically
significant effect of diagnosis on SubSI; however, there was not a significant effect of
diagnosis on ObjSI. Overall, participants diagnosed with an SSD were found to report
less social inclusion than participants diagnosed with MDD; specifically, participants
diagnosed with an SSD reported significantly lower SubSI than participants diagnosed
with MDD. Despite the statistical significance of the finding, it needs to be pointed out
that this difference might not be as clinically significant as it appears statistically.
ObjSI, SubSI, HSC, and diagnosis were found to predict QOL significantly and
accounted for 31.3% of the variance in QOL. Gender and CSI did not significantly
predict QOL. Higher scores on the ObjSI and SubSI measures predicted higher QOL
scores. Fewer symptoms indicated on the HSC predicted higher QOL scores. Finally, a
diagnosis of SSD was also predictive of higher QOL scores than a diagnosis of MDD.
Utilizing the knowledge gained through this study, clinicians can work to tailor
treatment goals, treatment planning, and therapeutic milieu more appropriately for their
clients. Cognitive behavioral strategies including hierarchical, in vivo exposures can aid
individuals with SMIs in their ability to cope with the negative effects of stigma and
discrimination on QOL (Hayward and Bright, 1997; Perlick et al., 2001). Also, clinical
researchers can utilize QOL as an outcome variable for determining treatment effects in a
more robust manner. This study furthers the mental health delivery system’s ability to
create, as Swarbick (2009) wrote, “…a culture that is based on self-determination,

SOCIAL INCLUSION AND QUALITY OF LIFE 76
empowering relationships, and opportunities for persons in recovery to fully participate in
all facets of community living” (pp. 206 – 207).
SOCIAL INCLUSION AND QUALITY OF LIFE 77
References
Angermeyer, M. C., Matschinger, H., & Corrigan, P. W. (2004). Familiarity with mental
illness and social distance from people with schizophrenia and major depression:
Testing a model using data from a representative population survey.
Schizophrenia Research, 69(2), 175-182.
Bachrach, L. L. (1976). Deinstitutionalization: An Analytical Review and Sociological
Perspective. Rockville, Md.: National Institute of Mental Health.
Bachrach, L. L. (1983). An overview of deinstitutionalization. New Directions for Mental
Health Services: Deinstitutionalization, 17, 5-14.
Bengtsson-Tops, A. & Hansson, L. (2001). Quantitative and qualitative aspects of the
social network in schizophrenic patients living in the community: Relationship to
sociodemographic characteristics and clinical factors and subjective quality of
life. International Journal of Social Psychiatry, 47(3), 67-77.
Bonner, L., Barr, W., & Hoskins, A. (2002). Using primary care-based mental health
registers to reduce social exclusion in patients with severe mental illness. Journal
of Psychiatric and Mental Health Nursing, 9, 585-593.
Boothroyd, R. A., & Chen, H. J. (2008). The psychometric properties of the Colorado
Symptom Index. Administration and Policy in Mental Health and Mental Health
Services Research, 35(5), 370-378.
Campbell, J., & Schraiber, R. (Eds.). (1989). The Well-Being Project: Mental health
clients speak for themselves. MNN Redux.
SOCIAL INCLUSION AND QUALITY OF LIFE 78
Chakravarty, S. R. & D’Ambrosio, C. D. (2006). The measurement of social exclusion.
Review of Income and Wealth, 52(3), 377-398.
Corrigan, P. W. (2004). Enhancing personal empowerment of people with psychiatric
disabilities. American Rehabilitation, 28(1), 10-21.
Corrigan, P. W. (2006). Impact of consumer-operated services on empowerment and
recovery of people with psychiatric disabilities. Psychiatric Services, 57(10),
1493-1496.
Corrigan, P.W. (2008, October 21). Moderated by Holly Reynolds Lee. Evaluating
programs to improve social acceptance of people with mental health issues.
SAMHSA’s Resource Center to Promote Acceptance, Dignity, and Social
Inclusion Associated with Mental Health. Retrieved from
http://www.promoteacceptance.samhsa.gov/teleconferences/archive/training/telec
onference10212008_TRANSCRIPT.aspx
Corrigan, P. W., Larson, J. E., & Rüsch, N. (2009). Self-stigma and the “why try” effect:
Impact on life goals and evidence-based practices. World Psychiatry, 8(2), 75-81.
Corrigan, P. W., & Shapiro, J. R. (2010). Measuring the impact of programs that
challenge the public stigma of mental illness. Clinical Psychology Review, 30(8),
907-922.
Crocker, J. & Major, B. (1989). Social stigma and self-esteem: The self-protective
properties of stigma. Psychological Review, 96(4), 608-630.

SOCIAL INCLUSION AND QUALITY OF LIFE 79
Derogatis, L. R., Lipman, R. S., Rickels, K., Uhlenhuth, E. H., & Covi, L. (1974). The
Hopkins Symptom Checklist (HSCL): A self‐report symptom inventory.
Behavioral science, 19(1), 1-15.
Ertugrul, A. & Uluğ, B. (2004). Perception of stigma among patients with schizophrenia.
Social Psychiatry and Psychiatric Epidemiology, 39, 73-77.
Evans, S., Banerjee, S., Leese, M., & Huxley, P. (2007). The impact of mental illness on
quality of life: A comparison of severe mental illness, common mental disorder
and health population samples. Quality of Life Research, 16, 17-29.
Evans-Lacko, S., Corker, E., Williams, P., Henderson, C., Thornicroft, G. (2014). Effect
of the Time to Change anti-stigma campaign on trends in mental-illness-related
public stigma among the English population in 2003–13: An analysis of survey
data. Lancet Psychiatry, 1(2), 121-128
Feightner, J. W., & Worrall, G. (1990). Early detection of depression by primary care
physicians. CMAJ: Canadian Medical Association Journal, 142(11), 1215.
Gladis, M. M., Gosch, E. A., Dishuk, N. M., Crits-Christoph, P. (1999). Quality of life:
Expanding the scope of clinical significance. Journal of Consulting and Clinical
Psychology, 67(3), 320-331.
Hansson, L. (2006). Determinants of quality of life in people with severe mental illness.
Acta Psychiatrica Scandinavica, 113, 46-50.

SOCIAL INCLUSION AND QUALITY OF LIFE 80
Hansson, L., Middelboe, T., Merinder, L., Bjarnason, O., Bengtsson-Tops, A., Nilsson,
L.,…Vinding, H. (1999). Predictors of subjective quality of life in schizophrenic
patients living in the community: A Nordic multicentre study. International
Journal of Social Psychiatry, 45(4), 247-258.
Hayward, P. & Bright, J. A. (1997). Stigma and mental illness: A review and critique.
Journal of Mental Health, 6(4), 345-354.
Hyman, I. (2008). Self-Disclosure and Its Impact on Individuals Who Receive Mental
Health Services. HHS Pub. No. (SMA)-08-4337 Rockville, MD. Center for
Mental Health Services, Substance Abuse and Mental Health Services
Administration.
Latalova, K., Kamaradova, D., & Prasko, J. (2014). Perspectives on perceived stigma and
self-stigma in adult male patients with depression. Neuropsychiatric Disease and
Treatment, 10, 1399 – 1405.
Leff, J. P. & Warner, R. (2006). Social inclusion of people with mental illness.
Cambridge: Cambridge University Press.
Lehman, A. F. (1983). The well-being of chronic mental patients: Assessing their quality
of life. Archives of General Psychiatry, 40(4), 369-373.
Lehman, A. F. (1988). A quality of life interview for the chronically mentally ill.
Evaluation and Program Planning, 11, 51-62.
Lehman, A. F. (1996). Measures of quality of life among persons with severe and
persistent mental disorders. Social Psychiatry and Psychiatric Epidemiology, 31,
(78-88).

SOCIAL INCLUSION AND QUALITY OF LIFE 81
Levitt, A. J., Mueser, K. T., DeGehova, J., Lorenzo, J., Bradford-Watt, D., Barbosa, A.,
…Chernick, M. (2009) Randomized controlled trial of illness management and
recovery in multiple-unit supportive housing. Psychiatric Services, 60(12), 1629-
1636.
Link, B. (1982). Mental patient status, work, and income: An examination of the effects
of a psychiatric label. American Sociological Review, 47, 202-215.
Link, B. G., Cullen, F. T., Frank, J., & Wozniak, J. F. (1987). The social rejection of
former mental patients: Understanding why labels matter. The American Journal
of Sociology, 92(6), 1461-1500.
Link, B. G. & Phelan, J. C. (2001). Conceptualizing stigma. Annual Review of Sociology,
27, 363-385.
Link, B. G., Phelan, J. C., Bresnahan, M., Stueve, A., & Pescosolido, B. A. (1999).
Public conceptions of mental illness: Labels, causes, dangerousness, and social
distance. American Journal of Public Health, 89(9), 1328-1333.
Link, B. G., Struening, E., Dohrenwend, B. P., Cullen, F. T., & Shrout, P. E. (1989). A
modified labeling theory approach to mental disorders: An empirical assessment.
American Sociological Review, 54(3), 400-423.
Link, B. G., Struening, E. L., Neese-Todd, S., Asmussen, S. & Phelan, J. C. (2001).
Stigma as a barrier to recovery: The consequences of stigma for the self-esteem of
people with mental illnesses. Psychiatric Services, 52(12), 1621-1626.

SOCIAL INCLUSION AND QUALITY OF LIFE 82
Lloyd, C., Tse, S., & Deane, F. P. (2006). Community participation and social inclusion:
How practitioners can make a difference. Australian e-Journal for the
Advancement of Mental Health, 5(3), 1-10.
Mittal, D., Corrigan, P., Sherman, M. D., Chekuri, L., Han, X., Reaves, C., … Sullivan,
G. (2014, October 13). Healthcare providers’ attitudes toward persons with
schizophrenia. Psychiatric Rehabilitation Journal. Advance online publication.
http://dx.doi.org/10.1037/prj0000095
Morgan, C., Burns, T., Fitzpatrick, R., Pinfold, V., & Priebe, S. (2007). Social exclusion
and mental health: Conceptual and methodological review. British Journal of
Psychiatry, 191, 477-483.
Perlick, D. A. (2001). Stigma as a barrier to recovery: Special section on stigma as a
barrier to recovery: Introduction. Psychiatric Services, 52(12), 1613-1614.
Perlick, D. A., Rosenheck, R. A., Clarkin, J. F., Sirey, J. A., Salahi, J., Struening, E. L., &
Link, B. G. (2001). Stigma as a barrier to recovery: Adverse effects of perceived
stigma on social adaptation of persons diagnosed with bipolar affective disorder.
Psychiatric Services, 52(12), 1627-1632.
Pescosolido, B. A., Medina, T. R., Martin, J. K., & Long, J. S. (2013). The “backbone” of
stigma: Identifying the global core of public prejudice associated with mental
illness. American Journal of Public Health, 103(5), 853-860.
Phelan, J. C., Link, B. G., Stueve, A., & Pescosolido, B. A. (2000). Public conceptions of
mental illness in 1950 and 1996: What is mental illness and is it to be feared?
Journal of Health and Social Behavior, 41(2), 188-207.

SOCIAL INCLUSION AND QUALITY OF LIFE 83
Phillips, D. (1963). Rejection: A possible consequence of seeking help for mental
disorders. American Sociological Review, 28, 963-972.
Rapaport, M. H., Clary, C., Fayyad, R., & Endicott, J. (2005). Quality-of-life impairment
in depressive and anxiety disorders. American Journal of Psychiatry, 162, 1171-
1178.
Rüsch, N., Angermeyer, M. C., & Corrigan, P. W. (2005). Mental illness stigma:
Concepts, consequences, and initiatives to reduce stigma. European Psychiatry,
20, 529-539.
Salzer, M. S. (2001). Best practice guidelines for consumer-delivered services.
Developed for Behavioral Health Recovery Management Project. Retrieved from
http://www.bhrm.org/guidelines/Salzer.pdf
Salzer, M. S., Brusilovskiy, E., Rothbard, A., Hadley, T. (2007). A randomized,
controlled study of a telephone-based intervention to reduce disparities through
enhanced self-care, patient-physician communication, and motivation to
participate in treatment.
Scheff, T. J. (1966). Being mentally ill: A sociological theory. Chicago: Aldine.
Scheff, T. J. (1974). The labeling theory of mental illness. American Sociological Review,
39, 444-452.
Schlomer, G. L., Bauman, S., & Card, N. A. (2010). Best practices for missing data
management in counseling psychology. Journal of Counseling psychology, 57(1),
1-10.
SOCIAL INCLUSION AND QUALITY OF LIFE 84
Shern, D. L., Wilson, N. Z., Coen, A. S., Patrick, D. C., Foster, M., Bartsch, D. A., &
Demmler, J. (1994). Client outcomes II: Longitudinal client data from the
Colorado treatment outcome study. The Milbank Quarterly, 123-148.
Sheskin, D. J. (2007). Handbook of parametric and nonparametric statistical procedures
(4th ed.). New York: Chapman & Hall/CRC: Taylor & Francis Group.
Spagnolo, A. B., Murphy, A. A., & Librera, L. A. (2008). Reducing stigma by meeting
and learning from people with mental illness. Psychiatric rehabilitation journal,
31(3), 186.
State of California, California Department of Mental Health, Mental Health Services
Oversight and Accountability Commission. (2007). Eliminating stigma and
discrimination against persons with mental health disabilities: A project of the
California Mental Health Services Act. Retrieved from State of California
website:
http://www.mhsoac.ca.gov/docs/Stigma_and_Discrimination/StigmaAndDiscrimi
nationReport07Jun12.pdf
Stuart, H. (2006). Mental illness and employment discrimination. Current Opinion in
Psychiatry, 19(5), 522-526.
Swarbick, M. (2009). Historical perspective—From institution to community.
Occupational Therapy in Mental Health, 25(3-4), 201-223.

SOCIAL INCLUSION AND QUALITY OF LIFE 85
Temple University Collaborative on Community Inclusion of Individuals with
Psychiatric Disabilities. (n.d.). The Temple University Collaborative on
Community Inclusion of Individuals with Psychiatric Disabilities. Retrieved from
http://tucollaborative.org/
Towler, A. J. & Schneider, D. J. (2005). Distinctions among stigmatized groups. Journal
of Applied Social Psychology, 35(1), 1-14.
United States Department of Health and Human Services, Substance Abuse and Mental
Health Services Administration. (2006). National consensus statement on mental
health recovery. Retrieved from Substance Abuse and Mental Health Services
Administration website: http://store.samhsa.gov/product/National-Consensus-
Statement-on-Mental-Health-Recovery/SMA05-4129
Verhaeghe, M., Bracke, P., & Bruynooghe, K. (2008). Stigmatization and self-esteem of
persons in recovery from mental illness: The role of peer support. International
Journal of Social Psychiatry, 54(3), 206-218.
Wahl, O. F. (1999). Mental health consumers’ experience of stigma. Schizophrenia
Bulletin, 25(3), 467-478.
Wahl, O.F., (2004). Stop the presses. Journalistic treatment of mental illness. In L.D.
Friedman (Ed.) Cultural Sutures: Medicine and Media (pp. 55-69). Durkheim,
NC: Duke University Press.
Ware, N. C., Hopper, K., Tugenberg, T., Dickey, B., & Fisher, D. (2007). Connectedness
and citizenship: Redefining social integration. Psychiatric Services, 58(4), 469-
474.

SOCIAL INCLUSION AND QUALITY OF LIFE 86
Weinfurt, K. P. (1998). Multivariate analysis of variance. In L. G. Grimm & P. R.
Yarnold (Eds.), Reading and understanding multivariate statistics (pp. 245–
276).Washington, DC: American Psychological Association.
Weinstein, R. (1983). Labeling theory and the attitudes of mental patients: A review.
Journal of Health and Social Behavior, 24, 70-84.
Williams, M. N., Grajales, C. A. G., & Kurkiewicz, D. (2013). Assumptions of multiple
regression: Correcting two misconceptions. Practical Assessment Research &
Evaluation, 18 (11), 1-14.
Wong, E. C., Cerully, J. L., Collins, R. L., & Roth, E. (2014). Findings from the School-
Based Theatrical Performance Walk In Our Shoes. Retrieved from
http://calmhsa.org/wp-content/uploads/2014/06/Findings-from-Walk-In-Our-
Shoes.pdf