Impacts of Model Spatial Resolution on the Simulation of ...
14
789 1. Introduction Convective spectrum is a continuous sequence of vertical motions from shallower to deeper convection that is seen in the vertical profile of vertical motions and does not cleanly separate in time and space (Boccippio et al. 2005). Over the tropical region, differences in convective spectrum are measured by convective intensity, convective depth, area of cloud coverage, and atmospheric instability (e.g., Boccippio et al. 2005; Liu and Zipser 2005; Petersen et al. 2003). These different measures of convective spectrum can be linked to the impacts of convection on large-scale circulation, which can be further enhanced or reduced because of their interactions with radiation, namely, the cloud-radiative effect (CRE) (e.g., Crueger and Stevens 2015; Labbouz et al. 2018). Specifically, con- vection redistributes energy, water vapor, and tracer both vertically and horizontally, playing a significant role in the climate system. Studies have shown that different convective spectra have different impacts on atmospheric stability (Bui et al 2016; Chen et al. 2016). Hence, a detailed examination of the resolution dependence of convective spectrum in the tropics and its association with CRE change in state-of-the- ©The Author(s) 2021. This is an open access article published by the Meteorological Society of Japan under a Creative Commons Attribution 4.0 International (CC BY 4.0) license (https://creativecommons.org/licenses/by/4.0). Journal of the Meteorological Society of Japan, 99(4), 789−802, 2021. doi:10.2151/jmsj.2021-039 Impacts of Model Spatial Resolution on the Simulation of Convective Spectrum and the Associated Cloud Radiative Effect in the Tropics Hien X. BUI 1 and Jia-Yuh YU Department of Atmospheric Sciences, National Central University, Taiwan (Manuscript received 24 June 2020, in final form 3 March 2021) Abstract In this study, we examine the resolution dependence of the convective spectrum in Community Atmospheric Model version 5 (CAM5) simulations, focusing on the transition from shallow to deep convection and the asso- ciated cloud-radiative effect (CRE) change. We first apply the bin method (percentile binning) on precipitation intensity to obtain the convective spectrum in the tropics. The same approach is also used in the column-integrated moist static energy (MSE) budget analysis. The binning results show that over the light-rain regime, the convec- tive structure is dominated by shallow convection, functioning to destabilize the atmosphere by importing column- integrated MSE. The heavy-rain regime shows the coexistence of deep and shallow convection, which inclines to stabilize the atmosphere by exporting the column-integrated MSE. Moreover, we also note that the longwave (LW) component of CRE (LWCRE) is more sensitive to the change of model spatial resolution than the shortwave (SW) component of CRE (SWCRE), characterized by a stronger response in the coarser resolution run over the heavy-rain regime. The resolution dependence of convective spectrum and CRE changes presented in this study highlights the importance of scale-aware cumulus parameterization design in climate models, which is not yet implemented in CAM5. Keywords convective spectrum; moist static energy budget; cloud-radiative effect Citation Bui, H. X., and J.-Y. Yu, 2021: Impacts of model spatial resolution on the simulation of convective spectrum and the associated cloud radiative effect in the tropics. J. Meteor. Soc. Japan, 99, 789–802, doi:10.2151/ jmsj.2021-039. Corresponding author: Jia-Yuh Yu, Department of Atmo- spheric Sciences, National Central University, 300 Zhongda Road, Zhongli District, Taoyuan City 32001, Taiwan E-mail: [email protected] 1 Present affiliation: IBS Center for Climate Physics, Pusan National University, Busan, South Korea J-stage Advance Published Date: 8 April 2021
Transcript of Impacts of Model Spatial Resolution on the Simulation of ...

H. X. BUI and J.-Y. YUAugust 2021 789
1. Introduction
Convective spectrum is a continuous sequence of vertical motions from shallower to deeper convection that is seen in the vertical profile of vertical motions and does not cleanly separate in time and space (Boccippio et al. 2005). Over the tropical region, differences in convective spectrum are measured by convective intensity, convective depth, area of cloud
coverage, and atmospheric instability (e.g., Boccippio et al. 2005; Liu and Zipser 2005; Petersen et al. 2003). These different measures of convective spectrum can be linked to the impacts of convection on large-scale circulation, which can be further enhanced or reduced because of their interactions with radiation, namely, the cloud-radiative effect (CRE) (e.g., Crueger and Stevens 2015; Labbouz et al. 2018). Specifically, con-vection redistributes energy, water vapor, and tracer both vertically and horizontally, playing a significant role in the climate system. Studies have shown that different convective spectra have different impacts on atmospheric stability (Bui et al 2016; Chen et al. 2016). Hence, a detailed examination of the resolution dependence of convective spectrum in the tropics and its association with CRE change in state-of-the-
©The Author(s) 2021. This is an open access article published by the Meteorological Society of Japan under a Creative Commons Attribution 4.0 International (CC BY 4.0) license (https://creativecommons.org/licenses/by/4.0).
Journal of the Meteorological Society of Japan, 99(4), 789−802, 2021. doi:10.2151/jmsj.2021-039
Impacts of Model Spatial Resolution on the Simulation of Convective Spectrum and the Associated Cloud Radiative Effect in the Tropics
Hien X. BUI1 and Jia-Yuh YU
Department of Atmospheric Sciences, National Central University, Taiwan
(Manuscript received 24 June 2020, in final form 3 March 2021)
Abstract
In this study, we examine the resolution dependence of the convective spectrum in Community Atmospheric Model version 5 (CAM5) simulations, focusing on the transition from shallow to deep convection and the asso-ciated cloud-radiative effect (CRE) change. We first apply the bin method (percentile binning) on precipitation intensity to obtain the convective spectrum in the tropics. The same approach is also used in the column-integrated moist static energy (MSE) budget analysis. The binning results show that over the light-rain regime, the convec-tive structure is dominated by shallow convection, functioning to destabilize the atmosphere by importing column- integrated MSE. The heavy-rain regime shows the coexistence of deep and shallow convection, which inclines to stabilize the atmosphere by exporting the column-integrated MSE. Moreover, we also note that the longwave (LW) component of CRE (LWCRE) is more sensitive to the change of model spatial resolution than the shortwave (SW) component of CRE (SWCRE), characterized by a stronger response in the coarser resolution run over the heavy-rain regime. The resolution dependence of convective spectrum and CRE changes presented in this study highlights the importance of scale-aware cumulus parameterization design in climate models, which is not yet implemented in CAM5.
Keywords convective spectrum; moist static energy budget; cloud-radiative effect
Citation Bui, H. X., and J.-Y. Yu, 2021: Impacts of model spatial resolution on the simulation of convective spectrum and the associated cloud radiative effect in the tropics. J. Meteor. Soc. Japan, 99, 789–802, doi:10.2151/jmsj.2021-039.
Corresponding author: Jia-Yuh Yu, Department of Atmo-spheric Sciences, National Central University, 300 Zhongda Road, Zhongli District, Taoyuan City 32001, TaiwanE-mail: [email protected] Present affiliation: IBS Center for Climate Physics, Pusan
National University, Busan, South KoreaJ-stage Advance Published Date: 8 April 2021
Journal of the Meteorological Society of Japan Vol. 99, No. 4790
art climate model simulations is necessary, especially as the resolution becomes finer in the Coupled Model Intercomparison Project, phase 6 (CMIP6) models (Eyring et al. 2016).
Convective spectrum has been extensively studied with observational data from instruments, such as pre-cipitation radar (e.g., Houze 1997; Johnson et al. 1999; Boccippio et al. 2005) and climate models, although the findings from comparisons of observations with climate models are diverse. For example, a few sensi-tivity tests were conducted by Labbouz et al. (2018) to evaluate the effect of different physical processes that might be crucial in simulating the convection struc-ture. By running the National Center for Atmospheric Research (NCAR) Community Atmospheric Model version 5 (CAM5) using different spatial resolutions, Bui et al. (2019a) recently showed that a higher spatial resolution tends to produce more shallow convection, whereas a coarser one tends to generate less shallow convection. These results have critical implications for explaining different precipitation distributions in the tropics and understanding how the precipitation pattern might change in the future under a warmer climate (Bui et al. 2019b; Chen et al. 2016). However, how the statistical behavior of convective spectrum changes with various model spatial resolutions re-mains poorly understood, particularly, the resolution dependence of transitioning from shallow to deep convection and associated CRE change. This question motivates this study.
We also note that various factors can influence the transition from shallow to deep convection. For ex-ample, the inhomogeneity of the boundary layer over land and the moist lower free troposphere can favor the shallow to deep transition on a diurnal time scale (Zhang and Klein 2010). Some studies emphasize the processes below the cloud base and associated cold pools critical for convective aggregation (e.g., Khai-routdinov and Randall 2006; Kurowski et al. 2018). Wu et al. (2009) highlighted the importance of atmo-spheric instability in the lower layers for aggregating cumulus convection while suggesting the existence of a critical lapse rate of temperature for deep convection initiation. Recently, Schiro and Neelin (2019) also reported the importance of lower-free-tropospheric moisture in initiating deep convective clouds. In this study, we provide another datapoint to analyze the processes affecting the transition from shallow to deep convection in the tropics by running a state-of-the-art climate model with different spatial resolutions.
In this study, we use the column-integrated moist static energy (MSE) budget to examine the shallow to
deep convection transition and associated CRE change among various model spatial resolutions. In the MSE budget, vertical and horizontal advection are strongly related to the convective adjustment of atmospheric stability. For instance, Bui et al. (2016) found that a top-heavy structure of vertical motion produces a positive value of MSE transport that tends to stabilize the atmosphere. In contrast, a bottom-heavy structure of vertical motion generates a negative value of MSE transport, functioning to destabilize the atmosphere. Chen et al. (2016) further associated the change of tropical convection to the change in atmospheric gross moist stability (e.g., Neelin and Held 1987; Yu and Neelin 1997; Yu et al. 1998) under a similar MSE budget framework.
The interaction of convective clouds with radiation is also critical in modifying the amount of radiation energy reflected, emitted, and absorbed by the atmo-sphere and the underlying earth’s surface, including ocean and land. Thus, changes in clouds have pro-found impacts on atmospheric circulation and hydro-logical cycles (Stephens et al. 2012; Li et al. 2015, 2016; Chen et al. 2018; Liu et al. 2018). However, the net CRE significantly differs, depending on the cloud types. For example, the warming generated by cirrus clouds is strong enough to cancel the ascending cool-ing of air motion (Mather et al. 2007). The shallower precipitating clouds have a small radiative effect be-cause of their small optical depths and area fractions. The stratocumulus clouds, nonetheless, tend to reflect most of the incoming shortwave (SW) radiation, cool-ing the atmosphere. Ying and Huang (2016) recently noted that the intermodel spread of cloud-radiation feedback is a leading source for the uncertainty in the tropical Pacific sea surface temperature-warming pat-tern under the influence of global warming in CMIP5 models. All studies highlight the importance of parameterizing cloud-radiation interaction in climate models.
This study extends the model sensitivity experi-ments of Bui et al. (2019a) to answer the following questions: (1) How does model spatial resolution impact the statistical behavior of convective spectrum across the tropics? (2) How does the associated CRE change with convective spectrum in both SW and longwave (LW)? We address these questions by run-ning a series of coupled (a slab ocean) climate model experiments using various spatial resolutions to exam-ine the resolution dependence of convective spectrum across the tropics. The model and experimental design are described in Section 2. Descriptions of the bin method, MSE budget analysis, and calculating

H. X. BUI and J.-Y. YUAugust 2021 791
CRE are presented in Section 3. Section 4 compares changes in convective spectrum among various spatial resolution runs and associated CRE changes and im-plications. The conclusion and further discussion are provided in Section 5.
2. Model and experiment
The model setup used in this study is the same as in Bui et al. (2019a), and we only provide a synopsis here. The NCAR CAM5 (Neale et al. 2012) is used to examine the spectrum of convection and associated cloud-radiative effect. The CAM5 version used here has 30 vertical layers, using the deep convection scheme from Zhang and McFarlane (1995) and shallow convection scheme from Park and Bretherton (2009). We run a series of 50-m mixed layer depth slab ocean simulations (Danabasoglu and Gent 2009; Kiehl et al. 2006), where the horizontal resolutions are varied from 4, 2, 1, to 0.5° (corresponding to a grid space of approximately 400, 200, 100, and 50 km, respectively). Depending on the spatial resolutions, slight differences in some parameters are needed to ensure energy balance at the top of the atmosphere. For more details, please refer to Section 2.2 of Bui et al. (2019a). The simulations are run with a time step of 1800 seconds. Twelve-year simulations are conduct-ed, but only the last decade of model outputs is used for analysis. Several observational field campaign datasets are also used to compare to the model simula-tions. Table 1 summarizes the periods, locations, and references for the field campaigns.
We also analyze the daily data from the fifth global reanalysis produced by the European Center for Medium-Range Weather Forecasts (ERA5; Hersbach et al. 2020) with a grid size of 0.5° × 0.5° and 37 pressure levels from 2010 to 2019 to compare with the model results. Further interpolation of the ERA5 to different grid-sizes of the CAM5 is also performed to examine the scale-awareness issue in convective
parameterization (see the Supplementary Materials). We only focus on the oceanic regions in this study to avoid complications of interpretation caused by topography.
3. Methods
3.1 Bin methodTo examine the convective spectrum, we use the bin
method, as in Bui et al. (2019a). We identify different convection structures based on regime sorting of large-scale conditions and convection properties (Bui et al. 2019a; Takayabu et al. 2010). The precipitation events are sorted and binned according to the precipitation intensity with 100 bins (each bin contains 1 % of the total sampled precipitation events), similar to the percentile ranks (Hagos et al. 2010). Since one goal of this study is to compare the convection spectrum in model simulations with the observed precipitation consisting of various types of precipitating rainfall, using the total precipitation from CAM5 should be more appropriate than using only convective precipi-tation. A sensitivity test was performed to compare the binning spectrum among different types of convective rainfall using two model spatial resolutions (figure not shown). The results show that convective rainfall dominates the total precipitation and the contribution from shallow convective or large-scale precipitation is relatively small. In this study, a precipitation event is counted when the precipitation rate is greater than 0.1 mm day−1, as in previous studies (Chou et al. 2012; Sun et al. 2007). The first few tenths of percentile bins represent light precipitation events that are typically dominated by shallow convection, whereas the last few tenths of percentile bins denote heavy precipitation events in which both deep and shallow convection often coexist. Since the magnitudes change significantly across a broad range of the entire percen-tile bins, for comparison, each after-binning vertical profile is normalized by its maximum, allowing us to
Table 1. List of field campaign datasets used in this study. These include the Tropical Ocean Global Atmosphere Coupled Ocean–Atmosphere Response Experiment (TOGA COARE), the South China Sea Monsoon Experiment (SCSMEX), the Kwajelin Experiment (KWAJEX), the Tropical Warm Pool International Cloud Experiment (TWP ICE), and the ARM MJO Investigation Experiment (AMIE). All the 6-hourly data with a vertical grid at 25 hPa intervals from 1000 hPa to 100 hPa are analyzed.
Field campaign Location Period References TOGA COARESCSMEXKWAJEXTWP ICEAMIE (TRMM)
10°S – 10°N, 140°E – 180°Southern China Sea7 – 10°N, 166 – 169°EDarwin Island Gan Island, Indian Ocean
1 November 1992 – 28 February 19935 May – 20 June 199824 July – 14 September 199917 January – 12 February 200613 November – 13 December 2011
Webster and Lukas (1992) Lau et al. (2000) Sobel et al. (2004) Xie et al. (2010) Stokes and Schwartz (1994)
Journal of the Meteorological Society of Japan Vol. 99, No. 4792
focus on a direct comparison of the vertical structure changes across various percentile bins. Our analyses focus on the region within the climatological inter-tropical convergence zone (ITCZ), defined as the area with negative values of the mean vertical velocity at 500 hPa (ω—500 < 0), similar to Chen et al. (2016) and Bui et al. (2016). The results from a region outside the ITCZ are also presented in the Supplementary Materi-als for reference.
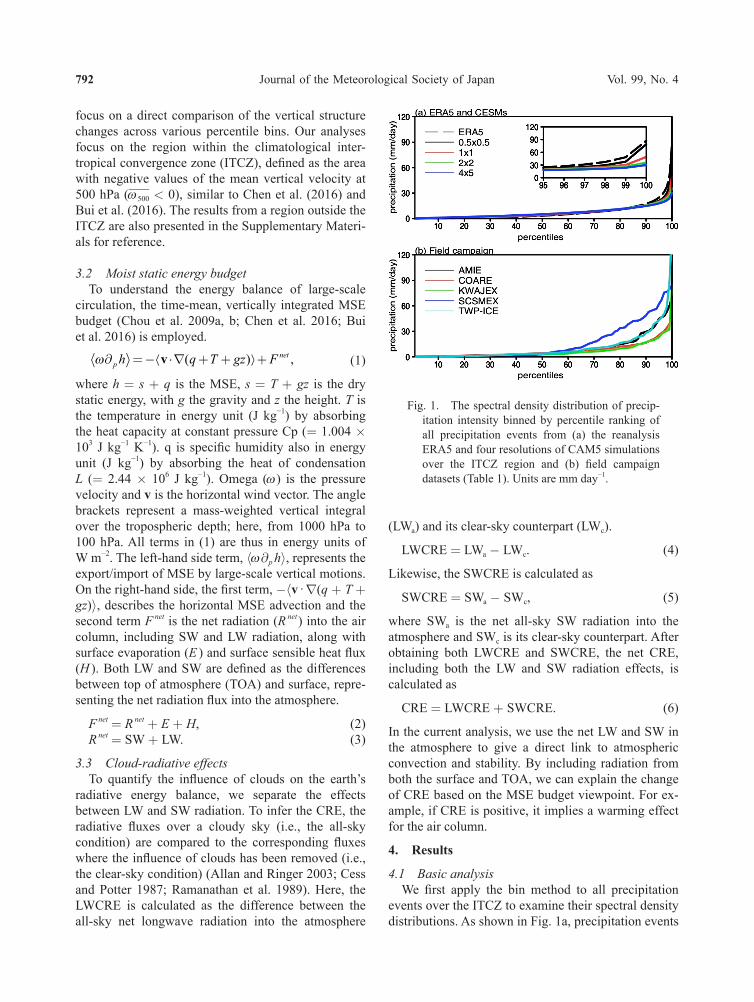
3.2 Moist static energy budgetTo understand the energy balance of large-scale
circulation, the time-mean, vertically integrated MSE budget (Chou et al. 2009a, b; Chen et al. 2016; Bui et al. 2016) is employed.
ω∂ =− ⋅∇ + + +pneth q T gz Fv ( ) , (1)
where h = s + q is the MSE, s = T + gz is the dry static energy, with g the gravity and z the height. T is the temperature in energy unit (J kg−1) by absorbing the heat capacity at constant pressure Cp (= 1.004 ´ 103 J kg−1 K−1). q is specific humidity also in energy unit (J kg−1) by absorbing the heat of condensation L (= 2.44 ´ 106 J kg−1). Omega (ω) is the pressure velocity and v is the horizontal wind vector. The angle brackets represent a mass-weighted vertical integral over the tropospheric depth; here, from 1000 hPa to 100 hPa. All terms in (1) are thus in energy units of W m−2. The left-hand side term, áω¶p hñ, represents the export/import of MSE by large-scale vertical motions. On the right-hand side, the first term, -áv · Ñ(q + T + gz)ñ, describes the horizontal MSE advection and the second term F net is the net radiation (R net ) into the air column, including SW and LW radiation, along with surface evaporation (E ) and surface sensible heat flux (H ). Both LW and SW are defined as the differences between top of atmosphere (TOA) and surface, repre-senting the net radiation flux into the atmosphere.
F net = R net + E + H, (2)R net = SW + LW. (3)
3.3 Cloud-radiative effectsTo quantify the influence of clouds on the earth’s
radiative energy balance, we separate the effects between LW and SW radiation. To infer the CRE, the radiative fluxes over a cloudy sky (i.e., the all-sky condition) are compared to the corresponding fluxes where the influence of clouds has been removed (i.e., the clear-sky condition) (Allan and Ringer 2003; Cess and Potter 1987; Ramanathan et al. 1989). Here, the LWCRE is calculated as the difference between the all-sky net longwave radiation into the atmosphere
(LWa) and its clear-sky counterpart (LWc).
LWCRE = LWa - LWc. (4)
Likewise, the SWCRE is calculated as
SWCRE = SWa - SWc, (5)
where SWa is the net all-sky SW radiation into the atmosphere and SWc is its clear-sky counterpart. After obtaining both LWCRE and SWCRE, the net CRE, including both the LW and SW radiation effects, is calculated as
CRE = LWCRE + SWCRE. (6)
In the current analysis, we use the net LW and SW in the atmosphere to give a direct link to atmospheric convection and stability. By including radiation from both the surface and TOA, we can explain the change of CRE based on the MSE budget viewpoint. For ex-ample, if CRE is positive, it implies a warming effect for the air column.
4. Results
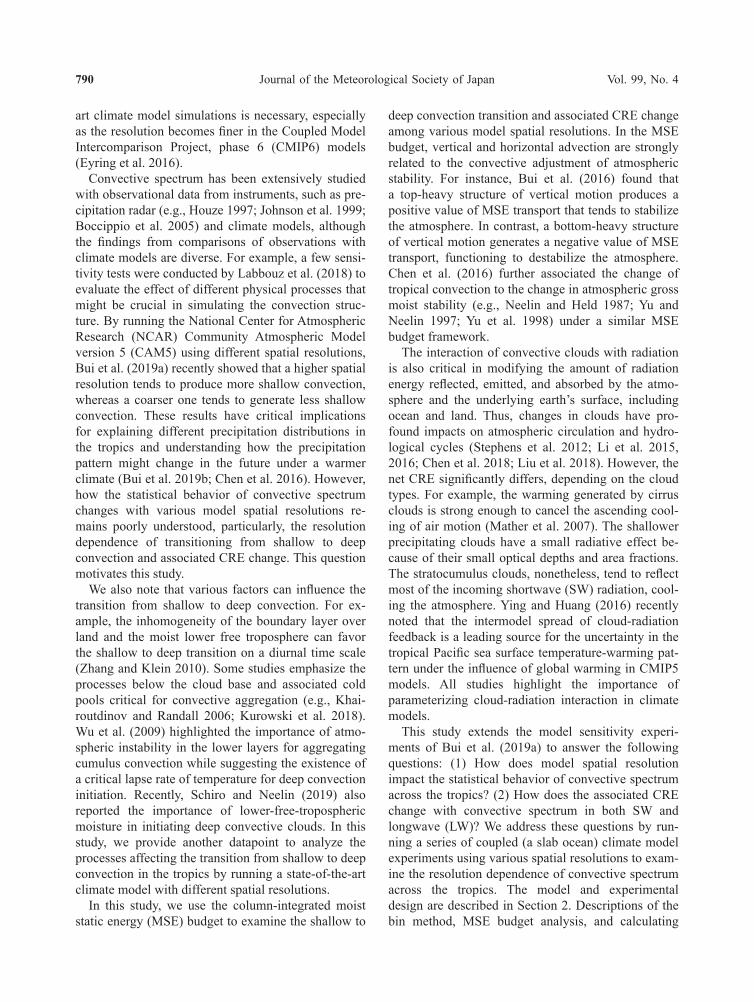
4.1 Basic analysisWe first apply the bin method to all precipitation
events over the ITCZ to examine their spectral density distributions. As shown in Fig. 1a, precipitation events
Fig. 1. The spectral density distribution of precip-itation intensity binned by percentile ranking of all precipitation events from (a) the reanalysis ERA5 and four resolutions of CAM5 simulations over the ITCZ region and (b) field campaign datasets (Table 1). Units are mm day−1.

H. X. BUI and J.-Y. YUAugust 2021 793
are classified from the lightest (bin 1) to the heaviest percentile (bin 100) where all the data show a similar sharp increase in precipitation intensity in the last few bins. Among various CAM5 simulations, coarser reso-lution runs tend to produce more light-rain events than finer resolution runs (not shown). In contrast, finer resolution simulations incline to produce more heavy-rain events than the coarser resolution, especially for the last 10 percentiles of rainfall events. This result shows that a smaller grid spacing will produce a larger magnitude of vertical lifting. A similar analysis is also conducted for field campaign datasets (Fig. 1b). In general, they show a consistent trend as the CAM5 simulations, except for much weaker magnitudes because these field campaign data were gathered in a limited area and period in the tropics.
We then examine how the large-scale vertical motion might change with precipitation intensity (Fig. 2). The vertical velocity at each bin is normalized by its absolute maxima to focus only on the structure changes. At first glance, changes in the vertical veloci-ty structure with precipitation intensity bins seem to be similar among the four CAM5 simulations and ERA5
data, characterized by the dominance of descending motions over the light-rain regime and ascending motions over the heavy-rain regime. However, when we take a closer look at the regime changes from light to heavy rain, some obvious differences appear. In the ERA5, shallow ascending motion appears at around the 20 – 30th bin and gradually increases its height as the precipitation intensity becomes stronger. A sudden jump in a vertical motion from shallow to deep con-vection occurs around the 50th percentile bin and deep convection prevails hereafter. In the four CAM5 simu-lations, the transition from shallow to deep convection evolves more gradually, with a smoother transition from shallow to deep convection between the 30 – 55th percentile bins. Moreover, the depth of convection becomes deeper earlier in the coarser resolution runs than in the finer resolution runs. For instance, the deep convection profile starts to exist around the 70th percentile bin in the 4° × 5° resolution run, but the same deep convection profile occurs until around the 85th percentile bin in the 1° × 1° and 0.5° × 0.5° resolution simulations. The gradual transition from the bottom-heavy (shallow convection) to top-heavy (deep
Fig. 2. Binned and normalized omega by precipitation intensity from 1 to 100 percentiles bins over the ITCZ region for ERA5 and CESM simulations.

Journal of the Meteorological Society of Japan Vol. 99, No. 4794
convection) structure is generally consistent with the observations of latent heating profile in Hagos et al. (2010), who showed that the heating peaks become elevated as the precipitation rate increases. We note that sub-grid scale convective moisture transport and mass flux tend to decrease as the model horizontal resolution increases, which was recently implemented into scale-adaptive or scale-aware cumulus parameter-ization by controlling the ratio of cumulus base mass flux relative to the total vertical transport of MSE (e.g., Arakawa and Wu 2013; Ahn and Kang 2018). As shown in Fig. 2, deep convection tends to occur at higher bins as the model resolution increases, im-plying a reduced frequency ratio of deep convection relative to the total precipitation events. The resolution dependency of the convective spectrum shown in Fig. 2 highlights the lack of scale-aware cumulus parame-terization design in CAM5.
To further understand the dynamic and thermo-dynamic response over the heavy-rain regime, Fig. 3 shows the vertical structures of vertical velocity, divergence, temperature, and moisture fields averaged over the last 30 percentile bins. There is a double-peak structure of vertical velocity in the ERA5 data and finer resolution runs (1° × 1° and 0.5° × 0.5°), indicat-ing the coexistence of deep and shallow convection (Fig. 3a). We note that shallow convection tends to be stronger in the ERA5 than in the CAM5 simulations. Among the four CAM5 simulations, the finer resolu-tion runs produce more (less) shallow (deep) convec-tion and the coarser resolution runs produce more (less) deep (shallow) convection, consistent with the results shown in Fig. 2 and Bui et al. (2019a).
A similar comparison is performed for the diver-gence field, showing a low-level convergence and upper-level divergence in all datasets (Fig. 3b). Com-pared to the ERA5, coarser resolution simulations generate greater divergence near the tropopause and less convergence in the atmospheric boundary layer, consistent with the stronger top-heavy structures of convection in the coarser resolution runs shown in Fig. 3a. The differences in divergence and conver-gence patterns, in turn, affect the vertical structures of temperature and moisture. In the free troposphere, temperature perturbations (Fig. 3c) approximately follow the moist-adiabatic process in the upper tropo-sphere with a clear convective cold top feature near 150 hPa (Holloway and Neelin 2007, 2009). Because of the stronger top-heavy structure (more latent heating because of more anvil clouds), the coarser res-olutions tend to produce a warmer environment in the upper troposphere. For the moisture field (Fig. 3d), the
CAM5 simulations, especially the coarser resolution, produce more (less) moisture in the upper (lower) tro-posphere, consistent with the more warming structure of temperature associated with more anvil clouds discussed above. In other words, the transition from shallow to deep convection occurs earlier at lower bins that would generate a stronger detrainment and greater upward moisture transport in the coarser res-olution runs. We will later show that these transitions from shallow to deep convection are related to the changes in atmospheric stability.
Before examining the changes in atmospheric stability among different resolution runs, we also plot the vertical structure of these dynamic and thermo-dynamic fields from the field campaign data (Fig. 4). In general, the vertical motions mostly show the top-heavy structure, peaking at ~ 400 hPa. The diver-gence, temperature, and humidity fields show profiles adjusting toward this top-heavy structure. The above features could be because these field campaign data were collected during the heavy rainfall periods.
Fig. 3. The normalized (i.e., by the absolute max-imum) vertical structures averaged over the last 30 percentile bins of (a) omega, (b) divergence, (c) temperature, and (d) specific humidity from ERA5 and CAM5 simulations. The temperature and specific humidity are their deviations (pertur-bations) from the ITCZ mean.

H. X. BUI and J.-Y. YUAugust 2021 795
4.2 Moist static energy budget analysisHere we examine the MSE budget (Eq. 1) to under-
stand how the different convection structures shown in Fig. 2 might affect the column energy balance across various rainfall intensities. We apply the bin method on each term of the MSE budget and show the chang-es in each MSE budget term with precipitation bins. Studies have shown that the sign and magnitude of the vertical MSE advection are sensitive to the vertical structure of convection. A top-heavy (deep) structure functions to stabilize the atmosphere by exporting the MSE out of the atmospheric column (áω¶p hñ > 0), whereas a bottom-heavy (shallow) structure desta-bilizes the atmosphere by importing MSE into the atmospheric column (áω¶p hñ < 0) (Back and Breth-erton 2006; Bui et al. 2016). As shown in Fig. 5a, the vertical MSE advection is negative over the light-rain bins but becomes positive over the heavy-rain bins. We also note that the vertical MSE advection becomes positive earlier in the coarser resolution runs than the finer resolution runs. In other words, in the critical percentile bins, the transition from shallow to deep convection occurs later at higher bins as the model resolution increases, consistent with the results shown in Fig. 2.
For the horizontal MSE advection (Fig. 5b), all negative values imply the intrusion of drier and colder air into the convection center and the export of high MSE air in the upper troposphere when convection occurs. Unlike the vertical MSE advection, the behav-ior of the horizontal MSE advection is different over the extreme heavy rainfall region, where the behavior of this term can be divided into two groups: one group showing greater magnitudes toward higher bins in the finer resolution runs (0.5° × 0.5° and 1° × 1°) and the other group showing smaller magnitudes toward higher bins in the coarser resolution runs (2° × 2° and 4° × 5°). This implies that the atmosphere will become more stable in the finer resolution runs compared to the coarser ones. We also note that the behavior of horizontal MSE advection in ERA5 data is similar to the group of finer resolution runs, whereas the be-havior of vertical MSE advection in the ERA5 agrees better with the coarser resolution group. Differences between CAM5 and ERA5 deserve a future analysis.
We next examine the changes of total net flux with precipitation intensity (Fig. 5c). In general, the spectral pattern of F net is similar to the vertical MSE advection, indicating the dominance of áω¶p hñ in bal-ancing F net, as implied by Eq. (1). A large positive F net
Fig. 4. The same as Fig. 3, except for the field campaign datasets (Table 1).
Fig. 5. Changes of (a) column-integrated vertical MSE advection, (b) column-integrated horizontal MSE advection, and (c) total net fluxes into the atmosphere as a function of precipitation inten-sity (in percentile bins) averaged over the ITCZ region. Units are W m−2.

Journal of the Meteorological Society of Japan Vol. 99, No. 4796
occurs over the heavy-rain region, with a significant increase in magnitude over the last 30 percentile bins. As mentioned in the introduction, the total heat flux (F net ) is critical in regulating precipitation anomalies. Therefore, we further decompose the spectral density of F net into the contribution from radiation and surface latent and sensible heat fluxes. As shown in Fig. 6a for the changes of net radiation (R net ) with precipitation intensity, large negative values of R net occur over the light-rain bins and small negative values appear over the heavy-rain bins. This implies that the deep convective clouds warm the troposphere by reducing the outgoing LW radiation (i.e., play the role of greenhouse gases). Further analysis of the CRE’s role associated with the model spatial resolution change will be discussed in the next subsection. As for the surface heat fluxes (Figs. 6b, c), surface evaporation (E ) is approximately an order of magnitude greater than the sensible heat flux (H ), and both terms show positive values throughout the entire percentile bins, with larger values in the finer resolution runs than in the coarser ones.
4.3 Cloud-radiative effect analysisBefore examining the CRE, we first show the net
LW and SW radiation (all-sky condition) into the atmosphere as a function of precipitation intensity.
As shown in Fig. 7, the net SW radiation is relatively homogeneous across all precipitation intensity bins and its spectrum is insensitive to the model spatial resolution. In contrast, the spectrum of LW radiation demonstrates a clear bin-dependence pattern, with smaller negative values over the higher percentile bins. Besides, the spectrum of LW radiation is sensi-tive to the model spatial resolution, particularly over the higher percentile bins of precipitation. We note that cloudiness could reduce LW radiation emission to outer space, resulting in a smaller negative LW value and effectively producing anomalous warming in the troposphere. This anomalous warming (or less cooling) is greater in the coarser resolution runs (Fig. 7a) associated with a top-heavier convection structure (Fig. 3a) because of stronger anvil clouds produced in the coarser CAM5 simulation. The net LW radiation exhibits a spectral pattern similar to the net total radi-ation (R net in Fig. 6a), vertical MSE advection (áω¶p hñ in Fig. 5a), and to some extent, the precipitation inten-sity (Fig. 1), implying a strong coupling between the convection and LW radiation within the atmosphere. We also note that the clear-sky LW and SW fluxes show little dependence on precipitation bin (Fig. S5 in the supplementary), indicating the importance of cloud-radiation forcing.
To give a clear picture of the association between precipitation intensity and CRE across the tropics, we show the spatial distribution patterns of CRE for both LW and SW components from light (< 5 mm day−1), heavy (> 10 mm day−1), and total (including light, heavy, and intermediate) precipitation events (Figs. 8 – 10). Here, we focus on the 1° × 1° and 2° × 2° simulations, as they are typical resolutions used in
Fig. 6. The same as Fig. 5, except for the (a) net radiation (R net ), (b) evaporation, and (c) sensible heat fluxes. Units are W m−2.
Fig. 7. The same as Fig. 5, except for the all-sky (a) longwave and (b) shortwave radiation. Units are W m−2.

H. X. BUI and J.-Y. YUAugust 2021 797
most state-of-the-art modern climate models (e.g., the CMIP3 and CMIP5 models). The LWCRE is signifi-cantly positive (> 5 W m−2) over the climatological ITCZ and negative (< -2 W m−2) over the south-eastern Pacific cold tongue (Fig. 8). Surprisingly, the SWCRE is positive across the entire tropical Pacific (Fig. 9), but with much smaller magnitudes (< 0.5 W m−2 in most areas) than LWCRE. The local minima of SWCRE occur over the ITCZ, especially over the light-rain regime (Figs. 9c, d). The strongest CRE response over the ITCZ is linked to cloud-radiation coupling. Note that the impact of clouds on the radia-tion budget is often measured at TOA (e.g., Wall et al. 2019). For the LW component, clouds are effective in trapping heat beneath them, producing a warming (greenhouse) effect for the earth’s system (including the atmosphere and earth’s surface). For the SW component, clouds increase the reflection of solar ra-diation, generating a cooling (the cloud-albedo effect) for the earth’s system. As a reminder, the LWCRE and SWCRE spatial distribution patterns shown in Figs. 8 and 9 are calculated as the differences between all-sky and clear-sky conditions of the net LW and SW radiation heating or cooling into the atmosphere (Eqs. 4 – 6). The small positive SWCRE shown in Fig. 9 implies that the cloud-albedo cooling at the earth’s
surface is slightly greater than at the TOA, which is consistent with satellite observation (see Fig. 4 of Allan 2011).
Comparing the two spatial resolution runs show a larger (smaller) LWCRE (SWCRE) in the coarser one relative to the finer one (Figs. 8e, f, 9e, f). Despite the substantial differences in the distribution of LWCRE and SWCRE over the tropical Pacific Ocean, their combined effect (CRE, Fig. 10), however, follows the LWCRE pattern (Fig. 8), where greater warming occurs in the coarser resolution run (Figs. 10e, f), especially over the heavy-rain regime. In summary, LWCRE (i.e., the net LW radiative heating into the atmosphere because of clouds) is critical in the cloud- radiation interaction process, and the CRE is stronger as the model spatial resolution becomes coarser.
5. Concluding remarks
By analyzing the simulation results from four spa-tial resolutions using the CAM5, we investigate the impacts of model spatial resolution on the convective spectrum across the entire tropical Pacific, focusing on the transition from shallow to deep convection and associated CRE change. The results show that as the model spatial resolution becomes coarser, the convection becomes deeper earlier. Over the light-
Fig. 8. Spatial distribution of longwave cloud-radiative effect (LWCRE, Eq. 3) within the atmosphere averaged over the (a, b) total rain events, (c, d) light-rain events (precipitation < 5 mm day−1) and (e, f) heavy-rain events (pre-cipitation > 10 mm day−1) for two spatial resolutions of (a, c, e) 1° × 1° and (b, d, f) 2° × 2°. Units are W m−2.

Journal of the Meteorological Society of Japan Vol. 99, No. 4798
rain regime, the atmosphere is more unstable because of destabilization by shallow convection (import of column MSE; áω¶p hñ < 0). As the precipitation intensity increases, convection deepens, and the atmo-
sphere becomes more stable (export of column MSE; áω¶p hñ > 0). Moreover, the critical bins marking the transition from shallow to deep convection increase as the model resolutions increase, implying the earlier
Fig. 9. The same as Fig. 8, except for the shortwave cloud-radiative effect (SWCRE) within the atmosphere (Eq. 4).
Fig. 10. The same as Fig. 8, except for the net cloud-radiative effect (CRE) within the atmosphere (Eq. 5).

H. X. BUI and J.-Y. YUAugust 2021 799
occurrence of deep convection and a more stable tro-posphere in the coarser resolution runs.
Our analysis also shows that the net LW radiation into the atmosphere demonstrates a bin-dependence spectrum, with smaller negative values over the higher percentile bins of precipitation. Besides, its spectrum is sensitive to the model spatial resolution, especially over the higher percentile bins, with a weaker cooling (or, alternatively, greater anomalous warming) in the coarser resolution runs associated with a greater por-tion of deep convection. In contrast, the spectrum of net SW radiation is relatively homogeneous and rather insensitive to the model spatial resolution across all precipitation bins. Consequently, the net LW radiation is more supportive in association with the spectrum of vertical MSE transport (áω¶p hñ) and, to some extent, the spectrum of precipitation intensity.
By taking the difference between all-sky and clear-sky conditions of the radiation budget, we further show the associated CRE change within the atmo-sphere, including LWCRE and SWCRE components. LWCRE is significantly positive (> 5 W m−2) over the ITCZ and negative (< -2 W m−2) over the eastern Pacific cold tongue. The SWCRE is positive across the tropical Pacific, but with much smaller amplitudes than LWCRE (< 0.5 W m−2). Comparing the two resolution runs (1° × 1° and 2° × 2°) also show that LWCRE is much more sensitive to model spatial res-olution than SWCRE, with a stronger response in the coarser resolution run, especially over the heavy-rain regime. Moreover, the spatial pattern of CRE is simi-lar to that of LWCRE, implying the key role played by LWCRE in the cloud-radiation interaction process.
Finally, we take the ERA5 reanalysis data as a refer-ence, and the analyzed results show that differences in convective spectrum among various model resolution runs are because of the lack of scale-aware cumulus parameterization design in the CAM5 (Arakawa and Wu 2013; Ahn and Kang 2018). As the cloud-radiation feedback was recognized as the leading source of uncertainties in projecting future climate change in modern climate models (Meehl et al. 2000; Ying and Huang 2016), further examinations using a broader set of climate system models, such as those archived in CMIP5 and CMIP6, or using variables of cloud prop-erties (e.g., cloud fraction, liquid water content and ice water content), will help understanding the sensitivity of the convective spectrum to model resolution and cumulus parameterization scheme chosen in climate system models. All these works will be conducted in our future study.
Supplements
Supplement materials show the results from regions outside the climatological ITCZ.
We briefly present the changes of shallow and deep convection with precipitation intensity for the tropical regions (20°S – 20°N) outside the climatological ITCZ. Similar to Fig. 1 in the paper, Fig. S1 shows the spectral density of precipitation intensity binned by percentile ranking of all precipitation events but outside the ITCZ. As shown, the obtained results are quite similar to the case within the ITCZ, except for much weaker precipitation intensities across all bins, due to the dominance of descending motion and/or shallow convection in these regions.
The changes of vertical velocity with precipitation intensity are displayed in Fig. S2, which shows the dominance of large-scale descending motions over the first 70 – 80th percentile bins. The ascending motions start at around the 80th percentile bins with a bottom- heavy convective structure and eventually become deeper when precipitation intensity increases. We also compare the vertical structures of omega, divergence and specific humidity over the light and heavy rain bins, similar to Fig. 3 in the paper. Unlike those within ITCZ, the results outside the ITCZ show a relatively consistent pattern among various datasets (Fig. S3). We note that there is a strong subsidence above 500 hPa and a strong divergence at around 850 hPa over the last 30 bins, implying the dominance of shallow convection in accounting for most rainfall events out-side the ITCZ.
Figure S4 shows the changes of moist static energy budget with precipitation intensity averaged over the regions outside the ITCZ. The changes of each term in the budget are quite consistent with the results within the ITCZ, although some local differences are observed. We also note that the horizontal advection term from model outputs show a similar pattern from the ERA5. In short, the transition from shallow con-vection to deep convection appears to be rather consis-tent between model simulations and ERA5 data across the entire spectrum of tropical convection, along with some visible differences between the regions within and outside the ITCZ.
Figure S6 re-grids the ERA5 data into four different grid-space sizes as those of the CAM5 simulations to see whether they can provide a verification of the CAM5 resolution-dependency results. Despite the different horizontal resolutions, they all exhibit a very similar pattern in precipitation spectrum and convec-tive structure. It appears that this approach cannot be

Journal of the Meteorological Society of Japan Vol. 99, No. 4800
used to provide a verification of the CAM5 resolution- dependency results. However, the results shown in Fig. 2 of the paper, to some extent, do show the existence of scale-awareness despite the lack of an explicit implementation of the scale-aware cumulus parameterization in CAM5.
Finally, Fig. S7 compares the bin-dependence of net cloud radiation effect (CRE), longwave cloud radia-tion effect (LWCRE) and shortwave cloud radiation effect (SWCRE) between two different resolution runs (1° × 1° and 2° × 2°). In short, the bin-dependence pattern of the net cloud radiation effect (CRE) mainly comes from the longwave component (i.e., LWCRE) rather than the shortwave component (i.e., SWCRE). Moreover, the bin-dependency becomes stronger in the coarser 2° × 2° resolution run, also consistent with the results shown in Fig. 6.
Acknowledgments
This work was sponsored by the Ministry of Science and Technology in Taiwan under Grants MOST106- 2111-M-008-002-MY2 and MOST108-2111-M-008- 038. The authors sincerely thank the two anonymous reviewers for the insightful comments that help improve the quality of this paper. We also thank the Corpernicus Climate Change Service for providing the ERA5 data which can be downloaded at https://cds.climate.copernicus.eu/cdsapp#!/home.
References
Ahn, M.-S., and I.-S. Kang, 2018: A practical approach to scale-adaptive deep convection in a GCM by con-trolling the cumulus base mass flux. npj Climate Atmos. Sci., 1, 13, doi:10.1038/s41612-018-0021-0.
Allan, R. P., 2011: Combining satellite data and models to estimate cloud radiative effect at the surface and in the atmosphere. Meteor. Appl., 18, 324–333.
Allan, R. P., and M. A. Ringer, 2003: Inconsistencies be-tween satellite estimates of longwave cloud forcing and dynamical fields from reanalyses. Geophys. Res. Lett., 30, 1491, doi:10.1029/2003GL017019.
Arakawa, A., and C.-M. Wu, 2013: A unified representation of deep moist convection in numerical modeling of the atmosphere. Part I. J. Atmos. Sci., 70, 1977–1992.
Back, L. E., and C. S. Bretherton, 2006: Geographic vari-ability in the export of moist static energy and vertical motion profiles in the tropical Pacific. Geophys. Res. Lett., 33, L17810, doi:10.1029/2006GL026672.
Boccippio, D. J., W. A. Petersen, and D. J. Cecil, 2005: The tropical convective spectrum. Part I: Archetypal verti-cal structures. J. Climate, 18, 2744–2769.
Bui, H. X., J.-Y. Yu, and C. Chou, 2016: Impacts of vertical structure of large-scale vertical motion in tropical cli-
mate: Moist static energy framework. J. Atmos. Sci., 73, 4427–4437.
Bui, H. X., J.-Y. Yu, and C. Chou, 2019a: Impacts of model spatial resolution on the vertical structure of convec-tion in the tropics. Climate Dyn., 52, 15–27.
Bui, H. X., J.-Y. Yu, H.-W. Liu, C.-Y. Tu, P.-G. Chiu, and H.-H. Hsu, 2019b: Convective structure changes over the equatorial Pacific with highly increased precipita-tion under global warming simulated in the HiRAM. SOLA, 15, 119–124.
Cess, R. D., and G. L. Potter, 1987: Exploratory studies of cloud radiative forcing with a general circulation model. Tellus A, 39, 460–473.
Chen, C.-A., J.-Y. Yu, and C. Chou, 2016: Impacts of ver-tical structure of convection in global warming: The role of shallow convection. J. Climate, 29, 4665–4684.
Chen, C.-A., J.-L. F. Li, M. Richardson, W.-L. Lee, E. Fetzer, G. Stephens, H.-H. Hsu, Y.-H. Wang, and J.-Y. Yu, 2018: Falling snow radiative effects enhance the global warming response of the tropical Pacific atmo-sphere. J. Geophys. Res.: Atmos., 123, 10109–10124.
Chou, C., L.-F. Huang, L. Tseng, J.-Y. Tu, and P.-H. Tan, 2009a: Annual cycle of rainfall in the western North Pacific and East Asian sector. J. Climate, 22, 2073–2094.
Chou, C., J. D. Neelin, C.-A. Chen, and J.-Y. Tu, 2009b: Evaluating the “rich-get-richer” mechanism in trop-ical precipitation change under global warming. J. Climate, 22, 1982–2005.
Chou, C., C.-A. Chen, P.-H. Tan, and K. T. Chen, 2012: Mechanisms for global warming impacts on precipi-tation frequency and intensity. J. Climate, 25, 3291– 3306.
Crueger, T., and B. Stevens, 2015: The effect of atmospheric radiative heating by clouds on the Madden-Julian Oscillation. J. Adv. Model. Earth Syst., 7, 854–864.
Danabasoglu, G., and P. R. Gent, 2009: Equilibrium climate sensitivity: Is it accurate to use a slab ocean model? J. Climate, 22, 2494–2499.
Eyring, V., S. Bony, G. A. Meehl, C. A. Senior, B. Stevens, R. J. Stouffer, and K. E. Taylor, 2016: Overview of the Coupled Model Intercomparison Project Phase 6 (CMIP6) experimental design and organization. Geosci. Model Dev., 9, 1937–1958.
Hagos, S., C. Zhang, W.-K. Tao, S. Lang, Y. N. Takayabu, S. Shige, M. Katsumata, B. Olson, and T. L’Ecuyer, 2010: Estimates of tropical diabatic heating profiles: Commonalities and uncertainties. J. Climate, 23, 542– 558.
Hersbach, H., B. Bell, P. Berrisford, S. Hirahara, A. Horányi, J. Muñoz-Sabater, J. Nicolas, C. Peubey, R. Radu, D. Schepers, A. Simmons, C. Soci, S. Abdalla, X. Abellan, G. Balsamo, P. Bechtold, G. Biavati, J. Bidlot, M. Bonavita, G. D. Chiara, P. Dahlgren, D. Dee, M. Diamantakis, R. Dragani, J. Flemming, R. Forbes, M. Fuentes, A. Geer, L. Haimberger, S. Healy, R.

H. X. BUI and J.-Y. YUAugust 2021 801
J. Hogan, E. Hólm, M. Janisková, S. Keeley, P. Laloyaux, P. Lopez, C. Lupu, G. Radnoti, P. de Rosnay, I. Rozum, F. Vamborg, S. Villaume, and J.-N. Thépaut, 2020: The ERA5 global reanalysis. Quart. J. Roy. Meteor. Soc., 146, 1999–2049.
Holloway, C. E., and J. D. Neelin, 2007: The convective cold top and quasi-equilibrium. J. Atmos. Sci., 64, 1467–1487.
Holloway, C. E., and J. D. Neelin, 2009: Moisture vertical structure, column water vapor, and tropical deep con-vection. J. Atmos. Sci., 66, 1665–1683.
Houze, R. A., Jr., 1997: Stratiform precipitation in regions of convection: A meteorological paradox? Bull. Amer. Meteor. Soc., 78, 2179–2196.
Johnson, R. H., T. M. Rickenbach, S. A. Rutledge, P. E. Ciesielski, and W. H. Schubert, 1999: Trimodal characteristics of tropical convection. J. Climate, 12, 2397–2418.
Khairoutdinov, M., and D. Randall, 2006: High-resolution simulation of shallow-to-deep convection transition over land. J. Atmos. Sci., 63, 3421–3436.
Kiehl, J. T., C. A. Shields, J. J. Hack, and W. D. Collins, 2006: The climate sensitivity of the Community Cli-mate System Model version 3 (CCSM3). J. Climate, 19, 2584–2596.
Kurowski, M. J., K. Suselj, W. W. Grabowski, and J. Teix-eira, 2018: Shallow-to-deep transition of continental moist convection: Cold pools, surface fluxes, and meso-scale organization. J. Atmos. Sci., 75, 4071–4090.
Labbouz, L., Z. Kipling, P. Stier, and A. Protat, 2018: How well can we represent the spectrum of convective clouds in a climate model? Comparisons between internal parameterization variables and radar observa-tions. J. Atmos. Sci., 75, 1509–1524.
Lau, K. M., Y. Ding, J.-T. Wang, R. Johnson, T. Keenan, R. Cifelli, J. Gerlach, O. Thiele, T. Rickenbach, S.-C. Tsay, and P.-H. Lin, 2000: A report of the field operations and early results of the South China Sea Monsoon Experiment (SCSMEX). Bull. Amer. Meteor. Soc., 81, 1261–1270.
Li, J.-L. F., W.-L. Lee, T. Lee, E. Fetzer, J.-Y. Yu, T. L. Kubar, and C. Boening, 2015: The impacts of cloud snow radiative effects on Pacific Ocean surface heat fluxes, surface wind stress, and ocean temperatures in coupled GCM simulations. J. Geophys. Res.: Atmos., 120, 2242–2260.
Li, J.-L. F., W.-L. Lee, D. Waliser, Y.-H. Wang, J.-Y. Yu, X. Jiang, T. L’Ecuyer, Y.-C. Chen, T. Kubar, E. Fetzer, and M. Mahakur, 2016: Considering the radiative effects of snow on tropical Pacific Ocean radiative heating profiles in contemporary GCMs using A-Train observations. J. Geophys. Res.: Atmos., 121, 1621– 1636.
Liu, C., and E. J. Zipser, 2005: Global distribution of con-vection penetrating the tropical tropopause. J. Geo-phys. Res., 110, D23104, doi:10.1029/2005JD006063.
Liu, H.-W., J.-Y. Yu, and C.-A. Chen, 2018: Changes of tropical precipitation and convective structure under global warming projected by CMIP5 model simula-tions. Terr. Atmos. Oceanic Sci., 29, 429–440.
Mather, J. H., S. A. McFarlane, M. A. Miller, and K. L. Johnson, 2007: Cloud properties and associated radiative heating rates in the tropical western Pacific. J. Geophys. Res., 112, D05201, doi:10.1029/2006JD 007555.
Meehl, G. A., W. D. Collins, B. A. Boville, J. T. Kiehl, T. M. L. Wigley, and J. M. Arblaster, 2000: Response of the NCAR Climate System Model to increased CO2 and the role of physical processes. J. Climate, 13, 1879– 1898.
Neale, R. B., C. C. Chen, A. Gettelman, P. H. Lauritzen, S. Park, D. L. Williamson, A. J. Conley, R. Garcia, D. Kinnison, J.-F. Lamarque, D. Marsh, M. Mills, A. K. Smith, S. Tilmes, F. Vitt, H. Morrison, P. Cameron- Smith, W. D. Collins, M. J. Iacono, R. C. Easter, S. J. Ghan, X. Liu, P. J. Rasch, and M. A. Taylor, 2012: Description of the NCAR community atmosphere model (CAM 5.0). NCAR Tech. Note NCAR/TN-486+ STR, 289 pp. [Available at https://www.cesm.ucar.edu/models/cesm1.0/cam/docs/description/cam5_desc.pdf.]
Neelin, J. D., and I. M. Held, 1987: Modeling tropical convergence based on the moist static energy budget. Mon. Wea. Rev., 115, 3–12.
Park, S., and C. S. Bretherton, 2009: The University of Washington shallow convection and moist turbulence schemes and their impact on climate simulations with the Community Atmosphere Model. J. Climate, 22, 3449–3469.
Petersen, W. A., R. Cifelli, D. J. Boccippio, S. A. Rutledge, and C. Fairall, 2003: Convection and easterly wave structures observed in the eastern Pacific warm pool during EPIC-2001. J. Atmos. Sci., 60, 1754–1773.
Ramanathan, V., R. D. Cess, E. F. Harrison, P. Minnis, B. R. Barkstrom, E. Ahmad, and D. Hartmann, 1989: Cloud- radiative forcing and climate: Results from the Earth Radiation Budget Experiment. Science, 243, 57–63.
Schiro, K. A., and J. D. Neelin, 2019: Deep convective or-ganization, moisture vertical structure, and convective transition using deep-inflow mixing. J. Atmos. Sci., 76, 965–987.
Sobel, A. H., S. E. Yuter, C. S. Bretherton, and G. N. Kiladis, 2004: Large-scale meteorology and deep convection during TRMM KWAJEX. Mon. Wea. Rev., 132, 422– 444.
Stephens, G. L., J. Li, M. Wild, C. A. Clayson, N. Loeb, S. Kato, T. L’Ecuyer, P. W. Stackhouse, M. Lebsock, and T. Andrews, 2012: An update on Earth’s energy balance in light of the latest global observations. Nat. Geosci., 5, 691–696.
Stokes, G. M., and S. E. Schwartz, 1994: The Atmospheric Radiation Measurement (ARM) Program: Program-

Journal of the Meteorological Society of Japan Vol. 99, No. 4802
matic background and design of the cloud and radia-tion test bed. Bull. Amer. Meteor. Soc., 75, 1201–1222.
Sun, Y., S. Solomon, A. Dai, and R. W. Portmann, 2007: How often will it rain? J. Climate, 20, 4801–4818.
Takayabu, Y. N., S. Shige, W.-K. Tao, and N. Hirota, 2010: Shallow and deep latent heating modes over tropical oceans observed with TRMM PR spectral latent heat-ing data. J. Climate, 23, 2030–2046.
Wall, C. J., D. L. Hartmann, and J. R. Norris, 2019: Is the net cloud radiative effect constrained to be uniform over the tropical warm pools? Geophys. Res. Lett., 46, 12495–12503.
Webster, P. J., and R. Lukas, 1992: TOGA COARE: The Coupled Ocean–Atmosphere Response Experiment. Bull. Amer. Meteor. Soc., 73, 1377–1416.
Wu, C.-M., B. Stevens, and A. Arakawa, 2009: What con-trols the transition from shallow to deep convection? J. Atmos. Sci., 66, 1793–1806.
Xie, S., T. Hume, C. Jakob, S. A. Klein, R. B. McCoy, and M. Zhang, 2010: Observed large-scale structures and diabatic heating and drying pro les during TWP-ICE.
J. Climate, 23, 57–79.Ying, J., and P. Huang, 2016: Could-radiation feedbacks as
a leading source of uncertainty in the tropical Pacific SST warming pattern in CMIP5 models. J. Climate, 29, 3867–3881.
Yu, J.-Y., and J. D. Neelin, 1997: Analytic approximations for moist convectively adjusted regions. J. Atmos. Sci., 54, 1054–1063.
Yu, J.-Y., C. Chou, and J. D. Neelin, 1998: Estimating the gross moist stability of the tropical atmosphere. J. Atmos. Sci., 55, 1354–1372.
Zhang, G. J., and N. A. McFarlane, 1995: Sensitivity of cli-mate simulations to the parameterization of cumulus convection in the Canadian climate centre general circulation model. Atmos.-Ocean, 33, 407–446.
Zhang, Y., and S. A. Klein, 2010: Mechanisms affecting the transition from shallow to deep convection over land: Inferences from observations of the diurnal cycle collected at the ARM Southern Great Plains site. J. Atmos. Sci., 67, 2943–2959.