Impacts of Coastal Coal Based Thermal Power Plants on ...€¦ · Impacts of Coastal Coal Based...
31
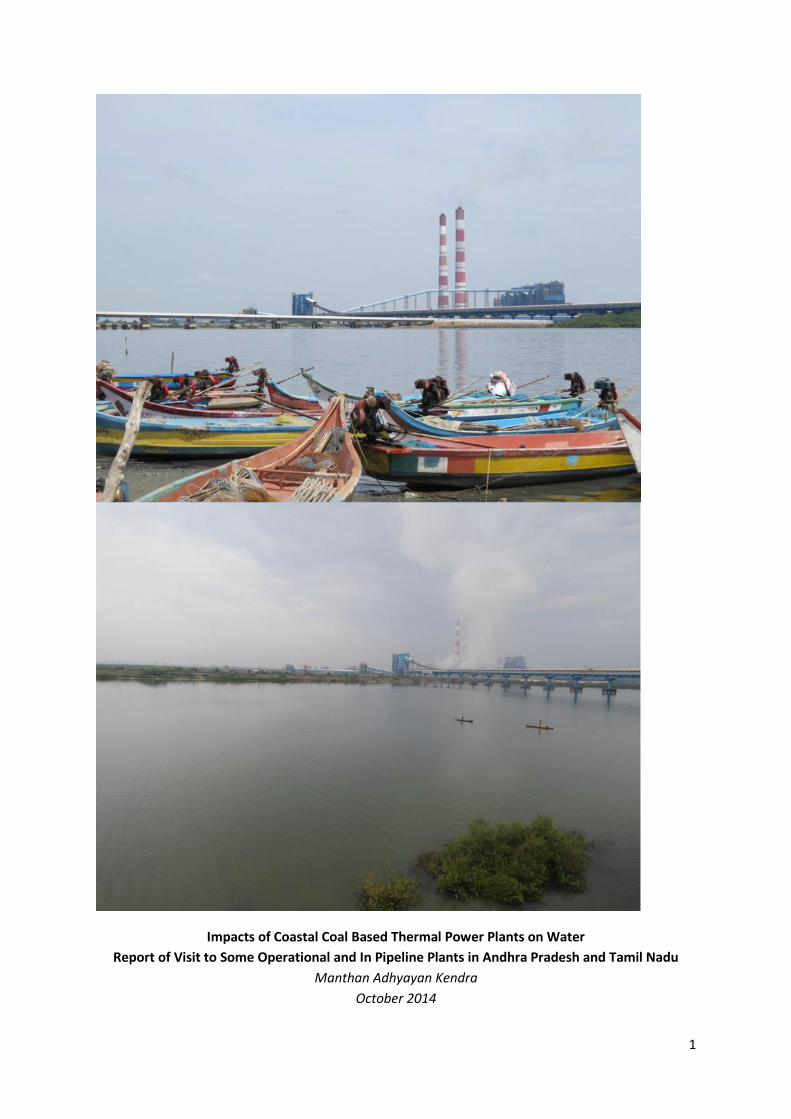
1 Impacts of Coastal Coal Based Thermal Power Plants on Water Report of Visit to Some Operational and In Pipeline Plants in Andhra Pradesh and Tamil Nadu Manthan Adhyayan Kendra October 2014
Transcript of Impacts of Coastal Coal Based Thermal Power Plants on ...€¦ · Impacts of Coastal Coal Based...
1
Impacts of Coastal Coal Based Thermal Power Plants on WaterReport of Visit to Some Operational and In Pipeline Plants in Andhra Pradesh and Tamil Nadu
Manthan Adhyayan KendraOctober 2014
2
Impacts of Coastal Coal Based Thermal Power Plants on Water
Report of Visit to Some Operational and In Pipeline Plants in Andhra Pradesh and Tamil Nadu
Manthan Adhyayan Kendra
Introduction
Coal based thermal power plants (CTPPs) need water in huge quantities, and hence have asignificant impact on water resources in the surroundings. However, it is generally assumed that fewsuch concerns exist with respect to coastal coal based power plants as they use sea water, which isavailable in virtually unlimited amounts. This is fallacious thinking, because it is based on anunderstanding that sees the use of water by CTPPs only in arithmetic or algebraic terms. In reality,the impact of CTPPs on water is multi-faceted and based on a multi-dimensional, complexrelationship.
This report presents some preliminary findings related to the impact on water of coastal CTPPsbased on a field visit to some operational and in-pipeline coastal plants in the states of AndhraPradesh and Tamil Nadu. The visit was undertaken in early July 2014.
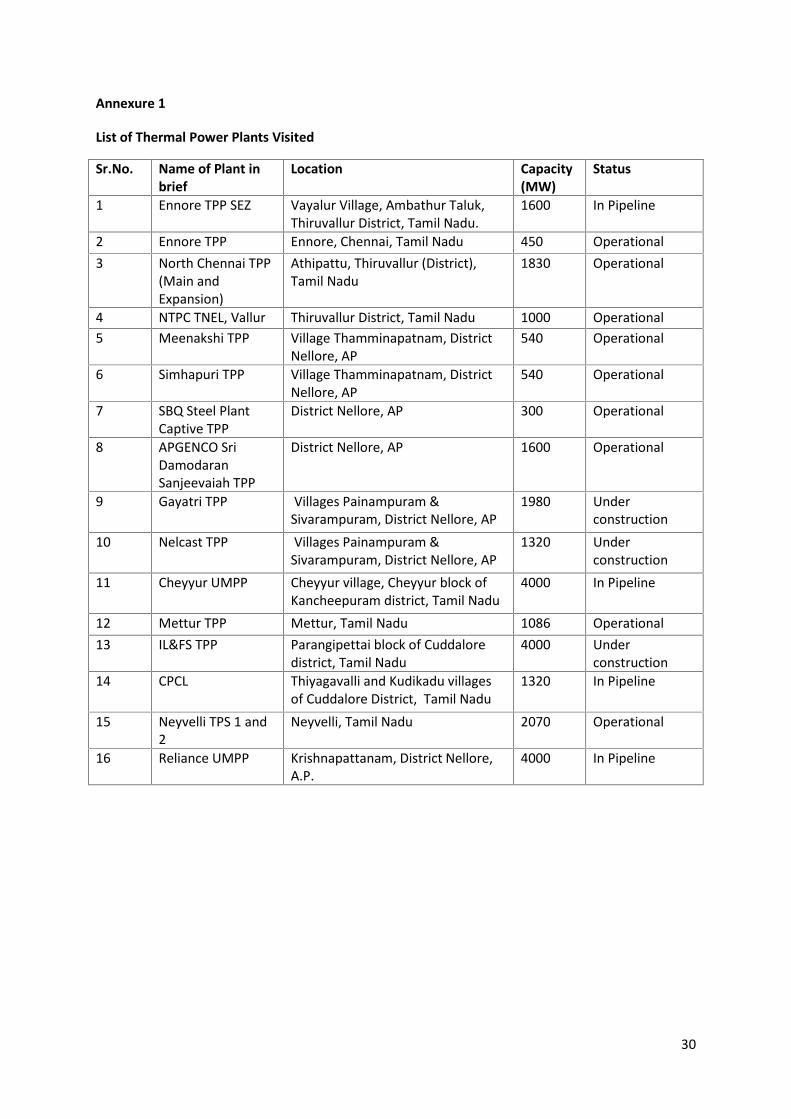
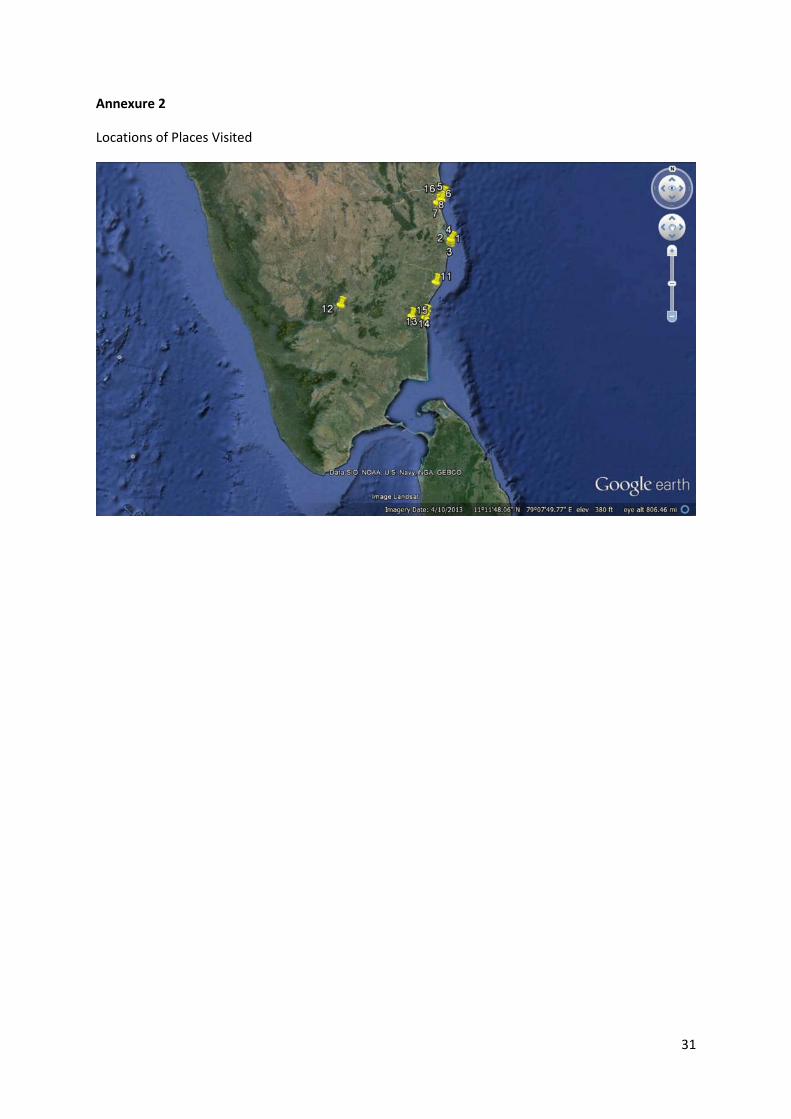
Annexure 1 presents the list of thermal power plants we visited with their locations and Annexure 2presents the same on a map.
Contaminating and Threatening Inland Water Systems
Coastal hydrology is a complex ecosystem of three kinds of waters – saline (sea water), brackish (mixof saline and fresh water) and freshwater. All three co-exist in close vicinity, and all three supportdifferent kinds of flora and fauna, and in turn, provide diversified bases for livelihoods. They exist ina delicate balance of interactions, which create vibrant ecosystems. An example is the creeks, thebackwaters, the rivers and estuaries that provide some of the richest and most productive fisheries.
Coal based power plants intrude on these ecosystems and disrupt their balance.
Coastal TPPs draw vast quantities of sea water to meet water requirement of cooling water, ashdisposal and other needs1. By bringing such vast quantities of saline waters into areas with brackishor fresh water, they create serious threats of contamination of these water systems.
One argument that is made is that while the coastal TPPs draw large quantities of sea water, greatcare is taken that its disposal does not contaminate surroundings. The saline water drawn is eitherreleased back to the sea, and/or it is released to surrounding only after full and proper treatment toacceptable levels, and with all precautions. We found that almost every plant we visited was grosslyviolating this, making it a naïve belief at the best, and a deliberate misrepresentation at the worst.Indeed, we found that the ‘rare accidental discharge’ is far more likely to be a ‘routine, deliberate’one, or a ‘routine and turning a blind eye since I can get away with it’ one, rather than accidental.
1In several cases, coastal plant are not required to have a closed loop cooling cycle, and this means that theyneed to withdraw many times more cooling water than the plants with closed loop cooling cycle.
3
We present these examples below.
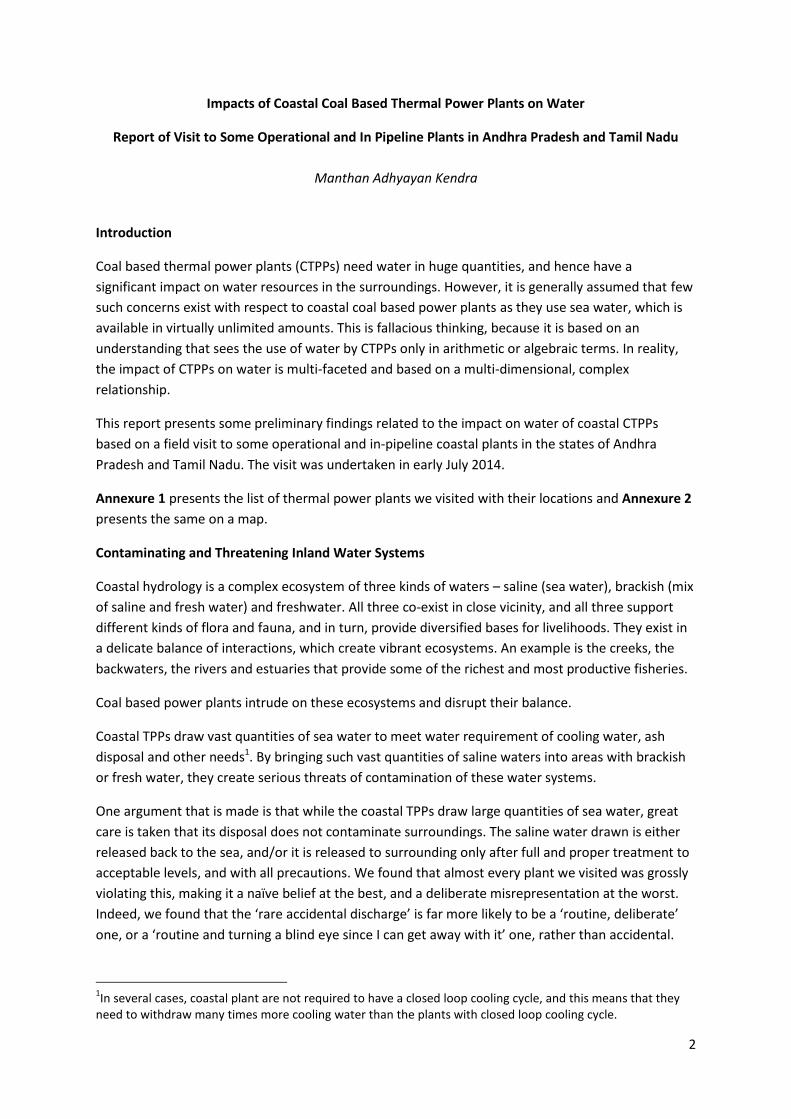
The 1600 MW APGENCO TPP (Sri Damodaran Sanjeevaiah TPP) near Nellore has started generationrecently. It draws water from the sea, and is supposed to dispose condenser blow down watereffluents also into the sea. Regarding other waste water, the Environmental Clearance (EC) Letter2
says:
“(x) Treated effluents conforming to the prescribed standards shall be re-circulated andreused with in the plant. No effluents shall be discharged outside the plant boundary exceptduring monsoon season.”
For this, it has a large waste water disposal channel. But it is clear that this channel does not alwayscarry treated water, and contaminated water is ‘escaping’ from this channel. When we visited theplant, we found large number of dead fish in the channel indicating contaminated water. What ismore problematic is that this waste water channel empties directly into a local irrigation canal. Thus,the contaminated waste water is getting into the external water and agriculture system.
Figure 1: Google Earth image showing waste water channel coming out (circled) from APGENCO plant and meeting anirrigation canal. We found dead fish in large quantities in this waste water channel.
The 1000 MW NTPC-TNEL (Vallur Thermal Power Project) is supposed to discharge, as per the EC3
“treated effluents confirming to the prescribed standards … in the lagoon along withcirculating water of existing North Chennai TPS [Theral Power station]”.
However, we found large quantities of water being discharged by the plant through a gap in its backwall, directly into the surroundings, which include CRZ areas, wetlands, mangroves and are close tothe Ennore Creek and Kortaliyar river.
2 Environmental Clearance Letter dated 17th July, 20073 Environmental Clearance Letter dated 18 Apr 2007

4
Figure 2: Photograph of water being discharged through the compound wall of NTPC-TNEL plant into surroundingmangroves and wetland.
Interestingly, the EC also required this plant to use the ash from ash pond of Ennore TPP and NorthChennai TPP for leveling of the plant area.
It may be pointed out that as per the Expert Appraisal Committee (EAC) of MoEF4, coal ash contains“about 48 elements including radioactive elements and toxic heavy metals (in mild dose)…” One ofthe serious pollutants is mercury.5 Apart from the dangers of mercury and toxic metals, ash can alsolead to respiratory diseases like asthma and TB6 and there are also increasing concerns aboutdangers of radioactivity. Both the EAC and National Green Tribunal have been asking for monitoringof radioactivity in ash as thermal power plants.
Thus, with ash from ash pond of of Ennore TPP and North Chennai TPP being used for leveling ofthe plant area of NTPC-TNEL power plant, large quantities of ash would have been used to fill and
4 Minutes of the 12th Meeting, held on 6 Dec 2010. Also noted by (IL and FS Escomart Limited Hyderabad2010, 3-26).5 (IL and FS Escomart Limited Hyderabad 2010, 3-17)6 (IL and FS Escomart Limited Hyderabad 2010, 3-18)

5
level the wetlands, creating risks of leaching of toxic pollutants from the ash into the surroundingwater system. It may be noted that the Expert Appraisal Committee of MoEF has now startedrecommending that ash should not be used for land leveling7.
In fact, since ash has these toxic elements, environmental clearances for coal power plants requireproper protection including lining the bed of ash ponds to make sure that ash doesn’t enter localwater bodies and water systems8. However, we saw copious of amounts of water pouring out of theash water recirculating system of the 630 MW North Chennai TPP. This was the ash slurry decant(the water left after ash partly settles down; the decant can also carry fair amounts of ash andpollutants).
Figure 3: Google Earth image showing ash water leakage from ash water recirculation system of North Chennai ThermalPower Station into the local water body.
This leaked water is entering the local water system through a stream and ultimately contaminatesthe Kortaliyar river.
7 In its 32nd Meeting held on 12 September 2011, the Expert Appraisal Committee of Ministry of Environmentand Forest noted that: “It was pointed out that over a period of time due to weathering action heavy metals orradioactivity content increases manifold when fly ash is left open in fields. It was, therefore, of paramountimportance that a detailed study...be carried out before advocating promotion of fly ash for utilisation inagriculture, reclamation of low lying areas [or] as mine void filling”.
8 Burning of coal in power plants leaves behind massive quantities of ash. The most common form disposingthis ash is to mix it with water to form slurry that is pumped to a nearby ‘ash pond’, which is a pond that holdsthis slurry. Sometimes, the water used for this is re-circulated. Coal plants also need huge quantities of waterfor ash disposal.

6
Apart from this, ash seems to be leaching out and contaminating the surroundings in other ways too.A new power plant, the 2x800 MW Ennore SEZ Supercritical Imported Coal based Thermal PowerPlant by M/s TANGEDCO is proposed to be built on some reclaimed area of this ash pond of NorthChennai TPS. During the public hearing of this new TPP, local people complained of how the ash isclogging up their drains stopping the free flow of water, ash is depositing in and on their fields, andlands near drainage canals of ash dyke are also being affected by salinity9.
In fact, the North Chennai TPS seems to have been most reckless in disposal of ash. It has dumpedhuge quantities of ash into the Buckingham Canal that flows right in front of its gate, has depositedvast amounts in nearby marshlands, apart from disposing ash into its large ash ponds, which too, aswe have seen above, are leaking ash to the surroundings.
9Environmental Impact Assessment Report (After Public Hearing as per MoEF Notification S.O.1533 dt. 14thSep 2006) for Proposed (2×800 MW) Thermal Power Project at Vayalur Village, Ambathur Taluk, ThiruvallurDistrict, Tamil Nadu, Page 229. ( Ramky Enviro Engineers Ltd, 2011)

7
Figure 4: Photograph showing ash from the North Chennai TPS dumped in Buckingham canal next to the gate of plant.Smaller picture shows another view of the Buckingham canal in front of the NC TPS, clogged with ash. Note thefisherman fishing for mussels.

8
Figure 5: Photograph showing ash from North Chennai thermal power station dumped in marshy lands around riverKortaliyar
The 1440 MW Mettur TPS (it is not a coastal plant, but was covered in our visit) allows the decant ofits ash pond to flow directly into the local water bodies. This decant carries lots of ash, which iscontaminating the fields, and ultimately the Cauvery river into which the local water system drains.

9
Figure 6: Photograph showing fields on the bank of river Cauvery affected due to ash settlement from ash of Metturthermal power station ash pond leaked into local water channel.
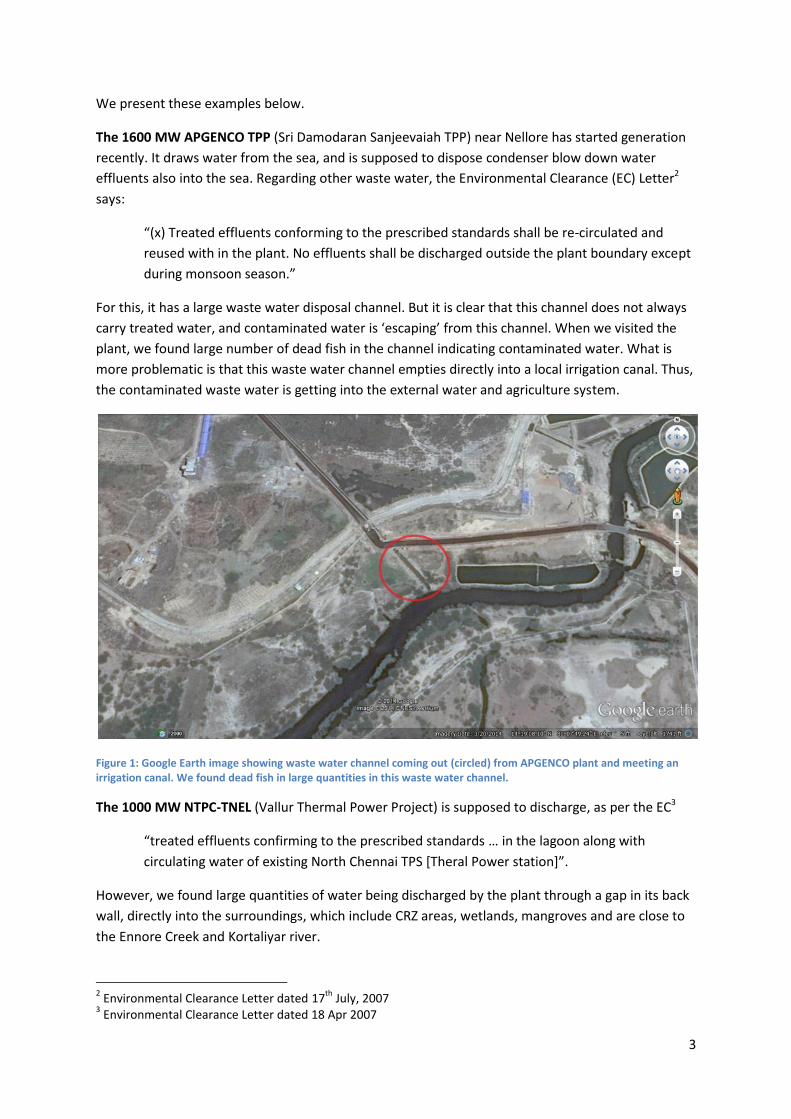
In Neyvelli, (again, not a coastal location), we saw lignite mines and thermal power station. Themine drainage is being pumped into channels and being delivered to fields for irrigation purposes.This mine drainage has left strong discolouration in the channels, indicating presence ofcontaminants. Local people also reported that when the channels supplied coloured water (yellowcoloured, or black, with coal dust), they got much lesser yields.
10
Figure 7: Photograph showing discoloration of local drain after receiving mine drain water from Neyveli Lignite mines.
Neyvelli has also been the site of that not so rare occurrence, rather, one that takes place with analarming frequency in case of Indian thermal power plants – the ash pond breach which poursthousands of tons of ash into the surroundings, damaging houses, fields and contaminating watersystems.
These examples demonstrate clearly that all thermal power plants are deliberately or ‘accidentally’discharging large amounts of waste water and effluents into the surroundings, contaminating themwith saline water and other pollutants. Note that most of the water used in coastal thermal powerplants, including for cooling, ash disposal, and dust suppression is saline water. Thus, when this‘leaks’ to the surroundings, saline water is intruding into inland freshwater or brackish watersystems, impacting them badly. Thus, it’s a myth that care is being taken that coastal TPPs will notpollute local water systems. In fact, what we saw emphasises quite the contrary – that all coastalplant are creating huge risks for the inland freshwater and brackish water systems by bringing inlarge quantities of sea water, and generating other wastes whose safe disposal is shown to be highlyunlikely.
The immediate impacts of such contamination can be felt on the ecology and environment, andparticularly on fisheries, which also in turn impacts the livelihoods of the local communities. (Seelater for some details of this). At the same time, such pollution can have serious impact on thehealth of the people, some of which are manifested in immediate term but many of which are moreinsidious and long term.

11
Disrupting Local Water Systems – Case of Cheyyur TPP
The proposed 4000 MW Cheyyur thermal power plant to the south of Chennai is a perfect exampleof this threat. The Cheyyur plant is located about 5 kms from the coast, in the middle of very goodagricultural land, grazing land and abundant freshwater sources in the form of cascade systems oftanks.
Figure 8: Photograph showing agricultural and grazing land at the site of upcoming Cheyyur UMPP project.
The plant proposes to draw in 733,800 cubic meters per day of sea water into the plant premises10.Part of this huge quantity will be send back to the sea, part evaporated, and part will go into the ashpond for disposing the ash. As we have seen, leakage of sea water and waste water is a rule ratherthan an exception.
A path-breaking study by Community Environmental Monitoring, with inputs from S. Janakarajan,Siddharth Hande & Nityanand Jayaraman, titled Hydrological Implications of the 4000 MW coal-firedUltra Mega Power Project in Cheyyur (S Janakarajan, Sidharth Hande, Nityanand Jayaraman 2014)presents the multiple ways in which the Cheyyur project will impact and disrupt the hydrology of thearea. It shows, with the use of detailed maps of the drainage and water bodies, how these watersystems are put directly to risk11.
In particular, it shows that the ash pond is at a height above the plant and surroundings, and anyoverflows, breaches and ‘accidental’ leaks threaten directly many of the freshwater tanks includingthe massive Vedal peria eri (big tank)12. Most of these tanks are not just water storage structures
10EIA Report of Cheyyur Page 2-14 (WAPCOS Limited 2012, 2-14)11 Report available at https://cheyyur.files.wordpress.com/2014/07/report-cheyyur-hydrology.pdf12Cheyyur hrdrological report page 10 (S Janakarajan, Sidharth Hande, Nityanand Jayaraman 2014, 10)

12
supporting rich agriculture and fisheries, but are of historical, social and cultural importance, withsome of them thought to be going back to the 10th Century13.
Figure 9: Photograph showing Vedal Peria Eri, just at the beginning of the monsoon. A careful look at the middle of thephoto on the right hand side will show a few bullock carts using the pre-monsoon dry eri as a path, giving an idea of thesize of the eri.
13Cheyyur Hydrological report, page 7 (S Janakarajan, Sidharth Hande, Nityanand Jayaraman 2014, 7)

13
Figure 10: Photograph showing temple dating back to 10th Century, on the bank of Vedal Eri,.
The report also highlights how the proposed storm water drain cuts through local drainagechannels, and will disrupt the freshwater flow into several water bodies, in particular the Odiyurlagoon. This decrease in freshwater flow into the lagoon will change its balance towards increasedsalinity, and have serious implications for its biological productivity that also supports a largemigratory bird population and rich local fisheries.
Impacts on Fisheries and Livelihoods
Whether the waste water and effluents are released “accidentally” or deliberately, they can have asignificant impact on the aquatic and marine ecosystems. Coastal thermal power plants will typicallydischarge several kinds of waste water.
In case the plant is using once through cooling system, then almost all the sea water that is pumpedin for cooling purposes will be released back to the sea (or to a creek), but with an elevatedtemperature. Normally, this elevation is to be restricted to between 5 to 7 degrees or a maximum of45 OC14. In case the plant uses recirculating cooling, then the blow down water – which still is asignificant proportion of the sea water taken in – will be released back to the sea (or to a creek). Thisblow down will have higher concentrations of salts than the original sea water.
14 Pages 174, 180 and 181 (pdf page numbers). (IL and FS Escomart Limited Hyderabad 2010)
14
Apart from this, there would be waste water from other facilities, much of which is expected to betreated and used in the plant for purposes like coal dust suppression etc. However, even some ofthis waste water is discharged from the plant. If the plant has a RO system, then the RO waste is alsodischarged, mostly to the sea or creek.
The water used for ash disposal is sometimes re-circulated but lot of it also remains in the ash pond.Ash slurry represents the largest quantity of waste water from the plant that remains inland, and aswe have seen, contaminates and threatens the surroundings in multiple ways like direct dischargeinto surroundings, leakage from ash ponds or recirculating systems, overflow and even ash pondbreaches.
All these discharges have significant impact on the ecology, and particularly on fish and fisheries andthe livelihoods of people.
For example, the Environmental Clearance of the 1000 MW NTPC-Tamil Nadu Energy plant at Vallur,just north of Chennai,15 and for its 500 MW expansion16, requires the plant to draw water from thesea, but allows for the discharge into the Ennore creek. In fact, currently, both, the 1000 MW NTPCTNEL plant and the 630 MW North Chennai TPP are discharging water into the Ennore creek17.
This discharge has adversely affected the lives and livelihoods of the fisherfolk dependent on thecreek. The people of village Mugadwarkuppam (literally, village at the mouth of the river), told usthat the they were finding it increasingly difficult to fish in the creek, that catch was declining, andwhatever they caught, it deteriorated and rotted far more rapidly than earlier.
15 EC letter dated 18 April 200716 EC of NTPC-TNEL dated 3 June 200917 The EC for the 1200 MW expansion of North Chennai power plant, EC letter dated 31 Aug 2009 requireseffluent discharge to the sea. But we could not verify if this was being done.

15
Figure 11: Google Earth image showing discharge of water from compound wall of North Chennai thermal power stationinto Ennore Creek.
Figure 12: Photograph of the actual site marked in Google Earth image above, showing water discharge from boundarywall of North Chennai thermal power station into Ennore creek opposite Mukhdwarkuppam village.
Similar is the case with village Gummaldibba (and others), near the Krishnapattanam port in Nelloredistrict in AP. Gummaldibba (in Chillakuru block of Nellore district in Andhra Pradesh) is a villagewhere all the families are dependent on fishing, particularly in the Kandeleru creek. Yet, their

16
livelihoods have been virtually totally destroyed due to the combined effect of two thermal powerplants and the Krishnapattanam port. The 540 MW Meenakshi TPP and 540 MW Simhapuri TPPboth draw their water and discharge their waste waters into the Kandeleru creek18. It also calls forthe cooling water blow down discharge to be at the same temperature as the ambient watertemperature.
However, villagers report that the water discharged into the creek is hot water, that they have feltthe temperature to be hot when fishing in the creek, that now when they go into the creek they getitching sensations on their body.
This discharge has impacted the fishing badly. Because of the fall in the fish catch, and because thewater gives them itching and other problems, they have cut down going into the creek.
This impact of waste water has been compounded by the dredging operations in the port, which is atthe mouth of the creek. The dredging operations create turbidity, which also affects the fish. (Seealso next section, Impacts of Associated Infrastructure, sub-section on Coastal Erosion for more onimpacts of dredging). Local people told us that the hot water kills the fry (young fish, young shrimp),and also dredging at the port creates turbidity and pollution, this kills the fish, so fish does not getstocked. There is daily tidal movement, so that effect is pushed inside and outside on all sides. Theyare not even getting enough fish for their domestic needs.
Last but not the least, their fishing operations in the sea also have been affected as the movementsof their fishing boats is restricted due to the movements of shipping vessels at the port.
The population of these affected villages (Gummaldibba 1, Gummaldibba 2 and Thaminipattnam) isaround 4000.
While they have lost their most important source of livelihood, they have not received anycompensation (except a one-time amount of Rs. 16,000per family, after several protests anddharnas) and the only jobs that they have got from the port or the TPPs are that of labour or ofcoolies.
18 We were told by local people that the TPPs discharge their waters into the creek and we also saw the wastewater pipes. However, we could not officially confirm to which TPP of the two the waste water pipe belongsand that the TPPs are actually discharging waste water into the creek. Note also that while the EC letters ofMeenkshi and Simhapuri TPPs (dated 2 July 2008 and 3 July 2008 respectively) allow them to draw water fromthe creek, they are silent about the place where the waste water and blow down are to be discharged. They dorequire that “The cooling tower blow down shall be discharged from the cold end side and it shall be ensuredthat the temperature of discharged water shall be at the ambient temperature of the receiving waters.”However, the EC Letter for expansion of Meenakshi TPP by 300 MW (dated 19th Oct 2009), allows the plant todraw water from the creek but requires it to discharge to the sea.

17
Figure 13: Photograph showing waste water pipeline of thermal power stations discharging effluents into Kandelerucreek.
The same problem was reported by people of the village Krishnapattanam, where there are 700fishing families, but their fishing has been badly affected due to their access to sea being severelyrestricted, and the dredging that has affected their catch in the Kandeleru creek. They also reported,as did people from Gummaldibba, about the number of palmolin factories and the leakage andpollution from these factories into the creek, which too was affecting the fishing as per the villagers.
In Salem, we were also told that the fishing has declined in the Cauvery river downstream of theMettur reservoir. Local people said that the ash flowing into the river was certainly one of thecauses. They said that often, there would be lot of dead fish in the river, or else, the fish would decayvery fast after it was caught.
Impacts of Associated Infrastructure
Coastal thermal power plants cannot work by themselves. They require the development of largescale supporting infrastructure. This includes the port (for getting the coal, often the very rationalefor location of the plant on the coast); the transport system for getting the coal from the port toplant – which can be truck transport needing developments of roads, or conveyor belt systems mileslong; the water intake structures including channels, pipes and pumping stations; the waste waterdischarge structures, the ash disposal areas and desalinisation facilities.

18
Together, just the construction of all these can cause serious disruptions of drainage patterns, and ofground and surface water systems. Our visit showed the serious impacts of these associatedinfrastructures.
Coastal Erosion
One of the serious impacts of construction on the coast – including port facilities, piers, jetties etc. isthe disruption of the movement of sand, leading to erosion of the coast on one side. Due this, thecoastal land erodes and the sea moves inside. This can have many serious impacts on the localpeople. They lose access to the beach – the areas where their boats are parked, where the catch islanded, sorted and dried. Sometimes, even their houses are affected and they are physicallydisplaced.
According to a recent paper “Impact of Port Development on the Coastline and the Need forProtection” (Kudale 2010)
“Commonly, construction of such structures has adverse effect on the adjacent beaches andmay even affect beaches some distance away…
“These effects include accumulation of sediments on the updrift side with progressiveadvancement of the shoreline and erosion of the coastline on the down drift region.”
The paper also notes that dredging can lead to changes in the seabed that can significantly modify“currents, waves and water quality”. In particular, it lists changes like
“Low mixing and poor water quality near the bottom of dredged basins and channels,resulting in low levels of dissolved oxygen” and “potential for increased salinity intrusion inestuaries.”
This co-relates with the effects people described to use at Krishnapattanam.
The paper also notes such impacts at the Ennore Port, which is the port from where coal is suppliedto the North Chennai TPP and the NTPC –TNEL TPP.
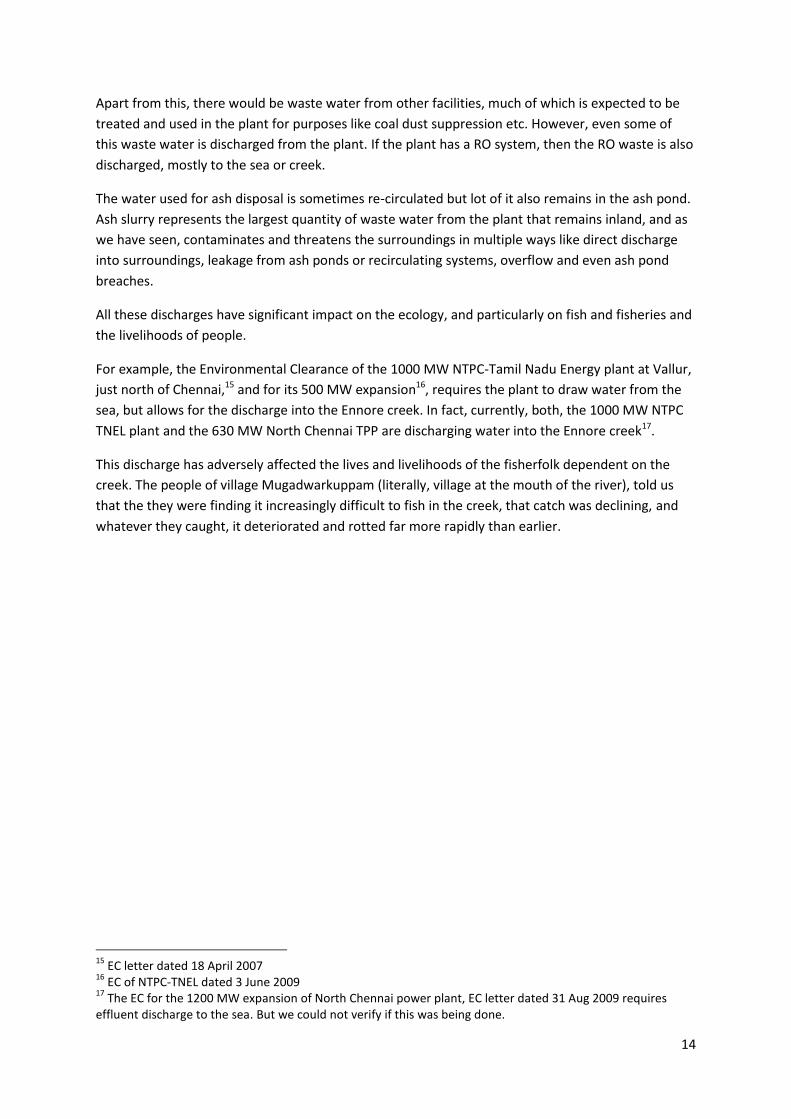
Another paper (Ministry of Earth Sciences and Indian National Center for Ocean Information Services2009, 27) notes that:
“…the shore, south of the Ennore port has accreted at a rate of 45m per annum, extendedoffshore 300m to 400m (during 2000-2006) The zone of accretion extended south upto 2.6km alongshore where 90 m wide beach has developed that eventually lead to rapid silting ofEnnore Creek used to draw cooling water by power plants mentioned earlier”.
Apart from the power plants, the silting of the Ennore creek will severely impact the fisher peopledependent on the creek. We have already detailed above how people of Mugadwar kuppam at theCreek mouth have been affected due to declining fish catch. The siltation of the creek is likely to beone of the reasons. (Diagram in Figure 14 below, from the same report shows the year wiseaccretion of the shore and into the Ennore Creek)
19
Figure 14: Source: (Ministry of Earth Sciences and Indian National Center for Ocean Information Services 2009, 26)
We also noted the coastal erosion at several villages we visited; for example in village Petode ofKoylapat Panchayat in Kurunjpadi the children’s play garden developed during Tsunamirelief works has been destroyed, and continuing erosion has led to abandonment of the PDSshop built there. To the south side of village is the under construction site of NagarjunaJetty and intake well with port of the 4000 MW IL& FS thermal power station.
Figure 15: Photograph showing damaged PDS shop due to sea Erosion at Petode village in Tamilnadu
Drains, Conveyor Belts, Pipes
20
Long pipes or channels to convey water from sea to the plant and from the plant to the sea result indisrupting the natural drainage channels. This can have serious impacts on the local water bodies.We have seen that is what is likely to happen in the case of the Cheyyur plant.
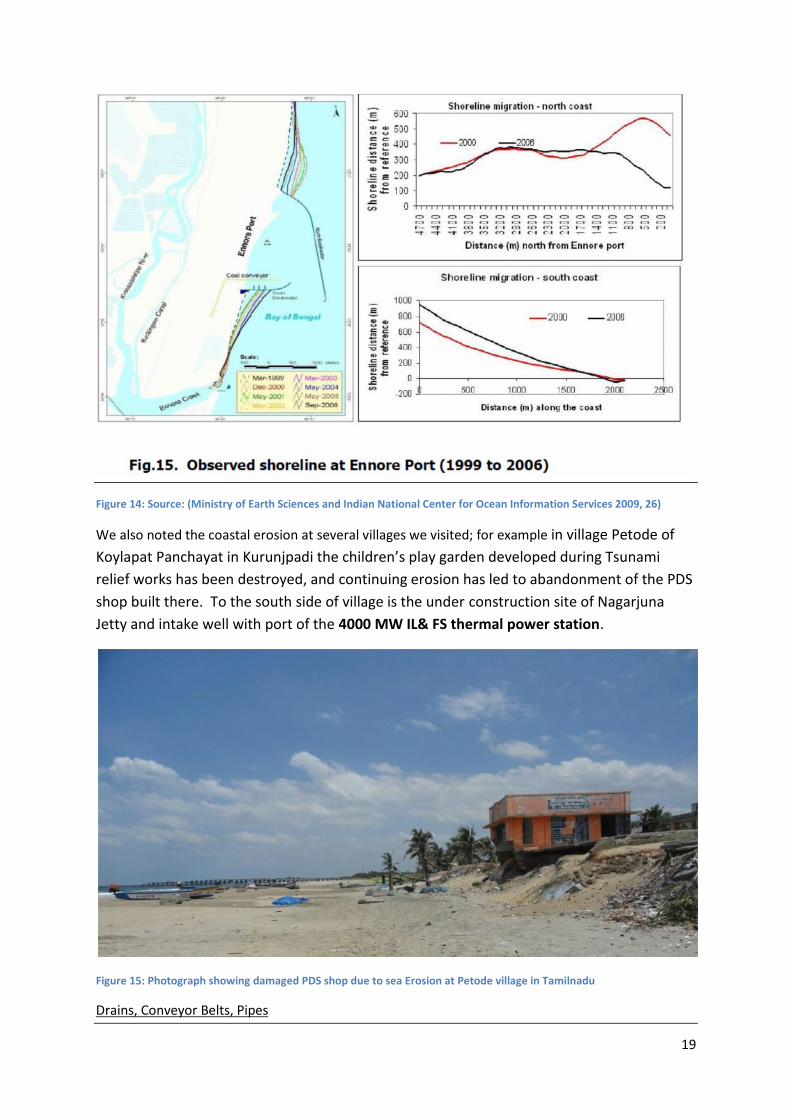
Many of the coastal plants use conveyor belts to carry the coal from the port to the plant. Theseconveyor belt systems can also disrupt local ecosystems. For e.g., in the case of the Cheyyur TPP, the5 km long conveyor belt is likely to cut through many old sand dunes. These sand dunes are averitable ecosystem by themselves. They support a rich diversity of crops including commerciallyimportant ones like cashew. The sand dunes act like sponges, storing fresh water during rain andproviding it to the different crops and trees rest of the time. In this way, apart from the trees, thesesand dunes also support rich paddy crops. They also provide these paddy fields protection in thecoastal areas. This rich dune ecosystem is found even very close to the coast.
Figure 16: Photograph showing sand dunes protecting fields near the site of upcoming Cheyyur thermal power project.

21
Figure 17: Photograph showing well forested sand dunes near the coast where the conveyer belt of upcoming 4000Cheyyur UMPP will cross through this area.
Coal Handling
One of the biggest impacts of coal handling – including loading and unloading of coal, transportthrough trucks and conveyor belts – is the release of coal dust into the atmosphere. This coal dustreleased in the atmosphere creates respiratory diseases, it settles on exposed surfaces in residentialareas creating problems of contamination and cleaning, it settles on water in various water bodiesleading to impacts on aquatic life including fish, and harms crops when it falls on fields.
People in Krishnapattanam village and in Gummaldibba complained that the coal dust from theloading unloading operations in the (Krishnapattanam) port is affecting them badly, and they areunable to live properly because of that. The dust settles everywhere, on the trees, on crops, on theirhouses. Krishnapattanam village people took out a rally in February 2014 and took a villagedelegation to port authorities demanding a stop to coal dust pollution in region. However thesecurity guards at gate of authority stopped them and did not allow them to enter into office. Thisresulted in direct clashes with security guards.

22
Figure 18: Photograph showing Krishnapattanam port, coal dumps and transporting lorries. Smaller picture shows dustspreading due to coal handling.
It is interesting that the Environmental Clearance for the Krishnapattanam Port Phase 2 dated 13Nov 2009 (we were not able to get the EC letter for Phase 1), has a condition that “The greenbelt of100 m. width shall be developed around the coal stack yard as per the request in the public hearing”.A Monitoring Report of the Port by the Regional Office, Southern Zone of the MoEF was carried outon 5 Nov 2013, which noted almost full compliance with all conditions, including that the green beltof 211.5 ha was developed when at end of Phase 2 only 191.5 ha. However, as the photograph inFigure 18 above shows, there does not seem to be any green belt around the coal yard.
What people have not reported, but is also a major problem is the run-off from coal stock yards,whether in the ports or at the thermal power plants. This can contaminate the local water bodiesunless it is properly treated.
In the residential area of Green Park in Mettur town, which is situated close to the coal yards ofMALCO19(Madras Aluminium Company) and Chemplast industries, coal dust has become a menaceand a nuisance. Both the industrial units are having coal based captive thermal power plants. Roofsof houses in surrounding areas have turned black. Coal dust is everywhere, inform local people. Coal
19 Madras Aluminium Company was a public sector unit but now has been taken over by Vedanta group ofindustries. At present there is no production from plant. However there is generation of thermal power fromthe 100 MW capacity coal based thermal power plant.
23
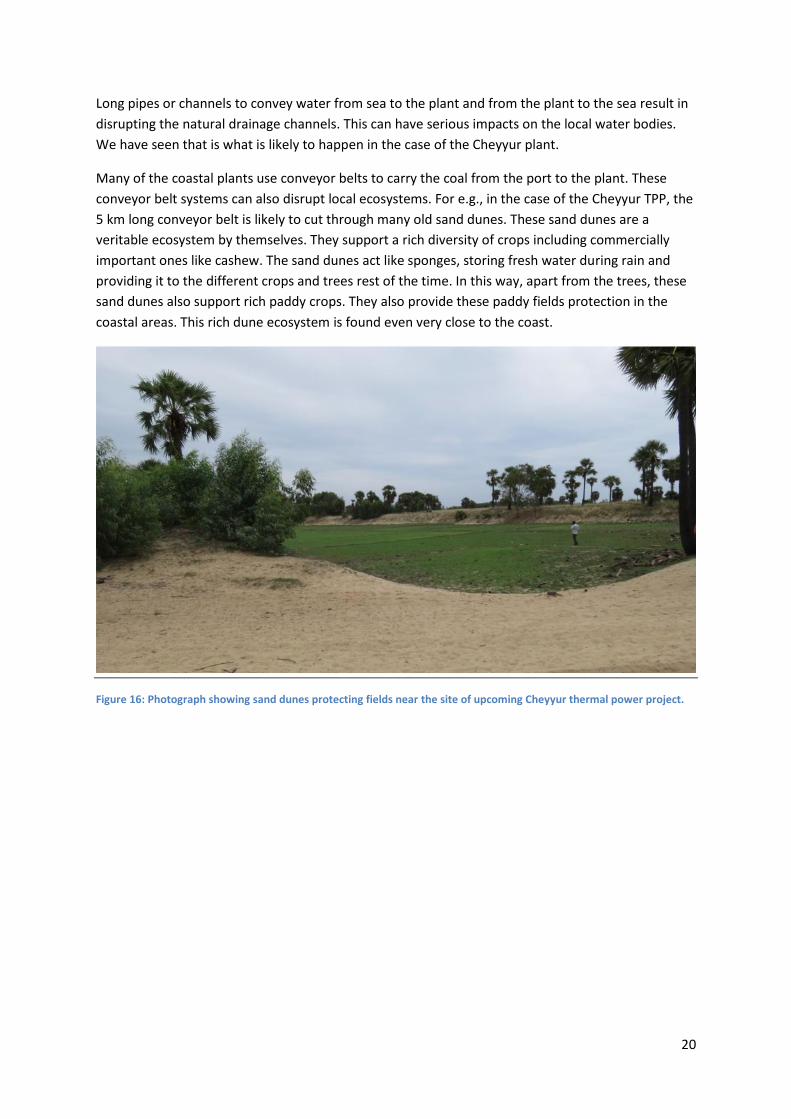
dust accumulates on floors, vehicles, windows, clothes, kitchen utensils, water tanks etc. The womentold us that they are tired of cleaning every now and then since the dust comes back in no time.Local people also complained of itching skin, burning eyes and problems in breathing due to dustpollution.
The problems persist in spite of the measures taken to restraint the spread of coal dust pollution – aso called green cover, some cloth that is torn in several places and a high boundary wall of metalsheets.
Figure 19: Photograph showing ‘green cover’ and protective cloth at coal yard of MALCO and Chemplast at Mettur inTamilnadu.

24
Figure 20: Photograph showing finger blackened with coal dust, after swiping on window sill, at Green Park Residentialarea in Mettur, Tamil Nadu.
In fact, coal dust can be a serious contaminant in marine and aquatic environments too. A paperreviewing in detail large number of scientific studies on effects of unburnt coal on marineenvironment (Morrisey 2005) notes that:
“Coal storage and loading facilities at ports are also potential sites of contamination, oftenon a very large scale.”[Page 72]
It also finds that:
“When present in marine environments in sufficient quantities, coal will have physicaleffects on organisms similar to those of other suspended or deposited sediments. Theseinclude abrasion, smothering, alteration of sediment texture and stability, reducedavailability of light, and clogging of respiratory and feeding organs.” [Page 69]
The paper details the many physical and chemical paths by which unburnt coal causes seriousimpacts on marine environment and ecology, and also states that:
“There are surprisingly few studies in the marine environment focusing on toxic effects ofcontaminants of coal at the organism, population or assemblage levels, but the limitedevidence indicating bioavailability under certain circumstances suggests that more detailedstudies would be justified.” [Page 69]
25
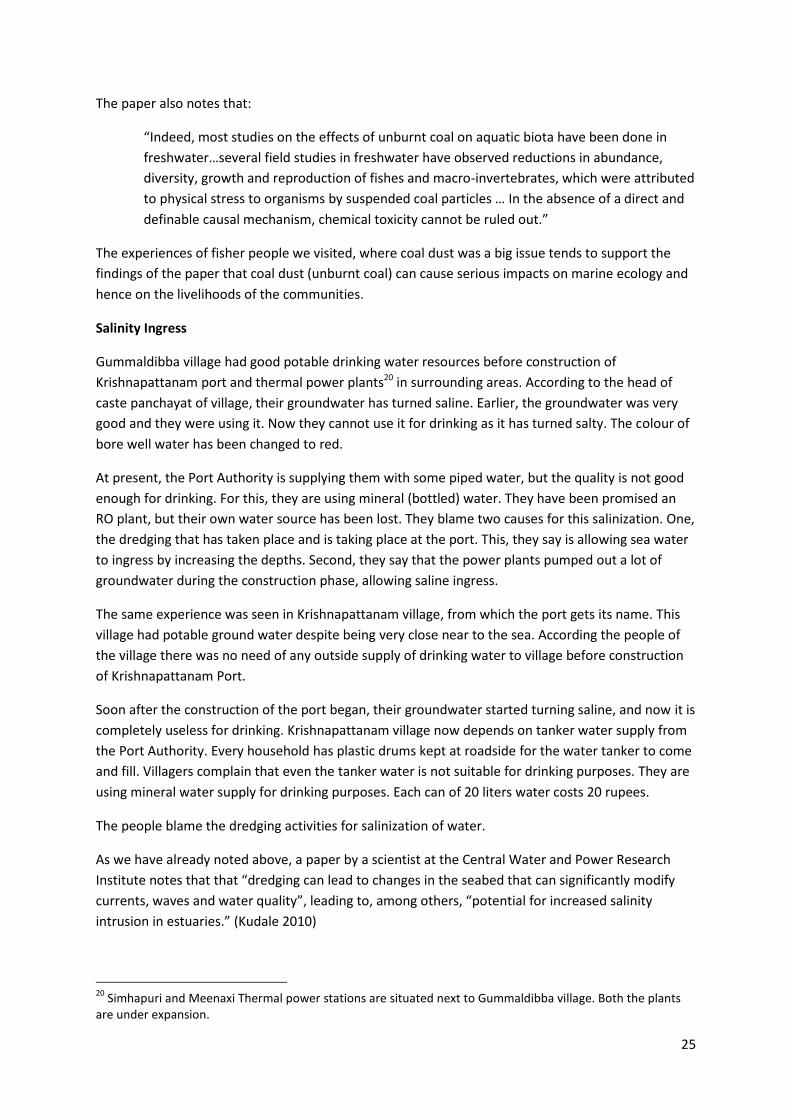
The paper also notes that:
“Indeed, most studies on the effects of unburnt coal on aquatic biota have been done infreshwater…several field studies in freshwater have observed reductions in abundance,diversity, growth and reproduction of fishes and macro-invertebrates, which were attributedto physical stress to organisms by suspended coal particles … In the absence of a direct anddefinable causal mechanism, chemical toxicity cannot be ruled out.”
The experiences of fisher people we visited, where coal dust was a big issue tends to support thefindings of the paper that coal dust (unburnt coal) can cause serious impacts on marine ecology andhence on the livelihoods of the communities.
Salinity Ingress
Gummaldibba village had good potable drinking water resources before construction ofKrishnapattanam port and thermal power plants20 in surrounding areas. According to the head ofcaste panchayat of village, their groundwater has turned saline. Earlier, the groundwater was verygood and they were using it. Now they cannot use it for drinking as it has turned salty. The colour ofbore well water has been changed to red.
At present, the Port Authority is supplying them with some piped water, but the quality is not goodenough for drinking. For this, they are using mineral (bottled) water. They have been promised anRO plant, but their own water source has been lost. They blame two causes for this salinization. One,the dredging that has taken place and is taking place at the port. This, they say is allowing sea waterto ingress by increasing the depths. Second, they say that the power plants pumped out a lot ofgroundwater during the construction phase, allowing saline ingress.
The same experience was seen in Krishnapattanam village, from which the port gets its name. Thisvillage had potable ground water despite being very close near to the sea. According the people ofthe village there was no need of any outside supply of drinking water to village before constructionof Krishnapattanam Port.
Soon after the construction of the port began, their groundwater started turning saline, and now it iscompletely useless for drinking. Krishnapattanam village now depends on tanker water supply fromthe Port Authority. Every household has plastic drums kept at roadside for the water tanker to comeand fill. Villagers complain that even the tanker water is not suitable for drinking purposes. They areusing mineral water supply for drinking purposes. Each can of 20 liters water costs 20 rupees.
The people blame the dredging activities for salinization of water.
As we have already noted above, a paper by a scientist at the Central Water and Power ResearchInstitute notes that that “dredging can lead to changes in the seabed that can significantly modifycurrents, waves and water quality”, leading to, among others, “potential for increased salinityintrusion in estuaries.” (Kudale 2010)
20 Simhapuri and Meenaxi Thermal power stations are situated next to Gummaldibba village. Both the plantsare under expansion.

26
Figure 21: Photograph showing plastic barrels outside houses for storing water from tanker supply in Krishnapattanamvillage.
It should also be noted that normally, projects such as ports and thermal power plants are notallowed to use groundwater for their construction and operation purposes. However, villagers asnoted above told us how groundwater was used for these activities and that this is also one of thereasons for the salinization of groundwater. Given the close proximity of saline and fresh waters inthe coastal area, use of fresh water, particularly ground water has to be done with utmost caution,but clearly this does not seem to be the case.
Even during our visit, we saw a large number of tankers pumping out ground water at a point closeto the mandal HQ, Muthukur, to deliver to the port. We were informed that about 150 tankers maketen trips per day to take water to the port for cleaning, dust suppression, and other uses. Thismassive withdrawal of water just 5-6 kms from the coast is likely to result in not just fall in theground water levels, but also further salinity ingress.

27
Figure 22: Photograph showing water supply tankers being filled by bore well pumps at Muthukur near Krishnapattanamport.
Cumulative Impacts
Serious as the impacts of individual plants are, the cumulative impacts of several plants coming up inclusters are much higher. In many places, including places we visited like Nellore district, NorthChennai, Cuddalore, there are such clusters coming up. Unfortunately, there is no cumulative impactassessment being undertaken of such development21.
Figure 23: Signboards near Nellore showing a number of thermal power plants coming up in close vicinity. Seen in thedistance are cooling towers of another plant.
21 A Cumulative Impact assessment (CIA) was ordered in the case of the IL&FS plant coming up in Cuddaloreafter local people moved the National Green Tribunal. However, this CIA was completed in just a matter of fewweeks and falls far short of what a truly comprehensive CIA should be.
28
Preliminary Conclusions
Our visit has revealed that rather than being benign as far as water is concerned, coastal thermalpower plants have massive and serious impacts on the local water systems, local communities andlivelihoods. They were found to have salinized groundwater, contaminated local water bodies,disrupted water drainage patterns, dumped pollution irresponsibly, impacted yields of fish andaffected people’s livelihoods.
The EIAs and EMPs for most of the projects we visited are not available and so we are not able to seeif these issues were dealt with in the EIA / EMP. However, one thing is clear, that even if theEIA/EMP dealt with these issues, there has been a clear and gross failure in terms of anticipating,preventing and mitigating these impacts. These calls for a serious re-look at the process of assessingand addressing impacts.
We have applied for the EIA and EMPs to be made available under the RTI Act. After obtaining these,we intend to do some more analysis to bring out some recommendations. This is why we have titledthis section as preliminary conclusions.
This field visit is a part of the larger ongoing study and hence this report should be treated only as apreliminary report.
Prepared by:
Shripad Dharmadhikary and Jinda Sandbhor,Manthan Adhyayan Kendra,[email protected]
October 28, 2014
Acknowledgements
Many people helped us in making this visit possible and it is not possible to name all of them.However, we would like to particularly mention G. Malyadri, G. Srinivaslu and C. H. Anjireddy of JanVigyan Vedika, E Venkateshwarlo and B. G. V. Raju of Andhra Pradesh Civil Liberties Committee, D.K. Balayu of Kula Nirmulana Porata Samiti and K Bhaskar of Mission for Evergreen Environment inNellore; G Madheshwaram, A. Mani and T. M. Ganeshan of West Konur Farmers Association ofMettur; Arul Selvam in Cuddalore; the farmers, fisherpeople and communities of all the places wevisited, and last but not the least, Nityanand Jayaraman, Karen Coelho, K. Saravanan, DivyaNarayanan and Shweta Narayan of Community Environment Monitoring in Chennai for hosting us,in planning and arranging our visit, accompanying us and sharing with us their knowledge,information and insights.
All photos by Shripad Dharmadhikary / Jinda Sandbhor, Manthan Adhyayan Kendra
29
References
Ramky Enviro Engineers Ltd,. Final Environmental Impact Assessment Report for proposed (2*800)Thermal Power Project. Chennai: Tamil Nadu state electricity generation corporation, 2011.
IL and FS Escomart Limited Hyderabad. Technical EIA Guidance Mannual for Thermal Power Plants.New Delhi : Ministry of Environment and Forest, Government of India, 2010.
Kudale, M D. "Impact of Port Development on the Coastline and the need for Protection ." IndianJournal of Geo-Marine Sciences 39, no. 4 (Des 2010): 597-604.
Ministry of Earth Sciences and Indian National Center for Ocean Information Services. "Report onuse of Satellite data for detection of voilation of land use along the Coastal Regulation Zone andimpact of port structures on shoreline changes." www.moef.nic.in. October 2009.http://www.moef.nic.in/downloads/public-information/icmam-proposal.pdf (accessed September20, 2014).
Morrisey, Michael J Ahrens and Donald J. "Biological Effects of Unburnt Coal in the MarineEnvironment." Oceanography and Marine Biology: An Annual Review 43 (2005): 69-122.
S Janakarajan, Sidharth Hande, Nityanand Jayaraman. Hydrological Implications of the 4000 MWcoal-fired Ultra Mega Power project in Cheyyur, Tamil Nadu. Chennai: Community EnvironmentalMonitoring, a program of The Other Media, 2014.
WAPCOS Limited. Comprehensive Environmental Impact Assessment Report, Cheyyur Ultra MegaPower Project (4000 MW). Power Finance Corporation, India , 2012.
30
Annexure 1
List of Thermal Power Plants Visited
Sr.No. Name of Plant inbrief
Location Capacity(MW)
Status
1 Ennore TPP SEZ Vayalur Village, Ambathur Taluk,Thiruvallur District, Tamil Nadu.
1600 In Pipeline
2 Ennore TPP Ennore, Chennai, Tamil Nadu 450 Operational3 North Chennai TPP
(Main andExpansion)
Athipattu, Thiruvallur (District),Tamil Nadu
1830 Operational
4 NTPC TNEL, Vallur Thiruvallur District, Tamil Nadu 1000 Operational5 Meenakshi TPP Village Thamminapatnam, District
Nellore, AP540 Operational
6 Simhapuri TPP Village Thamminapatnam, DistrictNellore, AP
540 Operational
7 SBQ Steel PlantCaptive TPP
District Nellore, AP 300 Operational
8 APGENCO SriDamodaranSanjeevaiah TPP
District Nellore, AP 1600 Operational
9 Gayatri TPP Villages Painampuram &Sivarampuram, District Nellore, AP
1980 Underconstruction
10 Nelcast TPP Villages Painampuram &Sivarampuram, District Nellore, AP
1320 Underconstruction
11 Cheyyur UMPP Cheyyur village, Cheyyur block ofKancheepuram district, Tamil Nadu
4000 In Pipeline
12 Mettur TPP Mettur, Tamil Nadu 1086 Operational13 IL&FS TPP Parangipettai block of Cuddalore
district, Tamil Nadu4000 Under
construction14 CPCL Thiyagavalli and Kudikadu villages
of Cuddalore District, Tamil Nadu1320 In Pipeline
15 Neyvelli TPS 1 and2
Neyvelli, Tamil Nadu 2070 Operational
16 Reliance UMPP Krishnapattanam, District Nellore,A.P.
4000 In Pipeline
31
Annexure 2
Locations of Places Visited