Mahalia Jackson questions. Question 1 What genre is Mahalia Jackson?
Mahalia Clark
1
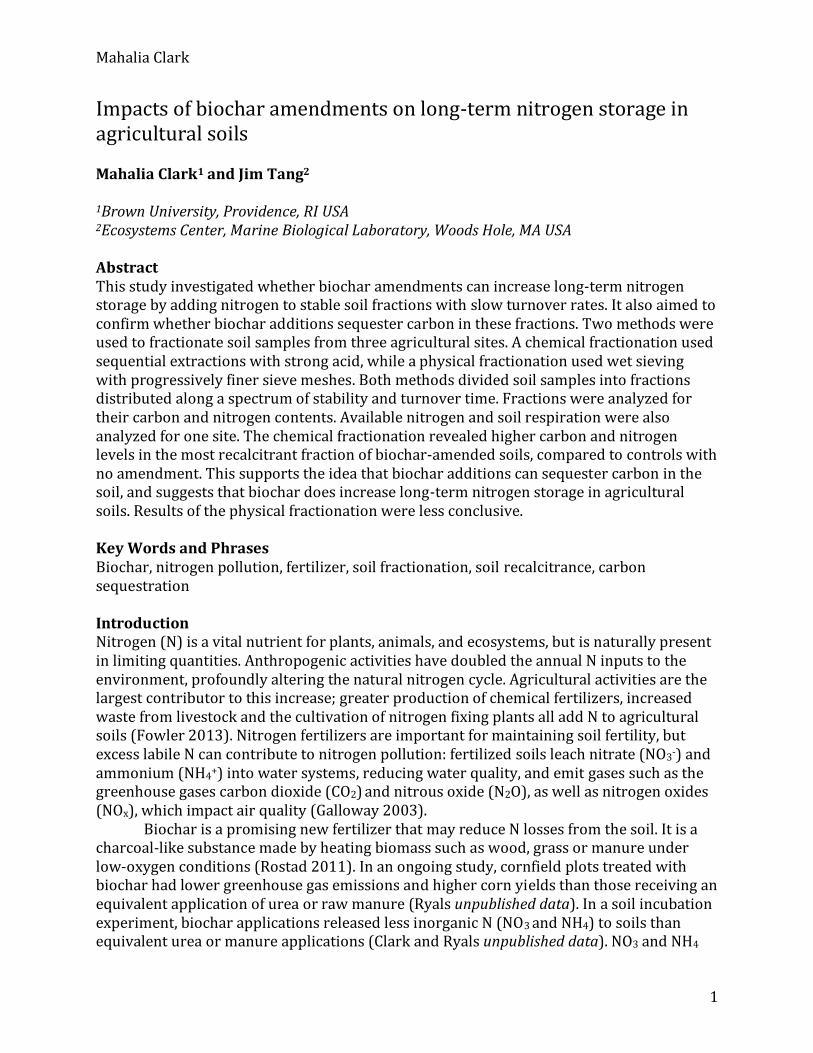
Impacts of biochar amendments on long-term nitrogen storage in agricultural soils Mahalia Clark1 and Jim Tang2
1Brown University, Providence, RI USA 2Ecosystems Center, Marine Biological Laboratory, Woods Hole, MA USA Abstract This study investigated whether biochar amendments can increase long-term nitrogen storage by adding nitrogen to stable soil fractions with slow turnover rates. It also aimed to confirm whether biochar additions sequester carbon in these fractions. Two methods were used to fractionate soil samples from three agricultural sites. A chemical fractionation used sequential extractions with strong acid, while a physical fractionation used wet sieving with progressively finer sieve meshes. Both methods divided soil samples into fractions distributed along a spectrum of stability and turnover time. Fractions were analyzed for their carbon and nitrogen contents. Available nitrogen and soil respiration were also analyzed for one site. The chemical fractionation revealed higher carbon and nitrogen levels in the most recalcitrant fraction of biochar-amended soils, compared to controls with no amendment. This supports the idea that biochar additions can sequester carbon in the soil, and suggests that biochar does increase long-term nitrogen storage in agricultural soils. Results of the physical fractionation were less conclusive. Key Words and Phrases Biochar, nitrogen pollution, fertilizer, soil fractionation, soil recalcitrance, carbon sequestration Introduction Nitrogen (N) is a vital nutrient for plants, animals, and ecosystems, but is naturally present in limiting quantities. Anthropogenic activities have doubled the annual N inputs to the environment, profoundly altering the natural nitrogen cycle. Agricultural activities are the largest contributor to this increase; greater production of chemical fertilizers, increased waste from livestock and the cultivation of nitrogen fixing plants all add N to agricultural soils (Fowler 2013). Nitrogen fertilizers are important for maintaining soil fertility, but excess labile N can contribute to nitrogen pollution: fertilized soils leach nitrate (NO3
-) and ammonium (NH4
+) into water systems, reducing water quality, and emit gases such as the greenhouse gases carbon dioxide (CO2) and nitrous oxide (N2O), as well as nitrogen oxides (NOx), which impact air quality (Galloway 2003).
Biochar is a promising new fertilizer that may reduce N losses from the soil. It is a charcoal-like substance made by heating biomass such as wood, grass or manure under low-oxygen conditions (Rostad 2011). In an ongoing study, cornfield plots treated with biochar had lower greenhouse gas emissions and higher corn yields than those receiving an equivalent application of urea or raw manure (Ryals unpublished data). In a soil incubation experiment, biochar applications released less inorganic N (NO3 and NH4) to soils than equivalent urea or manure applications (Clark and Ryals unpublished data). NO3 and NH4
Mahalia Clark
2
are the principle forms of N available for plant uptake: if the biochar treatment supplied less inorganic N, how could it also support higher corn yields?
It has been suggested that biochar amendments, by adding black carbon to the soil, could sequester carbon and increase soil organic matter. Biochar production converts labile molecules in the feedstock to complex, stable organic molecules in the biochar. These are difficult for microbes to break down, so they have a long lifetime in the soil (Rostad 2011). The stability and lifetime of soil organic matter is determined by physical factors as well as chemical quality (Aber and Melillo, 2001). When organic matter becomes associated with mineral particles, or locked up in soil aggregates, it becomes protected from decomposition by microbes. Six et al. found that microaggregates <250m in diameter are highly stable, while larger macroaggregates are more easily broken up by physical action (2000). By adding organic matter and improving soil structure, biochar may also promote the formation of stable aggregates.
My question is: if biochar amendments increase soil organic matter, can they also increase long-term N storage by adding N to less labile soil fractions? I hypothesize that in the most chemically recalcitrant and physically stable soil fractions biochar-amended soils will have higher levels of carbon (C) and N than control soils. Methods Soil samples were collected from plots with and without biochar amendments, at three field sites with varied soil types. Each sample underwent two fractionation methods. A chemical method used sequential extraction with strong acid to separate soils into a solid recalcitrant fraction, and two more labile liquid fractions. A physical method used sequential sieving of wet soil to separate water-stable aggregates of different size classes, of which smaller sizes correspond to greater aggregate stability. The C and N contents of each fraction were then analyzed. For one site, inorganic N and soil respiration were also measured. The significance of biochar treatment effects was tested using a one-way (simple) ANOVA, and considered significant for p-levels < 0.05. Field Sites Soil samples were collected from Control and Biochar plots at three field sites under maize production: Carvel Research and Education Center in Georgetown, Delaware (DE), the Larson Agricultural Research Station in Rock Springs, Pennsylvania (PA), and UMass Amherst’s Agronomy and Vegetable Farm in South Deerfield, Massachusetts (MA).
The DE site had a sandy soil while the PA site had a silt-loam soil. Each of these sites had three Control plots, which had received no fertilizer, and three Biochar plots, which had received biochar amendments at a rate of 320 kg N ha-1 at the beginning of the summer for two consecutive years. The biochar used at these sites was manure-based, and had an N content of 3.5% by dry mass.
The MA site had 5 replicate plots for each of three treatments: a control with no biochar addition, and treatments of 2% and 4% biochar in the upper 15cm of soil by dry mass. The biochar used was wood-based, with an N content 1.21%. Biochar treatments of 2 and 4% were therefore equivalent to rates of 490 and 980 kg N ha-1 respectively, and were applied once in July 2012. For the fractionation methods, only samples from the 2% biochar plots were used, since the N application rate in these samples was more comparable to those for DE and PA sites.

Mahalia Clark
3
Field Measurements
Soil samples were collected in late October and early November. Three samples were taken from each Control and Biochar plot at the DE and PA sites. These were amalgamated to form one representative sample for each plot and then air-dried. Samples for the MA site were taken from three of the five replicate plots for each treatment type, and stored on ice until nutrient analysis could be performed. They were then air-dried.
At the MA site, soil respiration was also measured. A LI-COR 6200 was used to measure CO2 fluxes from the soil at two time points: on November 7th and November 18th. Fluxes from four of the five replicate plots were measured for each treatment on the first sampling date, and all fluxes from all replicates were measured on the second date. Since no plants were growing in the field at these times, CO2 fluxes should represent microbial respiration, and be indicative of microbial activity and decomposition in the soil. Temperatures on the first sampling date were around 4C, but hovered around 1C on the second date. Nutrient Analysis For the MA samples, available N was extracted from subsamples of about 15g of fresh soil using 100ml of KCl. Subsamples of about 10g of fresh soil were oven-dried at around 51C for 48 hours to determine their dry mass and moisture contents. The KCl extract was analyzed for NO3 using a Lachat Flow Injection Analyzer. NH4 was analyzed using methods adapted from Strickland and Parsons (1972), and a Shimadzu UV-1601 UV-Visible spectrophotometer. Chemical Fractionation
Subsamples of each soil sample were oven dried for 48 hours. For MA soils, the 2% biochar treatment was used to represent the Biochar samples. Half a gram of each soil sample then underwent a chemical fractionation according to methods described in Clark et al. (2011). In this method samples were first extracted with 5N H2SO4 to yield Labile fraction I; this is the most labile material and consists mainly of starch and hemicellulose. Samples were then extracted with 26N H2SO4 to yield Labile fraction II, consisting mainly of cellulose. The remaining solid was the Recalcitrant fraction and was isolated onto a 47mm GFF filter; it contains the least labile material such as lignin and humus.
The Labile fractions were neutralized with NaOH and analyzed for total dissolved nitrogen (TDN) and dissolved organic carbon (DOC). For TDN analysis, 2.5ml of the Labile I fraction was neutralized with 2.65ml of 5N NaOH, and 2.5ml of the Labile II fraction was neutralized with 2.6ml of 2N NaOH. A 5ml sample of neutralized fraction was then oxidized to NO3 using a potassium persulfate and boric acid reagent, and analyzed using a Lachat Flow Injection Analyzer. The pH of each sample was estimated using universal indicator paper, to ensure that it was between pH 3 and 6. For DOC analysis, 4ml of Labile fraction I was neutralized with 4.4ml of 5N NaOH, and 4ml of Labile fraction II was neutralized with 4.35ml of 5N NaOH. The pH of each sample was estimated to ensure that it was between pH 5 and 8. DOC was then analyzed using an O.I Analytical Aurora 1030W TOC Analyzer. Physical Fractionation

Mahalia Clark
4
For each sample, approximately 70g of air-dried soil underwent a physical fractionation according to methods described by Denbow (2011), based on theory from Six et al. (2000). For the MA site, samples that had received 2% biochar were used as Biochar samples. In this method, soil samples were first homogenized by passing them through the largest available sieve, with a mesh size of 5.6mm.
A 2mm sieve was placed in a plastic basin of de-ionized (DI) water, filled so that the sieve mesh was submerged under 1cm of water. A soil sample was then spread over the mesh and left to sit for 5 minutes while water percolated into any soil clumps. After this period, the sieve was dipped 50 times in and out of the water bath, so that all but the most stable large aggregates passed through. These ‘Large Macroaggregates’ were washed into a pre-weighed aluminum drying pan using a squeeze-bottle of DI water. Any floating matter in this drying pan was decanted off into a second pre-weighed drying pan for ‘Light Organic Matter’. The soil and water that passed through the 2mm sieve was then poured over a 250m sieve and dipped 50 times in and out of the water bath. The sides and back of the sieve were washed with DI from a squeeze-bottle to ensure that all smaller aggregates passed through the sieve. The remaining ‘Small Macroaggregates’ that did not pass through were then washed into a third pre-weighed drying pan. Finally, the remaining sample was poured over a 53m sieve and dipped 50 times. Whatever did not pass through this sieve was considered ‘Microaggregates’, while what did pass through was considered ‘Silt and Clay’. These fractions were also collected in a pre-weighed drying pans.
The pan for Silt and Clay was left to settle over night before excess water was siphoned off and the pan was placed in the oven for 48 hours. The other pans were placed directly in the oven for 48 hours. Once oven-dried, each pan was weighed and the dry mass of each fraction calculated. A subsample of each fraction was ground using a mortar and pestle, and analyzed for total carbon and nitrogen using a Thermo Scientific Flash 2000 NC Soil Analyzer. Results Nutrient Analysis and Soil Respiration Nutrient analysis of MA soil samples revealed no significant difference in NH4 levels between any of the Control and Biochar treatments (Fig. 1). There was a significant rise (p<0.05) in NO3 levels with increasing biochar addition rates (Fig. 1).
A comparison of soil respiration between treatments at the MA site revealed no significant difference between any of the Control and two Biochar treatments (Fig. 2). There was, however, a significant (p= 0.004) drop between gas fluxes measured on November 7th and those measured on November 18th
(Fig. 2). Temperatures were around 4C on the first sample date, and only around 1C on the second. Chemical Fractions In Recalcitrant soil fractions, Biochar samples had significantly higher C levels than Control samples for all three soil types (Fig. 3a-c). C levels in the Recalcitrant fraction more than doubled with biochar addition for DE samples (Fig. 3a). They increased by 63% in MA soils and 38% in PA soils (Fig. 3b, c). There was no significant change in the C contents of Labile fractions I and II. C levels in these fractions increased or decreased slightly with biochar addition, but there was no consistent trend across soil types. Total soil carbon, summed
Mahalia Clark
5
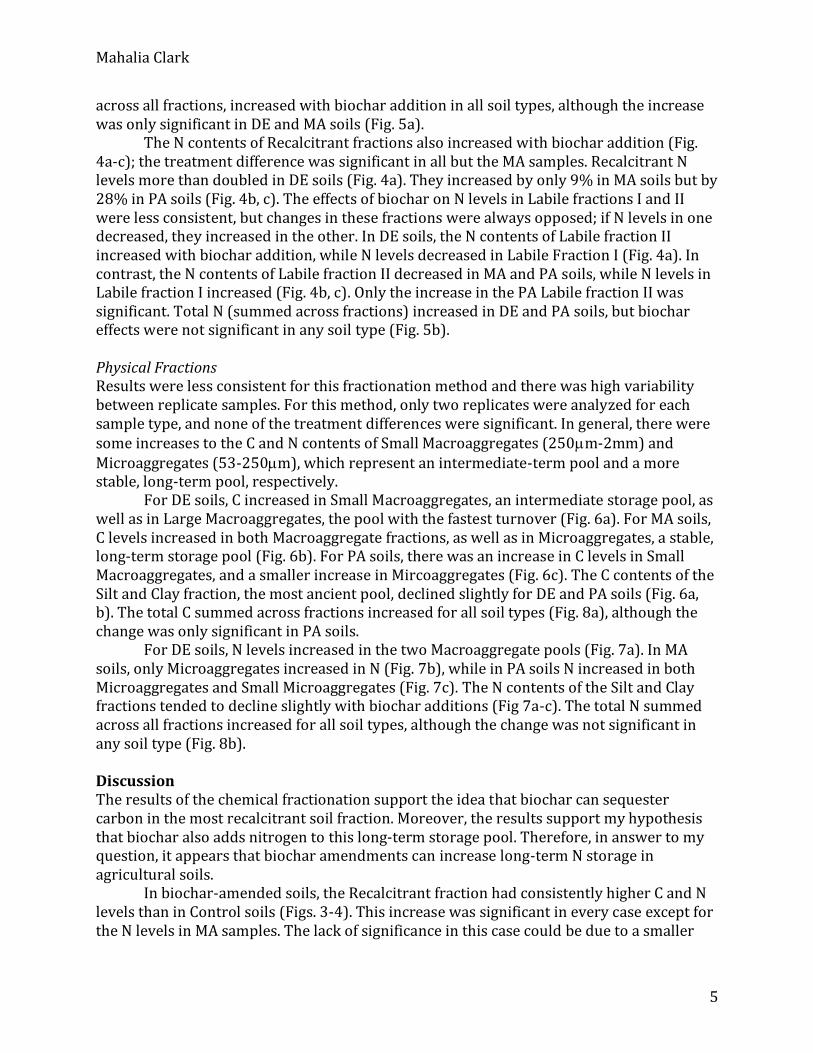
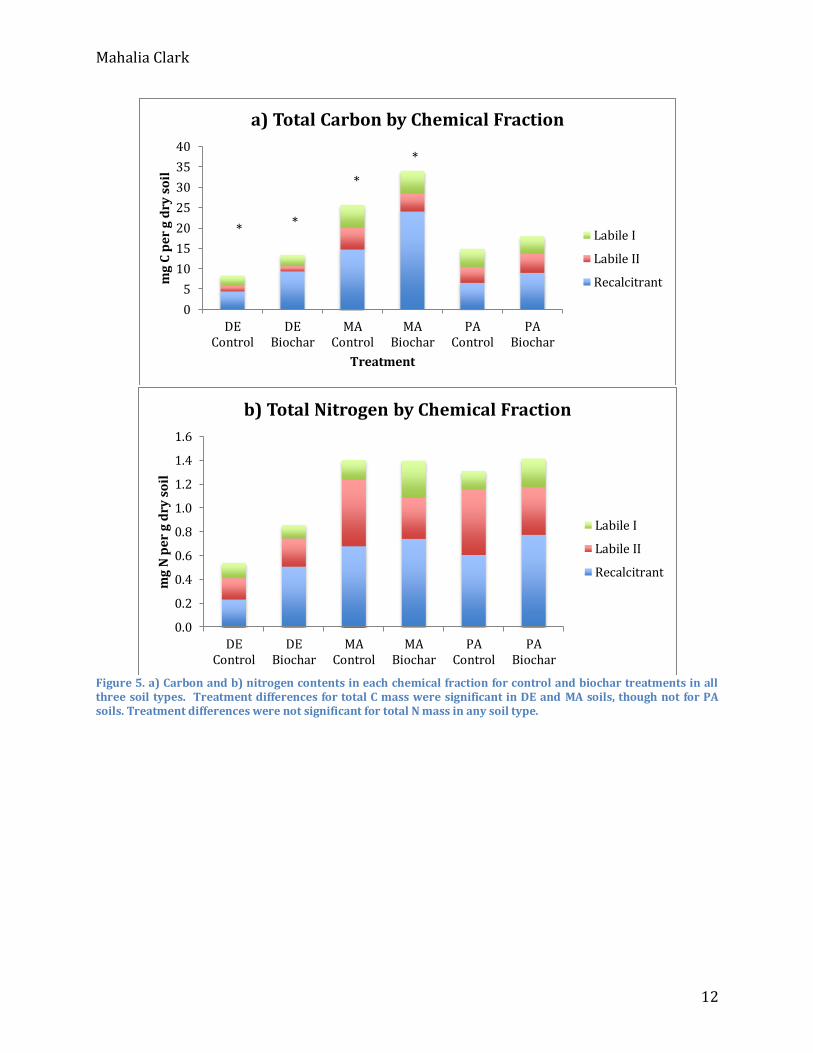
across all fractions, increased with biochar addition in all soil types, although the increase was only significant in DE and MA soils (Fig. 5a).
The N contents of Recalcitrant fractions also increased with biochar addition (Fig. 4a-c); the treatment difference was significant in all but the MA samples. Recalcitrant N levels more than doubled in DE soils (Fig. 4a). They increased by only 9% in MA soils but by 28% in PA soils (Fig. 4b, c). The effects of biochar on N levels in Labile fractions I and II were less consistent, but changes in these fractions were always opposed; if N levels in one decreased, they increased in the other. In DE soils, the N contents of Labile fraction II increased with biochar addition, while N levels decreased in Labile Fraction I (Fig. 4a). In contrast, the N contents of Labile fraction II decreased in MA and PA soils, while N levels in Labile fraction I increased (Fig. 4b, c). Only the increase in the PA Labile fraction II was significant. Total N (summed across fractions) increased in DE and PA soils, but biochar effects were not significant in any soil type (Fig. 5b). Physical Fractions Results were less consistent for this fractionation method and there was high variability between replicate samples. For this method, only two replicates were analyzed for each sample type, and none of the treatment differences were significant. In general, there were some increases to the C and N contents of Small Macroaggregates (250m-2mm) and Microaggregates (53-250m), which represent an intermediate-term pool and a more stable, long-term pool, respectively.
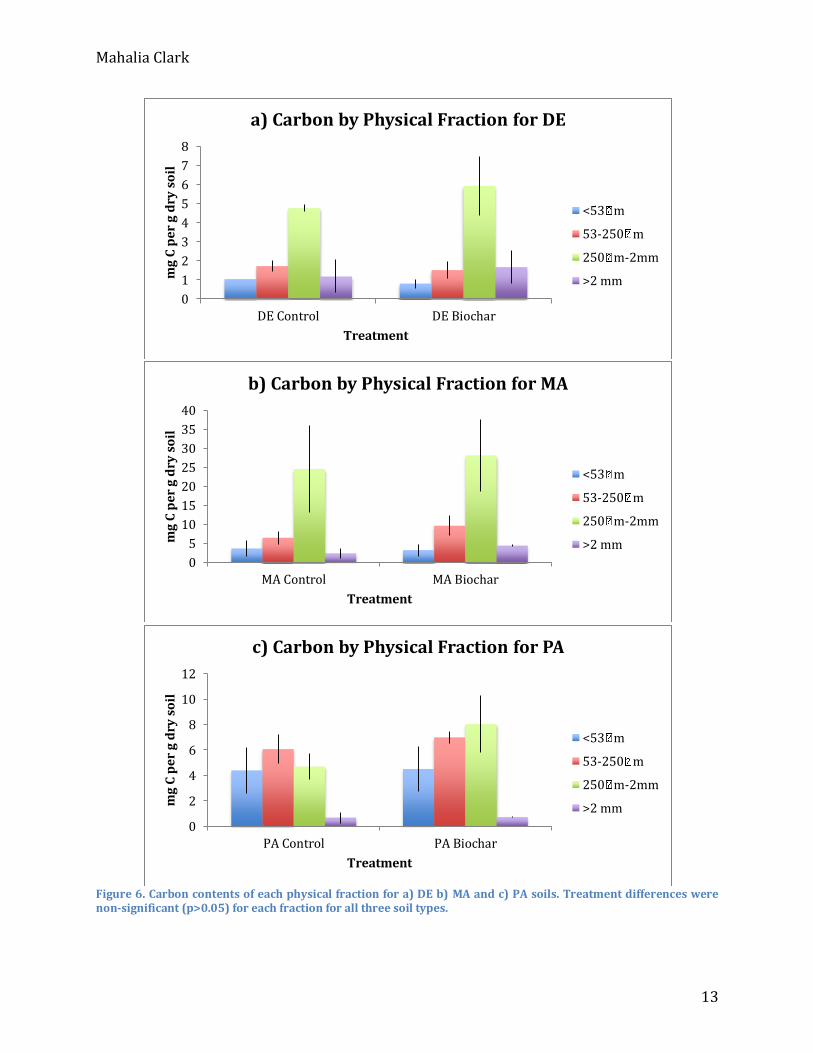
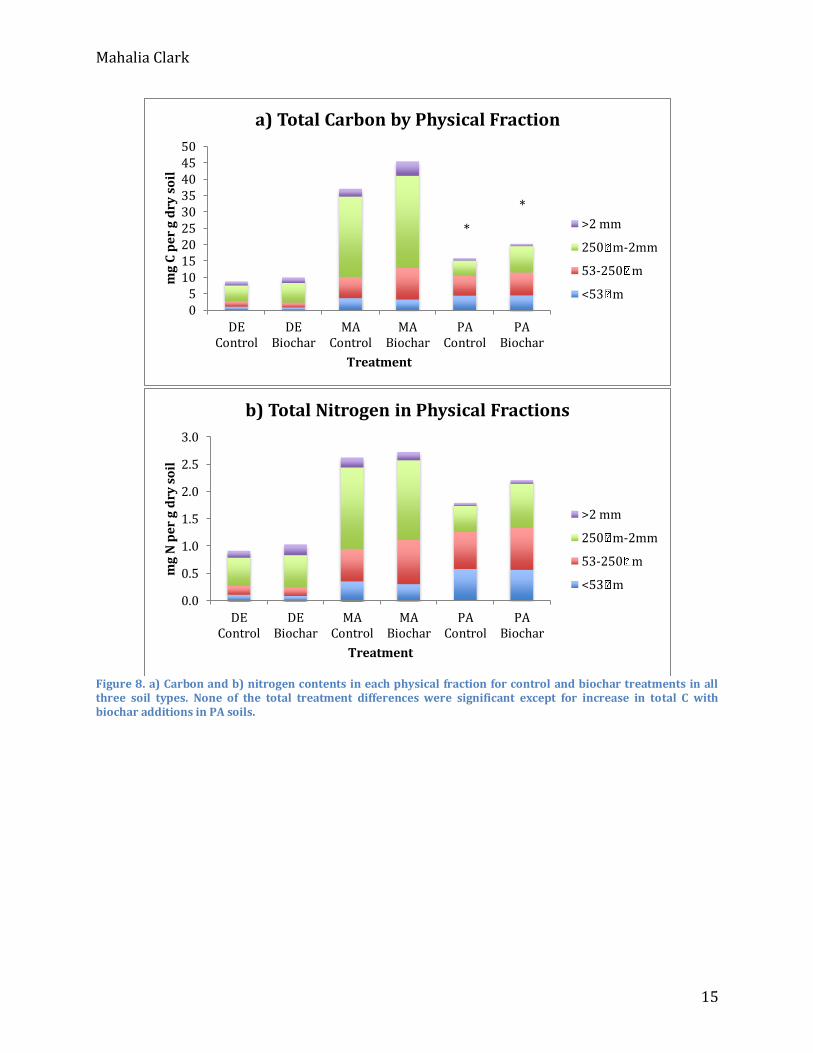
For DE soils, C increased in Small Macroaggregates, an intermediate storage pool, as well as in Large Macroaggregates, the pool with the fastest turnover (Fig. 6a). For MA soils, C levels increased in both Macroaggregate fractions, as well as in Microaggregates, a stable, long-term storage pool (Fig. 6b). For PA soils, there was an increase in C levels in Small Macroaggregates, and a smaller increase in Mircoaggregates (Fig. 6c). The C contents of the Silt and Clay fraction, the most ancient pool, declined slightly for DE and PA soils (Fig. 6a, b). The total C summed across fractions increased for all soil types (Fig. 8a), although the change was only significant in PA soils.
For DE soils, N levels increased in the two Macroaggregate pools (Fig. 7a). In MA soils, only Microaggregates increased in N (Fig. 7b), while in PA soils N increased in both Microaggregates and Small Microaggregates (Fig. 7c). The N contents of the Silt and Clay fractions tended to decline slightly with biochar additions (Fig 7a-c). The total N summed across all fractions increased for all soil types, although the change was not significant in any soil type (Fig. 8b). Discussion The results of the chemical fractionation support the idea that biochar can sequester carbon in the most recalcitrant soil fraction. Moreover, the results support my hypothesis that biochar also adds nitrogen to this long-term storage pool. Therefore, in answer to my question, it appears that biochar amendments can increase long-term N storage in agricultural soils.
In biochar-amended soils, the Recalcitrant fraction had consistently higher C and N levels than in Control soils (Figs. 3-4). This increase was significant in every case except for the N levels in MA samples. The lack of significance in this case could be due to a smaller

Mahalia Clark
6
sample size; one of the MA Biochar samples was excluded due to its unreasonably high C and N levels, which led me to believe that it had actually received 4% rather 2% biochar and been mislabeled. This left only two MA Biochar samples, while most other sample types had three replicates; one DE Biochar sample also had to be excluded as its Recalcitrant fraction was dropped. Alternatively, since biochar was added three summers ago at the MA site, N in this pool might have undergone more decomposition and processing by microbes and been partially taken up by plants.
There was no significant change to the C contents of labile fractions (Fig. 3a-c). All changes were small and there was no clear trend across soil types, indicating that biochar mostly contributes stable, recalcitrant C to soils. The N contents of Labile fractions did shift, although the changes were inconsistently across soil types. The N contents of Labile fractions I and II always compensated for each other, so that if one increased, the other decreased (Fig. 4a-c). Biochar therefore appears to add both labile and recalcitrant N, but the labile N interacts with different soil types in different ways.
It remains unclear whether biochar merely adds N to soil fractions or also redistributes it between soil pools. To elucidate this question, further analysis could be done to compare the N added to each pool to the total N added in biochar additions. This information could also be compared to the N distributed to each fraction in a chemical fractionation of pure biochar.
While increasing biochar applications increased extractable NO3 in the soil, they had little effect on extractable NH4, which remained at constant levels across treatments (Fig. 1). This implies that biochar might contribute some nitrate to the soil, or else enough labile N that microbes could mineralize and nitrify it over the course of the growing season. The low and uniform NH4 levels might be related to the sampling date. Since it was the end of the growing season, plants might have taken up most of the NH4 in preference to the NO3.
The fact that soil respiration did not significantly increase with biochar additions is consistent with the idea that biochar mostly contributes recalcitrant C and N. Microbes have difficulty attacking this material, so biochar additions would not be expected to stimulate microbial respiration. However, the fact that there was a significant temperature effect suggests that this may have been the controlling factor for CO2 fluxes, and might have masked any effect of the biochar (Fig. 2). These measurements are most likely not comparable to CO2 fluxes measured during the summer. In fact, an ongoing study at the DE and PA sites has found that biochar does slightly increase soil respiration over control soils, but to a much lesser extent than for other fertilizers (Ryals unpublished data).
Results of the physical fractionation were not as clear or consistent as those of the chemical fractionation. Results were highly variable for replicate samples, of which there were only two, which made it difficult to see any significant differences between treatments. To get significant results in the future, 5 replicates per soil type might be used. Biochar additions did appear to generally increase the C and N contents of Microaggregates and small Macroaggregates, which are stable and intermediately stable pools, respectively (Fig. 6-7). In some cases the N and C contents of the Silt and Clay declined slightly, but rather than stimulating the loss of ancient stores of C and N, it is more likely that biochar additions help incorporate these small particles into larger aggregates, improving soil structure. This makes the results of this method difficult to interpret.
In conclusion, the chemical fractionation showed that biochar amendments can add N to long-term storage pools in agricultural soils. It also supported the idea that biochar
Mahalia Clark
7
additions sequester C in the soil. The physical fractionation gave less consistent results, and nutrient analyses and soil respiration measurements were negatively impacted by the sampling season. Acknowledgements I would like to thank Dr. Rebecca Ryals for introducing me to biochar and sharing the results of her biochar research. Thank you to Rich McHorney, Fiona Jevon and Tyler Messerschmidt for their indispensable laboratory help. Thank you to Nick Barrett for his words of encouragement and moral support. And thank you to Bonnie Kwiatkowski for her assistance with statistical software. Literature Cited Aber, J.D. and J. M. Melillo (2001) Terrestrial Ecosystems, 2nd ed. Academic Press, San Diego, California, USA. 205-252. Clark, L et al. (2011) Fractionating Carbon Samples. Fowler, D et al. (2013) The global nitrogen cycle in the twenty-first century. Philosphical Transactions of the Royal Society: Biology, 368, 1-13. Galloway, J et al. (2003) The Nitrogen Cascade. BioScience, 53, 341-356. Denbow, J. (2011) Soil Fractionation Protocol with Intro. Youtube.com. Rostad, C.E. and D.W. Rutherford (2011) Biochar for Soil Fertility and Natural Carbon Sequestration. USGS Fact Sheet 2010-3117. Strickland, J.D.H. and T.R. Parsons (1972) A practical handbook of Seawater Analysis, Fisheries Research Board of Canada, 2nd. ed. Six et al. (2000) Soil macroaggregate turnover and microaggregate formation: a mechanism for C sequestration under no-tillage agriculture. Soil Biology and Biochemistry, 32, 2099-2103.
Mahalia Clark
8
Figures All error bars represent 1 standard deviation. Stars indicate a significant difference was found between Control and Biochar treatments (p<0.05 in a one-way ANOVA).
Figure 1. Available N in Biochar Ammended Soils Figure 2. Soil Respiration Figure 3. Carbon by Chemical Fraction in Three Soils Figure 4. Nitrogen by Chemical Fraction in Three Soils Figure 5. Total Carbon and Nitrogen by Chemical Fraction in Three Soils Figure 6. Carbon by Physical Fraction in Three Soils Figure 7. Nitrogen by Physical Fraction in Three Soils Figure 8. Total Carbon and Nitrogen by Physical Fraction in Three Soils

Mahalia Clark
9
Figure 1. NH4 and NO3 concentrations in MA soil at three biochar application rates. Differences in NO3 were significant (p<0.05) while those in NH4 were not.
Figure 2. Soil respiration at the MA site on two dates. The mean air temperature was 4.0C on Nov. 7 and 1.3C on Nov. 18. All differences between treatments were non-significant (p>0.05). The difference between sample dates was significant (p=0.004).
0
5
10
15
20
25
30
0% 2% 4%
g
N p
er
g s
oil
Biochar Addition Rate (% of top 15cm of soil)
Available N in Biochar Ammended Soils
NH4
NO3
*
*
*
0.0
0.2
0.4
0.6
0.8
1.0
1.2
1.4
1.6
0% 2% 4%
CO
2 F
lux
(μm
ol m
-2 s
-1)
Biochar Addition Rate (% of top 15cm of soil)
Soil Respiration
Nov 7
Nov 18

Mahalia Clark
10
Figure 3. Carbon contents of each chemical fraction for a) DE b) MA and c) PA soils. Treatment differences were significant (p<0.05) in Fraction 3 for each of the three soil types. Treatment differences were not significant in Fraction 1 or 2 for any of the soil types.
0
2
4
6
8
10
12
DE Control DE Biochar
mg
C p
er
g d
ry s
oil
Treatment
a) Carbon by Chemical Fraction for DE
Recalcitrant
Labile II
Labile I
*
*
*
*
0
5
10
15
20
25
30
MA Control MA Biochar
mg
C p
er
g d
ry s
oil
Treatment
b) Carbon by Chemical Fraction for MA
Recalcitrant
Labile II
Labile I
*
*
0
2
4
6
8
10
12
PA Control PA Biochar
mg
C p
er
g d
ry s
oil
Treatment
c) Carbon by Chemical Fraction for PA
Recalcitrant
Labile II
Labile I
*
*

Mahalia Clark
11
Figure 4. Nitrogen contents of each chemical fraction for a) DE b) MA and c) PA soils. Treatment differences were significant (p<0.05) in Fraction 3 for DE and PA soils though not for MA soil. Treatment differences were not significant in Fraction 1 or 2 for any of the soil types except for in Fraction 2 for PA soil.
0.0
0.1
0.2
0.3
0.4
0.5
0.6
0.7
DE Control DE Biochar
mg
N p
er
g d
ry s
oil
Treatment
a) Nitrogen by Chemical Fraction for DE
Recalcitrant
Labile II
Labile I
*
*
0.0
0.1
0.2
0.3
0.4
0.5
0.6
0.7
0.8
0.9
MA Control MA Biochar
mg
N p
er
g d
ry s
oil
Treatment
b) Nitrogen by Chemical Fraction for MA
Recalcitrant
Labile II
Labile I
0.0
0.2
0.4
0.6
0.8
1.0
PA Control PA Biochar
mg
N p
er
g d
ry s
oil
Treatment
c) Nitrogen by Chemical Fraction for PA
Recalcitrant
Labile II
Labile I
*
*
* *
Mahalia Clark
12
Figure 5. a) Carbon and b) nitrogen contents in each chemical fraction for control and biochar treatments in all three soil types. Treatment differences for total C mass were significant in DE and MA soils, though not for PA soils. Treatment differences were not significant for total N mass in any soil type.
0
5
10
15
20
25
30
35
40
DEControl
DEBiochar
MAControl
MABiochar
PAControl
PABiochar
mg
C p
er
g d
ry s
oil
Treatment
a) Total Carbon by Chemical Fraction
Labile I
Labile II
Recalcitrant
*
*
*
*
0.0
0.2
0.4
0.6
0.8
1.0
1.2
1.4
1.6
DEControl
DEBiochar
MAControl
MABiochar
PAControl
PABiochar
mg
N p
er
g d
ry s
oil
b) Total Nitrogen by Chemical Fraction
Labile I
Labile II
Recalcitrant
Mahalia Clark
13
Figure 6. Carbon contents of each physical fraction for a) DE b) MA and c) PA soils. Treatment differences were non-significant (p>0.05) for each fraction for all three soil types.
0
1
2
3
4
5
6
7
8
DE Control DE Biochar
mg
C p
er
g d
ry s
oil
Treatment
a) Carbon by Physical Fraction for DE
<53 m
53-250 m
250 m-2mm
>2 mm
0
5
10
15
20
25
30
35
40
MA Control MA Biochar
mg
C p
er
g d
ry s
oil
Treatment
b) Carbon by Physical Fraction for MA
<53 m
53-250 m
250 m-2mm
>2 mm
0
2
4
6
8
10
12
PA Control PA Biochar
mg
C p
er
g d
ry s
oil
Treatment
c) Carbon by Physical Fraction for PA
<53 m
53-250 m
250 m-2mm
>2 mm

Mahalia Clark
14
Figure 7. Nitrogen contents of each physical fraction for a) DE b) MA and c) PA soils. Treatment differences were non-significant (p>0.05) for each fraction for all three soil types.
0.0
0.1
0.2
0.3
0.4
0.5
0.6
0.7
0.8
DE Control DE Biochar
mg
N p
er
g d
ry s
oil
Treatment
a) Nitrogen in Physical Fractions for DE
<53 m
53-250 m
250 m-2mm
>2 mm
0.0
0.5
1.0
1.5
2.0
MA Control MA Biochar
mg
N p
er
g d
ry s
oil
Treatment
b) Nitrogen in Physical Fractions for MA
<53 m
53-250 m
250 m-2mm
>2 mm
0.0
0.2
0.4
0.6
0.8
1.0
1.2
PA Control PA Biochar
mg
N p
er
g d
ry s
oil
Treatment
c) Nitrogen in Physical Fractions for PA
<53 m
53-250 m
250 m-2mm
>2 mm
Mahalia Clark
15
Figure 8. a) Carbon and b) nitrogen contents in each physical fraction for control and biochar treatments in all three soil types. None of the total treatment differences were significant except for increase in total C with biochar additions in PA soils.
05
101520253035404550
DEControl
DEBiochar
MAControl
MABiochar
PAControl
PABiochar
mg
C p
er
g d
ry s
oil
Treatment
a) Total Carbon by Physical Fraction
>2 mm
250 m-2mm
53-250 m
<53 m
*
*
0.0
0.5
1.0
1.5
2.0
2.5
3.0
DEControl
DEBiochar
MAControl
MABiochar
PAControl
PABiochar
mg
N p
er
g d
ry s
oil
Treatment
b) Total Nitrogen in Physical Fractions
>2 mm
250 m-2mm
53-250 m
<53 m