
Impacting Your Business Clean Energy Systems & Green Hydrogen Proton Power, Inc. 487 Sam Rayburn...
39
Impacting Your Business Clean Energy Systems & Green Hydrogen Proton Power, Inc. 487 Sam Rayburn Parkway Lenoir City, TN 37771 Tel: (865) 376-9002 Fax: (865) 376-1802 info@ protonpowerinc.com www.protonpowerinc.com Confidential Property of Proton Power, Inc.
-
Upload
jeffery-morrison -
Category
Documents
-
view
222 -
download
0
Transcript of Impacting Your Business Clean Energy Systems & Green Hydrogen Proton Power, Inc. 487 Sam Rayburn...
Impacting Your BusinessClean Energy Systems & Green Hydrogen
Proton Power, Inc.487 Sam Rayburn ParkwayLenoir City, TN 37771
Tel: (865) 376-9002Fax: (865) 376-1802
Confidential Property of Proton Power, Inc.

2
Cellulose To Hydrogen Power (CHyP)
Electricity
Liquid Fuels
Water
Heat
Biochar
We Take This…
…And Make This…
In A Way That IsCarbon Negative
EnergyCrops
MSW
WoodyWaste

3
The Proton Power Difference…
InexpensiveHydrogen
FromProton Power
4
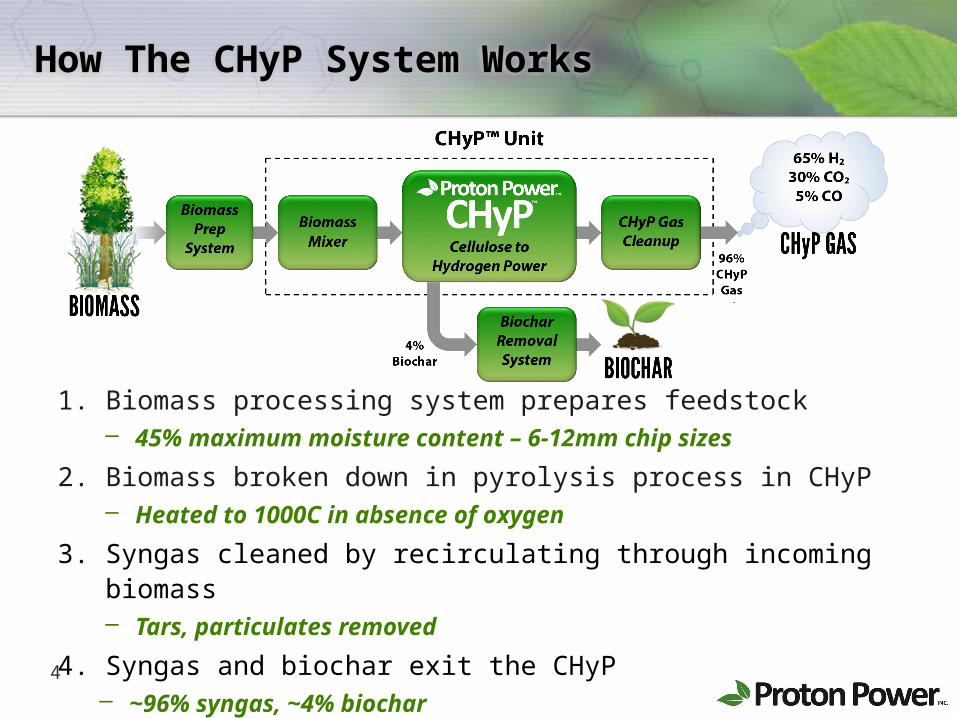
How The CHyP System Works
1. Biomass processing system prepares feedstock– 45% maximum moisture content – 6-12mm chip sizes
2. Biomass broken down in pyrolysis process in CHyP– Heated to 1000C in absence of oxygen
3. Syngas cleaned by recirculating through incoming biomass– Tars, particulates removed
4. Syngas and biochar exit the CHyP– ~96% syngas, ~4% biochar
5
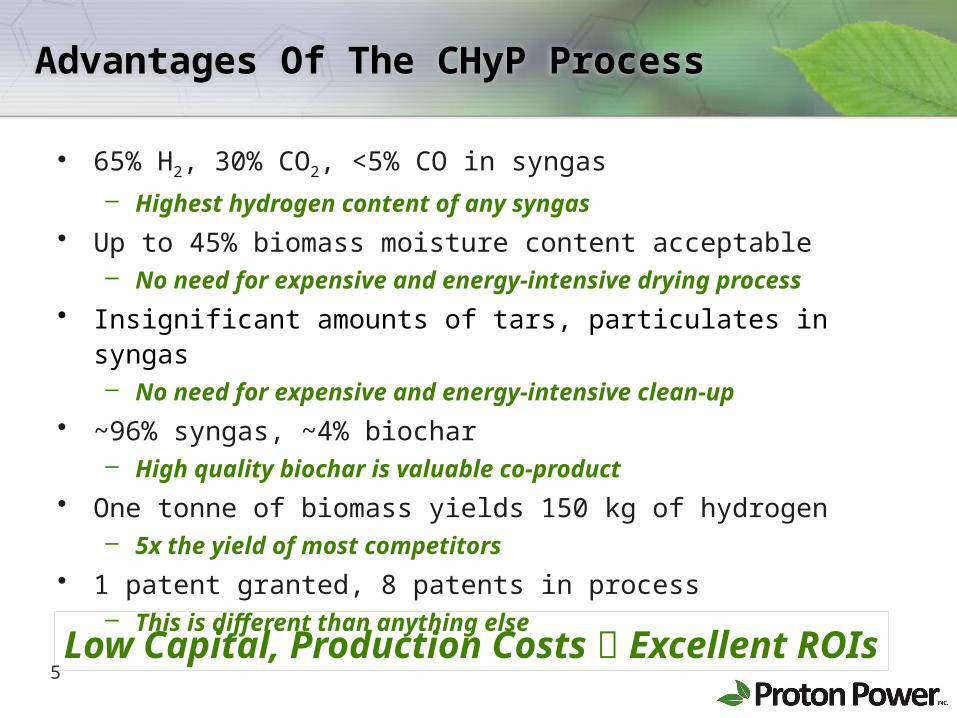
Advantages Of The CHyP Process
• 65% H2, 30% CO2, <5% CO in syngas
– Highest hydrogen content of any syngas
• Up to 45% biomass moisture content acceptable– No need for expensive and energy-intensive drying process
• Insignificant amounts of tars, particulates in syngas– No need for expensive and energy-intensive clean-up
• ~96% syngas, ~4% biochar– High quality biochar is valuable co-product
• One tonne of biomass yields 150 kg of hydrogen– 5x the yield of most competitors
• 1 patent granted, 8 patents in process– This is different than anything else
Low Capital, Production Costs Excellent ROIs

6
Additional Benefits Of CHyP
• Cellulosic fuel is renewable and sustainable• Process is carbon neutral or negative • Continuous operation• CHyP system can provide energy all ways
energy used: heat, electricity, and liquid fuel• Small footprint allows remote locations• Hydrogen on-demand – no need for storage• Systems are scalable upward from 250 kwe
A Renewable Energy System That Makes Sense

7
ELECTRICITY PROJECTFINANCIALS

8
Electricity
• 1200 kwh per tonne of biomass (measured bone dry)• Combustion product is mostly water• CHyP syngas output can be varied for genset operation
– 40% H2 / 40% CO / 10% CH4
– Energy content up to 400 Btu/scfm – lowers genset derate
• Systems scalable upward from 250 kw

9
5MWe Proton Power System

10
Project ScopeIncluded• CHyPs• Natural Gas Gensets• Two-Stage Biomass Reduction• 3 Day Biomass Storage• Biochar Collection & Removal System• Controls• Biomass, Biochar Conveyors &
Hoppers• Nitrogen Generation System• Pneumatic Compressor System• Buildings For CHyP Units, Gensets• Valves, Diverters, Etc. Included• Utility Interconnection Equipment• Installation• Startup and Commissioning• System Operation Training
Not Included• Site Preparation• Tractors, Loaders, Forklifts, etc.• Fees and expenses associated with
the application and/or qualification process for permits, approvals, and/or licenses
• Sales taxes, import taxes, tariffs, duties
• Financing costs
11
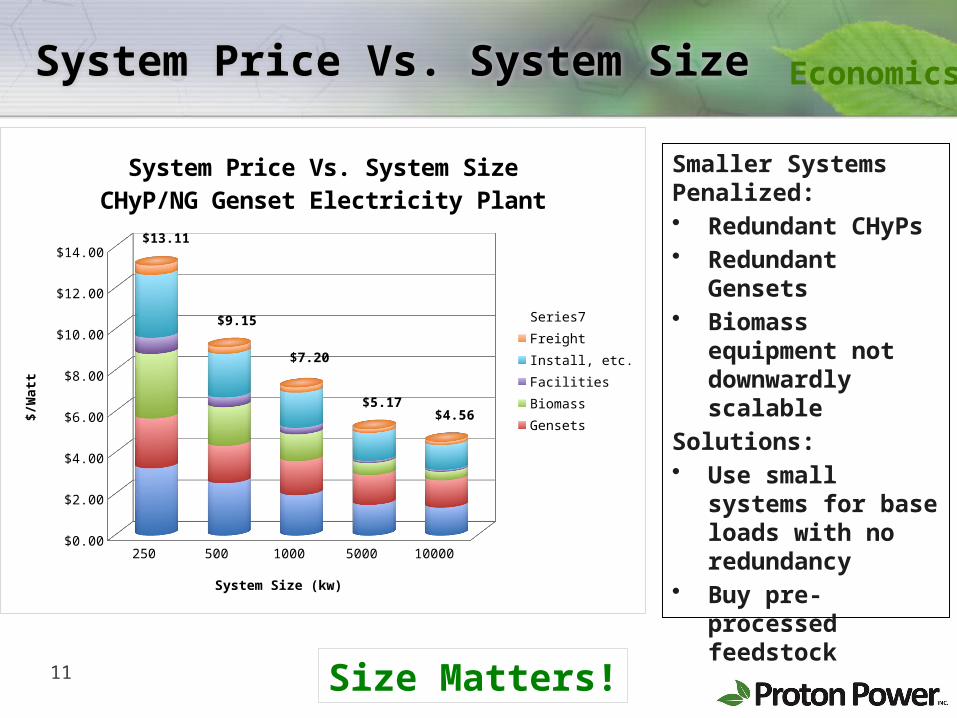
System Price Vs. System Size
Smaller Systems Penalized:• Redundant CHyPs• Redundant Gensets• Biomass equipment
not downwardly scalable
Solutions:• Use small systems
for base loads with no redundancy
• Buy pre-processed feedstock
Size Matters!
Economics
250 500 1000 5000 10000$0.00
$2.00
$4.00
$6.00
$8.00
$10.00
$12.00
$14.00$13.11
$9.15
$7.20
$5.17$4.56
System Price Vs. System SizeCHyP/NG Genset Electricity Plant
Series7
Freight
Install, etc.
Facilities
Biomass
Gensets
System Size (kw)
$/W
att
12
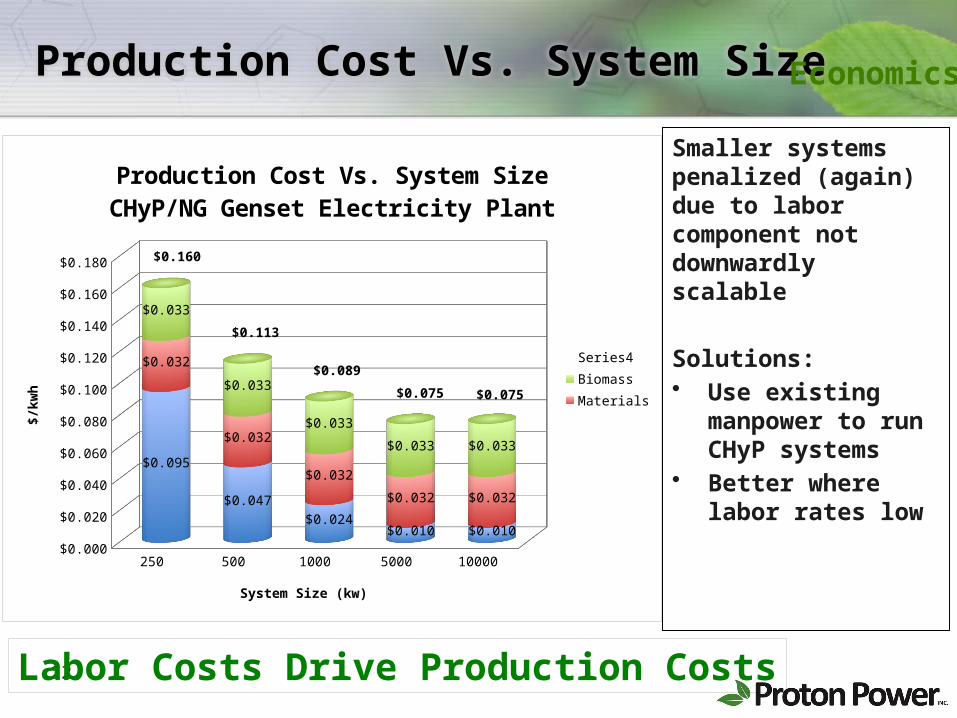
Production Cost Vs. System Size
Smaller systems penalized (again) due to labor component not downwardly scalable
Solutions:• Use existing
manpower to run CHyP systems
• Better where labor rates low
Labor Costs Drive Production Costs
Economics
250 500 1000 5000 10000$0.000
$0.020
$0.040
$0.060
$0.080
$0.100
$0.120
$0.140
$0.160
$0.180
$0.095
$0.047
$0.024$0.010 $0.010
$0.032
$0.032
$0.032
$0.032 $0.032
$0.033
$0.033
$0.033
$0.033 $0.033
$0.160
$0.113
$0.089
$0.075 $0.075
Production Cost Vs. System SizeCHyP/NG Genset Electricity Plant
Series4
Biomass
Materials
System Size (kw)
$/kw
h

13
ROI Vs. Biomass Cost
As expected, biomass cost is major determinant of financial performance
Solutions:• Locate close to
biomass source• Lock in long term
agreements• Best when biomass
is a byproduct of a manufacturing process and has a disposal cost
Biomass Cost Has Significant Impact
Economics
0 22 44 66 880.0%
5.0%
10.0%
15.0%
20.0%
25.0%
ROI Vs. Biomass Cost5 MW System, $0.15/kwh Electricity Cost
Biomass Cost ($/Ton)
RO
I

14
ROI Vs. Electricity Rate
As expected, electricity rate is major determinant of financial performance
Solutions:• Base load to offset
retail rate without tying to grid
• Locations with high electricity rates more attractive
• Locations with high incentives more attractive
Electricity Rate Has Significant Impact
Economics
$0.050 $0.100 $0.150 $0.200 $0.2500.0%
5.0%
10.0%
15.0%
20.0%
25.0%
30.0%
35.0%
ROI Vs. Electricity Rate5 MW System, $44/Ton Biomass Cost
Electricity Rate ($/kwh)
RO
I
15
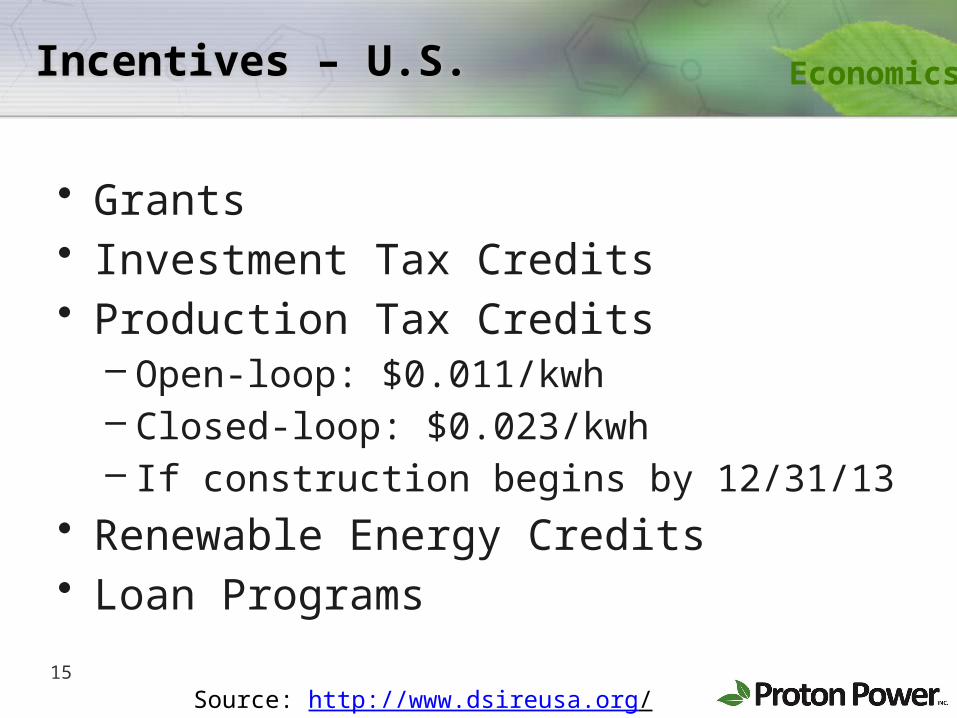
Incentives – U.S.
• Grants• Investment Tax Credits• Production Tax Credits
– Open-loop: $0.011/kwh– Closed-loop: $0.023/kwh– If construction begins by 12/31/13
• Renewable Energy Credits• Loan Programs
Economics
Source: http://www.dsireusa.org/

16
ROI Vs. Biomass Cost (w Incentives)
Production Tax Credit Doesn’t Help Much
Economics
Note: Production tax credit of $0.023/kwh assumed
0 22 44 66 880.0%
5.0%
10.0%
15.0%
20.0%
25.0%
30.0%
35.0%
40.0%
45.0%
50.0%
ROI Vs. Biomass Cost4.8 Mgal/yr System, $0.10/kwh Electricity Cost
Biomass Cost ($/ton)
IRR

17
ROI Vs. Electricity Cost (w Incentives)Economics
Note: Production tax credit of $0.023/kwh assumed
$0.050 $0.100 $0.150 $0.200 $0.2500.0%
5.0%
10.0%
15.0%
20.0%
25.0%
30.0%
35.0%
40.0%
ROI Vs. Electricity Rate5 MW System, $44/Ton Biomass Cost
IRR IRR w/ Incent
Electricity Rate ($/kwh)
RO
I
Production Tax Credit Doesn’t Help Much
18
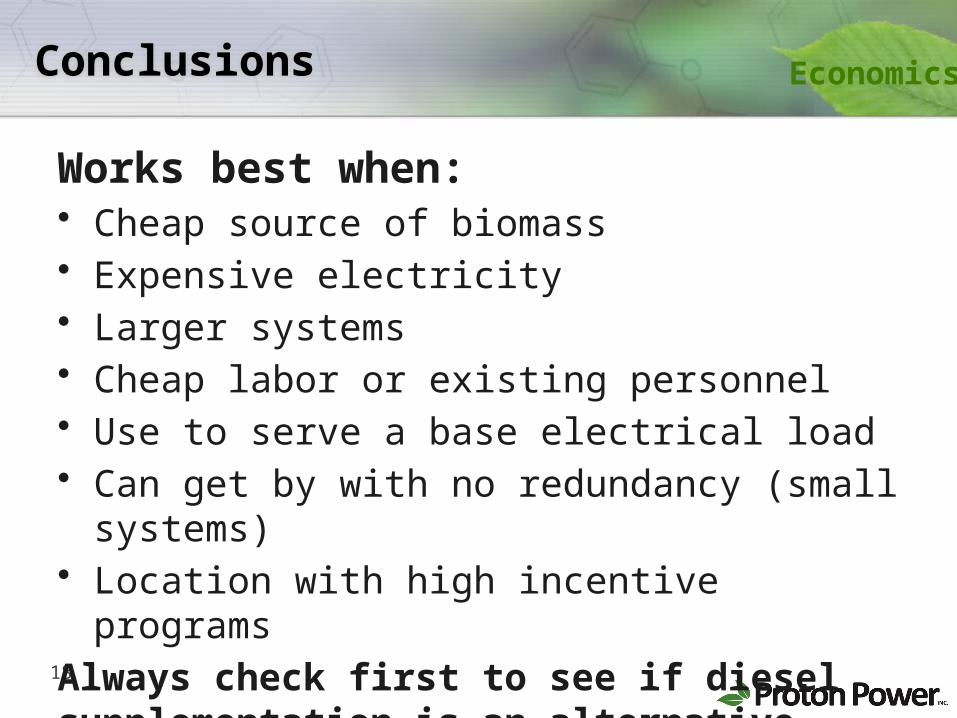
Conclusions
Works best when:• Cheap source of biomass• Expensive electricity• Larger systems• Cheap labor or existing personnel• Use to serve a base electrical load• Can get by with no redundancy (small systems)• Location with high incentive programs
Always check first to see if diesel supplementation is an alternative
Economics

19
APPLICATIONS:DIESEL SUPPLEMENTATION

20
Diesel Supplementation
• 60% reduction in diesel consumption– Reduced diesel exhaust pollutants, too
• Best financial return– Paybacks < 3 years
• No new gensets required• No redundant gensets required
21
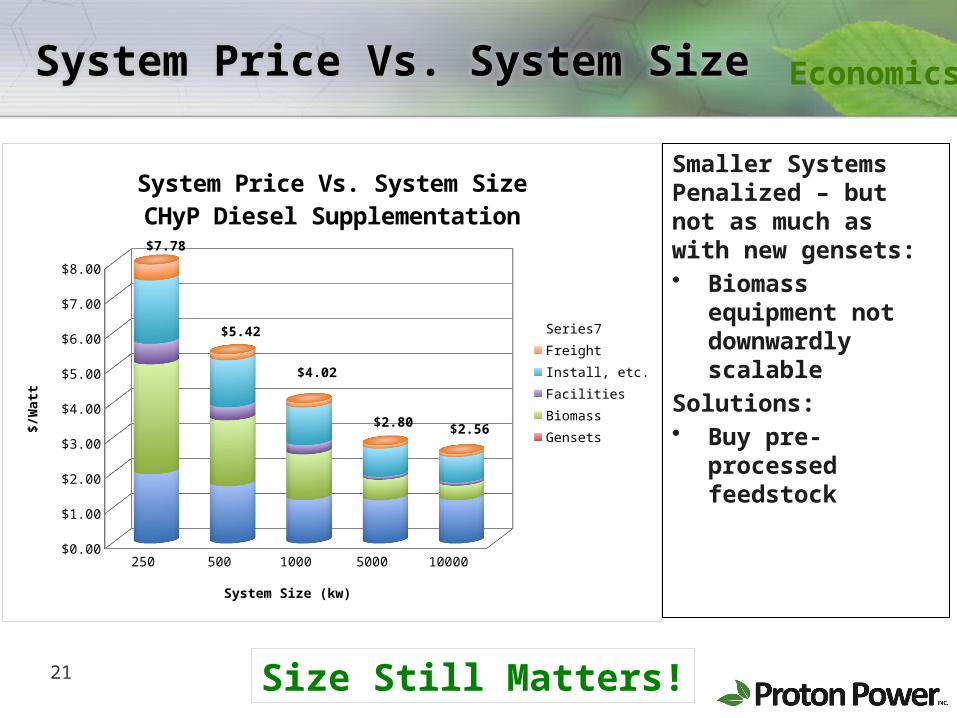
System Price Vs. System Size
Smaller Systems Penalized – but not as much as with new gensets:• Biomass equipment
not downwardly scalable
Solutions:• Buy pre-processed
feedstock
Size Still Matters!
Economics
250 500 1000 5000 10000$0.00
$1.00
$2.00
$3.00
$4.00
$5.00
$6.00
$7.00
$8.00
$7.78
$5.42
$4.02
$2.80$2.56
System Price Vs. System SizeCHyP Diesel Supplementation
Series7
Freight
Install, etc.
Facilities
Biomass
Gensets
System Size (kw)
$/W
att
22
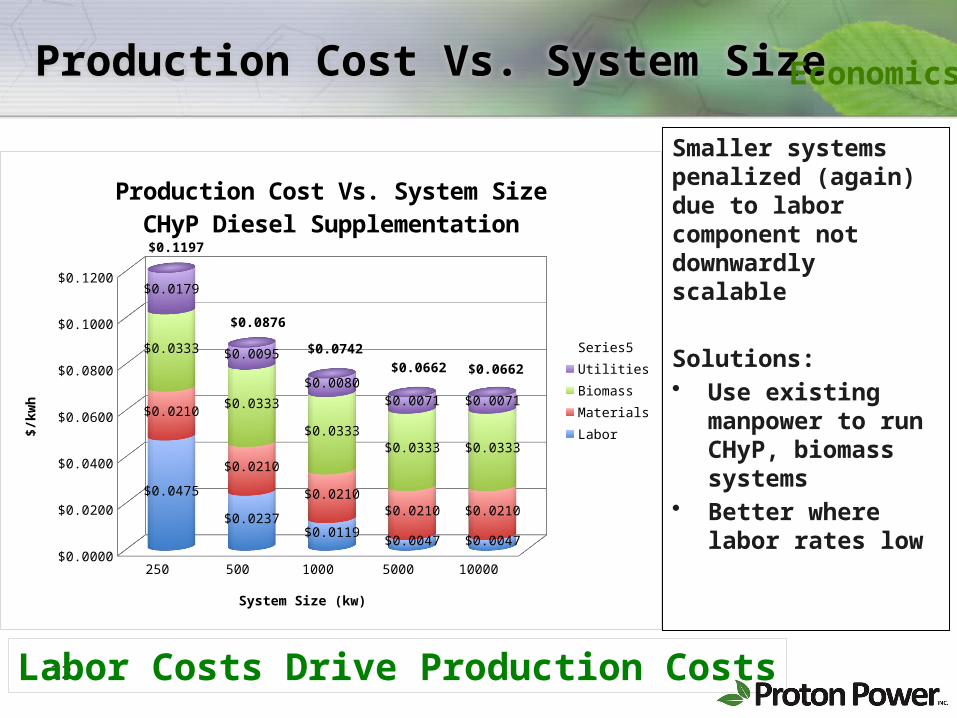
Production Cost Vs. System Size
Smaller systems penalized (again) due to labor component not downwardly scalable
Solutions:• Use existing
manpower to run CHyP, biomass systems
• Better where labor rates low
Labor Costs Drive Production Costs
Economics
250 500 1000 5000 10000$0.0000
$0.0200
$0.0400
$0.0600
$0.0800
$0.1000
$0.1200
$0.0475
$0.0237$0.0119
$0.0047 $0.0047
$0.0210
$0.0210
$0.0210$0.0210 $0.0210
$0.0333
$0.0333
$0.0333$0.0333 $0.0333
$0.0179
$0.0095
$0.0080
$0.0071 $0.0071
$0.1197
$0.0876
$0.0742
$0.0662 $0.0662
Production Cost Vs. System SizeCHyP Diesel Supplementation
Series5
Utilities
Biomass
Materials
Labor
System Size (kw)
$/kw
h
23
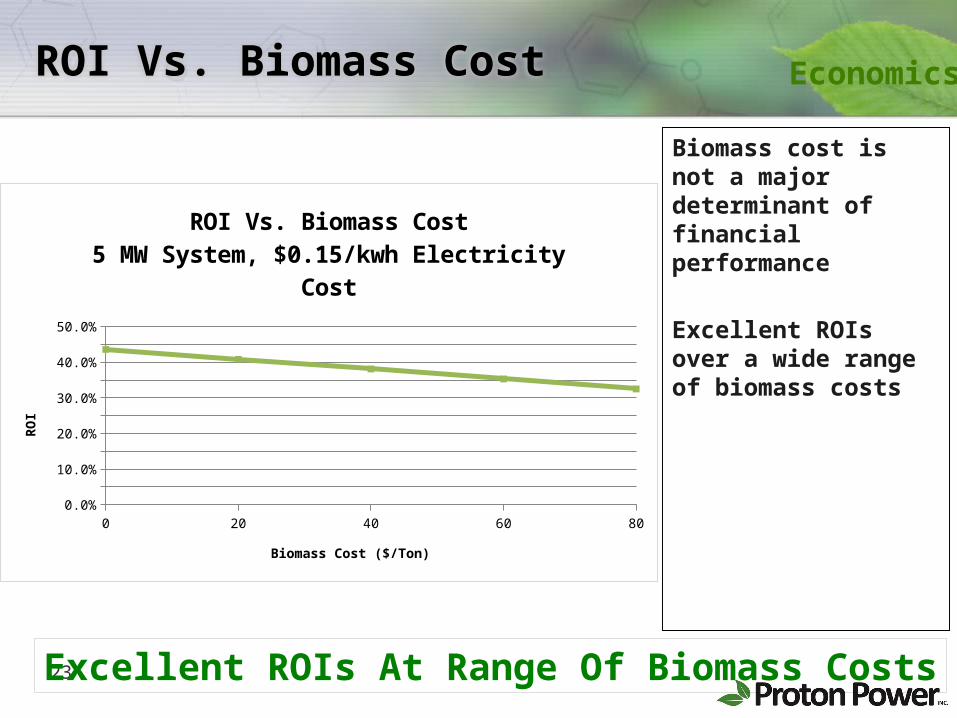
ROI Vs. Biomass Cost
Biomass cost is not a major determinant of financial performance
Excellent ROIs over a wide range of biomass costs
Excellent ROIs At Range Of Biomass Costs
Economics
0 20 40 60 800.0%
5.0%
10.0%
15.0%
20.0%
25.0%
30.0%
35.0%
40.0%
45.0%
50.0%
ROI Vs. Biomass Cost5 MW System, $0.15/kwh Electricity Cost
Biomass Cost ($/Ton)
RO
I

24
ROI Vs. Diesel Cost
Diesel cost has moderate impact on financial performance
But, financial performace good – even at low rates
Diesel Cost Has Impact, But ROIs Good
Economics
$2.85 $3.35 $3.85 $4.350.0%
5.0%
10.0%
15.0%
20.0%
25.0%
30.0%
35.0%
40.0%
45.0%
50.0%
ROI Vs. Diesel Cost5 MW System, $44/Ton Biomass Cost
Diesel Cost ($/gal)
RO
I

25
APPLICATIONS:SYNTHETIC FUELS
26
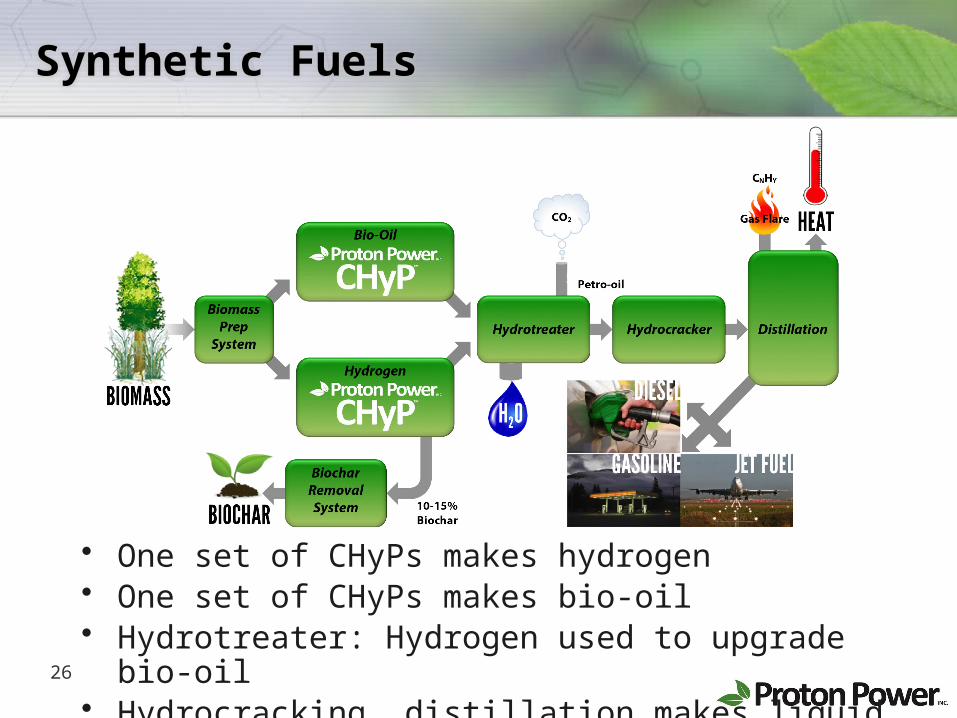
Synthetic Fuels
• One set of CHyPs makes hydrogen• One set of CHyPs makes bio-oil• Hydrotreater: Hydrogen used to upgrade bio-oil• Hydrocracking, distillation makes liquid fuels

27
4.8M Gal/Yr Synthetic Fuels Facility
Biomass Storage Biomass Transfer
Green DieselStorage & Loading
CHyP SyngasProduction
Biochar Storage & Loading
Synthetic FuelsProduction
28
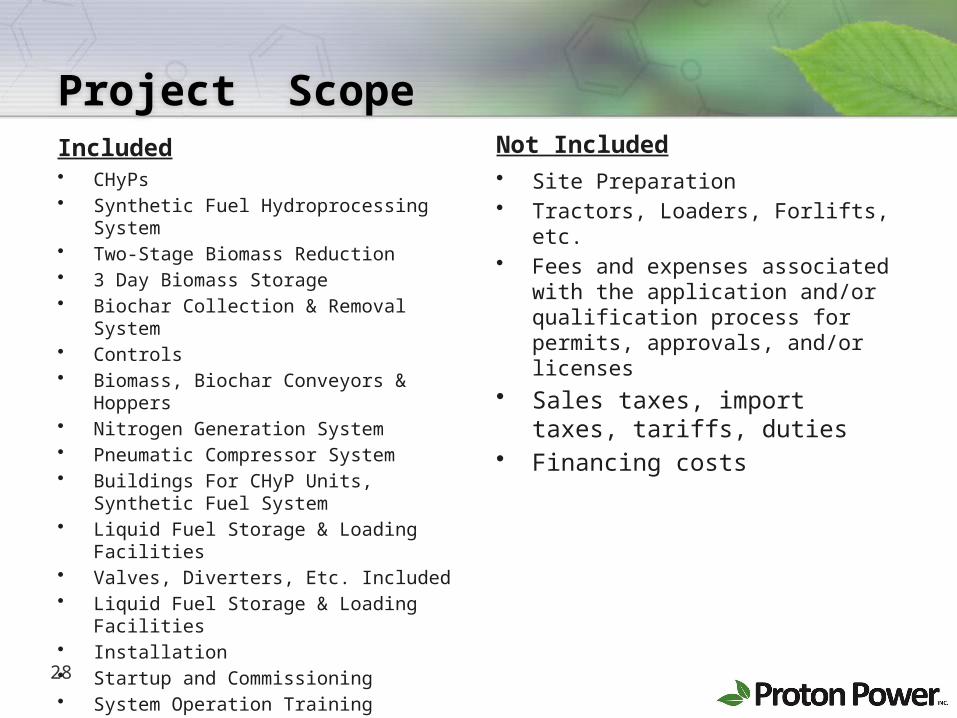
Project ScopeIncluded• CHyPs• Synthetic Fuel Hydroprocessing System• Two-Stage Biomass Reduction• 3 Day Biomass Storage• Biochar Collection & Removal System• Controls• Biomass, Biochar Conveyors & Hoppers• Nitrogen Generation System• Pneumatic Compressor System• Buildings For CHyP Units, Synthetic Fuel
System• Liquid Fuel Storage & Loading Facilities• Valves, Diverters, Etc. Included• Liquid Fuel Storage & Loading Facilities• Installation• Startup and Commissioning• System Operation Training
Not Included• Site Preparation• Tractors, Loaders, Forlifts, etc.• Fees and expenses associated with
the application and/or qualification process for permits, approvals, and/or licenses
• Sales taxes, import taxes, tariffs, duties
• Financing costs

29
System Price Vs. System Size
Smaller Systems Penalized:• Hydroprocessing
equipment not very downwardly scalable
Solutions:• Paybacks, ROIs will
still likely be good
Size Matters!
Economics
0.964 1.928 2.893 3.857 4.821$0.00
$2.00
$4.00
$6.00
$8.00
$10.00
$12.00
$14.00$11.59
$8.67
$7.08$6.97 $6.79
System Price Vs. System SizeCHyP Liquid Fuels Plant
System Size (Mgal Per Yr)
$/G
al

30
Production Cost Vs. System Size
Smaller systems penalized (again) due to labor component not downwardly scalable
Solutions:• Financial hurdle
rates, budget drive the decision
Labor Costs Drive Production Costs
Economics
0.964 1.928 2.893 3.857 4.821$0.00
$0.50
$1.00
$1.50
$2.00
$2.50
$3.00
$2.016
$1.170$0.912 $0.813 $0.754
$0.343
$0.343
$0.343$0.343 $0.343
$0.379
$0.379
$0.379$0.379 $0.379
$0.240
$0.240
$0.240$0.240 $0.240
$0.000
$0.000
$0.000$0.000 $0.000
$2.977
$2.131
$1.874$1.775 $1.716
Production Cost Vs. System SizeCHyP Liquid Fuels Plant
Series6
Water
Electricity
Biomass
Materials
System Size (Mgal Per Yr)
$/G
al
31
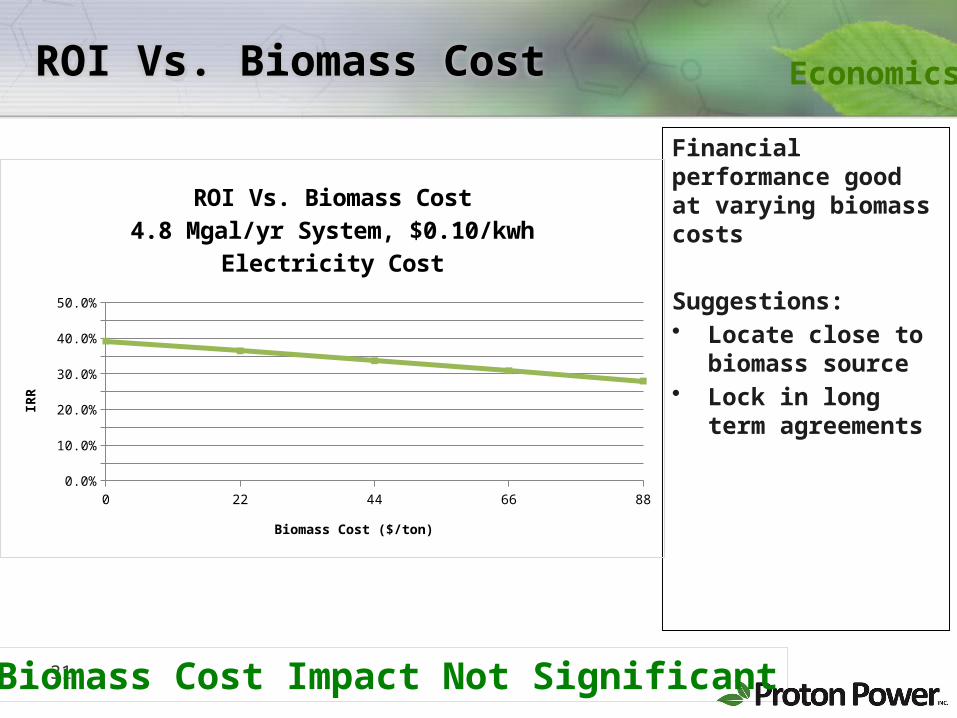
ROI Vs. Biomass Cost
Financial performance good at varying biomass costs
Suggestions:• Locate close to
biomass source• Lock in long term
agreements
Biomass Cost Impact Not Significant
Economics
0 22 44 66 880.0%
5.0%
10.0%
15.0%
20.0%
25.0%
30.0%
35.0%
40.0%
45.0%
50.0%
ROI Vs. Biomass Cost4.8 Mgal/yr System, $0.10/kwh Electricity Cost
Biomass Cost ($/ton)
IRR

32
ROI Vs. Diesel Fuel Rate
Financial performance good at varying diesel costs
Suggestions:• Know whether your
income will be based on retail rate or wholesale rate – impacts the size of system that you select
Diesel Fuel Rate Impact Not Significant
Economics
2.85 3.35 3.85 4.350.0%
5.0%
10.0%
15.0%
20.0%
25.0%
30.0%
35.0%
40.0%
45.0%
ROI Vs. Diesel Fuel Rate4.8 Mgal/yr System, $44/ton Biomass Cost
Diesel Rate ($/Gal)
IRR

33
Incentives – U.S.
• RIN (Renewable Identification Number)– Based on renewable content of process– CHyP: 1.7 RINs per gallon– RIN value ~ $0.75/RIN (Mar 2013)
• http://www.progressivefuelslimited.com/Web_Data/pfldaily.pdf
• http://www.aeltracker.org/
– CHyP RIN value = $1.275/gal
• USDA grants and loans• Renewable fuel tax credits
– 30% tax credit over 10 years
• Additional incentives vary state-to-state
Economics
34
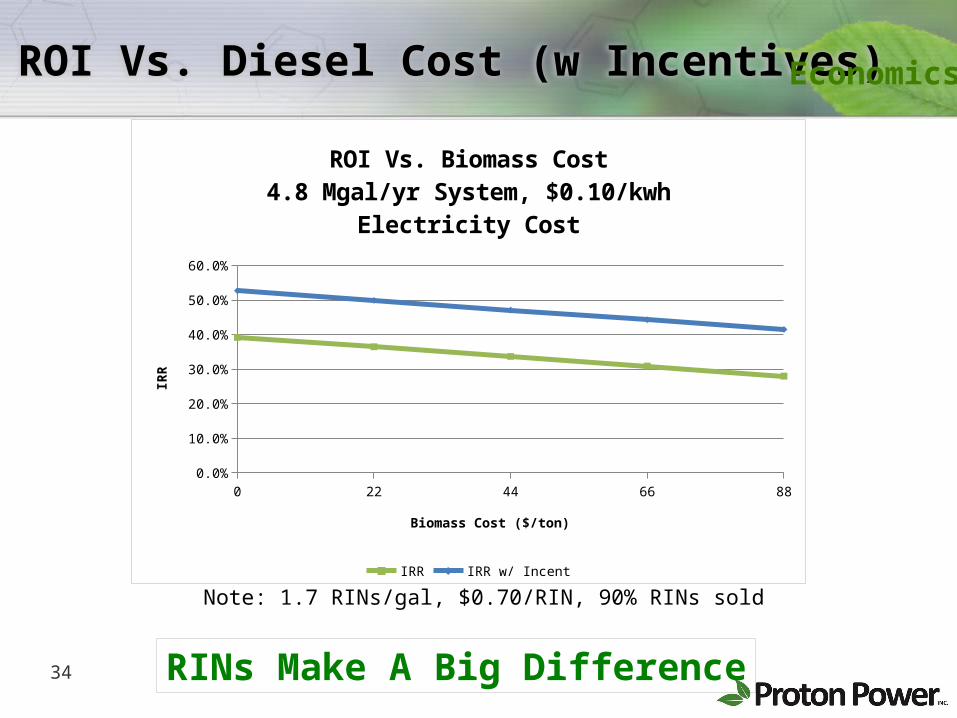
ROI Vs. Diesel Cost (w Incentives)
RINs Make A Big Difference
Economics
Note: 1.7 RINs/gal, $0.70/RIN, 90% RINs sold
0 22 44 66 880.0%
10.0%
20.0%
30.0%
40.0%
50.0%
60.0%
ROI Vs. Biomass Cost4.8 Mgal/yr System, $0.10/kwh Electricity Cost
IRR IRR w/ Incent
Biomass Cost ($/ton)
IRR
35
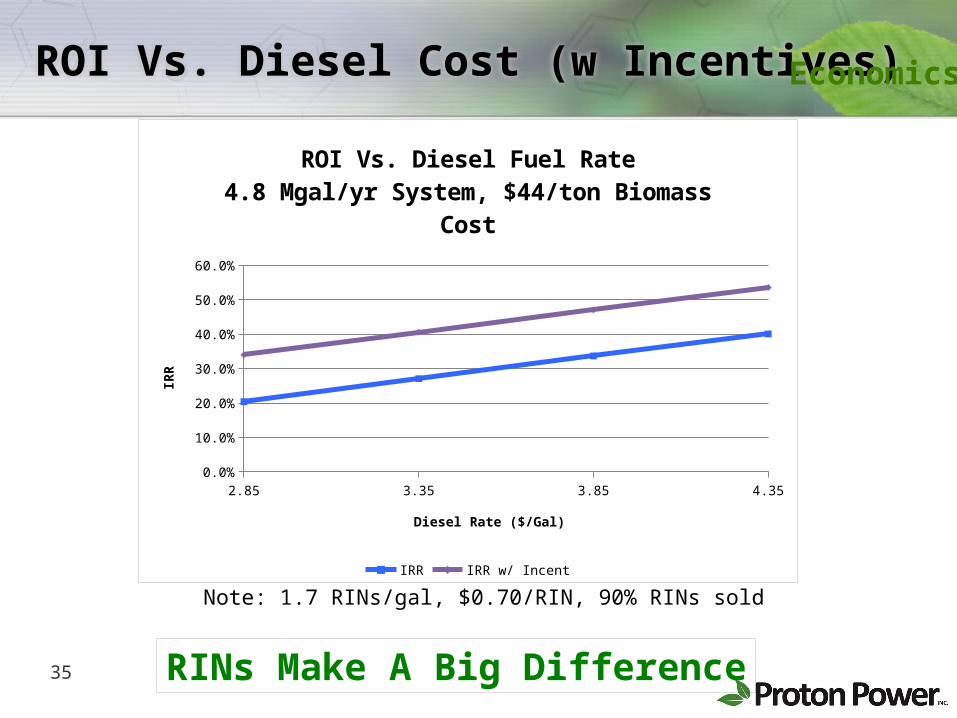
ROI Vs. Diesel Cost (w Incentives)Economics
Note: 1.7 RINs/gal, $0.70/RIN, 90% RINs sold
RINs Make A Big Difference
2.85 3.35 3.85 4.350.0%
10.0%
20.0%
30.0%
40.0%
50.0%
60.0%
ROI Vs. Diesel Fuel Rate4.8 Mgal/yr System, $44/ton Biomass Cost
IRR IRR w/ Incent
Diesel Rate ($/Gal)
IRR
36
Conclusions For SynFuels Plant
Works best when:• Larger systems• Income based upon retail price of liquid fuels
Economics
37
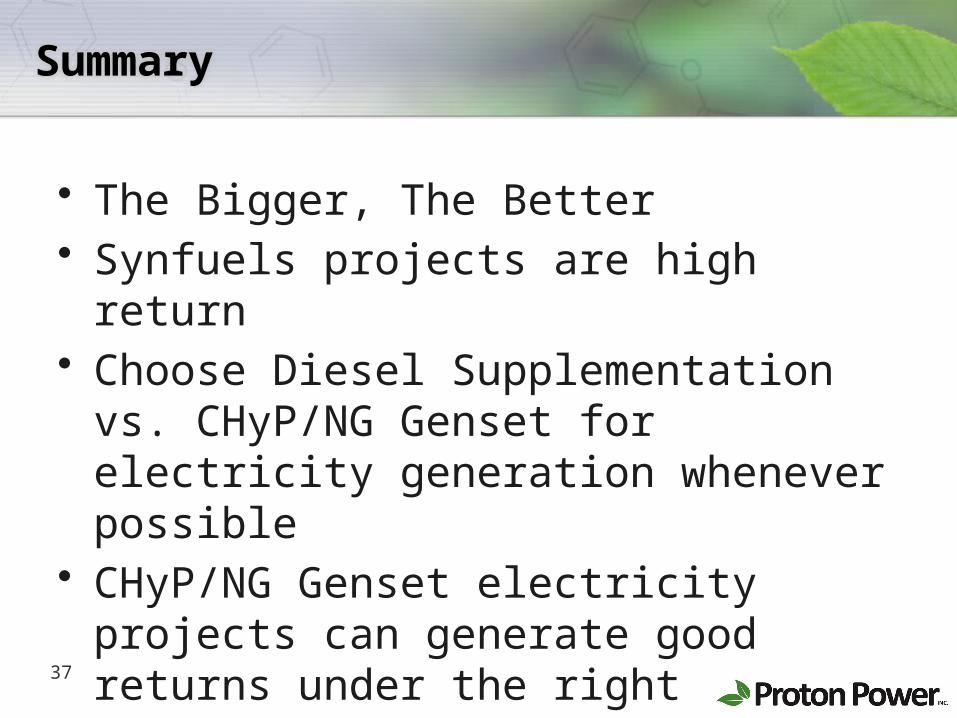
Summary
• The Bigger, The Better• Synfuels projects are high return• Choose Diesel Supplementation vs.
CHyP/NG Genset for electricity generation whenever possible
• CHyP/NG Genset electricity projects can generate good returns under the right circumstances
38
QUESTIONS/DISCUSSION
Biomass to Hydrogen PowerClean Energy Systems & Green Hydrogen
Proton Power, Inc.487 Sam Rayburn ParkwayLenoir City, TN 37771
Tel: (865) 376-9002Fax: (865) 376-1802
Thanks For Your Time And Interest