Impact Studies, East Africa - Farmers' Maize Seed Systems...
42
1 Farmers' Maize Seed Systems In Western Oromia, Ethiopia Abdisa Gemeda Girma Aboma Hugo Verkuijl Wilfred Mwangi June 2001 Ethiopian Agricultural Research Organization (EARO)
Transcript of Impact Studies, East Africa - Farmers' Maize Seed Systems...

1
Farmers' Maize SeedSystems In Western Oromia,Ethiopia
Abdisa Gemeda
Girma Aboma
Hugo Verkuijl
Wilfred Mwangi
June 2001
Ethiopian AgriculturalResearch Organization
(EARO)

Farmers’ Maize SeedSystems in Western Oromia,Ethiopia
Abdissa Gemeda
Girma Aboma
Hugo Verkuijl
Wilfred Mwangi *
* Abdissa Gemeda and Girma Aboma are agricultural economists at the Bako Research Center, Ethiopia. At the time this paper was drafted, Hugo Verkuijl was anassociate scientist at the International Maize and Wheat Improvement Center (CIMMYT), Addis Ababa, Ethiopia. Wilfred Mwangi is a principal economist withCIMMYT on secondment to the Government of Kenya. The views expressed in this paper are the authors’ and do not necessarily reflect policies of their respectiveinstitutions.

CIMMYT® (www.cimmyt.cgiar.org) is an internationally funded, nonprofit, scientific research and training organization. Headquartered in Mexico,CIMMYT works with agricultural research institutions worldwide to improve the productivity, profitability, and sustainability of maize and wheat systemsfor poor farmers in developing countries. It is one of 16 food and environmental organizations known as the Future Harvest Centers. Located around theworld, the centers conduct research in partnership with farmers, scientists, and policymakers to help alleviate poverty and increase food security whileprotecting natural resources. They are principally supported by the nearly 60 countries, private foundations, and regional and internationalorganizations that make up the Consultative Group on International Agricultural Research (CGIAR) (www.cgiar.org). Financial support for CIMMYT’sresearch agenda also comes from many other sources, including foundations, development banks, and public and private agencies. Future Harvest, anot-for-profit organization, catalyzes action for a world with less poverty, a healthier global population, well-nourished children, and a betterenvironment. It supports research, promotes partnerships, and sponsors projects that bring the results of research to farmers in Africa, Asia, and LatinAmerica (see www.futureharvest.org).
International Maize and Wheat Improvement Center (CIMMYT) 2001. All rights reserved. Theopinions expressed in this publication are the sole responsibility of the authors. The designations
employed in the presentation of materials in this publication do not imply the expressions of any opinion whatsoever on the part of CIMMYT or itscontributory organizations concerning the legal status of any country, territory, city, or area, or of its authorities, or concerning the delimitation of itsfrontiers or boundaries. CIMMYT encourages fair use of this material. Proper citation is requested.
Printed in Mexico.
Correct citation: Abdissa Gemeda, Girma Aboma, H. Verkuijl, and W. Mwangi. 2001. Farmers’ Maize Seed Systems in Western Oromia, Ethiopia.Mexico, D.F.: International Maize and Wheat Improvement Center (CIMMYT) and Ethiopian Agricultural Research Organization (EARO).
Abstract: This study was initiated in western Shewa and eastern Wellega zones of Oromia Regional State to describe the seed system and assess theeffectiveness of the seed testing and release mechanism; identify how farmers acquire and transfer maize seed; explore problems related to farmers’seed acquisition and transfer mechanisms; and document the use of released maize varieties and hybrids. The major maize growing areas of westernOromia were purposively classified into four strata: Bako-Tibe and Chaliya Woredas in western Shewa, and Bila-Sayo and Sibu-Sire Woredas in easternWellega. Five peasant associations (PAs) were selected from each stratum. From each PA, 11 farmers were randomly selected and interviewed using astructured questionnaire. The total sample size was 220 farmers. Descriptive statistics and tobit analysis were used to assess farmers’ adoption ofimproved maize seed and their seed management practices and strategies. Total area under improved maize increased in the study area from 1992 to1996 and total area under local varieties decreased. Since 1995, total production of improved maize has surpassed the total production of localvarieties. During the 1996 cropping season, most farmers planted seed that had been saved from their previous harvest. The Ministry of Agriculture wasthe next most common seed source. In all woredas, BH-660 was the preferred maize cultivar for its high yield, seed size, and early maturity. The mainproblems constraining the use of improved maize seed were its high price, unavailability, and sometimes the distance traveled to acquire improved seed.All farmers in Bako-Tibe and Sibu-Sire and about 83% of farmers in Bako-Tibe and Bila-Sayo replaced their hybrids every year. The average time sincefarmers had purchased hybrid seed was 1.4 years in Chaliya, 2.3 in Bako-Tibe, 2.1 in Bila-Sayo, and 2 in Sibu-Sire. Most farmers selected seed duringharvesting using good looking grain/cobs as the most important selection criterion. Seed quality was good, according to most farmers, and was mostlyjudged on the basis of grain filling and germination rate. Farmer education, extension services, off-farm income, and livestock units all significantly andpositively influenced the area of land allocated to improved maize. A farmer’s proximity to a formal seed source had a positive impact on the allocationof land to improved maize. Next to the extension system, farmer-to-farmer seed exchange remained the most important mechanism for disseminatingimproved maize technology. The government can strengthen this informal system through the provision of low-interest finance, technical assistance, andpublicly bred parent material. The extension system should advise farmers on the characteristics and correct adaptation zones of newly released maizecultivars. Maize breeding programs need to give proportionate weights to yield and non-yield characteristics when selecting the best varieties.
ISBN: 970-648-075-7AGROVOC descriptors: Maize; Zea mays; Seed; Seed production; Seed industry; Production policies; Production factors; Technology transfer;
Economic environment; Production economics; High yielding varieties; Farmers; Varieties; Sampling; Technical aid; Surveys;Hybrids; Ethiopia
Additional keywords: CIMMYTAGRIS category codes: E14 Development Economics and Policies
F03 Seed ProductionDewey decimal classification: 338.1663

Contents
iv Tables
iv Figures
v Acronyms and Abbreviations
vi Acknowledgments
vii Executive Summary
1 1.0 Introduction
1 1.1 The Potential of Improved Seed and the Importance of the Seed Industry2 1.2 The Local Seed Industry3 1.3 Objectives of the Study3 1.4 The Study Area
5 2.0 Methodology
5 2.1 Sampling Method5 2.2 Analytical Model
8 3.0 Seed Supply
8 3.1 Seed Industry Structure13 3.2 Mechanisms of Maize Seed Development and Supply16 3.3 Policies and Institutions
18 4.0 Demographic and Socioeconomic Characteristics
20 5.0 Maize Cultivars Grown and Farmers’ Seed Sources
20 5.1 Cultivars Grown20 5.2 Seed Sources, Prices, and Rates23 5.3 Farmers’ Sources of Information on Improved Maize Seed
24 6.0 Maize Production Practices
24 6.1 Increased Use of Improved Maize Seed25 6.2 Fertilizer and Pesticides25 6.3 Farmers’ Access to Information for Maize Production
26 7.0 Farmers’ Management of Cultivars and Seed
26 7.1 Varietal Replacement27 7.2 Farmers’ Maize Seed Management28 7.3 Quality of Seed and Strategies for Improving Quality
29 8.0 Tobit Analysis of Land Allocation to Improved Maize
31 9.0 Conclusions and Implications
32 References
iii

iv
Tables10 Table 1. Area, yield, and production of wheat and all cereals, Ethiopia, 1988-9810 Table 1. Seed distribution (000 t) by the Ethiopian Seed Enterprise, 1980-9812 Table 2. Maize seed produced by the Ethiopian Seed Enterprise, Nekemte Branch, 1992-9613 Table 3. Farmers’ seed acquisition and exchange rate in western Oromia, Ethiopia, 199614 Table 4. Area planted to improved and local varieties of major food crops in Ethiopia, 1996/9718 Table 5. Seed imports by the Ethiopian Seed Enterprise, 1986-91
Table 6. Demographic and socioeconomic characteristics of sample farmers in western Oromia,Ethiopia, 1996
19 Table 7. Education level of sample farmers in western Oromia, Ethiopia, 199619 Table 8. Land use in western Oromia, Ethiopia, 199619 Table 9. Land tenure in western Oromia, Ethiopia, 199619 Table 10. Details of sharecropping arrangements, western Oromia, Ethiopia, 199619 Table 11. Livestock ownership by sample farmers in western Oromia, Ethiopia, 199620 Table 12. Agronomic traits of maize cultivars released in western Oromia21 Table 13. Maize cultivars grown by farmers in western Oromia, Ethiopia, 1992 and 199621 Table 14. Preferred maize cultivars in western Oromia, 199621 Table 15. Reasons for farmers’ preference for most popular maize cultivars, western Oromia,
Ethiopia, 199622 Table 16. Farmers’ sources of maize seed in western Oromia, Ethiopia, 1996/9723 Table 17. Advantages and disadvantages of acquiring seed from other farmers and the Ministry of
Agriculture, western Oromia, Ethiopia, 199623 Table 18. Distance traveled by farmers to purchase seed in western Oromia, Ethiopia, 199623 Table 19. Farmers’ sources of improved maize seed information in western Oromia, Ethiopia, 199624 Table 20. Use of local/improved maize cultivars in western Oromia, Ethiopia, 1992 and 199625 Table 21. Average production of local and improved maize in western Oromia, Ethiopia 199625 Table 22. Fertilizer use for maize production in western Oromia, Ethiopia, 199626 Table 23. Farmers’ access to information on maize production in western Oromia, Ethiopia,199627 Table 24. Replacement of improved maize seed by farmers in western Oromia, 199628 Table 25. Maize seed management by farmers in western Oromia, Ethiopia, 199628 Table 26. Characteristics of good seed, according to farmers in western Oromia, Ethiopia, 199629 Table 27. Tobit model estimates for land allocation to improved maize31 Table 28. Tobit model estimates for land allocation to improved OPVs
Figures4 Figure 1. Oromia, Ethiopia4 Figure 2. The study area, western Oromia, Ethiopia5 Figure 3. Woredas in western Oromia, Ethiopia8 Figure 4. Seed distribution and marketing channels in the study area
24 Figure 5. Total area under improved maize production by woreda in western Oromia,Ethiopia, 1992-96
24 Figure 6. Total area under local maize production by woreda in western Oromia, Ethiopia, 1992-9625 Figure 7. Total production of improved maize varieties by woreda in western Oromia,
Ethiopia, 1992-9625 Figure 8. Total production of local maize varieties by woreda in western Oromia, Ethiopia, 1992-96

v
Acronyms and Abbreviations
AAU Addis Ababa UniversityACA Awasa College of AgricultureAISCO Agricultural Inputs Supply CorporationAUA Alemaya University of AgricultureBRC Bako Research CenterBSI Breeder seed increaseCCT Christian Council of TanzaniaCIMMYT Centro Internacional de Mejoramiento de Maíz y Trigo (International
Maize and Wheat Improvement Center)CRI Crops Research InstituteCTDA Coffee and Tea Development AuthorityDAP Diammonium phosphateDZARC Debre Zeit Agricultural Research CenterEARO Ethiopian Agricultural Research OrganizationEMTP Extension Management Training PlotsESE Ethiopian Seed EnterpriseGLDB Grains and Legumes Development BoardGRCRI Genetic Resource Conservation and Research InstituteGSID Ghana Seed Inspection DivisionIAR Institute of Agricultural ResearchICU Input Coordination UnitIFAD International Fund for Agricultural Developmentmasl Meters above sea levelMOA Ministry of AgricultureNGO Non-governmental organizationNSIA National Seed Industry AgencyNVRC National Variety Release CommitteeNVT National Variety TrialOPV Open-pollinated varietyPA Peasant associationPNVT Pre-national Variety TrialPYT Preliminary Yield TrialRVT Regional Varietal TrialSC Service CooperativeTOSCA Tanzania Official Seed Certification AgencyVVT Variety Verification Trial

Acknowledgements
Many people were involved in the field survey and development of this publication. The authorsare grateful to Tesema Tesso, Kasahun Gemechu, Bekele Gemechu, and Mesfin Haile for theirsupport in conducting the survey, data coding, data book preparation, and data entry. We are alsograteful to the enumerators for effectively administering the questionnaires to farmers and to ourdrivers for their patient and careful driving on very difficult roads.
We would also like to extend our thanks to the farmers of Sibu-Sire, Bila-Sayo, Bako-Tibe, andChaliya woredas for patiently responding to our questions. The same applies to the agriculturaldevelopment workers and development agents at the respective sites who assisted us in theimplementation of the questionnaires. The financial support from the CIMMYT/European Union(EU) Project on Strengthening Economics and Policy Research in Eastern Africa, and the invaluablefacilitation by the Oromia Regional State, which enabled us to conduct the study, are immenselyappreciated. We also thank the East Wellega and West Shewa Planning and Economic Developmentoffice for providing us with an aerial map, and the Ethiopian Seed Enterprise, Agricultural TradingEnterprise, and National Seed Industry Agency for responding to our need for information.
We are also grateful to Mulugeta Mekuria for making constructive comments during the pre-testingof the questionnaire and enumerator training. Last but not least, we would like to thank Jane Reevesfor her capable editing and Tigist Defabachew for typing.
vi

Executive Summary
Despite the importance of improved seed for bettering the livelihoods of small-scale farmers, access to thisinvaluable technology in Ethiopia is still constrained by many factors including the underdeveloped seedindustry. Independent studies have estimated a large annual demand for seed that is never met or, in thecase of hybrid maize and sunflower, is met only through imports. Consequently, the government hasincreased its efforts to develop plant breeding research networks and a complementary seed production,multiplication, processing, storage, marketing, and distribution system. The private sector, including non-governmental organizations (NGOs), has been encouraged to participate in the development of thenational seed industry.
This study was initiated in western Shewa and eastern Wellega zones of Oromia Regional State to:1) describe the seed system in Ethiopia and assess the effectiveness of the seed testing and releasemechanism; 2) identify how farmers acquire and transfer maize seed; 3) explore problems related tofarmers’ seed acquisition and transfer mechanisms; and 4) document the use of released maize cultivars.
MethodsThe study used a multistage stratified sampling design. Based on informal assessment and secondarydata, the major maize growing areas of western Oromia were purposively classified into four strata: Bako-Tibe and Chaliya Woredas in western Shewa, and Bila-Sayo and Sibu-Sire Woredas in eastern Wellega.Five peasant associations (PAs) were selected from each stratum. From each PA, 11 farmers wererandomly selected and interviewed using a structured questionnaire. The total sample size was 220farmers. Descriptive statistics and tobit analysis were used to establish relationships and draw inferencesand conclusions about farmers’ adoption of improved maize seed and their seed management practicesand strategies.
The Seed IndustryThe Ethiopian seed industry is composed of formal and informal sectors as well as public and privateorganizations. The formal sector includes federal and regional agricultural research establishments,universities, the National Seed Industry Agency (NSIA), the Ethiopian Seed Enterprise (ESE), and a fewprivate companies. The informal sector encompasses millions of farmers who continue to practice seedselection and preservation, just as their ancestors did. Today, the bulk of the national seed demand is metthrough this informal system of local seed maintenance and exchange.
The maize seed industry comprises two sequential processes: 1) varietal development, testing, and release;and 2) seed multiplication, processing, certification, marketing, and distribution. At a minimum, sevenyears are required to release a variety. Release may be unnecessarily delayed because of stringent varietalrelease requirements.
Farmer Characteristics and Maize Production in the Study AreaThe study area is located in western Oromia. In the mid-altitude zone, maize is the dominant crop forsmallholders. The average age of farmers was between 40 and 48 years, while the average holding wasbetween 12 to 15 timmad (1 timmad = 0.25 ha). There were more literate farmers in Bako-Tibe (65%)compared to Chaliya (55%), Bila-Sayo (50%), and Sibu-Sire (58%). In all woredas, farmers had access tooff-farm income; however, there were differences in the amount generated. Cows and oxen were thedominant livestock.
vii

The total area under improved maize increased in the four woredas between 1992 and 1996, while thetotal area under local varieties decreased. Also, since 1995, the total production of improved maize hassurpassed the total production of local varieties.
Seed IssuesFarmers in western Oromia grew 16 maize cultivars. The popular varieties in 1992 were Shashemene,Burrie, and Kenya. In 1996, the popularity of these improved OPVs decreased due to the introduction ofimproved maize hybrids particularly BH-660.
During the 1996 cropping season, most farmers planted seed that had been saved from their previousharvest. The Ministry of Agriculture (MOA) was the next most common seed source. The price of hybridmaize seed from the MOA was about 600 Birr/100 kg compared to 50-80 Birr/100 kg for local maize seedpurchased in the local market (Birr 7 = US$ 1). In all woredas, BH-660 was preferred for its high yield,seed size, and early maturity. Extension and other farmers were important sources of improved maizeinformation. Farmers mostly used their own financial resources to purchase improved maize seed. Themain problems indicated by farmers as constraining the use of improved maize seed were its high priceand unavailability. In some cases, the distance traveled to acquire improved seed was another constraint.
The NSIA estimated that the quantity of improved maize seed used in 1996 was 35,120 t, while ESEdistributed about 1,670 t of improved maize seed. This implies that about 5% of the improved seed waspurchased, while the remaining 95% was recycled improved seed.
All farmers in Bako-Tibe and Sibu-Sire and about 83% of farmers in Bako-Tibe and Bila-Sayo replacedtheir hybrids every year. The average time (years) since farmers had purchased hybrid seed was 1.4 inChaliya, 2.3 in Bako-Tibe, 2.1 in Bila-Sayo, and 2 in Sibu-Sire. From farmers’ responses it was estimatedthat, on average, a hybrid needs to be replaced after about 1.7 years in Chaliya, 1.2 years in Bako-Tibe,and 1 year in both Bila-Sayo and Sibu-Sire.
Most farmers selected seed during harvesting using good looking grain/cobs as the most importantselection criterion. Seed quality was good, according to most farmers, and was mostly judged on thebasis of grain filling and germination rate.
Factors Influencing the Allocation of Land to Improved MaizeFarmer education, extension services, off-farm income, and livestock units all significantly and positivelyinfluenced the area of land allocated to improved maize. A farmer’s proximity to a formal seed sourcehad a positive impact on the allocation of land to improved maize.
Recommendations• Next to the extension system, farmer-to-farmer seed exchange remains the most important
mechanism for disseminating improved maize technology. The government can strengthen thisinformal system through the provision of low-interest finance, technical assistance, and publiclybred parent material.
• The extension system should advise farmers on the characteristics and correct adaptation zones ofnewly released maize cultivars. Maize breeding programs need to give proportionate weights toyield and non-yield characteristics when selecting the best varieties.
viii

Farmers’ Maize Seed Systems inWestern Oromia, EthiopiaAbdissa Gemeda, Girma Aboma, Hugo Verkuijl, and Wilfred Mwangi
1.0 Introduction
1.1 The Potential of Improved Seed and the Importanceof the Seed Industry
The effectiveness of research results emanating from experiment stations is conditioned by thestrength and efficiency of support services such as extension, credit, and input supply, including thesupply of improved seed. The role of improved seed, particularly of wheat and rice, in alleviatingpoverty has been widely debated (Dasgupta 1977; Singh 1990; DZARC 1995). Ellis (1993) outlinedthe social and economic impact of improved varieties in countries where they have been widelygrown, and it is commonly observed that the dissemination of improved seed and complementaryinputs has removed the shadow of famine from the lives of millions of poor farm families. Becauseimproved seed embodies a plant’s genetic potential, it determines the upper limits on yield andeven the productivity of other inputs (Jaffee and Srivastava 1994).
Despite the importance of improved seed for bettering the welfare of small-scale farmers, access tothis invaluable technology can be constrained by many factors, including an underdeveloped seedindustry. A seed industry essentially consists of all enterprises that produce or distribute seed (Prayand Ramaswami 1991). At a minimum, the industry has four components: 1) plant breedingresearch, 2) seed production and multiplication, 3) processing and storage, and 4) marketing anddistribution. The industry’s overall performance depends on the efficiency of each component, andeach component possesses different economic and technical characteristics that determine the rolesthat public and private organizations play within the industry. These characteristics includeeconomies of scale, externalities, excludability, and problems of information or quality.
The development of new varieties and hybrids can be profitable for specialized research anddevelopment firms. However, owing to 1) the high fixed costs of entering the industry, 2) theexternalities associated with plant breeding, and 3) the difficulty of excluding non-paying farmersor firms from benefiting from new seed varieties, the amount and direction of private sectorinvestment in these activities may be insufficient or inappropriate. The significance of these
1
difficulties will vary, depending on whether the seed is of hybrid or self-pollinating plants. Becausethe desirable properties of hybrids are attenuated if hybrid seed is grown over successivegenerations, farmers must buy new seed to achieve undiminished yields. The originator of a newhybrid can therefore easily exclude competing seed firms and farmers from the benefits of the newhybrid if they have not paid for access. In contrast, breeders of new self-pollinated varieties maycapture few of the benefits because others (including farmers) can easily duplicate the varietywithout paying for it.
The dissemination of improved seed to small-scale farmers can also be constrained by the varietalrelease committee. Some regulatory frameworks are neither sufficiently responsive to the needs ofsmall-scale farmers nor adequately adapted to changing institutional environments (ODI 1995).Furthermore, significant biases in the way that varieties are developed and released mean thatsmall-scale farmers are less likely to benefit from the product. Similarly, seed multiplication anddistribution regulations often hinder farmers’ access to seed and varieties that would be useful tothem. A report by the Overseas Development Institute (ODI) (1995) stated that no solution will beperfect, but regulatory frameworks that take account of farmers’ conditions and preferences, andthat allow their participation, are likely to be steps in the right direction.
The skills required to multiply seed of a new variety or hybrid and the technical and commercialrisks associated with this activity are considerably lower than those associated with research todevelop a new variety or hybrid. For this reason, there are fewer economic and technical barriers toprivate sector involvement in seed multiplication than research. Even so, excludability may be aserious problem in some instances because harvested grain of self- and open-pollinated cropsresembles commercial seed. The private sector can profitably perform most seed distributionfunctions; public sector distribution of seed can be justified only in the early stages of seed industrydevelopment, when private channels are weak.
Another important mechanism responsible for the majority of seed diffusion in various farmingsystems is informal farmer-to-farmer seed exchange. This operates mainly at individual communitylevels, although lines of supply may extend over a relatively wide geographical area. These channelsare more accessible and affordable sources of seed for farmers. An accurate understanding of therole of improved seed in small-scale farming systems and of the mechanisms by which seed reachessmall farmers is therefore critical to fostering agricultural development (ODI 1990a).
1.2 The Local Seed IndustryMaize was introduced in Ethiopia in the 16th or 17th century. Despite the existence of some localcultivars, the genetic diversity of those cultivars was insufficient for establishing suitable sourcepopulations. Since its establishment in the 1950s, the national maize research program has beenintroducing germplasm from exotic sources. Beginning in 1967, Ethiopia has systematicallyparticipated in the East Africa Cooperative Maize Trial, which has resulted in the evaluation ofseveral promising varieties. The hybrids from Kenya and Zimbabwe had a 30% yield advantageover tested varieties, however, so the state farms were encouraged to import Kenyan hybrids. In thebeginning of the 1980s, a vigorous national maize breeding program was started and located at Bako
2

Research Center (BRC). Since 1988, this program has developed a number of outstanding hybrids:BH-140, BH-660, and BH-540 (Benti Tolessa et al. 1996).
Improved seed goes through elaborate procedures such as on-farm verification, on-farmdemonstration, and pilot production stages before being approved for release by the NationalVariety Release Committee (NVRC). The role of releasing improved varieties is now performed bythe National Seed Industry Agency (NSIA), which acts as the overall watchdog for the seedindustry. A dynamic informal seed sector exists alongside the formal sector, where farmers exchangeseed. The role of both sectors in the supply of seed to farmers will be outlined in this paper.
The Ethiopian Seed Enterprise (ESE) dominates the production/multiplication, processing, anddistribution of seed of new major crop varieties in Ethiopia in general, and in particular in westernOromia. The ESE manager at the Nekemte Branch reported that before 1990, ESE imported parentallines from Kenya (H625) and Zimbabwe (CG4141) and produced seed by making contractualagreements either with private investors, the Institute of Agricultural Research (IAR, now renamedEthiopian Agricultural Research Organization, EARO), or state farms. The Agricultural InputsSupply Corporation (AISCO) distributed seed, as well as other major inputs such as fertilizer.
After the economic reform in 1991, policies changed and the importation of parental lines wasdiscontinued. Since 1991, ESE has obtained breeder and/or basic seed from the IAR (EARO),regional research centers, Alemaya University of Agriculture (AUA), and Awasa College ofAgriculture (ACA). It also makes contractual agreements with private investors, EARO, seed farms,and state farms for the production/multiplication of improved maize seed.
1.3 Objectives of the StudyThe formal seed sector alone is not sufficient to meet farmers’ seed needs, and hence cannot producea sustainable increase in production and productivity to realize national objectives of food self-sufficiency and food security. Thus it is expected that the informal seed sector has an important roleto play. Specifically, this study was designed to:
• Describe the seed system in Ethiopia and assess the effectiveness of the seed testing and releasemechanism.
• Identify how farmers acquire and transfer seed of maize cultivars.
• Explore problems related to farmers’ seed acquisition and transfer mechanisms.
• Document the use of released maize cultivars.
1.4 The Study AreaEastern Wellega and western Shewa zones are among 12 zones in Oromia (Figures 1 and 2). Thesezones have different agro-ecologies, but the study focused on the mid-altitude zone, where maize isthe dominant crop for smallholders. Here, the elevation ranges from 1,500 meters above sea level(masl) to over 2,000 masl. Soils are mainly reddish brown clay dominated by nitosols. The surveyarea is located at 9o6’ N and 37o09’ E, with an average annual rainfall of 1,320 mm at Bako. Thetemperature ranges from 14.1oC to 28.3oC and the average relative humidity is 67.2%.
3

The total population in the two zones is about two million people. The major crops grown includemaize, sorghum, pepper, noug, finger millet, teff, wheat, barley, field peas, faba beans, sweetpotatoes, anchote, and gomencher. The main types of livestock kept include cattle, sheep, goats,equines, and chickens. The farming system is mixed crop-livestock.
The principal production constraints that have been identified in other studies are: 1) shortage ofdraft power; 2) labor shortage during the peak season; 3) low soil fertility; 4) low income; 5) shortageof feed during the dry season; 6) crop pests and diseases; 7) animal diseases and parasites; and8) low genetic potential of local crop varieties and cattle breeds.
4
400 0 400 800 Kilometers Figure 1. Oromia, Ethiopia.
300 0 300 600 Kilometers
Negele
Robe
AselaJimma
Gimbi
Fiche
NekemteNekemteNekemte AmboAmboAmbo
E. E. WelegaWelegaE. WelegaW. W. ShewaShewaW. Shewa
Figure 2. The study area, westernOromia, Ethiopia.

2.0 Methodology
2.1 Sampling MethodA multi-stage purposive sampling procedure was used to select farmers in eastern Wellega andwestern Shewa. The major maize growing areas were selected based on an informal survey andsecondary data sources. In eastern Wellega, Bila-Sayo and Sibu-Sire Woredas were selected andBako-Tibe and Chaliya Woredas were selected in western Shewa (Figure 3. Proximity to BRC was asecond stratifying parameter: Bila-Sayo and Bako-Tibe Woredas are much closer to the BRC thanChaliya and Sibu-Sire. It was hypothesized that farmers nearer to BRC benefited more fromimproved maize cultivars. Five peasant associations (PAs) were randomly selected from eachworeda, from which 11 smallholder farmers per PA were randomly selected and interviewed using astructured questionnaire. The total sample size was 220 farmers.
2.2 Analytical ModelFactors influencing the adoption of new agricultural technologies can be divided into three majorcategories: 1) farm and farmers’ associated attributes; 2) attributes associated with the technology(Adesina and Zinnah 1992; Misra et al. 1993); and 3) the farming objective (CIMMYT 1988). Factorsin the first category include the farmer’s education level, age, and family and farm size. The secondcategory varies with the type of technology, e.g., the characteristics a farmer prefers in improvedmaize. The third category assesses how different strategies used by the farmer, such as commercialversus subsistence farming, influence the adoption of technologies.
5
30 0 30 60 Kilometers
BILA SEYO
SIBU SIRE
IHUD-GABAYA
Jare
IjajiGedo
Sire
AnoBako
BAKO TIBECHELIYA
Figure 3. Woredas in WesternOromia, Ethiopia.

In this study, a tobit model was used to test the factors affecting the allocation of land to improvedmaize. The model, which tested the factors affecting the incidence and intensity of adoption(McDonald and Moffitt 1980; Maddala 1983) was specified as follows:
Yt = Xtβ + Ut if Xtβ+ Ut > 0= 0 if Xtβ + Ut ≤ 0
t = 1,2,…, Nwhere:
Yt = the expected amount of land allocated to improved maize at a given stimulus level, Xt;N = number of observations;Xt = vector of independent variables;β = vector of unknown coefficients; andUt = independently distributed error term assumed to be normal with zero mean and
constant variance σ2.
Xt is the index reflecting the combined effect of the independent (X) variables that inhibit orpromote adoption. The index level Xt can be specified as:
Xt = β0 + β1X1 +….+ β13X13 + εi
where:
b0 = constant;X1 = FSIZE (farm size, timmad);X2 = EXP (experience of the household head, yr);X3 = EDUC (education level of household head, dummy variable);X4 = LSTOCK (livestock units; index in which livestock numbers are aggregated using
the following weighting factors: oxen and cow = 1.0, goat = 0.08, sheep = 0.08, poultry = 0.02);X5 = EXT (farmer received extension visit, number);X6 = HSIZE (family labor, number of adults in the household);X7 = FDAY (farmer attended a field day, dummy variable);X8 = YOFI (amount of off-farm income, Birr);X9 = HLAB (use of hired labor, dummy variable);X10 = HYLD (farmer’s preference for high yield, dummy variable);X11 = LODG (farmer’s preference for lodging resistance, dummy variable);X12 = IMPURE (farmer’s preference for pure seed, dummy variable);X13 = CONDITIO (farmers condition their seed, dummy variable); andεi = error term.
Formation of the model was influenced by a number of working hypotheses. It was hypothesizedthat a farmer’s decision to adopt or reject a new technology at any time is influenced by thecombined (simultaneous) effects of a number of factors related to the farmer’s objectives andconstraints (CIMMYT 1993). The following variables were hypothesized to influence the allocationof land to improved maize, either hybrids or improved open-pollinated varieties (OPVs).
6

Farm size: Farm size (X1) is an indicator of wealth and perhaps a proxy for social status andinfluence within a community. It is expected to be positively associated with the decision to adoptimproved maize technology. Farm size can also encourage farmers to intensify their production, inwhich case a larger farm size is expected to be negatively related to the adoption of improvedmaize technology.
Experience: A farmer’s experience (X2) can either generate or erode confidence. With moreexperience, a farmer can become more or less averse to the risk implied by adopting a newtechnology. This variable can thus have a positive or negative effect on a farmer’s decision to adoptan improved maize technology.
Education: Exposure to education (X3) should increase a farmer’s ability to obtain, process, and useinformation relevant to the adoption of improved maize technology. Education is thus thought toincrease the probability that a farmer will adopt an improved maize technology.
Livestock: Ownership of livestock (X4) is hypothesized to be positively related to the adoption ofimproved maize technologies.
Extension: Agricultural extension services provided by the MOA are the major source ofagricultural information in the study area. It is hypothesized that contact with extension workers(X5) will increase a farmer’s likelihood of adopting improved maize technologies.
Household size: Large households will be able to provide the labor that might be required by theimproved maize technologies. Thus, household size (X6) would be expected to increase theprobability of adopting improved maize technologies.
Field days: Attending a field day (X7) will increase a farmer’s awareness of new technologies andhence increase the probability of adopting improved maize.
Off-farm income: Access to off-farm income (X8) enables farmers to purchase inputs and isexpected to have a positive influence on the adoption of improved maize.
Hired labor: Hired labor (X9) helps farmers to overcome labor constraints, especially with respectto the number of hand weedings required for improved maize. Thus, hired labor is expected tohave a positive influence on the adoption of maize technologies.
Varietal characteristics: A number of varietal characteristics are expected to positively influence theallocation of land to improved maize. It is expected that farmers prefer varieties that are highyielding (X10) and resistant to lodging (X11). Also, adopters are expected to want pure (X12) andwell-conditioned (X13) seed.
7

3.0 Seed Supply
3.1 Seed Industry StructureDouglas (1980) showed that seed supply systems in most countries pass through four evolutionarystages characterized by increasing technological and organizational complexity:
1. Farmers save their own seed from crop to crop by selecting the most productive plants. They alsoexchange seed with a few farmers.
2. A specialized government agricultural department emerges under pressure from farmers andconducts plant breeding research and varietal development. A few farmers specialize inmultiplying and distributing seed released by the government research stations.
3. Private seed companies enter the seed industry and invest in plant breeding research anddevelopment, seed growing, processing, and marketing.
4. Plant breeding and seed production and marketing become highly organized and technologicallyintensive. Both public and private organizations engage in seed production, marketing, andinternational trade.
The Ethiopian seed industry is currently at the second stage of development. Improved varieties aredeveloped by the national agricultural research system and development programs or introducedfrom outside. Public institutions are responsible for producing and distributing seed to farmers,although some private companies are now entering the seed industry and have started research onhybrid seed production, marketing, and distribution.
The NSIA was established in 1993 to strengthen the seed industry in Ethiopia. Its objective is toincrease the flow of seed to farmers. The supply of seed is constrained by inefficiency of public seedenterprises, poor seed promotion, poor transportation, and inappropriate agricultural and pricingpolicies. Moreover, because high-yielding varieties perform well with fertilizers, the limitedavailability of fertilizers constrains the demand for improved seed. As a result, most seed in thepeasant sector is still produced by farmers (Hailu Gebremariam 1992).
The Ethiopian seed industry is thus characterized by formal and informal sectors. For the industry toevolve into the third stage of its life cycle, linking of the formal and informal systems and promotionof private sector provision of seed will be important. The advantages of linking the two systems arethat farmers can maintain seed quality, the informal system can widely distribute seed, and theinformal system is more effective in selecting and diffusing appropriate varieties (Thiele 1999).
The formal sector includes research institutions, MOA, development projects, and public and privateseed enterprises. The participants in the informal sector are farmers, non-governmental organizations(NGOs), and relief agencies.The seed distribution channelsin the study area changed in1991 due to political andeconomic reforms as depictedin Figure 4.
8
Seed distribution before 1991ESE AISCO MOA or NGOs farmer
Seed distribution after 1991ESE MOA (zone) MOA (woreda) Development agents (PA) farmers
Figure 4. Seed distribution and marketing channels in the study area.Source: Respective district agricultural development offices, 1997, pers. comm.

3.1.1 The formal sector. Most seed for cropping is obtained from the previous harvest. Nevertheless,farmers periodically obtain seed from beyond the farm gate, and their sources include other farmers,commercial seed dealers, NGOs, national research institutes, or other public agencies. Seed may bebrought into the farm to cover deficits following harvest failures; introduce new varieties; andprovide seed of better quality, either physiologically and/or genetically.
Many organizations have developed strategies to stimulate the flow of improved seed to farmers(Wiggins and Cromwell 1995). During the 1960s and 1970s, many countries received funding fromdonors to set up national seed production and distribution programs, with public agencies carryingout most of the activities. For example, the FAO Seed Development and Improvement Programsupported 60 countries during 1972-84; the World Bank supported 13 national seed projects and 100other seed-related projects during 1975-85; and USAID provided long-term support to public bodiesconcerned with seed in 57 countries during 1958-87 (Wiggins and Cromwell 1995). The support fromthe formal sector, however, has been disappointing. The public agencies often lacked sufficientresources, or their staff lacked incentives or were poorly managed. Consequently, they produced lessseed than expected and frequently at a higher cost than the private sector. Also, the seed suppliershad difficulty in supplying seed to farmers in marginal areas (Wiggins and Cromwell 1995).
In Ethiopia, varietal development is handled by EARO, Alemaya University of Agriculture (AUA),Addis Ababa University (AAU), and regional and state agricultural research centers. Virtually allplant breeding has been done by public institutions, although Pioneer Hi-Bred International has beeninvolved in some varietal development.
Before a variety or hybrid can be recommended for release, it must be evaluated in farmers’ fields fordisease resistance, productivity, stability, and quality. After on-farm verification and evaluation,NVRC officially releases the varieties. This procedure is sometimes violated. For instance, in 1991,Pioneer tried to produce 144 ha of hybrid maize seed and 60 ha of sunflower using imported seedthat had not been officially tested, verified, and released. The company harvested only 71.1 t of maizeseed and the sunflower did not even set seed.
In 1979, ESE was incorporated to produce, process, and market seed. Initially, ESE only suppliedimproved varieties to state farms and producer cooperatives that were the foundation of the socialisteconomy. Now it is governed by an interministerial seed board and has been given autonomousstatus to function as a profit-making enterprise. This organization was the only seed enterprise inEthiopia until December 1990, when it entered into partnership with Pioneer Hi-Bred International(Hailu Gebremariam 1992). 1
The national maize program at BRC and AUA supplies ESE with improved and basic seed that ESEmultiplies at two of its basic seed farms. ESE also produces seed under contractual arrangementswith state farms and private producers. The organization maintains five processing plants, fromwhich it also distributes seed. These plants are located in Awassa, Assela, Koffela, Nekemte, andBahir Dar. From 1980 to 1991, ESE produced and distributed an average of 23,065 t of seed per year
9
1 The joint venture was discontinued in December 1995 as part of the reform to liberalize the economy.

(Table 1). Since 1994, ESE has increased its seed supply because the government embarked on amajor effort to promote improved seed through its extension management training plots (EMTPs).During 1995–98, about 15% of ESE’s seed was distributed to state farms, 55% to EMTPs, and about30% to others. In 1998, 67.5% of the distributed seed was wheat, 31% was maize, 1% was barley, and0.5% was of other crops.
The type and amount of maize seed produced by the ESE-Nekemte Branch is shown in Table 2. Thetable shows an increase in production of the recommended maize hybrids BH-660, BH-550, and BH-140. The production of Beletech and CG-4141 was discontinued in 1994 because they did notperform as well as the recommended hybrids.
The ESE processes seed that is produced through contractual agreements made with privateenterprises, EARO, regional research centers, and state farms. The contractual agreement is signedbetween ESE and the contractor and entails the following obligations: all production costs are borneby the seed producer; the inspection cost and cost of the jute bags is borne by ESE; and ESE pays forthe raw seed.
The ESE sells its seed to farmers and interested organizations, such as MOA, Sasakawa-Global 2000(SG-2000), state farms, and different administrative regions. In 1996, the price of improved maizeseed at the ESE-Nekemte Branch was Birr 547/100 kg (Birr 7 = US$ 1). The ESE head office in AddisAbaba sets the price of seed, which is based on the cost of raw seed, processing, transportation, in-bred line, and overhead. Also, a 5% profit margin is added to the price of seed. The ESE hasacknowledged that it was not meeting the demand for maize seed and reported a shortage of inbredlines supplied by EARO.
The seed required for the peasant sector iscollected from the processing plants by AISCOand distributed to farmers through the servicecooperatives (SCs) and PAs. There has alwaysbeen some discrepancy between the amount ofseed ordered and purchased by AISCO. Forexample, between 1985/86 and 1990/91, AISCOannually ordered 24,688 t of seed from ESE and
10
Table 1. Seed distribution (000 t) by the Ethiopian SeedEnterprise, 1980-98
Year Wheat Barley Maize Teff Sorghum Total
1980 19.08 0.26 1.16 0.02 0.20 20.721981 18.85 0.74 2.35 0.13 0.17 22.241982 16.43 0.29 1.42 0.27 0.15 18.561983 16.57 0.87 2.50 0.22 0.05 20.211984 12.25 1.65 1.30 0.13 0.26 15.581985 21.77 1.72 12.58 0.77 0.07 36.921986 25.54 1.83 11.78 0.56 1.12 40.831987 19.91 2.16 8.28 0.53 1.44 32.321988 18.81 4.12 4.51 0.57 2.15 30.171989 9.19 1.39 3.16 0.22 0.94 14.891990 8.81 0.71 3.87 0.74 0.61 14.741991 7.1 1.24 1.14 0.03 0.10 9.611992 6.96 1.23 1.53 1.89 0.19 11.81993 11.09 0.31 2.38 1.42 2.06 17.261994 12.06 0.17 3.61 2.42 0.29 18.551995 10.13 0.15 2.63 0.04 0.58 13.531996 12.37 0.27 1.89 0.36 0.16 15.051997 8.18 0.37 1.67 0.28 0.007 10.61998 11.08 0.14 4.25 0.05 0.01 15.53Total 266.18 19.62 72.01 10.65 10.56 379.02
Source: Hailu Gebremariam (1992); ESE (1999).
Table 2. Maize seed produced by the Ethiopian SeedEnterprise, Nekemte Branch, 1992-96
Quantity produced per year (100 kg)
Variety 1992 1993 1994 1995 1996
BH-660 50 1,593 3,194 3,756 12,045BH-140 470 2,577 450 3,906 6,038BH-540 - - 100 100 400Abobako 200 - - - -Beletech 2,000 205 445 - -Kuleni - - 113 - -CG-4141 3,528 1,875 375 - -

purchased only about 21%, which left ESE with a large residual seed stock every year.Furthermore, AISCO distributed only part (60%) of what it had purchased. This discrepancy inproduction and distribution of seed to peasant farmers is caused by problems in demandassessment, the seed distribution mechanism, seed quality, and the seed price and credit system(Hailu Gebremariam 1992).
At present ESE distributes seed directly to SCs through district agricultural development offices.The ESE seed prices should be lower than those of AISCO because the costs of ESE services areless. Formerly AISCO charged Birr 20/100 kg above the price it paid to ESE for its services(Hailu Gebremariam 1992). There is no independent national seed quality control andcertification scheme, although ESE has its own internal quality control facilities. As a result, noneof the commercial seed distributed by ESE is certified, and farmers and development workershave sometimes disputed the purity and quality (Hailu Beyene 1993). The major constraint formultiplication of hybrid maize seed is an increase in susceptibility to gray leaf spot. The OPVsA511 and Katumani are not well maintained.
In general, commercial farmers take advantage of the formal seed sector. They are located mostlyin high potential areas with a relatively well-established market infrastructure. These farmersfollow different strategies for seed acquisition depending on their participation in the ongoingpackage program and their capacity to follow package recommendations. Farmers who hostEMTPs have access to credit for the acquisition of package components, namely, seed andfertilizer. Extension, education, and technical support are given in accordance with the croppingcalendar. The down payment for inputs is determined by MOA staff at the woreda level anddepends on the ability of each host farmer to pay. It ranges from 5% to 50% of the cost of inputssupplied, and the balance is settled at the time of harvesting.
Some farmers who participate in the package extension program host EMTPs for a few years (1-2years). After they stop hosting, they become graduate farmers. Another group of farmers learnsthe practices either from graduates or package host-farmers and are called copy farmers. The twogroups of farmers usually buy seed that has been distributed to EMTP host-farmers on a cashbasis. Although they have access to credit, they rarely make use of it due to a lack of information,unavailability, and/or the complicated bureaucratic procedures required to access credit.
The Oromia Agricultural Development Bureau determines the amount of credit disbursed tofarmers. A farmer’s elegibility is assessed by the Input Coordination Unit (ICU) at the zonal andworeda level. This unit is responsible for disbursing and collecting credit from farmers. Thecommittee starts its assessment of farmers’ credit needs between November and February. Thefarmers are advised about credit availability as well as the consequences of defaulting onpayment.
As noted, BRC plays an important role in developing improved maize and in producing basicand certified seed that is sold to ESE. This research center has produced an average of 883 qt ofBH-660 on 56 ha and 441 qt of BH-540 on 45 ha annually. In 1996, the price of hybrid maize seedat BRC was Birr 225/qt.
11

3.1.2 The informal sector. The most common form of seed exchange in African countries is fromfarmer to farmer. This system has a number of advantages for farmers over formal seed exchange. Ituses indigenous structures for information flow and exchange of goods, and its informal nature makesit less rigid than the formal sector. Furthermore, it operates at the community level betweenhouseholds within a small number of communities, so farmers have easy access to seed and oftenknow the farmer from whom they obtain the seed. Availability is further enhanced by the wide varietyof exchange mechanisms that are used to transfer seed between individuals and households, such ascash, exchanges in kind, barter, or transfers based on social obligations (Table 3). This is especiallyimportant for households that have limited resources to purchase seed. A further benefit of thisexchange system is that farmers are able to acquire seed in the quantities they want (Cromwell 1996).
Ethiopian farmers have been practicing seed selection and preservation for centuries and, as we havenoted, the bulk of the national seed requirement is still met through this informal system. Of the totalannual seed requirement (about 0.42 million tons), 15% is produced by the formal sector as improvedseed stock, whereas 85% is produced by the informal farmer-to-farmer exchange system as localvarieties (Table 4). Most farmers in western Shewa (68.4%) and eastern Wellega (41.5%) bartered maizeseed for grain at a rate of 1 kg of seed for 1 kg of grain. About 5% of farmers in western Shewa and21% in eastern Wellega purchased their local maize seed at a rate of Birr 90/100 kg (Table 3).
Non-governmental organizations are involved in the supply of seed for a variety of reasons. MostNGOs concentrate on providing source seed, other inputs, and technical assistance aimed atstrengthening local community-driven multiplication of improved hybrids, OPVs, and enhanced localvarieties. They distribute seed that is developed and multiplied by the formal research system andcontract farmers. A drawback of this system is that seed quality varies due to lack of regulation. Insome cases when NGOs wanted to ensure that seed quality was adequate, agencies inspected thegrowing seed crops and certified the seed. The links with government programs consisted ofinformation exchange, contract services for the provision of source seed, seed testing, and fieldinspections. The NGOs had little contact with the private sector.
The average seed price set by NGOs was roughly US$ 0.85/kg higher than the price of seed producedby the formal sector. The higher costs of small-scale seed production by NGOs resulted fromconsiderable overhead costs, and the NGOs themselves recovered only 25-50% of their seedproduction costs from seed sales. Equity issues were rarely addressed, and most of the participantswere better-off farmers who were considered to be more effective at multiplying seed (Wiggins andCromwell 1995).
12
Table 3. Farmers’ seed acquisition and exchange rate in western Oromia, Ethiopia, 1996
Western Shewa Eastern Wellega
Means of Number of Percent of Number of Percent of Exchangeacquiring seed farmers farmers farmers farmers rate
Purchased 3 5.3 11 20.8 Birr 0.9: 1 kgBartered with grain 39 68.4 22 41.5 1 kg : 1 kgBartered with labor - - 1 1.9 -Obtained free of charge 14 24.6 18 34.9 -
13
Another role of NGOs is to distribute relief seed after emergencies such as war or drought (Tripp1997). In Ethiopia, distribution of relief seed is often dispersed and badly coordinated. Initially, NGOswere assumed to be responsible for acquiring and providing early generation seed to servicecooperatives at cost, including transport. The distribution of free seed by NGOs and relief agencies hasactually had several negative effects by creating dependency on free services, disrupting the informalfarmer-to-farmer seed exchange system, and weakening sustainable development in the seedsubsector (Hailu Gebremariam 1992). Nevertheless, NGOs have tended to work well with small-scale,resource-poor farmers, who are mostly located in remote and inaccessible areas.
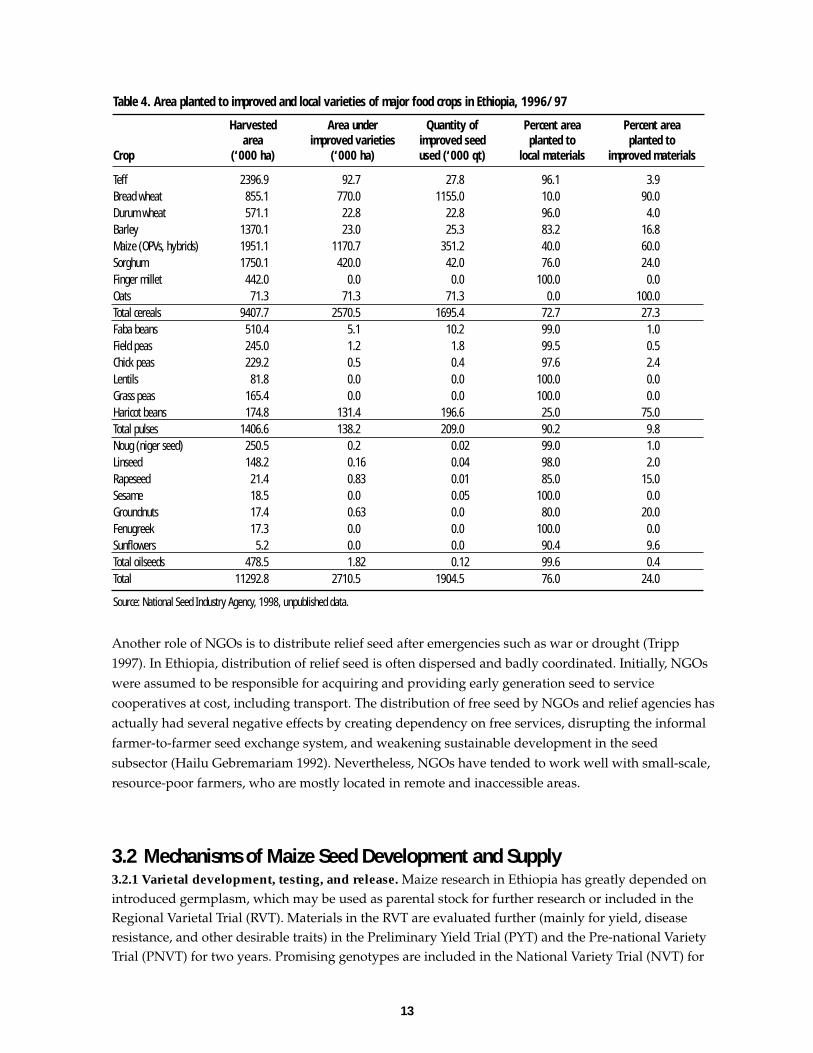
3.2 Mechanisms of Maize Seed Development and Supply3.2.1 Varietal development, testing, and release. Maize research in Ethiopia has greatly depended onintroduced germplasm, which may be used as parental stock for further research or included in theRegional Varietal Trial (RVT). Materials in the RVT are evaluated further (mainly for yield, diseaseresistance, and other desirable traits) in the Preliminary Yield Trial (PYT) and the Pre-national VarietyTrial (PNVT) for two years. Promising genotypes are included in the National Variety Trial (NVT) for
Table 4. Area planted to improved and local varieties of major food crops in Ethiopia, 1996/97
Harvested Area under Quantity of Percent area Percent areaarea improved varieties improved seed planted to planted to
Crop (‘000 ha) (‘000 ha) used (‘000 qt) local materials improved materials
Teff 2396.9 92.7 27.8 96.1 3.9Bread wheat 855.1 770.0 1155.0 10.0 90.0Durum wheat 571.1 22.8 22.8 96.0 4.0Barley 1370.1 23.0 25.3 83.2 16.8Maize (OPVs, hybrids) 1951.1 1170.7 351.2 40.0 60.0Sorghum 1750.1 420.0 42.0 76.0 24.0Finger millet 442.0 0.0 0.0 100.0 0.0Oats 71.3 71.3 71.3 0.0 100.0Total cereals 9407.7 2570.5 1695.4 72.7 27.3Faba beans 510.4 5.1 10.2 99.0 1.0Field peas 245.0 1.2 1.8 99.5 0.5Chick peas 229.2 0.5 0.4 97.6 2.4Lentils 81.8 0.0 0.0 100.0 0.0Grass peas 165.4 0.0 0.0 100.0 0.0Haricot beans 174.8 131.4 196.6 25.0 75.0Total pulses 1406.6 138.2 209.0 90.2 9.8Noug (niger seed) 250.5 0.2 0.02 99.0 1.0Linseed 148.2 0.16 0.04 98.0 2.0Rapeseed 21.4 0.83 0.01 85.0 15.0Sesame 18.5 0.0 0.05 100.0 0.0Groundnuts 17.4 0.63 0.0 80.0 20.0Fenugreek 17.3 0.0 0.0 100.0 0.0Sunflowers 5.2 0.0 0.0 90.4 9.6Total oilseeds 478.5 1.82 0.12 99.6 0.4Total 11292.8 2710.5 1904.5 76.0 24.0
Source: National Seed Industry Agency, 1998, unpublished data.

further evaluation for two to three years at five to seven locations in major maize growingenvironments. The best materials from NVT and RVT are included in the Variety Verification Trial(VVT), which is conducted on research stations as well as on farmers’ fields under recommended andfarmers’ management levels for one to two years. The objectives of the VVT are to obtain farmers’pre- and post-harvest assessment of varieties, evaluate the performance of the varieties in a realproduction system, and assist in the decision of the variety release committee.
The variety release committee is composed of professionals from different research and seed userorganizations, e.g., EARO, NSIA, ESE, and MOA. The committee considers mostly biological factorsin deciding to release a variety, and there is no guarantee that farmers’ preferences and priorities arefully represented. In general, seven years are required to release a variety. Sometimes release may beunnecessarily delayed because of the stringent variety release requirements. After a variety isreleased, it is included in Breeder Seed Increase (BSI). Breeder seed is then provided to BRC togenerate basic/foundation seed, and then to ESE for further multiplication on large plots.
3.2.2 Seed imports. Aside from producing seed to meet local demand, ESE is also responsible forimporting seed. Between 1986 and 1991, ESE imported nearly 3,000 t of seed (Table 5), mostly hybridmaize from Kenya and hybrid sunflower from Argentina. After establishing a joint venture with
14
Table 5. Seed imports by the Ethiopian Seed Enterprise, 1986-91
Year Crop Country Quantity (t) Price (US$/t)
1986 Hybrid maize Kenya 3.8 750.0Malt barley Kenya 0.5 900.0
1987 Hybrid maize Kenya 980.0 996.0Hybrid maize Zimbabwe 120.0 834.7Malt barley Spain 150.0 626.0Sunflower Argentina 11.0 3,513.2
1988 Hybrid maize Kenya 580.0 869.7Maize, basic Kenya 30.0 899.8Sorghum Kenya 10.0 869.7Maize, basic France 2.0 22,434.1Sunflower Zimbabwe 33.0 3,821.3Sunflower Argentina 30.0 3,821.3Sunflower, basic Argentina 0.15 84,000.0Pepper Argentina 0.1 43,500.0
1989 Maize, basic Zimbabwe 2.5 17,076.4Sunflower Argentina 47.5 4,471.2
1990 Sunflower Argentina 11.5 3,022.4Maize, basic Malawi 0.3 21,866.7Cotton Israel 0.6 10,225.0
1991 Hybrid maize Kenya 900.0 1,000.01992 Hybrid maize Zimbabwe 2.0 18,000.01993 Hybrid maize Zimbabwe 2.4 18,000.01994 Hybrid maize Zimbabwe 2.1 18,000.01995 Hybrid maize Zimbabwe 2.5 19,000.01996 Hybrid maize Zimbabwe 2.0 20,000.01997 Hybrid maize Malawi 2.0 20,000.01998 Hybrid maize Zimbabwe 2.8 19,000.0Total 2,973.2
Source: Hailu Gebremariam (1992); ESE (1999); unpublished data.
Pioneer Hi-Bred International in 1990, ESE imported more seed. Increasing seed imports mayhave a negative impact on national efforts to develop adapted, high-yielding varieties andhybrids, on creating a sustainable seed supply that would foster self-sufficiency, and on theconservation and sustainable use of indigenous germplasm (Hailu Gebremariam 1992). On theother hand, increased imports reflect ESE’s inability to meet domestic seed demand.
3.2.3 Seed distribution and marketing. The institutions involved in seed distribution andmarketing are ESE, AISCO, Development Bank of Ethiopia, Commercial Bank of Ethiopia, SCs,and private organizations.
Commercial seed production and processing are handled by ESE. AISCO distributes seed throughSCs, which receive loans from the Development Bank and Commercial Bank to purchase seed.Although it is envisaged that the private sector will play an important role in the seed industry inthe future, the contribution of private firms in supplying seed of the major food grains is stillsmall (Hailu Gebremariam 1992). Private companies, such as Ethiopia Amalgamated Ltd.,Ambassel, and Dinsho Trading Enterprises, have recently entered the seed industry, buying seedfrom ESE and distributing it to a limited number of farmers on commission.
The promotion of improved seed by ESE has been limited. It also seems that sometimes ESE is notaware of which varieties farmers want. Better marketing could play an important role in thediffusion of new varieties. For example, a greater effort could be made to advise farmers on thebenefits of improved varieties and to differentiate between grain and improved seed.
3.2.4 Local seed supply. A typical farmer-managed seed production process consists of thefollowing steps. Farmers rogue their growing crops by hand to remove diseased and off-typeplants. Selection is usually carried out based on characteristics including high yield, low input(including labor) requirement, resistance to pests and diseases, particular processing, cooking andtaste qualities, storability, and good yield of non-grain biomass (leaves and stalks). It is importantto note that subsistence farmers select for yield stability, which is associated with diversity withinand between crops and cultivars (Almekinders et al. 1994).
The crops are harvested by hand, which avoids mechanical damage to the seed andcontamination with weed seeds and other inert material. After harvest, crops are often threshedand cleaned by hand to minimize damage and contamination, and then they are usually dried inthe sun to reduce moisture content. Seed is often stored separately from grain. It is commonlyhung overhead in a smoky place, such as the kitchen, to minimize insect damage and reducemoisture content. Also, seed can be conditioned by adding local insecticides and/or fungicides(eucalyptus leaves, sand, ash, neem) before being placed in special containers and stored abovethe fireplace (Cromwell 1996).
Various organizations have been involved in strengthening local commercial seed production, bybuilding on the existing farmer-to-farmer seed exchange. As one would expect, an importantcomponent of this activity is plant breeding and variety selection. Farmers’ participation in varietytesting can be linked to seed provision. In Colombia, farmer groups were formed to collaboratewith research and extension in participatory technology development for identifying new
15

varieties (Tripp 1997). Several of these groups received considerable training and assistance forsmall-scale seed production and were able to sell seed of these varieties in local shops and markets.Similar efforts were carried out in Zambia (Tripp 1997).
The public sector (the national agricultural research system) will continue to play an important rolein producing source seed of modern varieties for small-scale seed producers, who in turn have to beable to pay for the full cost of developing the source seed. One of the dilemmas of contract seedmultiplication is that only farmers with sufficient resources at their disposal can participate.
Another important issue is that an official agency needs to be involved with seed quality andcontrol, and small-scale seed producers need to pay the full cost of seed certification. One element ofquality control is seed conditioning and storage, which implies that small-scale producers needaccess to specialized equipment and facilities. In some cases, small-scale seed producers have rentedstate-owned processing facilities. There is a need for the construction of storage structures.
Finally, a marketing and distribution strategy needs to be developed to assist farmers in selling theirproducts (Rohrbach et al. 1997). One of the major weaknesses of the organizations that have set upsmall-scale seed provision is that not all of them had the time and resources to develop thenecessary technical capabilities for organizing seed production and distribution. Also, they did notalways test the adaptability of the varieties to the local environment. They often worked with thebetter-off farmers and created new structures instead of building on existing structures(Tripp 1997).2
3.3 Policies and Institutions3.3.1 Seed legislation. In 1997, Ethiopia enacted seed legislation to devise seed transactionmechanisms, ensure that farmers had access to quality seed, protect and promote the country’s seedresources, and guard the interests of seed users/farmers, originators, and traders.
Many countries explicitly restrict the types of institutions allowed to operate in the seed sector.Sometimes implicit restrictions exist as well; for example, NGOs have often been discouraged fromparticipating in the seed sector, aside from providing emergency aid, although they could play animportant role in strengthening the small-scale seed sector.
In Ethiopia, formal and informal institutions can be involved in seed multiplication, as long as theyfulfill the criteria set by NSIA. The formal institutions involved are Pioneer-Hybrid Seeds, EthiopiaP.C. Ltd., and ESE. In the informal sector, there is a program initiated by the NSIA with financialassistance from the World Bank and the International Fund for Agricultural Development (IFAD).This is a five-year seed system development project, which includes farmer-based seed productionand marketing schemes in seven regional states. The Swedish government supports anotherprogram, which is aimed at promoting seed multiplication and marketing by farmers in Amhara.
16
2 For a discussion of experiences with alternative seed supply practices in Ghana and Tanzania, see Tripp (1997) and Mdruma (1998).

3.3.2 Variety registration. The NVRC, under the auspices of NSIA, is responsible for varietyregistration and comprises members from EARO, NSIA, ESE, AUA, Genetic Resource Conservationand Research Institute (GRCRI), MOA, Coffee and Tea Development Authority (CTDA), AwassaCollege of Agriculture, and others when deemed necessary.
The team leader of NVRC and other concerned researchers consult with appropriate scientists andextension and on-farm research personnel to prepare a proposal for promising varieties. The varietyshould be tested for yield, disease resistance, and other important characteristics for a minimum oftwo to three years in regional or national variety trials at three to five locations. Promising varietiesare promoted to farm verification trials. The breeder applies to the NVRC for his/her variety to beevaluated for release during the same season. The candidate varieties are planted with establishedlocal or improved cultivars in plots of at least 100 m2 at two to three sites. During the anticipatedyear of release, the varieties are verified both on-station and on-farm by the NVRC.
The NVRC appoints a subcommittee composed of its own members and other relevant specialists toreport on varietal performance after examining performance data submitted by the breeder andfield performance evaluation. The reports cover the performance evaluation, field performanceevaluation, general comments, and recommendations. A maximum of three varieties per crop areproposed for release. The proposal for variety release should be submitted to the committeechairman by 30 May of each year and decisions reached by the committee are reported at the NVRCin April the following year. A new variety should be assigned a short and a permanent designationby the breeder/team leader after it has been approved for release. The breeder or institutionresponsible for developing a variety is also expected to maintain and supply an appropriatequantity of the breeder and pre-basic seed for replenishing and restoring commercial seed of thevariety to the desired genetic purity.
The strengths of the current varietal release procedures are the clear regulations and guidelines forvariety evaluation and release. The weaknesses, according to NSIA, are that breeders are not strictlyfollowing the guidelines and do not use the latest released varieties as a standard check.Furthermore, the evaluations do not take place at the appropriate stage of plant growth. Finally,there is no independent variety testing and release institute.
3.3.3 Seed certification. Seed certification is a new activity carried out by NSIA. The main objectiveof this procedure is to test the eligibility of the variety for multiplication and to check thecompliance with the established seed and field standards. As yet there is no quality controlprocedure.
3.3.4 Seed price policy. The long-term viability of small-scale seed provision relies on governmentintervention in price setting, with the result that official seed prices do not reflect the full cost ofproduction. Another aspect of government intervention is the tying of agricultural subsidies andcredit programs to the use of publicly bred improved seed, which can artificially promote its use butrestrict the viability of small-scale seed provision (Tripp 1997).
3.3.5 Plant breeders’ rights. At the time this paper was written, there are no policies concerningplant breeders’ rights in the country.
17
4.0 Demographic and Socioeconomic Characteristics
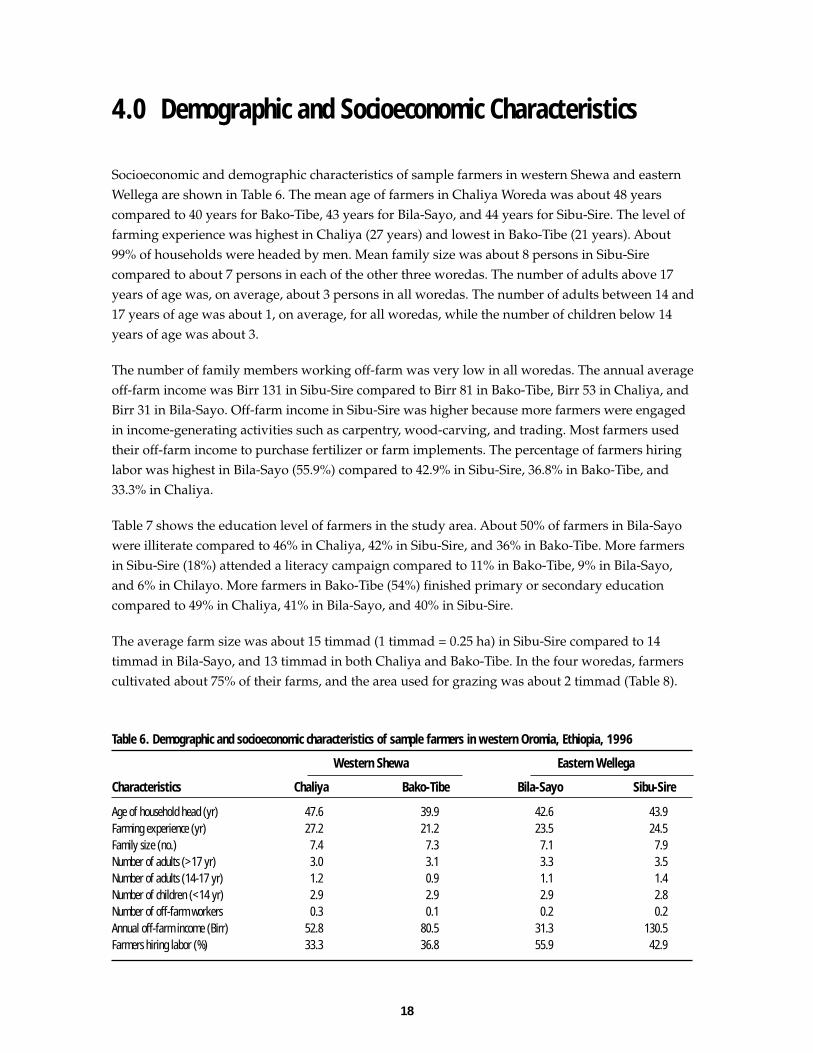
Socioeconomic and demographic characteristics of sample farmers in western Shewa and easternWellega are shown in Table 6. The mean age of farmers in Chaliya Woreda was about 48 yearscompared to 40 years for Bako-Tibe, 43 years for Bila-Sayo, and 44 years for Sibu-Sire. The level offarming experience was highest in Chaliya (27 years) and lowest in Bako-Tibe (21 years). About99% of households were headed by men. Mean family size was about 8 persons in Sibu-Sirecompared to about 7 persons in each of the other three woredas. The number of adults above 17years of age was, on average, about 3 persons in all woredas. The number of adults between 14 and17 years of age was about 1, on average, for all woredas, while the number of children below 14years of age was about 3.
The number of family members working off-farm was very low in all woredas. The annual averageoff-farm income was Birr 131 in Sibu-Sire compared to Birr 81 in Bako-Tibe, Birr 53 in Chaliya, andBirr 31 in Bila-Sayo. Off-farm income in Sibu-Sire was higher because more farmers were engagedin income-generating activities such as carpentry, wood-carving, and trading. Most farmers usedtheir off-farm income to purchase fertilizer or farm implements. The percentage of farmers hiringlabor was highest in Bila-Sayo (55.9%) compared to 42.9% in Sibu-Sire, 36.8% in Bako-Tibe, and33.3% in Chaliya.
Table 7 shows the education level of farmers in the study area. About 50% of farmers in Bila-Sayowere illiterate compared to 46% in Chaliya, 42% in Sibu-Sire, and 36% in Bako-Tibe. More farmersin Sibu-Sire (18%) attended a literacy campaign compared to 11% in Bako-Tibe, 9% in Bila-Sayo,and 6% in Chilayo. More farmers in Bako-Tibe (54%) finished primary or secondary educationcompared to 49% in Chaliya, 41% in Bila-Sayo, and 40% in Sibu-Sire.
The average farm size was about 15 timmad (1 timmad = 0.25 ha) in Sibu-Sire compared to 14timmad in Bila-Sayo, and 13 timmad in both Chaliya and Bako-Tibe. In the four woredas, farmerscultivated about 75% of their farms, and the area used for grazing was about 2 timmad (Table 8).
18
Table 6. Demographic and socioeconomic characteristics of sample farmers in western Oromia, Ethiopia, 1996
Western Shewa Eastern Wellega
Characteristics Chaliya Bako-Tibe Bila-Sayo Sibu-Sire
Age of household head (yr) 47.6 39.9 42.6 43.9Farming experience (yr) 27.2 21.2 23.5 24.5Family size (no.) 7.4 7.3 7.1 7.9Number of adults (>17 yr) 3.0 3.1 3.3 3.5Number of adults (14-17 yr) 1.2 0.9 1.1 1.4Number of children (<14 yr) 2.9 2.9 2.9 2.8Number of off-farm workers 0.3 0.1 0.2 0.2Annual off-farm income (Birr) 52.8 80.5 31.3 130.5Farmers hiring labor (%) 33.3 36.8 55.9 42.9

Most farmers in the four woredas cultivated their own land (Table 9). In Bako-Tibe, about 24% offarmers rented land, while less than 10% of farmers in each of the other woredas rented land. InSibu-Sire, about 42% of farmers sharecropped their land compared to 36% in Chaliya, 34% in Bako-Tibe, and 18% in Bila-Sayo. Inputs contributed by the landowner and the sharecropper are shown inTable 10.
The average number of oxen owned was about 3 in all woredas (Table 11). The average number ofcows owned was highest in Bila-Sayo. The average number of poultry owned was 5 in both Bila-Sayo and Sibu-Sire and 3 in both Chaliya and Bako-Tibe. The number of goats and sheep ownedwas low in all woredas.
19
Table 8. Land use in western Oromia, Ethiopia, 1996
Western Shewa Eastern WellegaLand usearea (timmad) Chaliya Bako-Tibe Bila-Sayo Sibu-Sire
Total farm size 12.6 12.7 14.1 15.4Cultivated 9.4 9.3 10.7 11.6Grazing 2.6 1.8 2.3 2.4Fallow 0.1 0.5 0.7 1.2Other 0.5 0.5 0.4 0.2
Table 9. Land tenure in western Oromia, Ethiopia, 1996
Western Shewa Eastern Wellega
Chaliya Bako-Tibe Bila-Sayo Sibu-SireTenure type (%) (%) (%) (%)
Farmer’s land 93.9 88.2 91.2 84.4Family/farmer’s land 0.0 11.8 0.0 2.6Family land 0.0 7.9 5.9 6.5Sharecropped land 36.4 34.2 17.6 41.6Rented land 9.1 23.7 2.9 5.2
Table 11. Livestock ownership by sample farmers inwestern Oromia, Ethiopia, 1996
Western Shewa Eastern Wellega
Livestock Chaliya Bako-Tibe Bila-Sayo Sibu-Sire
Poultry 3.5 2.9 5.4 4.9Goats 0.2 0.5 0.0 0.9Sheep 0.1 0.1 0.3 0.7Cows 4.4 5.8 7.1 5.4Oxen 2.6 2.6 3.2 2.8
Table 10. Details of sharecropping arrangements, westernOromia, Ethiopia, 1996
Inputs contributed by landownerLand 30%Fertilizer 15%Seed 20%Labor 20%Oxen 15%
Inputs contributed by sharecropperFertilizer 25%Seed 25%Labor 30%Oxen 20%
Percentage of sharecroppers sharing harvest equally with landownerChaliya 75%Bako-Tibe 88%Bila-Sayo 83%Sibu-Sire 88%
Table 7. Education level of sample farmers in westernOromia, Ethiopia, 1996
Western Shewa Eastern Wellega
Chaliya Bako-Tibe Bila-Sayo Sibu-SireEducation (%) (%) (%) (%)
None 45.5 35.5 50.0 41.6Literacy campaign 6.1 10.5 8.8 18.2Elementary 36.4 35.5 32.4 31.2Secondary 12.1 18.4 8.8 9.1

5.0 Maize Cultivars Grown andFarmers’ Seed Sources
5.1 Cultivars GrownTable 12 shows some agronomic traits of maize cultivars that were released in western Oromia.Smallholders grew local maize as well as improved maize developed and popularized by BRC, such asBH-660, BH-140, BH-540, Beletech, and Kuleni. Altogether, sample farmers from the four woredas grewabout 16 cultivars (Table 13). A shift towards newly released maize hybrids, particularly BH-660, hasbeen observed in all woredas.
The preferred maize cultivars are shown in Table 14. Reasons for farmers’ preferences—which rangedfrom a cultivar’s performance in the field to its end uses for home consumption—are listed in Table 15.
5.2 Seed Sources, Prices, and RatesIn 1996/97, most farmers planted maize seed saved from their previous harvest (Table 16). About 59% offarmers in Chaliya, Bila-Sayo, and Sibu-Sire planted their own seed compared to 49% in Bako-Tibe. Thenext most common source of seed in 1996/97 was MOA for Bila-Sayo (33.9%), Sibu-Sire (25.5%), Bako-Tibe (24.8%), and Chaliya (23.1%). Additional seed sources included other farmers, local markets, orsharecroppers. Over 90% of the seed obtained from MOA was hybrid, while most of the maize seedexchanged with other farmers was of local varieties. The price of maize seed purchased from MOA wasabout Birr 6/kg in Chaliya and Bila-Sayo, and about Birr 5/kg in Bako-Tibe and Sibu-Sire.
20
Table 12. Agronomic traits of maize cultivars released in western Oromia
Variety Type Plant height (cm) Yield (t/ha) Maturity (days) Year of release
BH-660BH-140BH-540Phb-3253Phb-3435BeletechKuleniGuttoKenyaIsraelJimma-BakoAbo-BakoBcShashemeneBurrieArabaJiruOromeDima
HybridHybridHybridHybridHybrid
Improved OPVImproved OPVImproved OPVImproved OPVImproved OPVImproved OPVImproved OPVImproved OPVImproved OPV
LocalLocalLocalLocalLocal
290250240200200272262170320330330250330330330330330160330
9.28.38.47.5NR7.36.54.06.04.07.46.06.64.04.04.04.02.04.0
165140145140140150150126165175165150165175175175175125175
19931988199519961996199019951988197819781970s19861975------
Note: NR = Not released but grown by farmers (see Table 13).

21
Table 13. Maize cultivars grown by farmers in western Oromia, Ethiopia, 1992 and 1996
Western Shewa Eastern Wellega
Chaliya (%) Bako-Tibe (%) Bila-Sayo (%) Sibu-Sire (%)
Variety 1992 1996 1992 1996 1992 1996 1992 1996
BH-660 0.0 26.3 0.0 23.2 0.0 27.1 0.0 26.5BH-140 0.0 7.9 1.4 13.1 0.0 2.1 0.0 2.0Phb-3253 0.0 0.0 0.0 0.0 0.0 2.1 0.0 0.0Phb-3435 0.0 0.0 0.0 0.0 0.0 4.2 0.0 1.0Beletech 0.0 2.6 1.4 2.0 0.0 4.2 0.0 0.0Kuleni 0.0 0.0 0.0 0.0 0.0 0.0 0.0 0.0Shashemene 56.3 36.8 45.2 26.3 9.1 10.4 11.6 10.2Burrie 15.6 13.2 9.6 5.1 42.4 25.0 40.6 25.5Kenya 0.0 0.0 20.5 11.1 18.2 8.3 33.3 25.5Orome 3.1 2.6 1.4 2.0 6.1 2.1 5.8 4.1Guto 0.0 0.0 0.0 2.0 0.0 0.0 0.0 0.0Israel 0.0 0.0 0.0 0.0 3.0 2.1 1.4 1.0Jiru 12.5 5.3 13.7 6.1 12.1 8.3 5.8 4.1Arabe 12.5 2.6 4.1 2.0 0.0 0.0 0.0 0.0Diimaa 0.0 0.0 1.4 0.0 0.0 0.0 0.0 0.0Other 0.0 2.6 1.4 7.1 9.1 4.2 1.4 0.0
Note: BH-660, BH-140, Phb-3253, and Phb-3435 are hybrids, and the others are OPVs (see Table 12).
Table 14. Preferred maize cultivars in westernOromia, 1996
Western Shewa Eastern Wellega
Chaliya Bako-Tibe Bila-Sayo Sibu-SireVariety (%) (%) (%) (%)
BH-660 48.1 42.6 45.2 35.8Shashemene 18.5 16.2 3.2 10.4BH-140 7.4 11.8 6.5 1.5Burrie 11.2 2.9 12.9 20.9Kenya 0.0 8.8 16.1 20.9Jiru 3.7 5.9 6.5 6.5Beletech 3.7 4.4 3.2 0.0Phb3435 0.0 0.0 6.5 1.5Orome 3.7 0.0 0.0 4.5Araba 3.7 2.9 0.0 0.0Other 0.0 4.4 0.0 0.0
Table 15. Reasons for farmers’ preference for mostpopular maize cultivars, western Oromia, Ethiopia, 1996
Region, variety, andreason for preference Percent of farmers
Western Shewa: ChaliyaBH-660 48.1
High yield 36.7Seed size 16.7Early maturity 10.0Lodging resistance 10.0Taste in injera 10.0
Shashemene 18.5Taste in injera 33.3Seed size 25.0High yield 16.7
Western Shewa: Bako-TibeBH-660 42.6
High yield 32.8Lodging resistance 15.6Early maturity 9.4
Shashemene 16.2Taste in injera 29.4High yield 17.6Seed size 11.8
Table 15. Cont'd.

22
Significantly more farmers in Bako-Tibe (69.3%)supplied maize seed to other farmers comparedto Bila-Sayo (44.1%), Sibu-Sire (44%), and Chaliya(36.4%) (χ2= 15.0;p<0.01). In Chaliya, farmersprovided seed free of charge (46.2%) or barteredfor seed with grain (46.2%). Similarly, in Sibu-Sirefarmers bartered maize seed for grain (40.7%) orprovided maize seed free of charge (38.9%). InBako-Tibe, farmers bartered maize seed for grain(68.2%), while in Bila-Sayo farmers barteredmaize seed (41.2%) or sold maize seed to otherfarmers (29.4%). All farmers bartered 1 kg ofmaize seed for 1 kg of maize grain.
Farmers’ opinions of the advantages anddisadvantages of obtaining seed from otherfarmers and the Ministry of Agriculture (thesecond two most important seed sources after“own seed”) are listed in Table 17.
Farmers in the four woredas used their ownresources to purchase improved maize seed.Distance traveled to purchase maize seed differedconsiderably across woredas (Table 18). About75% and 64% of farmers in Chaliya and Bako-Tibe, respectively, traveled less than 5 km, while73% and 62% of farmers in Bila-Sayo and Sibu-Sire, respectively, traveled more than 5 km.
About 58% of farmers in Chaliya had problemsobtaining improved maize seed compared to 36%in Bako-Tibe and 38% in Bila-Sayo and Sibu-Sire.The main problems were high seed price andunavailability. The price of maize seed from theMOA was Birr 610/100 kg in Chaliya comparedto Birr 580/100 kg in Bila-Sayo and Birr 530/100kg in Bako-Tibe and Sibu-Sire, whereas seed
bought from other farmers or the local market was about Birr 50-80/100 kg. This price differs becauseMOA sold improved hybrids and OPVs, whereas the local market and farmers sold local varieties.
In Bako-Tibe, about 44% of farmers reported the unavailability of seed to be an important problemcompared to 33% in Chaliya, 25% in Bila-Sayo, and 16% in Sibu-Sire. Time of availability was also animportant constraint on the use of improved seed. About 53% and 52% of farmers in Bako-Tibe andBila-Sayo, respectively, did not get their seed at the right time compared to 27% for Chaliya and 12%for Sibu-Sire.
Table 15. Cont'd.
Region, variety, andreason for preference Percent of farmers
Eastern Wellega: Bila-SayoBH-660 45.2
High yield 25.0Taste in injera 15.9Lodging resistance 11.4Seed size 9.1
Kenya 16.1Disease resistance 30.8Early maturity 15.4Taste in injera 15.4Sweetness in beer 15.4
Eastern Wellega: Sibu-SireBH-660 35.8
High yield 32.4Lodging resistance 18.9Early maturity 10.8Seed color 9.5
Kenya 20.9Taste in injera 22.7Early maturity 15.9Seed size 13.6Taste in bread 11.4
Burrie 20.9Disease resistance 20.0Taste in injera 17.1Seed size 14.3Sweetness in beer 11.4
Table 16. Farmers’ sources of maize seed in westernOromia, Ethiopia, 1996/97
Western Shewa Eastern Wellega
Chaliya Bako-Tibe Bila-Sayo Sibu-SireSeed source (%) (%) (%) (%)
Own 59.0 48.6 58.9 59.1Other farmers 10.2 20.1 5.4 10.0Local market 2.6 3.7 1.8 1.8MOA 23.1 24.8 33.9 25.5Sharecropper 2.6 0.9 0.0 1.8Other 2.6 1.8 0.0 1.8

Most farmers reported that they were able tobuy the required quantity of seed.
The seed rate for improved maize in 1996 wasabout 6 kg/timmad in Chaliya, about5.5 kg/timmad in Bako-Tibe and Bila-Sayo, and5 kg/timmad in Sibu-Sire. In 1996, the seed rate forlocal varieties was about 6.5 kg/timmad forfarmers in Chaliya and Sibu-Sire, 6.3 kg/timmad inBila-Sayo, and about 5.3 kg/timmad in Bako-Tibe.
5.3 Farmers’ Sources of Informationon Improved Maize Seed
In Bila-Sayo (78.3%) and Sibu-Sire (87.5%),extension was the most important source ofinformation on improved maize seed (Table 19).Extension and other farmers were the mostimportant sources of information for 68.4% and26.3% of farmers in Chaliya, respectively, and56.7% and 31.7% of farmers in Bako-Tibe,respectively.
23
Table 17. Advantages and disadvantages of acquiring seedfrom other farmers and the Ministry of Agriculture, westernOromia, Ethiopia, 1996
Region and seed acquisition strategy Percent of farmers
Western Shewa: ChaliyaAdvantages of acquiring seed from other farmers
Fair price 30.4Right quantity available 17.4Quality 17.4Timely availability 8.7
Disadvantages of acquiring seed from other farmersPoor quality 35.0No credit to purchase 25.0
Advantages of acquiring seed from MOAQuality 34.8Right quantity available 26.1
Disadvantages of acquiring seed from MOAHigh price 35.0
Western Shewa: Bako-TibeAdvantages of acquiring seed from other farmers
Right quantity available 34.9Timely availability 18.6Accessible seed source 16.3Quality 15.1
Disadvantages of acquiring seed from other farmersPoor quality 29.0No credit to purchase 25.0
Advantages of acquiring seed from MOARight quantity available 34.5Quality 27.3
Disadvantages of acquiring seed from MOAHigh price 40.7Right quantity not available 14.8
Eastern Wellega: Bila-SayoAdvantages of acquiring seed from other farmers
Timely availability 30.8Right quantity available 30.8Credit to purchase 26.9
Disadvantages of acquiring seed from other farmersPoor quality 45.0No credit to purchase 20.0
Advantages of acquiring seed from MOAQuality 43.8Credit to purchase 25.0Right quantity available 21.9
Disadvantages of acquiring seed from MOAHigh price 51.6Untimely seed delivery 16.1
Eastern Wellega: Sibu-SireAdvantages of acquiring seed from other farmers
Credit to purchase 26.2Good price 21.4Timely availability 21.4
Disadvantages of acquiring seed from other farmersPoor quality 50.0No credit to purchase 20.0
Advantages of acquiring seed from MOAQuality 38.1Credit to purchase 25.4Right quantity available 25.4
Disadvantages of acquiring seed from MOAHigh price 75.0
Table 18. Distance traveled by farmers to purchase seed inwestern Oromia, Ethiopia, 1996
Western Shewa Eastern Wellega
Chaliya Bako-Tibe Bila-Sayo Sibu-SireDistance (%) (%) (%) (%)
Same village 37.5 29.8 4.5 17.2<5 km 37.5 34.0 22.7 20.75-10 km 12.5 23.4 31.8 20.7>10 km 12.5 12.8 40.9 41.4
Table 19. Farmers’ sources of improved maize seedinformation in western Oromia, Ethiopia, 1996
Western Shewa Eastern Wellega
Chaliya Bako-Tibe Bila-Sayo Sibu-SireDistance (%) (%) (%) (%)
Extension 68.4 56.7 78.3 87.5Radio 5.3 5.0 0.0 3.1Other farmers 26.3 31.7 8.7 6.3Other 0.0 6.7 13.0 3.1

6.0 Maize Production Practices
6.1 Increased Use of ImprovedMaize Seed
As mentioned previously, the maize cultivarsthat farmers grew changed dramaticallybetween 1992 and 1996 (Table 20). In 1992, of allfarmers sampled, only 4% in Bako-Tibe grewimproved maize cultivars. In 1996, about 56% offarmers in Bila-Sayo grew improved maizehybrids or OPVs, compared to 49% in Bako-Tibe, 46% in Chaliya, and 38% in Sibu-Sire.Higher yield was the main reason that farmersadopted improved cultivars. A second important reason for adopting improved cultivars was thatthey matured earlier than the cultivars previously grown, according to 20% of farmers in Sibu-Sire,6% in Chaliya, 14% in Bako-Tibe, and 15% in Bila-Sayo.
Between 1992 and 1996, the total area under improved maize increased in the four woredas, whilethe total area under local maize decreased (Figures 5 and 6). The growth in improved maize area isalso reflected in production. In 1995, the total production of improved cultivars surpassed the totalproduction of local varieties in the study area (Figures 7 and 8). In 1996, the average production ofimproved cultivars was about four times that of local varieties in Chaliya, Bila-Sayo, and Sibu-Sire,and about three times that of local varieties in Bako-Tibe (Table 21). Improved maize area andproduction are highest in Bako-Tibe, which may be due to the popularizing of hybrids andimproved OPVs by BRC and extension services.
24
Table 20. Use of local/improved maize cultivars in westernOromia, Ethiopia, 1992 and 1996
Western Shewa Eastern Wellega
Chaliya Bako-Tibe Bila-Sayo Sibu-SireCultivar (%) (%) (%) (%)
1992Improved hybrids/OPVs 0.0 4.1 0.0 0.0Local maize 100.0 95.9 100.0 100.01996Improved hybrids/OPVs 45.5 49.4 55.9 37.7Local maize 54.5 50.6 44.1 62.3
01992 1993 1994 1995 1996
50
100
Timma
d 150
200
250
Bako-Tibe
Sibu-Sire
Bila-Sayo
Chaliya
1992 1993 1994 1995 1996
350
400
300
250
200
150
100
50
0
Chaliya
Bila-Sayo
Bako-Tibe
Sibu-Sire
Figure 5. Total area (timmad) under improved maize productionby woreda in western Oromia, Ethiopia,1992-96.
Figure 6. Total area (timmad) under local maize productionby woreda in western Oromia, Ethiopia, 1992-96.

6.2 Fertilizer and PesticidesThe use of fertilizer for maize production byfarmers in western Oromia is shown in Table 22.Most farmers in all four woredas used fertilizer.More farmers applied fertilizer to local maizethan to improved maize. The recommendedfertilizer rate is 100 kg/ha of DAP and 200kg/ha of urea. Farmers in Bila-Sayo appliedabout 94 kg/ha of DAP compared to 87 kg/hain Sibu-Sire, 85 kg/ha in Bako-Tibe, and 83 kg/hain Chaliya. In Sibu-Sire, farmers applied 176 kg/haof urea compared to 172 kg/ha in Bako-Tibe, 160kg/ha in Bila-Sayo, and only 97 kg/ha inChaliya. The main constraint on fertilizer usewas its high price. About 18% of farmers inChaliya used pesticides compared to 13% inBako-Tibe, 12% in Bila-Sayo, and 10% in Sibu-Sire.
25
Table 21. Average production of local and improved maizein western Oromia, Ethiopia, 1996
Western Shewa Eastern Wellega
Chaliya Bako-Tibe Bila-Sayo Sibu-Sire
Improved maize (qt) 35.7 33.2 40.1 38.2Local maize (qt) 8.5 13.4 10.5 10.3
Table 22. Fertilizer use for maize production in westernOromia, Ethiopia, 1996
Western Shewa Eastern Wellega
Chaliya Bako-Tibe Bila-Sayo Sibu-Sire(%) (%) (%) (%)
Use of fertilizer forMaize production 78.1 97.4 88.2 78.9Improved maize 51.9 54.3 53.3 61.2Local maize 71.9 82.4 60.7 80.3Improved and local maize 45.8 45.7 46.4 29.6
Reason for not using fertilizerLack of awareness 0.0 50.0 0.0 12.8High price 66.7 50.0 40.0 62.5Unavailability 11.1 0.0 40.0 0.0Late delivery 22.2 0.0 0.0 6.3Other 0.0 0.0 0.0 18.8
1992 1993 1994 1995 1996
1400
1200
1000
800
600
400
200
0
Chaliya
Bila-Sayo
Bako-Tibe
Sibu-Sire
Quint
als
1992 1993 1994 1995 1996
700
800
600
500
400
300
200
100
0
Chaliya
Bila-Sayo
Bako-Tibe
Sibu-Sire
Quint
als
Figure 7. Total production (quintals) of improved maizevarieties by woreda in western Oromia, Ethiopia, 1992-96.
Figure 8. Total production (quintals) of local maize varietiesby woreda in western Oromia, Ethiopia, 1992-96.

6.3 Farmers’ Access to Informationfor Maize Production
Farmers’ access to information related to maizeproduction is shown in Table 23. About 38% offarmers in Bila-Sayo attended a farmer field dayor demonstration trial compared to 33% inChaliya, 31% in Sibu-Sire, and 28% in Bako-Tibe.In Bila-Sayo, 12% of farmers attended a farmers’training course compared to less than 10% of thefarmers in the other woredas.
Twenty-three percent of farmers in Sibu-Sire owned a radio compared to 18% in both Bako-Tibe andBila-Sayo and 15% in Chaliya. Most farmers who owned a radio in Chaliya (75%) listened toagricultural education programs compared to 41% in Sibu-Sire, 38% in Bako-Tibe, and 30% in Bila-Sayo.
An extension agent visited 53% of farmers in Bila-Sayo, 31% in Bako-Tibe, 30% in Chaliya, and 40% inSibu-Sire. The farmers were visited during plowing, planting, weeding, and harvesting. The averagenumber of extension visits during the cropping season was 2.4 for Bila-Sayo, 1.6 for Sibu-Sire, 1.2 forChaliya, and 0.9 for Bako-Tibe.
7.0 Farmers’ Management of Cultivars and Seed
7.1 Varietal ReplacementA farmer’s decision to change an adopted cultivar is termed “varietal replacement,” whereas thedecision to obtain fresh stock of a variety that they already grow is termed “seed renewal.” There arevarious methods to measure the rate at which farmers replace cultivars. In this study, we have used theweighted average age (WA) because it is simple and unambiguous (Brennan and Byerlee 1991). Thismeasure is based on the average age of varieties grown by farmers in a given year (measured in yearssince release), weighted by the area planted to each variety in that year. This measure, WAt, is computedfor a given year, t, as follows:
where:
Pit = the proportion of area sown to variety i in year t, andRit = the number of years (at time t) since the release of variety i.
In western Oromia in 1996, the weighted average age of maize cultivars was about 16 years. To put thisfigure somewhat into perspective, it is helpful to know that in Kenya, the weighted average age ofmaize cultivars was 10 years and that large-scale farmers had a smaller WA (9 years) than small-scalefarmers (11 years) (Hassan et al. 1998).3
Table 23. Farmers’ access to information on maizeproduction in western Oromia, Ethiopia, 1996
Western Shewa Eastern Wellega
Source of Chaliya Bako-Tibe Bila-Sayo Sibu-Sireinformation (%) (%) (%) (%)
Attended field day 33.3 27.6 38.2 31.2Attended training course 9.1 8.0 11.8 5.3Received extension visit 30.3 30.7 52.9 40.3Owned a radio 15.2 18.4 17.6 23.4
3 Similarly Bishaw et al. (1994) found that 21% of wheat farmers saved seed for 6-10 years and 14% saved seed for 11-15 years. In Pakistan, the useful life of awheat variety (before its disease resistance breaks down) averaged five to six years (Heisey 1990) .
26
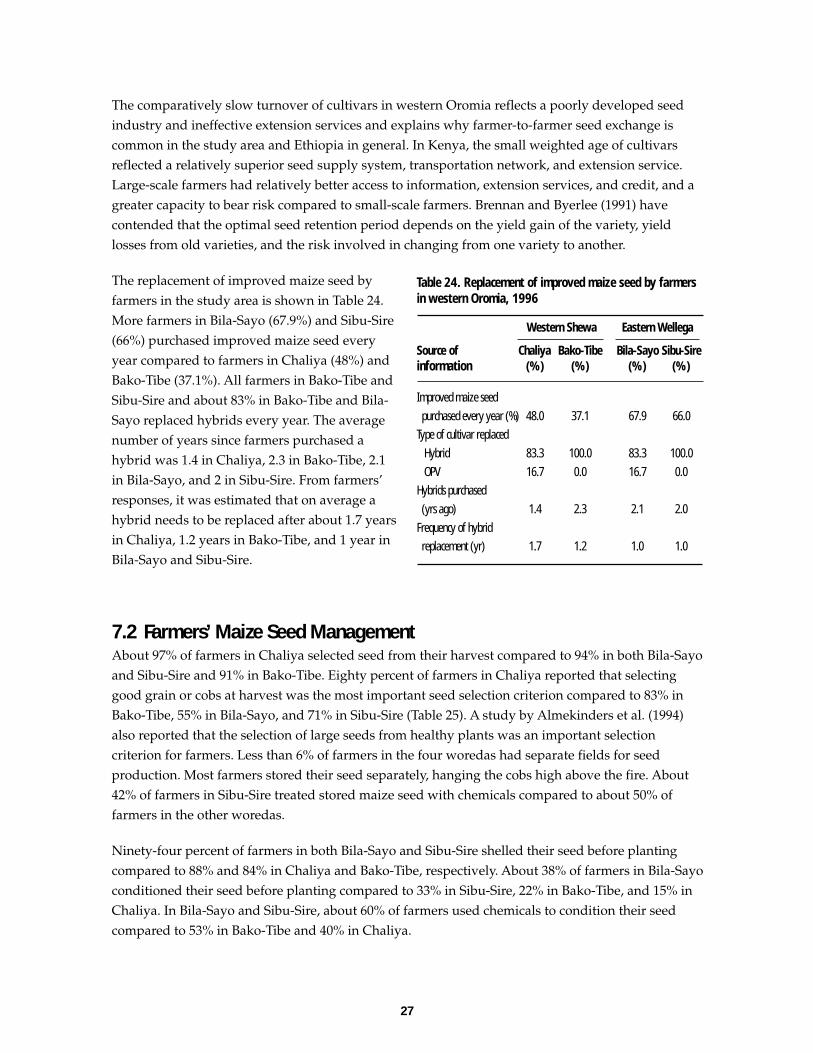
The comparatively slow turnover of cultivars in western Oromia reflects a poorly developed seedindustry and ineffective extension services and explains why farmer-to-farmer seed exchange iscommon in the study area and Ethiopia in general. In Kenya, the small weighted age of cultivarsreflected a relatively superior seed supply system, transportation network, and extension service.Large-scale farmers had relatively better access to information, extension services, and credit, and agreater capacity to bear risk compared to small-scale farmers. Brennan and Byerlee (1991) havecontended that the optimal seed retention period depends on the yield gain of the variety, yieldlosses from old varieties, and the risk involved in changing from one variety to another.
The replacement of improved maize seed byfarmers in the study area is shown in Table 24.More farmers in Bila-Sayo (67.9%) and Sibu-Sire(66%) purchased improved maize seed everyyear compared to farmers in Chaliya (48%) andBako-Tibe (37.1%). All farmers in Bako-Tibe andSibu-Sire and about 83% in Bako-Tibe and Bila-Sayo replaced hybrids every year. The averagenumber of years since farmers purchased ahybrid was 1.4 in Chaliya, 2.3 in Bako-Tibe, 2.1in Bila-Sayo, and 2 in Sibu-Sire. From farmers’responses, it was estimated that on average ahybrid needs to be replaced after about 1.7 yearsin Chaliya, 1.2 years in Bako-Tibe, and 1 year inBila-Sayo and Sibu-Sire.
7.2 Farmers’ Maize Seed ManagementAbout 97% of farmers in Chaliya selected seed from their harvest compared to 94% in both Bila-Sayoand Sibu-Sire and 91% in Bako-Tibe. Eighty percent of farmers in Chaliya reported that selectinggood grain or cobs at harvest was the most important seed selection criterion compared to 83% inBako-Tibe, 55% in Bila-Sayo, and 71% in Sibu-Sire (Table 25). A study by Almekinders et al. (1994)also reported that the selection of large seeds from healthy plants was an important selectioncriterion for farmers. Less than 6% of farmers in the four woredas had separate fields for seedproduction. Most farmers stored their seed separately, hanging the cobs high above the fire. About42% of farmers in Sibu-Sire treated stored maize seed with chemicals compared to about 50% offarmers in the other woredas.
Ninety-four percent of farmers in both Bila-Sayo and Sibu-Sire shelled their seed before plantingcompared to 88% and 84% in Chaliya and Bako-Tibe, respectively. About 38% of farmers in Bila-Sayoconditioned their seed before planting compared to 33% in Sibu-Sire, 22% in Bako-Tibe, and 15% inChaliya. In Bila-Sayo and Sibu-Sire, about 60% of farmers used chemicals to condition their seedcompared to 53% in Bako-Tibe and 40% in Chaliya.
Table 24. Replacement of improved maize seed by farmersin western Oromia, 1996
Western Shewa Eastern Wellega
Source of Chaliya Bako-Tibe Bila-Sayo Sibu-Sireinformation (%) (%) (%) (%)
Improved maize seed purchased every year (%) 48.0 37.1 67.9 66.0Type of cultivar replaced Hybrid 83.3 100.0 83.3 100.0 OPV 16.7 0.0 16.7 0.0Hybrids purchased (yrs ago) 1.4 2.3 2.1 2.0Frequency of hybrid replacement (yr) 1.7 1.2 1.0 1.0
27

7.3 Quality of Seed and Strategies for Improving QualityAbout 83% of farmers in Bako-Tibe reported they had good quality seed compared to 78% in Bila-Sayo, 68% in Sibu-Sire, and 61% in Chaliya. The characteristics of good seed are shown in Table 26.Good grain filling was the most important criterion for farmers in Chaliya (27.8%), Bako-Tibe(33.3%), Bila-Sayo (36.4%), and Sibu-Sire (38.0%). A second important criterion was germination ratefor 25% of farmers in Sibu-Sire, 22% in both Chaliya and Bila-Sayo, and 21% in Bako-Tibe.
When seed quality was poor, farmers used a number of strategies to find superior seed. Thirty-threepercent of farmers in Bila-Sayo made sure to obtain seed from a reliable source compared to 21% inChaliya, 20% in Sibu-Sire, and 15% in Bako-Tibe. The remaining farmers shifted to another cultivar.About 63% of farmers in Bila-Sayo reported that selecting seed at harvest was an important methodfor improving seed quality compared to 45% in Bako-Tibe, 40% in Sibu-Sire, and 38% in Chaliya.Post-harvest treatment of seed with chemicals was another important method for farmers to ensuregood seed for planting.
Table 25. Maize seed management by farmers in western Oromia, Ethiopia, 1996
Western Shewa Eastern Wellega
Chaliya (%) Bako-Tibe (%) Bila-Sayo (%) Sibu-Sire (%)
Select seed 97.0 90.7 94.1 93.5Selection criterion
Good plants in field 2.5 0.0 5.3 2.2Good ears at harvest 52.5 38.4 34.2 44.9Good ears from gotera(i.e., local storage structure) 2.5 3.5 5.3 7.9Good grain at harvest 27.5 44.2 21.1 25.8Good grain from gotera 0.0 4.7 7.9 3.4Weevil-free seed from gotera 15.0 9.3 26.3 15.7
Store seed separately 97.0 86.8 94.1 92.2Method of storage
Above fire in cobs 87.5 94.8 100.0 95.5In tree with husk 9.4 5.2 0.0 4.5Underground 3.1 0.0 0.0 0.0
Seed treatment 41.6 50.0 50.0 51.5Shell seed separately 88.0 84.0 94.0 94.0Condition seed before planting 15.0 22.0 38.0 33.0
Table 26. Characteristics of good seed, according to farmers in western Oromia, Ethiopia, 1996
Western Shewa Eastern Wellega
Chaliya Bako-Tibe Bila-Sayo Sibu-SireCharacteristcs (%) (%) (%) (%)
Good grain filling 27.8 33.3 36.4 38.0No impurities 11.1 12.7 10.9 8.3Adapted to local conditions 19.4 13.5 14.5 12.0Disease free 11.1 11.1 14.5 14.8High germination rate 22.2 20.6 21.8 25.0Other 8.3 8.7 1.8 1.9
28

8.0 Tobit Analysis of Land Allocation to Improved Maize
Feder et al. (1985) defined adoption as the degree of use of a new technology in a long-runequilibrium when a farmer has all of the information about the new technology and its potential.Adoption at the farm level reflects the farmer’s decision to incorporate a new technology into theproduction process. On the other hand, aggregate adoption is the process of spread or diffusion of anew technology within a region. Therefore, a distinction exists between adoption at the individualfarm level and aggregate adoption within a targeted region. If an innovation is modifiedperiodically, the adoption level may not reach equilibrium. This situation requires the use ofeconometric procedures that can capture both the rate and the process of adoption. The rate ofadoption is defined as the proportion of farmers who have adopted a new technology over time.The incidence of adoption is the percentage of farmers using a technology at a specific point in time(e.g., the percentage of farmers using fertilizer). The intensity of adoption is defined as the aggregatelevel of adoption of a given technology (e.g., the number of hectares planted with improved seed).
The tobit model results on the mean proportion of land allocated to hybrid maize are presented inTable 27. The tobit model was used because the proportion of land allocated to improved maize is acontinuous variable but truncated between zero and one. The use of ordinary least squares willresult in biased estimates (McDonald and Moffitt 1980). In the table, δEY/δXi shows the marginaleffect of an explanatory variable on the expected value (mean proportion) of the dependent variable,
Table 27. Tobit model estimates for land allocation to improved maize hybrids
Parameter Coefficient Wald statistic δEY/δXi δEY*/δXi δF(z)/δXi
Constant -1.4502 4.69*** -0.697225 -0.610479 -1.052637Farmer’s experience -0.0012364 0.16 -0.000594 -0.000520 -0.000897Education (dummy) 0.43737 2.12** 0.210278 0.184116 0.317468Extension (no.) 0.1611 4.03*** 0.077453 0.067817 0.116935Field day (dummy) 0.38603 1.97** 0.185595 0.162504 0.280202Farm size (timmad) -0.017662 1.40 -0.008492 -0.007435 -0.01282Family size (no.) 0.015859 0.66 0.007625 0.006676 0.011511Hired labor (dummy) -0.20916 1.03 -0.100559 -0.088048 -0.15182Livestock (no.) 0.017007 1.18 0.008177 0.007159 0.012345Off-farm income (Birr) 0.00065 2.36** 0.000313 0.000274 0.000472High yield 1.2053 6.16*** 0.579482 0.507385 0.874874Resistance to lodging 0.31996 1.63* 0.153830 0.134691 0.232245Impurity 0.34796 1.63* 0.167292 0.146478 0.252569Seed conditioning 0.068675 0.35 0.033017 0.028909 0.049848Sigma 0.53647Number of samples 219Number of positive observations 90Proportion of positive observations (%) 41.1z-score -0.22f(z) 0.3894Log of likelihood function -121.33Wald chi-square (δi=0) 123.1***
Note: * = significant at p<0.1; ** = significant at p<0.05; *** = significant at p>0.01.
29
δEY*/δXi shows changes in the intensity of adoption with respect to a unit change of anindependent variable among adopters, and δF(z)/δXi is the probability of change amongnonadopters (the probability of adopting improved maize) with a unit change in the independentvariable Xi (Roncek 1992). The Wald chi-square statistic was significant at p<0.01.
Farmers’ education level, the number of extension visits, field days, the amount of off-farmincome, and some technology characteristics (high yield, resistance to lodging, and seed purity)significantly influenced the mean proportion of land allocated to improved maize. The marginaleffect of education on the area under improved maize was 0.21, and education increased theprobability of adoption among nonadopters by 31.7%. Literate farmers are more disposed tounderstand new ideas and concepts provided by extension workers and other informants. Thisunderlines the importance of human capital development in increasing the area under improvedmaize.
The marginal effect of extension on improved maize area was 0.07, and extension increased theprobability of adoption among nonadopters by 11.7%. Extension workers are an importantsupport service for delivering information on improved maize technologies to farmers, and theyalso provide necessary inputs.
The marginal effect of attending a field day on improved maize area was 0.19, and increased theprobability of adoption among nonadopters by 28%.
The marginal effect of off-farm income on improved maize area was 0.0003, and the probability ofadoption among nonadopters increased by 0.04%. Off-farm income enables farmers to make therequired down payment to access credit in kind (seed and fertilizer) at the agriculturaldevelopment offices.
Three technology characteristics significantly influenced the area allocated to improved maize:high yield, resistance to lodging, and seed purity. The marginal effect of farmers’ preference forhigher yields on improved maize area was 0.58, and the probability of adoption amongnonadopters increased by 87.5%. Farmers clearly recognized the yield benefits of hybrids versuslocal varieties. The marginal effect of farmers’ preference for lodging-resistant varieties onimproved maize area was 0.15, and the probability of adoption among nonadopters increased by23.2%. The marginal effect of farmers’ preference for pure seed on improved maize area was 0.17,and the probability of adoption among nonadopters increased by 5%.
The tobit model results of the area allocated to improved OPVs are presented in Table 28. TheWald chi-square statistic was significant at p<0.01. The number of extension visits significantlyinfluenced the probability of adoption of improved OPVs. The marginal effect of extension on thearea allocated to OPVs was -0.08, and extension decreased the probability of adoption amongnonadopters by 6.9%. Extension workers in the woredas encourage farmers to grow improvedhybrids instead of OPVs.
30

9.0 Conclusions and Implications
The farming communities surveyed in four districts of western Shewa and eastearn Wellega zones ofOromia are among the most important maize growers in the country. Farmers in the study area haveincreasingly planted hybrids and improved OPVs rather than local varieties since the economic reformof 1991, which gave more emphasis to agricultural development and the role of small-scale farmers. Toachieve this, the government has strengthened the extension service to better serve small-scale farmers,and this has led to the increased use of improved maize, especially hybrids.
The NSIA estimated the quantity of improved maize seed used in 1996 was 35,120 t, while ESEdistributed about 1,670 t of improved maize seed. This implies that about 5% of the improved seed waspurchased, while the remaining 95% was recycled.
This study has shown that most farmers rely on extension for information on improved maizetechnologies. Farmer-to-farmer seed exchange remains the most important mechanism for the diffusionof improved maize seed and should therefore be strengthened by the government through theprovision of low-interest finance, technical assistance, and publicly bred parent materials. Anotherimportant factor in the adoption of improved maize seed was seed purity. Maize breeding programsshould give equal attention to yield and non-yield characteristics when selecting their best varieties,and the extension system should advise farmers on the characteristics and correct adoption zones ofnewly released maize cultivars.
Table 28. Tobit model estimates for land allocation to improved OPVs
Parameter Coefficient Wald statistic δEY/δXi δEY*/δXi δF(z)/δXi
Constant 0.40443 1.51 0.202626 0.139572 0.166453Farmer’s experience -0.007632 1.16 -0.003824 -0.002634 -0.003141Education (dummy) -0.068113 0.39 -0.034126 -0.023506 -0.028034Extension (no.) -0.16655 3.21*** -0.083444 -0.057478 -0.068548Field day (dummy) -0.36538 1.88 -0.183062 -0.126095 -0.150382Farm size (timmad) 0.0099028 0.90 0.004961 0.003418 0.0040757Family size (no.) 0.026089 1.06 0.013071 0.009004 0.010738Hired labor (dummy) 0.093014 0.52 0.046601 0.032099 0.038282Livestock (no.) -0.021576 1.46 -0.010809 -0.007446 -0.00888Off-farm income (Birr) 0.0000494 0.17 2.4752E-05 1.7048E-05 2.0332E-05High yield 0.11484 0.63 0.057537 0.03963 0.047266Resistance to lodging -0.33869 1.59 -0.169689 -0.116884 -0.139396Impurity -0.25998 1.11 -0.130254 -0.089721 -0.107001Seed conditioning 0.19806 1.03 0.099231 0.068352 0.081517Sigma 0.79239Number of samples 219Number of positive observations 101Proportion of positive observations (%) 46.1z-score -0.1f(z) 0.397Log of likelihood function -195.44Wald chi-square (βi=0) 31.74***
Note: * = significant at p>0.1; ** = significant at p<0.05; *** = significant at p>0.01.
31

32
References
Adesina, A., and M. Zinnah. 1992. Adoption, diffusion, and economic impacts ofmodern mangrove rice varieties in western Africa: Further results from Guineaand Sierra Leone. In Towards a New Paradigm for Farming Systems Research/Extension. Working Paper for the 12th Annual Farming Systems Symposium.East Lansing: Michigan State University. Pp. 443-466.
Almekinders, C.J.M., N.P. Louwaars, and G.H. de Bruijn. 1994. Local seed systems andtheir importance for an improved seed supply in developing countries.Euphytica 78:207-216.
Benti Tolessa, K. Mulatu, L. Wolde, M. Worku, and L. Tulu. 1996. Reflections on thesuccessful achievements of hybrid maize breeding program in Ethiopia. In J.K.Ransom, A.F.E. Palmer, B.T. Zambezi, Z.O. Mduruma, S.R. Waddington, K.V.Pixley, and D.C. Jewell (eds.), Maize Productivity Gains Through Research andTechnology Dissemination. Proceedings of the Fifth Eastern and SouthernAfrica Regional Maize Conference. Addis Ababa, Ethiopia: CIMMYT. Pp. 67-71.
Bishaw, Z., A.J.G. van Gastel, K. Shawel, and Y. Sahlu. 1994. Seed survey in Ethiopia.In: Seed Unit Annual Report. Aleppo, Syria: International Center forAgricultural Research in the Dry Areas (ICARDA).
Brennan, J.P., and D. Byerlee. 1991. The rate of crop varietal replacement on farms:measures and empirical results of wheat. Plant Varieties and Seeds 4:99-106.
CIMMYT. 1988. From Agronomic Data to Farmer Recommendation: An EconomicsTraining Manual. Mexico, D.F.: CIMMYT.
CIMMYT. 1993. The Adoption of Agricultural Technology: A Guide for Survey Design.Mexico, D.F.: CIMMYT.
Cromwell, E. 1997. Local-level seed activities: Opportunities and challenges forregulatory frameworks. In R. Tripp (ed.), New Seed and Old Laws: RegulatoryReform and the Diversification of National Seed Systems. OverseasDevelopment Institute. London: Intermediate Technology Publications.
Cromwell, E. 1996. Governments, Farmers, and Seeds in a Changing Africa. OverseasDevelopment Institute. Wallingford, UK: CAB International.
Dasgupta, B. 1977. Agrarian Change and the New Technology in India. Geneva: UnitedNations Research Institute for Social Development.
Debre Zeit Agricultural Research Center (DZARC). 1995. Forty Years of ResearchExperience, 1955-1995. Addis Ababa, Ethiopia: Institute for AgriculturalResearch (IAR).
Douglas, J.E. 1980. Successful Seed Programs: A Planning and Management Guide.Boulder, Colorado: Westview Press.
Ellis, F. 1993. Peasant Economics, Farm Households and Agrarian Development. WyeStudies in Agricultural and Rural Development. Wye College: UK.
Feder, G., R.E. Just, and D. Zilberman. 1985. Adoption of agricultural innovations indeveloping countries: A survey. Economic Development and Cultural Change33(2): 255-297.
Greene, W.H. 1993. Econometric Analysis. 2nd edition. New York: MacMillan. Pp. 143-146.
Griffiths, I thought P ???initial? E. William, R. Carter Hill, and G.G. Judge. 1993.Learning and Practicing Econometrics. John Wiley. Pp. 417-418.
Hailu Beyene. 1993. The input supply system and technology adoption constraints forwheat production in the Holetta red soil zone of Ethiopia. In W.M. Mwangi, D.Rohrbach, and P. Heisey (eds.), Cereal Grain Policy in the National AgriculturalResearch Systems of Eastern and Southern Africa. Addis Ababa: CIMMYT,Southern African Development Community (SADC), and International Centerfor Research in the Semi-Arid Tropics (ICRISAT). Pp. 36-49
Hailu Gebremariam. 1992. Availability and Use of Seed in Ethiopia. Program SupportUnit. Addis Ababa, Ethiopia: Canadian International Development Agency(CIDA).
Hassan, R.M., K. Njoroge, M. Njore, R. Otsyula, and A. Loboso. 1998. Adoption patternsand performance of improved maize in Kenya. In R.M. Hassan (ed.), MaizeTechnology Development and Transfer: A GIS Application for ResearchPlanning in Kenya. Wallingford, UK: CAB International and CIMMYT.
Heisey, P.W. (ed.). 1990. Accelerating the Transfer of Wheat Breeding Gains toFarmers: A Study of the Dynamics of Varietal Replacement in Pakistan.CIMMYT Research Report No. 1. Mexico, D.F.: CIMMYT.
Jaffee, S., and J. Srivastave. 1994. The roles of the private and public sectors inenhancing the performance of seed systems. The World Bank ResearchObserver 9(1): 97-117. Washington, DC: World Bank.
Maddala, G.S. 1983. Limited Dependent and Qualitative Variables in Econometrics.Cambridge, UK: Cambridge University Press.
Mbiha, E.R. 1993. Effects of government intervention in maize production andmarketing: implications for agricultural marketing and price liberalization inTanzania. Agricultural Economics Analysis and Rural Development 3(2).
McDonald, J.F., and R.A. Moffit. 1980. The uses of tobit analysis. The Review ofEconomics and Statistics 62:318-321.
Mduruma, Z.O. 1998. Lessons, experiences and future challenges of community-based seed production in Tanzania. In Maize Production Technology for theFuture: Challenges and Opportunities. Proceedings of the 6th Eastern andSouthern Africa Regional Maize Conference, 21-25 September 1998, AddisAbaba, Ethiopia. Addis Ababa, Ethiopia: CIMMYT and EARO. Pp. 150-154.
Misra, S.K., D.H. Carley, and S.M. Fletcher.1993. Factors influencing southern dairyfarmers’ choice of milk handlers. Journal of Agricultural and AppliedEconomics 25:197-207.
ODI (Overseas Development Institute). 1990a. Seed Diffusion Mechanisms in SmallFarmer Communities: Lessons from Asia, Africa and Latin America. Networkpaper No. 21. London, UK: ODI.
ODI (Overseas Development Institute). 1990b. The National Seed Systems inSenegal. Network paper No. 13. London, UK: ODI.
ODI (Overseas Development Institute). 1995. Seed Regulatory Frameworks andResource-poor Farmers: A Literature Review. Network Paper No. 51.London, UK: ODI.
Pray, C.E., and B. Ramaswami. 1991. A Framework for Seed Policy Analysis inDeveloping Countries. Washington, DC: International Food Policy ResearchInstitute (IFPRI).
Regassa Ensermu, W. Mwangi, H. Verkuijl, Mohammed Hassena, and ZewdieAlemayehu. 1998. Farmers’ Wheat Seed Sources and Seed Management inChilalo Awraja, Ethiopia. Mexico, D.F.: CIMMYT and Institute of AgriculturalResearch (IAR).
Rohrbach, D.D., Z. Bishaw, and A.J.G. van Gastel (eds.). 1997. Alternative Strategiesfor Smallholder Seed Supply. Proceedings of an International Conference onOption for Strengthening National and Regional Seed Systems in Africa andWest Asia. Andra Pradesh, India: International Center for Research in theSemi-Arid Tropics (ICRISAT).
Roncek, D.W. 1992. Learning more from tobit coefficients: Extending a comparativeanalysis of political protest. American Sociological Review 57:503-507.
Singh, R. 1990. Ethiopia - The Seed Enterprise Development Project (Seed). NetworkPaper No. 14, June, 1990. Agricultural Administration (Research andExtension) Network.
Thiele, G. 1999. Informal potato seed systems in the Andes: Why are they importantand what should we do with them? World Development 27(1): 83-99.
Tripp, R. 1997. Between states and markets: Innovations for small-scale seedprovision. In D.D. Rohrbach, Z. Bishaw, and AJ.G. van Gastel (eds.),Alternative Strategies for Smallholder Seed Supply. Proceedings of anInternational Conference on Options for Strengthening National andRegional Seed Systems in Africa and West Africa, 10-14 Mar 1997, Harare,Zimbabwe. Andhra Pradesh, India: International Center for Research in theSemi-Arid Tropics (ICRISAT). Pp. 195-210.
Wiggins, S., and E. Cromwell. 1995. NGOs and seed provision to smallholders indeveloping countries. World Development 23(3): 413-422.