
IMPACT REPORT 2017 SME FINANCE LOANS FOR GROWTH · LFG fund, launched in September 2016, provides...
32
SME FINANCE LOANS FOR GROWTH IMPACT REPORT 2017
Transcript of IMPACT REPORT 2017 SME FINANCE LOANS FOR GROWTH · LFG fund, launched in September 2016, provides...

SME FINANCE LOANS FOR GROWTH
I M PA CT R E P O RT 2017

Legal Disclaimer This paper contains only general information. Symbiotics is not by means of this paper rendering professional advice or services. The content of this paper is meant for research purposes, with an aim to broaden and deepen the understanding of outcomes measurement. On a few occasions, this paper refers to specific asset managers and collective investment schemes. Such references are made for research purposes only and are not intended as a solicitation or recommendation to buy or sell any specific investment product or services. Similarly, the information and opinions expressed in the text were obtained from audited financial statements in addition to self-reporting sources believed to be reliable and reporting in good faith, reflecting the view of the authors on the state of the industry, but no representation or warranty, expressed or implied, is made as to their accuracy or completeness. Before making any decision or taking any action that may affect your finances or your business, you should consult a qualified professional adviser. Symbiotics shall not be held responsible for any loss whatsoever sustained by any person who relies on this paper. The paper is also meant for distribution only under such circumstances as may be permitted by applicable law. 01.0418
CONTENTS
List of Figures 2 List of Tables 2 Glossary 3
Key Highlights 5 1 Introduction 7 2 Impact Measurement Methodology 9 3 LFG Fund’s Portfolio Outreach 11 4 SME Outcomes 15 a Sample Description 15 b Business Owner Characteristics 16 c Key Outcomes 19
i Employment 19 ii Business Performance 23 iii Financial Inclusion 25 iv Business Challenges 26
Appendices 27 Appendix 1: Dimensions of the Questionnaire 27

LIST OF FIGURES 1 Data Collection Methodology 10 2 Geographic Outreach of LFG 11 3 Social Responsibility Rating Scores per Dimension (LFG Portfolio Weighted Averages) 12 4 GDP per Capita (current US$) 12 5 % of LFG Portfolio by Countries’ Income Levels 13 6 Status & Size of Financial Institutions, % of LFG Portfolio 13 7 Average Loan Size by Country (US$) 15 8 Proportion of Female Ownership by Country 16 9 Age of Business Owners 16 10 Educational Attainment of Business Owners 16 11 Business Sectors 17 12 Proportion of SMEs in Formal Sector 18 13 Distribution of Number of Employees per Enterprise 19 14 Age of Employees 19 15 Characteristics of Employees 19 16 Competitiveness of Wage Rate 20 17 Comparison to Minimum Wage 20 18 Employment Challenges 21 19 DistributionofProfitMargins 23 20 ProfitMarginsbySector 23 21 Types of Assets 24 22 Uses of Bank Accounts 25 23 Sources of Finance 25 24 Business Challenges 26
LIST OF TABLES 1 Working Towards the SDGs 6 2 Banking Penetration Levels, % of Adult Population 12 3 Investees and Sample Size 15 4 Wage Rates by Country 21
2

GLOSSARY
Decent work involves opportunities for work that is productive and delivers a fair income, security in the workplace and social protection for families, better prospects for personal development and social integration, freedom for people to express their concerns, organize and participate in the decisions that affect their lives and equality of opportunity and treatment for all women and men. 1
Emerging and frontier markets are countries which, broadly speaking, are classifiedbytheWorldBankaslow-andmiddle-incomecountries.2
Impact investing isdefinedasinvestmentsmadeintocompanies,organizationsand funds with the intention of generating measurable social and environmental impactalongsideafinancialreturn.3
Small and medium enterprises (SMEs) aredefinedbyvariousmetricsindifferentmarkets.Theseincludeemploymentfigures,revenueturnover,totalassetlevelsorloansizes.Forthepurposeofthisresearch,thelocaldefinitionofanSMEineachmarketasdefinedbyinvesteeswasused,beitbasedonemploymentmeasures or a loan size proxy. Overall, this included SMEs with under 200 employees,and/orloansofaboutUS$1,000-250,000(excludingoutliers). Formal SMEs are those that are declared to the government and pay taxes.
The Sustainable Development Goals (SDGs) are a universal call action to end poverty, protect the planet and ensure that all people enjoy peace and prosperity. These 17 Goals include areas such as climate change, economic inequality, innovation, sustainable consumption, peace and justice, among other priorities.4
1 International Labour Organization. (n.d.). Decent Work. Retrieved from http://www.ilo.org/global/topics/decent-work
2 The World Bank Data. (n.d.) Low & middle income. Retrieved from https://data.worldbank.org/income-level/low-and-middle-income
3 Global Impact Investing Network. (n.d.). What You Need to Know About Impact Investing. Retrieved from https://thegiin.org/impact-investing/need-to-know/
4 United Nations Development Programme. (n.d.). Sustainable Development Goals. Retrieved from http://www.undp.org/content/undp/en/home/sustainable-development-goals.html
3

4

KEY HIGHLIGHTS
This impact report aims to measure the extent to which the Loans for Growth (LFG) fund meets its objectives to foster job creation, employment and entrepreneurshipinemergingandfrontiermarketsthroughSMEfinance.TheLFGfund,launchedinSeptember2016,providesfinancingtoSMEsbyinvestinginlocal,specializedfinancialinstitutions.Oneyearafteritslaunch,thefundisinvestedin37financialinstitutionsacross22countriesworldwide.
Thecurrentreportisthefirstinaseriesoffourannualimpactreports,whichfollowasampleofenterprisesfinancedbytheLFGfund.Theoutcomespresentedin this report (Section 4) are based on primary data, collected through surveys conductedwith506SMEsin12low-andmiddle-incomecountriesin2017. These outcomes will serve as the baseline for the data to be collected in the comingyears.Usingsurveydatafromtheend-clientsofthefund,thisresearchsheds light on a rich and detailed set of SME outcomes, including type of employment,genderofemployees,wagelevels,sourcesoffinancing,andtypeofassets, among others.
5
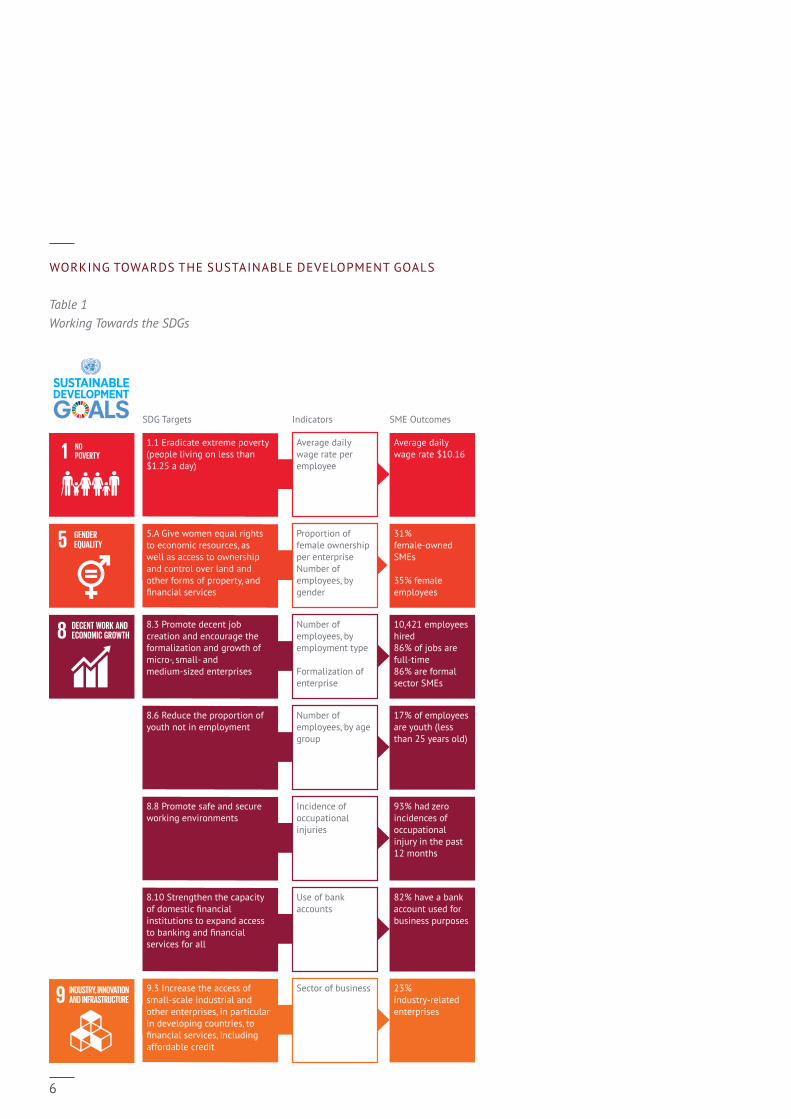
WORKING TOWARDS THE SUSTAINABLE DEVELOPMENT GOALS Table 1 Working Towards the SDGs
1.1 Eradicate extreme poverty (people living on less than $1.25 a day)
SDG Targets Indicators SME Outcomes
Average daily wage rate per employee
Average daily wage rate $10.16
5.A Give women equal rights to economic resources, as well as access to ownership and control over land and other forms of property, and financial services
Proportion of female ownership per enterpriseNumber of employees, by gender
31% female-owned SMEs
35% female employees
8.3 Promote decent job creation and encourage the formalization and growth of micro-, small- and medium-sized enterprises
Number of employees, by employment type
Formalization of enterprise
10,421 employees hired86% of jobs are full-time86% are formal sector SMEs
8.6 Reduce the proportion of youth not in employment
Number of employees, by age group
17% of employees are youth (less than 25 years old)
8.8 Promote safe and secure working environments
Incidence of occupational injuries
93% had zero incidences of occupational injury in the past 12 months
8.10 Strengthen the capacity of domestic financial institutions to expand access to banking and financial services for all
Use of bank accounts
82% have a bank account used for business purposes
9.3 Increase the access of small-scale industrial and other enterprises, in particular in developing countries, to financial services, including affordable credit
Sector of business 23% industry-related enterprises
6
1. INTRODUCTION
The SME Finance Loans for Growth fund (LFG) provides loans to small and medium enterprises (SMEs) in emerging and frontier markets via financialinstitutionsactiveintheSMEsegment.Throughitsloans,LFGaims to support positive social transformation, economic growth and contributetothedevelopmentoflocalfinancialmarkets.
SMEs represent nine out of every ten businesses, account for half of global gross domestic product (GDP), and provide two thirds of jobs worldwide.5However,SMEsareconsideredriskierthanlargerfirms,andthereforetheiraccesstofinanceremainslimited,particularlyinemerging and frontier markets. In 2012, the International Finance Corporation estimated that more than 17 million formal SMEs in emergingmarketsarecredit-constrained.6Thesizeofthefinancinggap for SMEs is estimated to be between US$ 900 billion and US$ 1.1 trillion.7 As a consequence, their growth and employment potential is inhibited.
In an effort to alleviate these credit constraints, Symbiotics launched the LFG fund in September 2016. The LFG fund is a fully subscribed US$50millioninvestmentfund,withafour-year,closed-endedstructure.Thefund’sstructurebenefitsfroma10%first-lossriskprotection,co-financedequallybypublicandprivatefunds,whichisdesignedtoattractgreaterprivatecapitalflowstoinvestmentactivities in emerging markets by guaranteeing lower risk to investors.
The fund aims to achieve the following main objectives:
i tocapturethefinancialandsocialvaluecreationfromfinancialinstitutionsactiveatthebaseofthepyramid,inlow-andmiddle-income economies, working with SMEs;
ii to foster job creation, employment and entrepreneurship, as well as more broadly the democratization of access to capital.
This report aims to assess the extent to which LFG meets these objectives by measuring a detailed set of qualitative and quantitative SME outcomes through direct surveys with a sample of SMEs, in addition to illustrating the outreach of the total LFG portfolio. It provides insights into the characteristics of the SMEs intermsofemployment,accesstofinance,assets,financialperformanceandchallenges faced.
5 SME Finance Forum. (n.d.). What We Do. Retrieved from http://www.smefinanceforum.org/about/what-we-do
6 International Finance Corporation. (2012). IFC and Small and Medium Enterprises. Retrieved from https://www.ifc.org/wps/wcm/connect/277d1680486a831abec2fff995bd23db/AM11IFC+IssueBrief_SME.pdf?MOD=AJPERES
7 Ibid.
7

8
2. IMPACT MEASUREMENT METHODOLOGYMeasuring and assessing the social performance of funds’ investments is a crucial component of impact investing. Symbiotics has developed a social performancemeasurementframeworkthatisrigorous,evidence-basedandcomprehensive.8 This framework is used in order to assess the extent to which the LFG fund meets its objective to foster job creation, employment and entrepreneurship,aswellascontributetofinancialinclusioninemergingandfrontier economies. The social impact of the fund is assessed both at the level ofthefinancialinstitutionsintheportfolio,andattheleveloftheend-clients(SMEs).
Atthelevelofthefinancialinstitutions:We measure a set of outreach indicators, whichshowswherethefundisinvestedgeographically,thetypeoffinancialinstitutionsitengageswith,theiraveragefinancingsizetoSMEsandthenumberof SME clients the fund expects to have reached.
At the level of SMEs: The focus is on direct outcomes measurement through face-to-faceinterviewswithasampleofSMEsfinancedbytheLFGfund.Ageographicallyrepresentativegroupoffinancialinstitutionswasselected,andasample of their SME clients was interviewed. This included SMEs with under 200 employees,and/orloansofaboutUS$1,000-250,000(excludingoutliers).
Symbiotics developed a survey to collect detailed primary data from the sampled SMEs, focusing on indicators that are relevant to the objectives of the fund. The survey has the following seven main dimensions and contains in total 157 qualitative and quantitative indicators:9
I Characteristics of the Business and the Business OwnerII Accounting and Business PracticesIII Business AssetsIV Loans and Access to CreditV EmploymentVI BusinessExpenditures,IncomeandProfitsVII Business Challenges
In this effort, Symbiotics relied on the expertise of local market research agencies to conduct the survey with the sampled SMEs in the local language. The participation of the SMEs in this research is entirely voluntary, and their data remainsconfidential.ThegoalistofollowthesamesampleofSMEsthroughannualsurveysoverthefour-yearperiodofthefund(until2020)toobservetheirgrowth trajectory. The data presented in this report describes the SME outcomes today, and will serve as a baseline for the outcomes in the coming years.
8 Symbiotics SA. (2017). Managing & Measuring Social Performance: Insights on Definitions, Practices and Solutions. Retrieved from https://symbioticsgroup.com/wp-content/uploads/2017/10/SPM_web.pdf
9 For further details on these dimensions, please refer to Appendix 1.
9

Survey design Sampling investees
Sampling SMEs Hiring third-party consultants
Conduct face-to-face interviews
Data validation and analysis
Sharing results with investees
NOTE ON SAMPLINGWhile the sample of SMEs is geographically representative of the fund’s portfolio, it is unlikely to be representative of all the clients reached by the investees. The investees have different target clients depending on their institutional structure,andonlyasegmentoftheirgrossloanportfolio(25-100%)isinSMEfinance.Whensamplingend-clientstomeasuretheiroutcomes,wefocusonlyonSME clients. The effort to follow the same sample of SMEs and measure similar indicatorsannuallyoverthefour-yearperiodwillallowustogathercomparabledata, both over time and across countries. However, there is a risk of attrition from the sample.
NOTE ON ATTRIBUTIONApositive(ornegative)relationshipbetweenaccesstofinanceandimprovements in SME outcomes does not allow us to infer that LFG or Symbiotics are the cause of these outcomes. The study follows a diverse and heterogeneous sample of enterprises, subject to a variety of exogenous factors that are likely to affect their outcomes. Therefore, the analysis in this report is descriptive in nature and is intended to better understand SMEs’ performance and any challenges they face.
Figure 1 Data Collection Methodology
10

3. LFG FUND’S PORTFOLIO OUTREACHSETTING THE CONTEXTDuringitsfirstyearofoperation,theLFGfund:› Originated US$ 49 million› Financed37financialinstitutionsthrough48transactions› Invested in 41 countries, including 19 through the
Trilinc Global Impact Fund LLC10
As of September 2017, the fund’s largest exposure is in Latin America & the Caribbean,atone-thirdofportfoliooutstanding.ThesecondlargestexposureisSouth & East Asia (28%) while 25% is invested in Eastern Europe, Central Asia & the Middle East and North Africa (MENA) and the remaining portion (13%) in Sub-SaharanAfrica.
10 TriLinc Global Impact Fund LLC is a private debt impact investing fund providing growth stage loansandtradefinancetoestablishedSMEsin25countries.
13%
25%
28%
Figure 2 Geographic Outreach of LFG
Direct investmentsIndirect investments
Percentage of portfolio outstanding(September 2017)Due to rounding, the sum does not equal 100%
33%
%
LATIN AMERICA & THE CARIBBEANSouth America 10.7% Central America, Mexico & The Caribbean 22.7%
EASTERN EUROPE, CENTRAL ASIA & MENACentral & Eastern Europe 7.7% Russia, Caucasus & Central Asia 17.4%Middle East & North Africa 0.1%
SUB-SAHARAN AFRICA Sub-SaharanAfrica 13.0%
SOUTH & EAST ASIASouth East Asia 13.0% EastAsiaandThePacific 15.5%
11

SOCIAL INTENTIONS – SOCIAL RESPONSIBILITY RATINGSPrior to an investment decision, each potential investee is rated on a scale of zerotofiveonitslikelihoodtocontributetosustainabledevelopmentandpositivesocialimpact.Thisratinghasbeendevelopedin-housebySymbioticsandassessesthesocialresponsibilitypracticesofafinancialinstitutionacrossseven different dimensions (Figure 3).
Theportfolio-weightedaverageratingofinvesteesintheLFGfundis3.5starsasof September 2017, with 35 such ratings being produced during the fund’s initial year of operation. Overall, the institutions perform well on most dimensions, with scores ranging between 49% and 72%. The only exception is environmental policy, where the score is only 31%. This dimension primarily measures whether an investee has an environmental policy in place, be it for its own operations or foritslendingactivities.Historically,traditionalfinancialservicesproviderssuchas those in the LFG portfolio have tended not to prioritize this dimension.
OUTREACH MEASUREMENTThe following section aims to quantify the breadth and depth of LFG fund’s portfoliooutreachbyintegratingmarket-levelandinvestee-levelinformation.These metrics enable us to draw valid observation points in terms of social outreach.11
Market outreachAs of September 2017, the LFG fund is invested in countries where: › GDP per capita (current US$) is US$ 4,565, which is lower than the world
averageandin-linewiththeaverageoflow-andmiddle-incomeeconomies(Figure 4).12
› Banking penetration levels (42.9%) are not only lower than world averages, butalsolowerthantheaverageforlow-andmiddle-incomeeconomies(Table 2).13
Table 2 Banking Penetration Levels, % of Adult Population
Banking Penetration Levels % of Adult Population
LFG Portfolio (Weighted Average) 42.9%
World (as of 2014, Global Findex)
60.7%
Low & Middle Income Economies (as of 2014, Global Findex)
53.0%
11 The metrics do not conclusively determine the outreach levels attained by the LFG fund (positiveornegative),becauseonehastoconsidermarketspecificities.
12 The World Bank DataBank. (2018). World Development Indicators. Retrieved from http://databank.worldbank.org/data/reports.aspx?source=world-development-indicators
13 The World Bank. (2015). Global Findex Database. Retrieved from http://datatopics.worldbank.org/financialinclusion/
ClientProtection
72.3% CommunityEngagement 60.5%
EnvironmentalPolicy 30.6%
FinancialInclusion 49.0%
LaborClimate66.4%
ProductQuality 56.5%
SocialGovernance
56.6%
Figure 3 Social Responsibility Rating Scores per Dimension (LFG Portfolio Weighted Averages)
4,5654,365
10,190
LFG Portfolio (Weighted Average) Low & Middle Income Economies World
0
2,000
4,000
6,000
8,000
10,000
12,000 US$
2017
Figure 4 GDP per Capita (current US$)
12
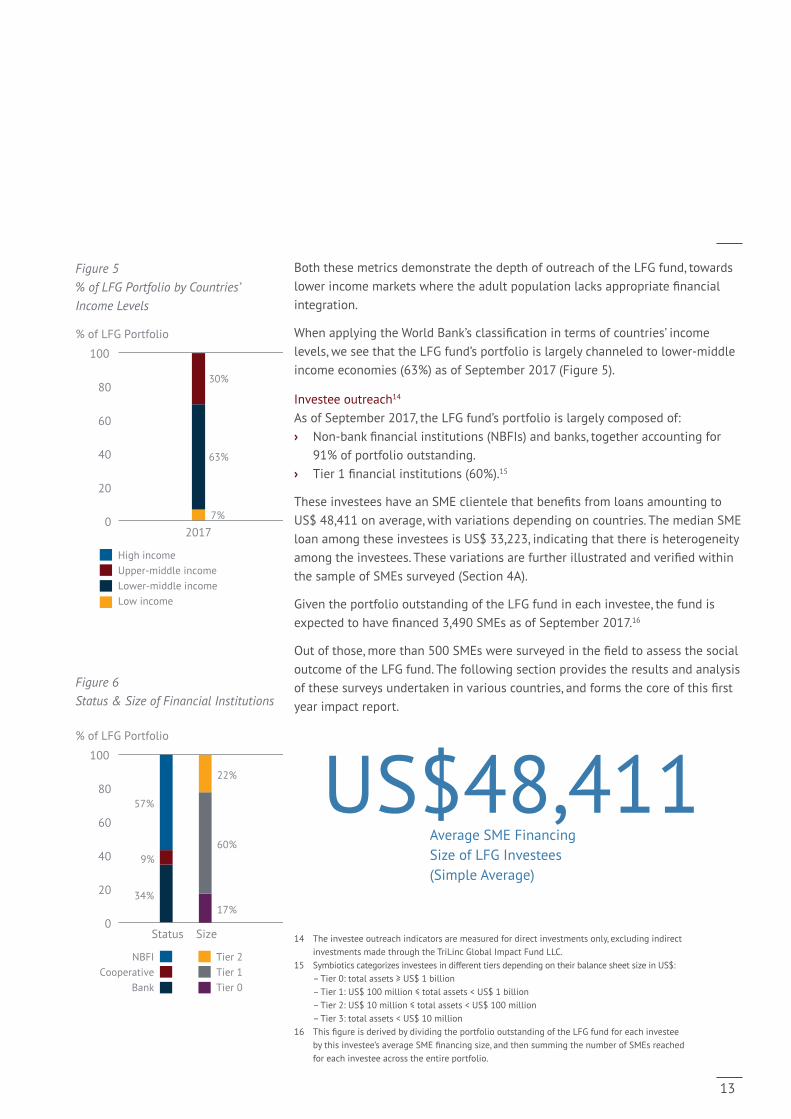
Both these metrics demonstrate the depth of outreach of the LFG fund, towards lowerincomemarketswheretheadultpopulationlacksappropriatefinancialintegration.
WhenapplyingtheWorldBank’sclassificationintermsofcountries’incomelevels,weseethattheLFGfund’sportfolioislargelychanneledtolower-middleincome economies (63%) as of September 2017 (Figure 5).
Investee outreach14
As of September 2017, the LFG fund’s portfolio is largely composed of: › Non-bankfinancialinstitutions(NBFIs)andbanks,togetheraccountingfor
91% of portfolio outstanding. › Tier1financialinstitutions(60%).15
TheseinvesteeshaveanSMEclientelethatbenefitsfromloansamountingtoUS$ 48,411 on average, with variations depending on countries. The median SME loan among these investees is US$ 33,223, indicating that there is heterogeneity amongtheinvestees.Thesevariationsarefurtherillustratedandverifiedwithinthe sample of SMEs surveyed (Section 4A).
Given the portfolio outstanding of the LFG fund in each investee, the fund is expectedtohavefinanced 3,490 SMEs as of September 2017.16
Outofthose,morethan500SMEsweresurveyedinthefieldtoassessthesocialoutcome of the LFG fund. The following section provides the results and analysis ofthesesurveysundertakeninvariouscountries,andformsthecoreofthisfirstyear impact report.
14 The investee outreach indicators are measured for direct investments only, excluding indirect investments made through the TriLinc Global Impact Fund LLC.
15 Symbiotics categorizes investees in different tiers depending on their balance sheet size in US$: –Tier0:totalassets≥US$1billion –Tier1:US$100million≤totalassets<US$1billion –Tier2:US$10million≤totalassets<US$100million –Tier3:totalassets<US$10million16 ThisfigureisderivedbydividingtheportfoliooutstandingoftheLFGfundforeachinvestee
bythisinvestee’saverageSMEfinancingsize,andthensummingthenumberofSMEsreachedfor each investee across the entire portfolio.
High incomeUpper-middle income Lower-middle income Low income
% of LFG Portfolio
2017 7%
63%
30%
0
20
40
60
80
100
NBFICooperative
Bank
Tier 2Tier 1Tier 0
% of LFG Portfolio
Status Size0
20
40
60
80
100
34%
9%
57%
17%
60%
22%
Figure 5 % of LFG Portfolio by Countries’ Income Levels
Figure 6 Status & Size of Financial Institutions
US$48,411Average SME Financing Size of LFG Investees(Simple Average)
13

14
4. SME OUTCOMES
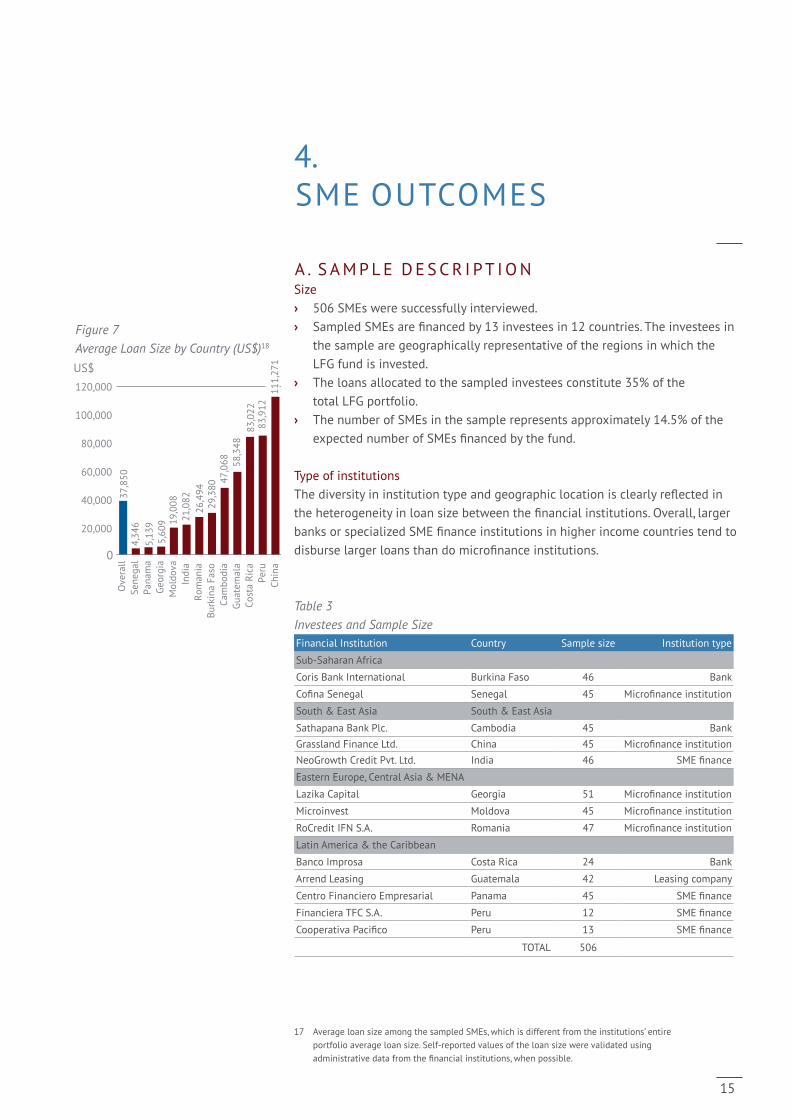
A . S A M P L E D E S C R I P T I O NSize 17
› 506 SMEs were successfully interviewed. › SampledSMEsarefinancedby13investeesin12countries.Theinvesteesin
the sample are geographically representative of the regions in which the LFG fund is invested.
› The loans allocated to the sampled investees constitute 35% of the total LFG portfolio.
› The number of SMEs in the sample represents approximately 14.5% of the expectednumberofSMEsfinancedbythefund.
Type of institutions Thediversityininstitutiontypeandgeographiclocationisclearlyreflectedintheheterogeneityinloansizebetweenthefinancialinstitutions.Overall,largerbanksorspecializedSMEfinanceinstitutionsinhigherincomecountriestendtodisburselargerloansthandomicrofinanceinstitutions.
Table 3 Investees and Sample SizeFinancial Institution Country Sample size Institution type
Sub-SaharanAfrica
Coris Bank International Burkina Faso 46 Bank
CofinaSenegal Senegal 45 Microfinanceinstitution
South & East Asia South & East Asia
Sathapana Bank Plc. Cambodia 45 BankGrassland Finance Ltd. China 45 MicrofinanceinstitutionNeoGrowth Credit Pvt. Ltd. India 46 SMEfinance
Eastern Europe, Central Asia & MENA
Lazika Capital Georgia 51 Microfinanceinstitution
Microinvest Moldova 45 Microfinanceinstitution
RoCredit IFN S.A. Romania 47 Microfinanceinstitution
Latin America & the Caribbean
Banco Improsa Costa Rica 24 Bank
Arrend Leasing Guatemala 42 Leasing company
Centro Financiero Empresarial Panama 45 SMEfinance
Financiera TFC S.A. Peru 12 SMEfinance
CooperativaPacifico Peru 13 SMEfinance
TOTAL 506
17 Average loan size among the sampled SMEs, which is different from the institutions’ entire portfolioaverageloansize.Self-reportedvaluesoftheloansizewerevalidatedusingadministrativedatafromthefinancialinstitutions,whenpossible.
US$
Ove
rall
Sene
gal
Pana
ma
Geor
gia
Mol
dova
In
dia
Rom
ania
Bu
rkin
a Fa
so
Cam
bodi
a Gu
atem
ala
Cost
a Ri
ca
Peru
Ch
ina
37,8
50
4,34
6 5,
139
5,60
9 19,0
08
21,0
82
26,4
94
29,3
80 47
,068
58
,348
83,0
22
83,9
12 11
1,27
1
0
20,000
40,000
60,000
80,000
100,000
120,000
Figure 7 Average Loan Size by Country (US$)18
15

2%
39%
52%
7%
Under 2525–4041–60Over 60
B . B U S I N E S S O W N E R C H A R A CT E R I S T I C SGender › Out of the 506 SMEs, 30.9% are owned by women.18 › The highest proportion of female ownership is in Romania (47%). Meanwhile,
the lowest proportion is in Costa Rica (12%, see Figure 8). › Thereisaclearcontrastbetweenthesefiguresandtheproportionofwomen
amongmicrofinanceclients,whichistypicallymuchhigher.
Age › The business owners we interviewed are between 20 and 77 years old, with
an average age of 44.› 89% of business owners are between 25 and 60 years old.
Educational background The business owners are overall well educated and have some prior entrepreneurial experience. › The overwhelming majority of participants (95%) are literate.› 25% have completed at least secondary schooling and one third have also
completed an undergraduate degree. › 48%ofrespondentscurrentlyownorpreviouslyownedanothermicro-or
small enterprise.
18 Sinceweaskrespondentsaboutco-ownersoftheirbusinessesandtheirgender,wederivethisfigurebysumminguptheproportionoffemaleownershipineachbusiness(e.g.100%if the business is solely owned by one or more female entrepreneurs) and dividing it by the total number of businesses.
% of Female Ownership
30.9
12
.0
12.2
23
.4
24.5
25
.1 30
.2
33.7
35
.3
38.2
40
.3 45
.3
46.7
0
10
20
30
40
50
Ove
rall
Cost
a Ri
ca
Geor
gia
Mol
dova
Pa
nam
a Gu
atem
ala
Burk
ina
Faso
Se
nega
l Pe
ru
Indi
a Ch
ina
Cam
bodi
a Ro
man
ia
Figure 8 Proportion of Female Ownership by Country
Figure 9 Age of Business Owners
Frequency
0
90
180
No
form
al s
choo
ling
Prim
ary
Low
er s
econ
dary
Hig
h sc
hool
Tech
nica
l/vo
catio
nal
Und
ergr
adua
te
Post
-gra
duat
e
Oth
er
Figure 10 Educational Attainment of Business Owners
16
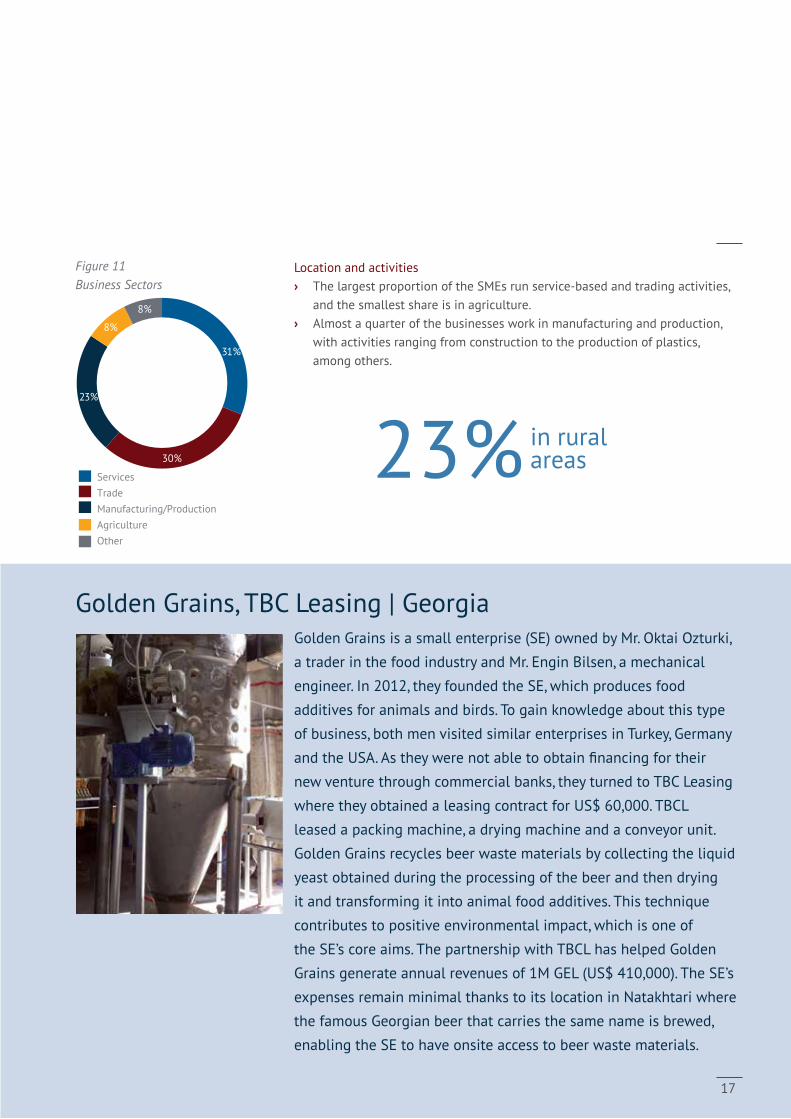
Location and activities › The largest proportion of the SMEs run service-based and trading activities,
and the smallest share is in agriculture. › Almost a quarter of the businesses work in manufacturing and production,
with activities ranging from construction to the production of plastics, among others.
31%
30%
23%
8%
8%
Services Trade Manufacturing/Production Agriculture Other
Figure 11 Business Sectors
Golden Grains, TBC Leasing | GeorgiaGolden Grains is a small enterprise (SE) owned by Mr. Oktai Ozturki,
a trader in the food industry and Mr. Engin Bilsen, a mechanical
engineer. In 2012, they founded the SE, which produces food
additives for animals and birds. To gain knowledge about this type
of business, both men visited similar enterprises in Turkey, Germany
and the USA. As they were not able to obtain financing for their
new venture through commercial banks, they turned to TBC Leasing
where they obtained a leasing contract for US$ 60,000. TBCL
leased a packing machine, a drying machine and a conveyor unit.
Golden Grains recycles beer waste materials by collecting the liquid
yeast obtained during the processing of the beer and then drying
it and transforming it into animal food additives. This technique
contributes to positive environmental impact, which is one of
the SE’s core aims. The partnership with TBCL has helped Golden
Grains generate annual revenues of 1M GEL (US$ 410,000). The SE’s
expenses remain minimal thanks to its location in Natakhtari where
the famous Georgian beer that carries the same name is brewed,
enabling the SE to have onsite access to beer waste materials.
23%in ruralareas
17

Formalization › 86% of SMEs in the sample are formalized; they are registered or licensed
withanofficialgovernmentbodyandpaytaxes.Meanwhile,13.5%areinthe informal sector and 0.5% reported that they are in the process of being registered. In half the sampled countries, all the SMEs interviewed are in the formal sector. The lowest proportion of formalization is in Cambodia and Moldova, where it is 60% (Figure 12).
› 28% of SMEs agreed or strongly agreed that the registration process in their countryisdifficult.SMEsinChina,GeorgiaandMoldovafounditeasiesttoregister their businesses, while those in Costa Rica and Senegal found it the mostdifficult.
%
0
20
40
60
80
100
Ove
rall
Cam
bodi
a M
oldo
va
Sene
gal
Geor
gia
Pana
ma
Cost
a Ri
ca
Burk
ina
Faso
Ch
ina
Guat
emal
a In
dia
Peru
Ro
man
ia
Figure 12 Proportion of SMEs in Formal Sector
18

Frequency
Number of employees
0
50
100
150
200
250
300
350
≤10
295
9541
18 16 6 6 3 2 4 6 1 4 2 1 5
50 100 150 >200
C . K E Y O U TC O M E SI EMPLOYMENT› The 506 SMEs in the sample hire 10,241 employees in total.› The average number of employees per enterprise is approximately 20.
However, the median number of employees per enterprise is 8, suggesting thattheaverageisskewedduetosomeoutlierswithasignificantlylargernumber of employees than the remainder of the sample.
› The majority of the SMEs in the sample are on the smaller end of the spectrum; 58% of the SMEs employ less than 10 individuals, and another 19% employ between 10 and 20 individuals (see Figure 7). Meanwhile, only 8% of the sampled SMEs employ 50 or more individuals.
› Of the 10,241 employees, 35.4% are female, while 64.6% are male. › The largest SMEs in the sample, with 150 employees or more, are based
primarily in Guatemala and India.› Female-ownedenterprisesaremorelikelytohireagreaterproportionof
femaleemployees.Amongthefemale-ownedenterprises,50.7%ofemployeesare female, and the average number of female employees per enterprise is 11.Meanwhile,amongmale-ownedenterprises,only29.2%ofemployeesarefemale, and the average number of female employees is 6.
› On average, the business owners/respondents, worked 25 days during the month preceding the interview, at a rate of approximately 9 hours per day.
Employee characteristics› The majority of those employed by the SMEs in the sample are between
25 and 40 years old, while another 34% of employees are evenly distributed betweentheyounger(<25)andolder(41–59)agebrackets.
› Thisisconsistentwiththedemographicprofileofthecountriesincludedinthe sample, most of which have a predominantly young population19. It also suggests that SMEs in emerging economies contribute to alleviating the pressing issue of youth unemployment.
› TheSMEsprovideopportunitiesforregular,full-timeemployment,allowingfor a stable source of income to employees.
› ThisislikelytobebecausetheSMEsprimarilyoperateinnon-agriculturalsectors (see Figure 11); among the agricultural businesses in the sample, the proportion of casual/seasonal employment almost doubles from 10.75% to 19.75%.
› The overwhelming majority of employees are unrelated to the business owners, unlike microenterprises where family members are typically responsible for business activities.
19 Central Intelligence Agency. (2018). The World Factbook. Retrieved from https://www.cia.gov/library/publications/the-world-factbook/
Figure 13 Distribution of Number of Employees per Enterprise
17%
63%
17%
3%
Under 2525–4041–60Over 60
Figure 14 Age of Employees
%
0
20
40
60
80
100
Male 64.6%
Female 35.4%
Full-time
85.7%
Part-time14.3%
Regular 89.2%
Seasonal 10.8%
Familymembers
6.5%
Unrelated 93.5%
Literate 91.4%
Illiterate 8.6%
Figure 15 Characteristics of Employees
19

WagesWe analyze the wage rate offered by the SMEs in the sample relative to (i) the national or sectoral minimum wage, where applicable,20 (ii) the prevailing wage rates offered by similar businesses, and (iii) the country’s gross domestic product (GDP) per capita.21
› 445 SMEs reported how their wage rates compare to the applicable minimum wage.
› The majority (71%) stated that they pay their employees a wage that is above the minimum wage, and 19% pay the minimum wage.
› Most respondents (57%) believed that the wages they pay their employees are competitive or very competitive, as compared to similar businesses. A further 35% believe their wage rate is average and in line with what their competitors pay. Finally, only 8% believe they pay uncompetitive wages to their employees.
The average monthly wage paid to an employee in one of the sampled SMEs is US$305.22 Table 4 shows the average monthly wage rate by country in the sample, and compares it to the 2016 GDP per capita. The average daily income per employee shows that all the SMEs in the sample provide an income that is well above the absolute poverty line of US$ 1.25 per day. Overall, the wage rates paid by the SMEs in Africa and Asia exceed the GDP per capita, whereas they are lower than the GDP per capita in Latin America.
20 Note that the question pertaining to the minimum wage was added to the survey after the pilot phase, which was conducted in Cambodia. Therefore, the results refer to the other 11 countries in the sample, excluding Cambodia.
21 Based on 2016 GDP per capita, in current US$, as reported by the World Bank. The annual GDP per capita is divided by 12 for the purposes of comparison to the average monthly wage rate.
22 Respondents reported the total amount spent on wages to all employees in the past 30 days. This value was divided by the total number of employees in each enterprise, and averaged overtheentiresample.Theaverageiscalculatedonlyovernon-zerovaluesoftotalwagesforenterprises where there is at least one employee. Note that Costa Rica is excluded from the calculation because one third of the respondents refused to report their wage data, and the available data includes multiple outliers that appear to be misreported.
15%
42%
35%
8%
Very competitive Competitive Average Uncompetitive
19%
71%
10%
Equal to minimum wage Above minimum wage Below minimum wage Not applicable
Figure 16Competitiveness of Wage Rate
Figure 17 Comparison to Minimum Wage
20
Sample Average Monthly Wage Rate
2016 Monthly GDP per capita
Sample Average Daily Income
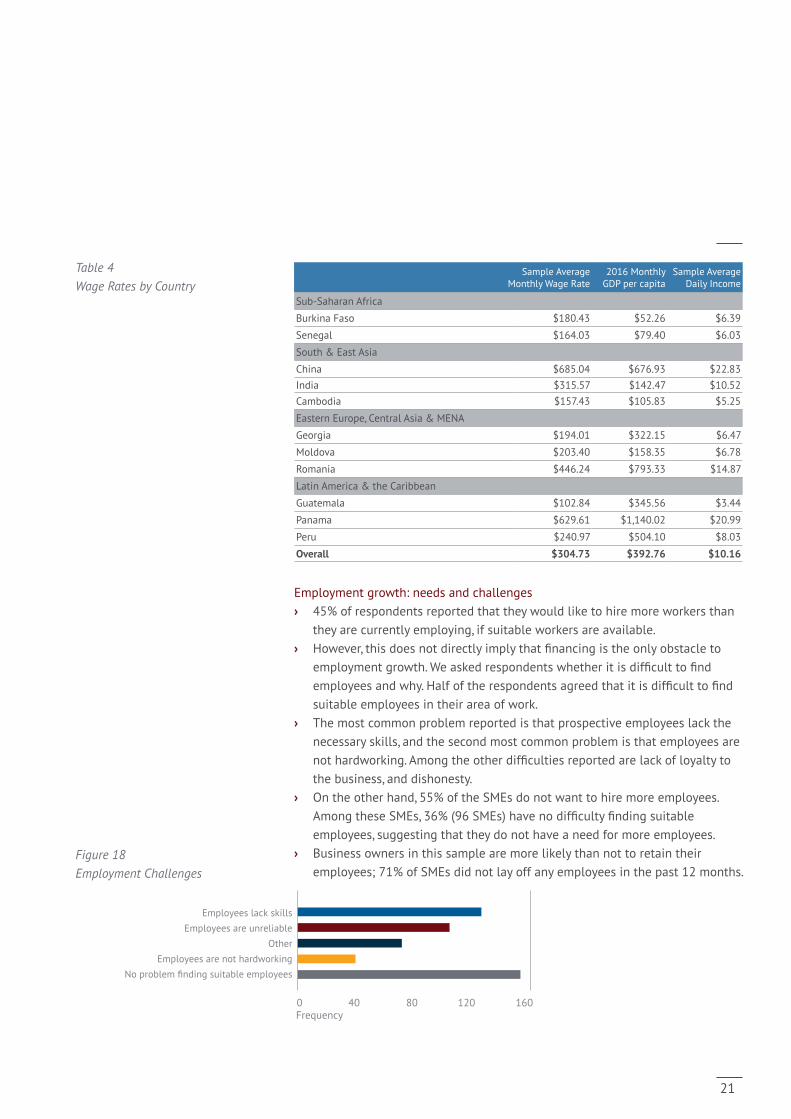
Sub-SaharanAfrica
Burkina Faso $180.43 $52.26 $6.39
Senegal $164.03 $79.40 $6.03
South & East Asia
China $685.04 $676.93 $22.83India $315.57 $142.47 $10.52Cambodia $157.43 $105.83 $5.25
Eastern Europe, Central Asia & MENA
Georgia $194.01 $322.15 $6.47
Moldova $203.40 $158.35 $6.78
Romania $446.24 $793.33 $14.87
Latin America & the Caribbean
Guatemala $102.84 $345.56 $3.44
Panama $629.61 $1,140.02 $20.99
Peru $240.97 $504.10 $8.03
Overall $304.73 $392.76 $10.16
Employment growth: needs and challenges› 45% of respondents reported that they would like to hire more workers than
they are currently employing, if suitable workers are available.› However,thisdoesnotdirectlyimplythatfinancingistheonlyobstacleto
employmentgrowth.Weaskedrespondentswhetheritisdifficulttofindemployeesandwhy.Halfoftherespondentsagreedthatitisdifficulttofindsuitable employees in their area of work.
› The most common problem reported is that prospective employees lack the necessary skills, and the second most common problem is that employees are nothardworking.Amongtheotherdifficultiesreportedarelackofloyaltytothe business, and dishonesty.
› On the other hand, 55% of the SMEs do not want to hire more employees. AmongtheseSMEs,36%(96SMEs)havenodifficultyfindingsuitableemployees, suggesting that they do not have a need for more employees.
› Business owners in this sample are more likely than not to retain their employees; 71% of SMEs did not lay off any employees in the past 12 months.
0 40 80 120 160
No problem finding suitable employees
Other Employees are unreliable
Employees are not hardworking
Employees lack skills
Frequency
Figure 18 Employment Challenges
Table 4 Wage Rates by Country
21
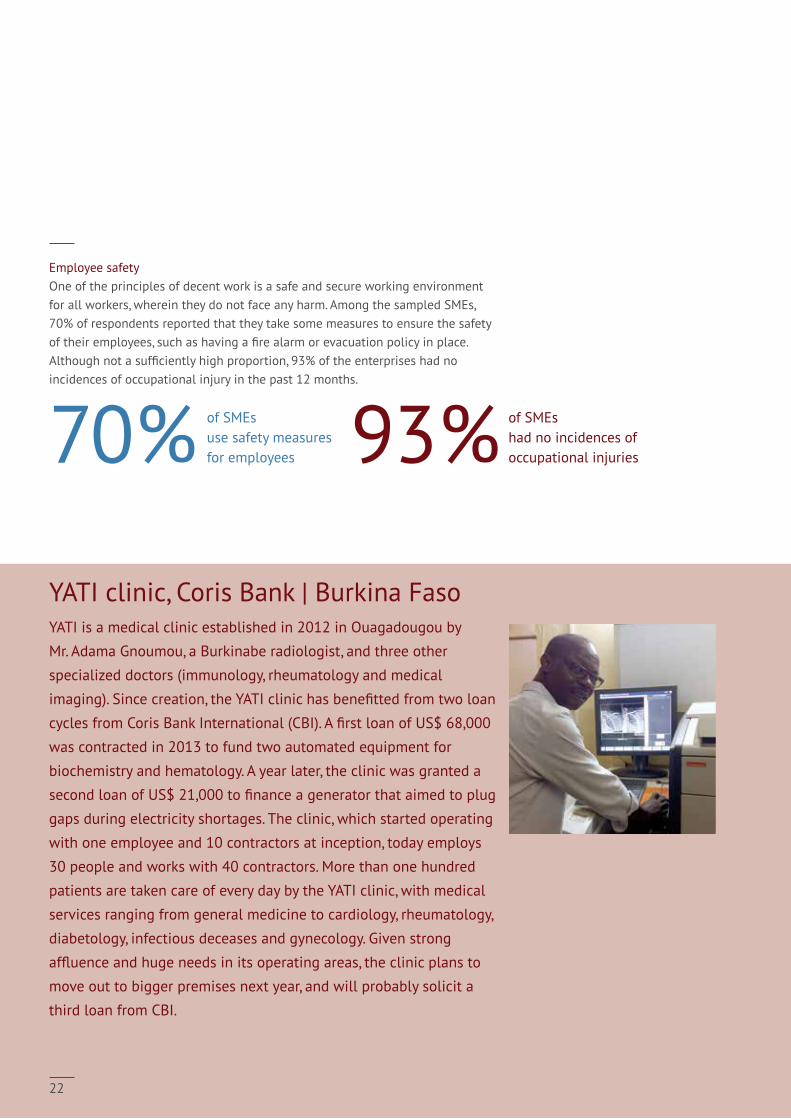
Employee safetyOne of the principles of decent work is a safe and secure working environment for all workers, wherein they do not face any harm. Among the sampled SMEs, 70% of respondents reported that they take some measures to ensure the safety oftheiremployees,suchashavingafirealarmorevacuationpolicyinplace.Althoughnotasufficientlyhighproportion,93%oftheenterpriseshadnoincidences of occupational injury in the past 12 months.
70% of SMEsuse safety measures for employees
93% of SMEs had no incidences of occupational injuries
YATI clinic, Coris Bank | Burkina FasoYATI is a medical clinic established in 2012 in Ouagadougou by
Mr. Adama Gnoumou, a Burkinabe radiologist, and three other
specialized doctors (immunology, rheumatology and medical
imaging).Sincecreation,theYATIclinichasbenefittedfromtwoloan
cyclesfromCorisBankInternational(CBI).AfirstloanofUS$68,000
was contracted in 2013 to fund two automated equipment for
biochemistry and hematology. A year later, the clinic was granted a
secondloanofUS$21,000tofinanceageneratorthataimedtoplug
gaps during electricity shortages. The clinic, which started operating
with one employee and 10 contractors at inception, today employs
30 people and works with 40 contractors. More than one hundred
patients are taken care of every day by the YATI clinic, with medical
services ranging from general medicine to cardiology, rheumatology,
diabetology, infectious deceases and gynecology. Given strong
affluenceandhugeneedsinitsoperatingareas,theclinicplansto
move out to bigger premises next year, and will probably solicit a
third loan from CBI.
22
Frequency
Profit margin (%)
0
20
40
60
80
100
120
0 50 100 >150
6531
174 5 7 8 6 3
23
2 4 4 110
112
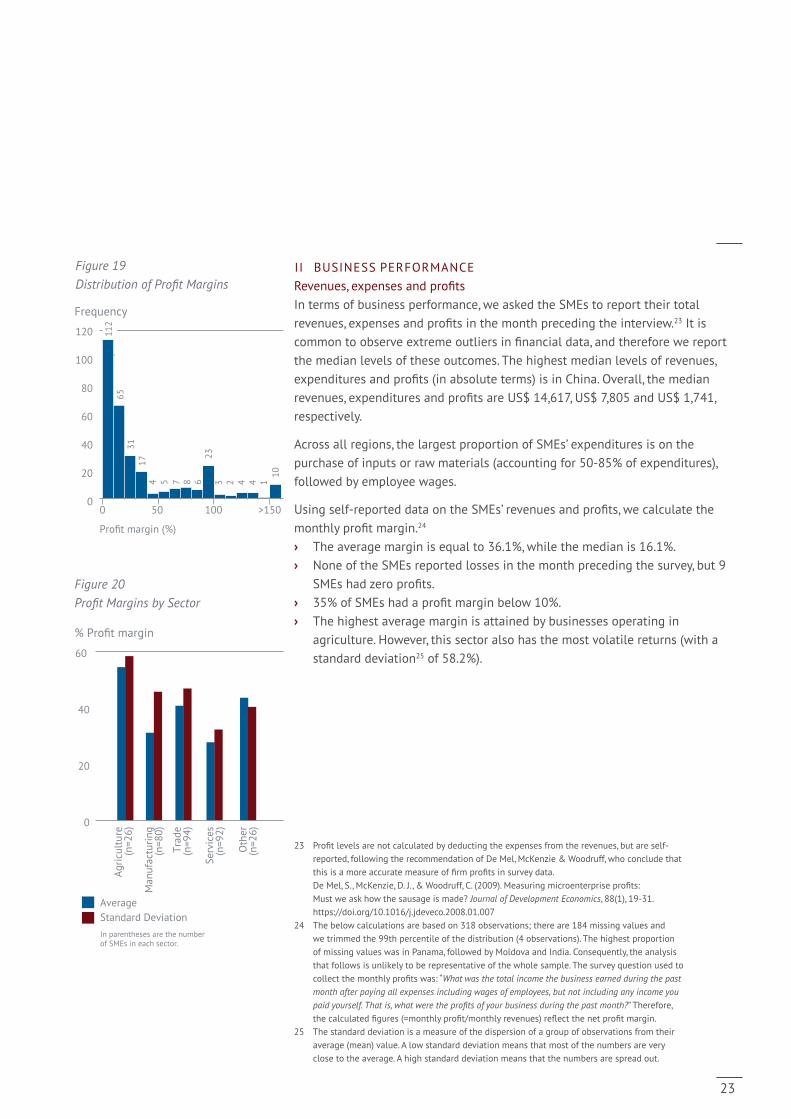
II BUSINESS PERFORMANCERevenues,expensesandprofits In terms of business performance, we asked the SMEs to report their total revenues,expensesandprofitsinthemonthprecedingtheinterview.23 It is commontoobserveextremeoutliersinfinancialdata,andthereforewereportthe median levels of these outcomes. The highest median levels of revenues, expendituresandprofits(inabsoluteterms)isinChina.Overall,themedianrevenues,expendituresandprofitsareUS$14,617,US$7,805andUS$1,741,respectively.
Across all regions, the largest proportion of SMEs’ expenditures is on the purchaseofinputsorrawmaterials(accountingfor50-85%ofexpenditures),followed by employee wages.
Usingself-reporteddataontheSMEs’revenuesandprofits,wecalculatethemonthlyprofitmargin.24 › The average margin is equal to 36.1%, while the median is 16.1%.› None of the SMEs reported losses in the month preceding the survey, but 9
SMEshadzeroprofits.› 35%ofSMEshadaprofitmarginbelow10%.› The highest average margin is attained by businesses operating in
agriculture. However, this sector also has the most volatile returns (with a standard deviation25 of 58.2%).
23 Profitlevelsarenotcalculatedbydeductingtheexpensesfromtherevenues,butareself-reported, following the recommendation of De Mel, McKenzie & Woodruff, who conclude that thisisamoreaccuratemeasureoffirmprofitsinsurveydata. DeMel,S.,McKenzie,D.J.,&Woodruff,C.(2009).Measuringmicroenterpriseprofits: Must we ask how the sausage is made? Journal of Development Economics,88(1),19-31. https://doi.org/10.1016/j.jdeveco.2008.01.007
24 The below calculations are based on 318 observations; there are 184 missing values and we trimmed the 99th percentile of the distribution (4 observations). The highest proportion of missing values was in Panama, followed by Moldova and India. Consequently, the analysis that follows is unlikely to be representative of the whole sample. The survey question used to collectthemonthlyprofitswas:“What was the total income the business earned during the past month after paying all expenses including wages of employees, but not including any income you paid yourself. That is, what were the profits of your business during the past month?” Therefore, thecalculatedfigures(=monthlyprofit/monthlyrevenues)reflectthenetprofitmargin.
25 The standard deviation is a measure of the dispersion of a group of observations from their average (mean) value. A low standard deviation means that most of the numbers are very close to the average. A high standard deviation means that the numbers are spread out.
Figure 19 Distribution of Profit Margins
Figure 20Profit Margins by Sector
AverageStandard DeviationIn parentheses are the number of SMEs in each sector.
% Profit margin
0
20
40
60
Agric
ultu
re(n
=26)
Man
ufac
turin
g(n
=80)
Trad
e(n
=94)
Serv
ices
(n=9
2)
Oth
er(n
=26)
23

Assets Across all regions, the highest proportion of business assets is in land and buildings. This is likely to be because 45% of the SMEs own the premises in which the business operates.
The median value of total assets in the sample is US$ 52,337. As with other indicators of business performance, the highest value of total assets is in China, where the median is US$ 2,902,665. Excluding China, the median level of total assets is US$ 38,900.
15%
42%
35%
8%
Land & Buildings Machinery & Equipment Vehicles Inventory Furniture Livestock Other
60% 10%
6%
11%
1%
12%
Figure 21 Types of Assets
24

III FINANCIAL INCLUSIONBank accounts › 82% of the SMEs in the sample have at least one bank account that is used
exclusively for business purposes. › The 417 respondents who use bank accounts for their business have 700
bank accounts in total, averaging 1.7 bank accounts per business owner. › 84%oftheseaccountsareopenedatformalbanks,another10%areatmicro-
financeinstitutions,andtheremainderisatcooperativeorruralbanks.› Of the 700 accounts, 84% are secured through a pin code or other means, and
71% are accessible through a mobile phone or other electronic device.
Uses:SMEs most commonly use the bank accounts to:› Make payments for the purchase of goods or inputs› Deposit revenues› Pay employees’ salaries
These purposes are clearly of direct relevance to the successful operation of the businesses. Most often, the SMEs open accounts at the institution from which they received their business loan. As a result, the fund provides not only access tofinance,butalsoaccesstobasicfinancialservicesthatfacilitatebusinesstransactions.
Accesstofinance All the SMEs in the sample are loan recipients, and therefore have access to financethroughloans.Nevertheless,morethanhalfoftheSMEsreportedthattheirownsavingsorwealthisthemainsourcetheyusetofinancetheirbusiness,while38%useloansastheirmainsourceoffinance.Theremaining7%relyonfinancialassistancefromfriends,relativesorothersources.
However, only 9% of SMEs had their loan applications rejected in the past. These findingssuggestthecreditworthinessoftheSMEsisnotthemainreasontheychoosetorelyonalternatesourcesoffinancing,asopposedtoloans.Itislikelythatbusinessownersusetheirownsavingsorwealthtofinancetheirbusinessventuresbecauseloansareacostliersourceoffinance.
55%
38%
7%
Own savings/wealth Loans Other sources
Figure 23 Sources of Finance
% of Bank Accounts
5.6%
42.1%
60.8% 82.4%
82.5%
0 20 40 60 80 100
Other
Savings
Making payments to employees
Depositing revenues
Making payments to purchase goods
Figure 22 Uses of Bank Accounts
25

IV BUSINESS CHALLENGESWhen asked about the most important challenges they face out of a list of 10 challenges (Figure 24), the most common challenge faced by the SMEs is competition from businesses providing similar products or services, followed by changes in costs of inputs.
AGP Semillas, TFC | PeruAt the end of the 1990s, as Mr. Gonzalo García had just graduated asanagronomicengineer,Peruwashitbyawaveoffloodsandlandslides, damaging crops all over the country. His father, then an important trader of imported chemical products for the agricultural sector,hadtofacerepaymentdifficultiesfromhisclients.However,some of them managed to repay the products by ceding livestock. Mr. García soon started the business of importing, packing and selling good quality seeds to feed the cattle. AGP Semillas was born and slowly became the main provider of good quality seeds for the country (52% of the market today), and thanks to the adequate outreach of its distribution network, it has already surpassed direct competitors in Colombia and Chile. The company has had 6 loan cycleswithTFC,totalingPEN1.3m(US$400k).Thefirstloanwasinitiatedwhennootherfinancialinstitutionofferedsupport,giventhehigh-riskperceptionofthebusiness.ThankstoTFC’sfinancing,the business has grown, and is able to reach clients in every corner of Peru: the coast, the highlands and the rainforest (Amazonia). AGP Semillas has improved its warehouses, IT systems, and has bought new packing machines. In the future, the owner plans to use polymerization, a process designed to improve seeds resistance to climate change.
Frequency
8 24 26
34 35
38 43
62 101
111
0 20 40 60 80 100 120
Health Infrastructure
Managing debt and cash flows Unreliable supply of inputs
Customers not paying Weather
Obtaining financing Changes in demand
Changes in costs Competition Figure 24
Business Challenges
26
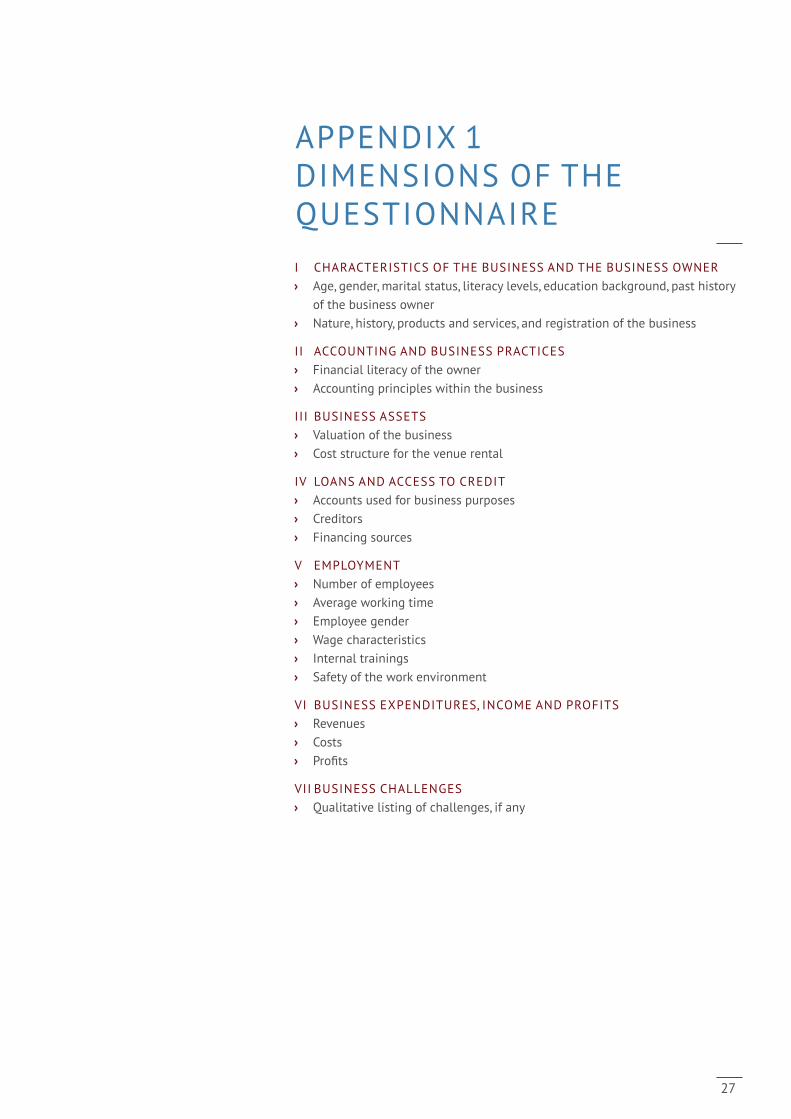
APPENDIX 1 DIMENSIONS OF THE QUESTIONNAIREI CHARACTERISTICS OF THE BUSINESS AND THE BUSINESS OWNER› Age, gender, marital status, literacy levels, education background, past history
of the business owner› Nature, history, products and services, and registration of the business
II ACCOUNTING AND BUSINESS PRACTICES› Financial literacy of the owner› Accounting principles within the business
III BUSINESS ASSETS› Valuation of the business› Cost structure for the venue rental
IV LOANS AND ACCESS TO CREDIT› Accounts used for business purposes› Creditors› Financing sources
V EMPLOYMENT› Number of employees› Average working time› Employee gender› Wage characteristics› Internal trainings› Safety of the work environment
VI BUSINESS EXPENDITURES, INCOME AND PROFITS› Revenues› Costs› Profits
VII BUSINESS CHALLENGES› Qualitative listing of challenges, if any
27


SWITZERLAND
Symbiotics SARue de la Synagogue 31
1204 Geneva
t +41 22 338 15 40
SWITZERLAND
Symbiotics SALimmatquai 86
8001 Zürich
t +41 43 499 87 89
MEXICOSymbiotics Mexico S de RL de CVDiagonal Patriotismo 12 – 602
Colonia Hipódromo
06100 México D. F.
t +52 55 55 84 78 72
NETHERLANDSSymbiotics NetherlandsMeester Treublaan 7
1097 DP Amsterdam
t +31 20 2409329
SINGAPORESymbiotics (Singapore) Pte. Ltd.134 Amoy Street #03–01
049963 Singapore
t +65 31 63 71 80
SOUTH AFRICA
Symbiotics I, C & S South Africa Ltd.4 Loop Street, Studio 502
8001 Cape Town
t +27 21 425 51 19
UNITED KINGDOM
Symbiotics UK Ltd6 Bevis Marks
London EC3A 7BA
t +44 203 786 1186
symbioticsgroup.com


