Impact of woodland creation on farm profitability · 2 Executive summary 1. Scottish Government...
40
Impact of woodland creation on farm profitability – Financial modelling of farm forestry options Prepared for: David Henderson Howat, Forestry Commission Scotland Prepared by: Julian Bell & Jennifer Greaves, SAC Consulting Contact Email: [email protected] Tel: 0131 535 3438 Mobile: 07795 302 264 September 2010
-
Upload
truongthien -
Category
Documents
-
view
216 -
download
0
Transcript of Impact of woodland creation on farm profitability · 2 Executive summary 1. Scottish Government...
Impact of woodland creation on farm profitability –
Financial modelling of farm forestry options
Prepared for:
David Henderson Howat,
Forestry Commission Scotland
Prepared by: Julian Bell & Jennifer Greaves, SAC Consulting Contact Email: [email protected] Tel: 0131 535 3438 Mobile: 07795 302 264 September 2010
1
Contents
EXECUTIVE SUMMARY ........................................................................................... 2
1) INTRODUCTION AND OBJECTIVES................................................................... 4
2) BACKGROUND .................................................................................................... 7
3) METHODOLOGY ................................................................................................ 13
4) MODEL RESULTS .......................................................................................... 19
5) DISCUSSION AND CONCLUSIONS – THE FORESTRY COMPETITIVENESS GAP ...................................................................................... 23
APPENDIX 1 - REFERENCES................................................................................ 29
APPENDIX 2 - FARM COST AND RETURNS ........................................................ 30
APPENDIX 3 - FORESTRY COSTS AND RETURNS............................................. 33
APPENDIX 4 - NOTES ON THE FARM ACCOUNTS SCHEME............................. 39

2
Executive summary 1. Scottish Government targets aim to achieve annual woodland planting rates of up
to 15,000 ha per year in practice planting rates are barely 1/3 this level. Much of this
planting will need to be on agricultural land, so far farmer uptake of tree planting has
been limited. A range of barriers have been identified. The Scottish Government
have requested SAC to investigate financial barriers to woodland creation on farm.
2. This study models the financial impacts of planting new woodlands on a proportion
of agricultural land (25%) on three broad farm types; arable, improved grassland and
unimproved grassland. The impact of woodland planting on land values and timber
income were also considered in outline. The study does not consider farmer
behavioural and attitudinal barriers.
4. Woodland costs and returns were prepared based on standard forestry costs and
prevailing grant schemes. Farm costs and returns were based on recorded financial
results from the Farm Accounts Scheme (FAS).
5. While all woodland planting options generated positive cash flows over the 15 year
time frame, on most farm types this was insufficient to offset losses in agricultural
income without restructuring of the farm’s fixed costs.
6. On improved land woodland planting can not compete with agriculture unless
labour and machinery fixed costs are reduced pro rata with the planted area. The
inability of farmers to reduce fixed costs when planting trees is often cited as a major
barrier to uptake. However, in the medium to longer term most farms are capable of
restructuring and using contractors to reduce labour, machinery costs in line with
reductions in farmed area.
7. Where farm labour and machinery costs can be reduced woodland planting on all
land types becomes competitive except for conifers on improved land. This excludes
any compensation to the farmer for the loss of land use flexibility and any reduction in
land values which would be most significant on improved and arable land.
9. Expected reductions in the Single Farm Payment post 2013 CAP reform are
unlikely to reduce agricultural incomes by enough on their own to significantly
improve the uptake of forestry planting
3
10. Many family farms remain in business because of unpaid family labour. Once this
extra cost is considered then agricultural income is sharply reduced and forestry
becomes relatively more attractive financially. However, enabling farmers to
recognise this oversight is a major challenge and requires a longer term approach to
change perceptions and attitudes and so this option has not been considered as
practical in this report.
11. Rising timber prices have the potential to make timber income a significant driver
of the planting decision. However, farmers need for cashflow reduces the
attractiveness of future income streams and ways to improve cashflow maybe
required. On better sites this may include the pursuit of Short Rotation Forestry or the
development of some form of annual lease payment funded by investment funds.
11. This study is a modelling exercise and results may vary significantly in practice. A
follow up study is proposed to look in detail at actual farm forestry costs and returns
using farm case studies. These would fully assess the financial impact on the farm
business, land values, timber income, carbon payments and non financial benefits
such as shelter. It is suggested that the case studies could be undertaken on the
recently announced Climate Change Focus farms as part of the Scottish
Government’s Farming for A Better Climate initiative.
4
1) Introduction and objectives
1.1 Forestry planting targets
The Scottish Government’s Climate Change Delivery Plan1 states (paragraph 6.21)
that Ministers have endorsed the Scottish Forestry Strategy target to increase
woodland cover to 25% of Scottish land area (by the second half of the century). This
will require additional planting levels of up to 15,000 ha/yr, compared with the current
average rates of 4,000-5,000 ha/yr.
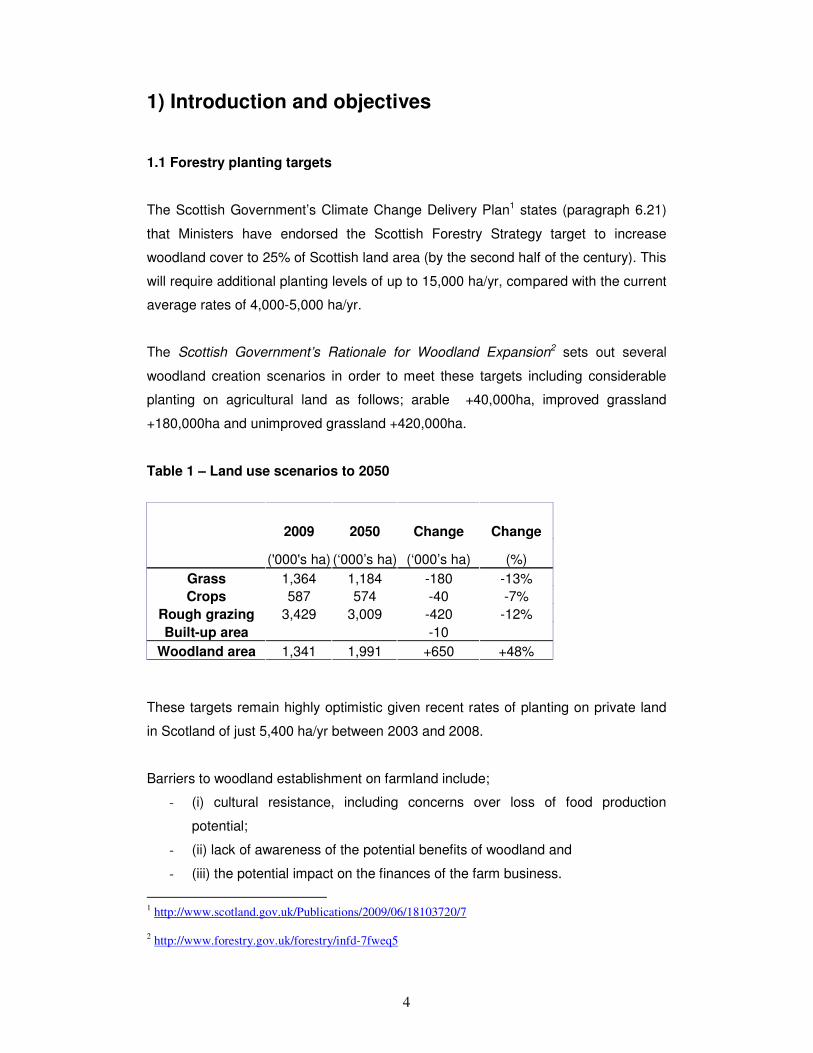
The Scottish Government’s Rationale for Woodland Expansion2 sets out several
woodland creation scenarios in order to meet these targets including considerable
planting on agricultural land as follows; arable +40,000ha, improved grassland
+180,000ha and unimproved grassland +420,000ha.
Table 1 – Land use scenarios to 2050
2009 2050 Change Change
('000's ha) (‘000’s ha) (‘000’s ha) (%)
Grass 1,364 1,184 -180 -13%
Crops 587 574 -40 -7%
Rough grazing 3,429 3,009 -420 -12%
Built-up area -10
Woodland area 1,341 1,991 +650 +48%
These targets remain highly optimistic given recent rates of planting on private land
in Scotland of just 5,400 ha/yr between 2003 and 2008.
Barriers to woodland establishment on farmland include;
- (i) cultural resistance, including concerns over loss of food production
potential;
- (ii) lack of awareness of the potential benefits of woodland and
- (iii) the potential impact on the finances of the farm business.
1 http://www.scotland.gov.uk/Publications/2009/06/18103720/7
2 http://www.forestry.gov.uk/forestry/infd-7fweq5
5
This study is intended to address the third of these barriers by providing information
that will improve farmers’ understanding of the potential impact of wood creation on
farm business profitability3.
1.2 Objectives of the study
The purpose of this study is to examine the impact of woodland creation on farm
business profitability in Scotland in order to provide guidance for farmers who are
considering establishing woodlands.
This study will also provide the government with farm forestry “models” that can be
adjusted to gauge the level of forestry incentives required to meet targets.
The forestry estimates include the costs of establishment and maintenance; grants;
agricultural income foregone.
The models will incorporate full details of agricultural costs and returns at current
values to estimate the agricultural income foregone. These models are based on, as
far as possible, “typical” farm types in their land type with details of the enterprises,
labour, machinery, rent and other cost elements included. Farm Account Scheme
data has been used as a source of recorded benchmark data.
The study has also looked in outline at other benefits to the farm enterprise (e.g.
shelter, sporting, wood fuel and potentially carbon sequestration); and potential
market value of woodland after 10/15 years.
Wherever possible published datasets have been used, but it is recognised that
professional judgement will be required, for example to determine the extent to which
woodland creation will reduce agricultural fixed costs and to determine the
appropriate time series for farm business survey data that is used.
3 In 2003 SAC prepared a report for FCS, SNH and the Scottish Executive on Farm Woodland Design
in Scotland which highlighted potential benefits of farm woodlands. This helped inform a subsequent
publication The creation of small woodlands on farms – see http://www.forestry.gov.uk/swof.

6
This study is in two parts. The first part is to create these theoretical models for the
three farms types and the three planting schemes (native, conifer and mc/bl) and the
second is to ‘test’ this model on real farms under the Farming for a Better Climate
focus farms programme.

7
2) Background 2.1 Farm income in Scotland
Farm incomes in Scotland have risen steadily over the last decade from a low of
around £300m in 1998 to a high of around £660m in 2007. Over the same period
subsidy payments have been relatively stable with the result that in 2007 Scottish
agriculture generated a profit net of subsidies for the first time in over 10 years. The
overall conclusion is that Scottish agriculture has increased the level of returns from
the market place significantly in recent years but that the sector as whole remains
highly dependent on subsidy to generate a net return.
Figure 1: Total Income from Farming in Scotland
Source: Scottish Government
Looking more closely at individual farm types as classified under the Farm Accounts
Scheme (FAS) a wide disparity in income levels is seen. Income levels are generally
significantly higher in non-Less Favoured Areas particularly in the more intensive
sectors such as cereals, general cropping and dairy. By contrast returns on LFA farm
types are sharply lower.
While all farm types recorded a rise in net farm income in 2007/08, this was on the
back of exceptionally high global commodity prices and a weakening sterling
exchange rate and may turn out to be an exceptional year. The chart below shows

8
Net Farm Income (NFI) on selected farm types in Scotland over the last 5 years.
Incomes on cereal farms were exceptionally high relative to the long term trends.
Figure 2: Net Farm Income by selected farm type in Scotland
-
5,000
10,000
15,000
20,000
25,000
30,000
35,000
40,000
45,000
50,000
Specialist
Sheep
(LFA)
Cereals Lowland
Cattle and
Sheep
All Farm
Types
NF
I £ p
er
farm 2003/04
2004/05
2005/06
2006/07
2007/08
Source: Scottish Government and SAC
Looking more closely at individual farm types it is apparent that some farm types are
far more reliant on subsidy than others. In 2007/8 LFA sheep and beef farms were
the most dependant at over 50% of output provided by subsidies compared to arable
and dairy units were subsidies represented less than 20% of output. The financial
viability of beef and sheep farms in upland areas without subsidies therefore looks
extremely vulnerable. With the downturn in commodity prices since 2007/08, the
share of subsidies as a proportion of farm output is also expected to rise in the
cropping and dairy sectors.
Historical perspective
The most recent estimates of Net Farm Income produced by the Farm Accounts
Scheme are for 2007/08. Given that many agricultural commodity markets have
fallen back sharply these estimates may be overstating agricultural income on some
farm types at current prices. Farm incomes recorded by FAS in 2007/08 were 60%
higher averaged for all farm types than the 5 year average. Within farm types, cereal
farm incomes were most inflated at 157% above the 5 year average followed by
Specialist sheep + 64% and Lowland cattle & sheep + 29%.

9
The tables below show how NFI has changed by farm type per farm and per ha over
the last 5 years.
Table 2 – Net Farm Income by farm type in Scotland
Average NFI £/farm
2007/08 vs 5 yr average
2003/04 2004/05 2005/06 2006/07 2007/08 5yr av £/ha %Specialist Sheep (LFA) 9,894 8,644 4,053 1,900 11,900 7,278 4,622 64%
Cereals 17,271 1,461 3,098 20,800 45,200 17,566 27,634 157%
Lowland Cattle and Sheep 18,538 13,631 6,242 24,000 21,800 16,842 4,958 29%
All Farm Types 19,836 13,837 10,106 19,800 29,800 18,676 11,124 60%
Source; Scottish Government and SAC
Making comparisons between agricultural land use and forestry using 2007/08
figures may therefore be considered unduly weighted against forestry. Therefore in
this study the average of FAS data over the two year period 2006/07 and 2007/08
has been used.
2.2 Impact of tree planting on farm profitability
Planting new woodland on agricultural land has a range of impacts on the finances of
the farm business. On the downside output falls on lower crop and livestock sales
and subsidy payments. On the plus side variable and some fixed costs are also
reduced.
Table 3 - Agricultural costs and returns – impacts of tree planting
Factor Negative Positive Crop and livestock output Lower income £-
Agricultural subsidies Lower income £- Variable costs Lower cost £+
Fixed costs - labour & machinery costs
Lower cost £+
Fixed costs – land costs (rent, maintenance)
Unchanged Unchanged
Farmer & spouse manual work
Reduced workload £+
Woodland grants Additional income £+ Timber income Additional income £+
Woodland planting & maintenance costs
Increased costs £-
Shooting income Depends Depends
10
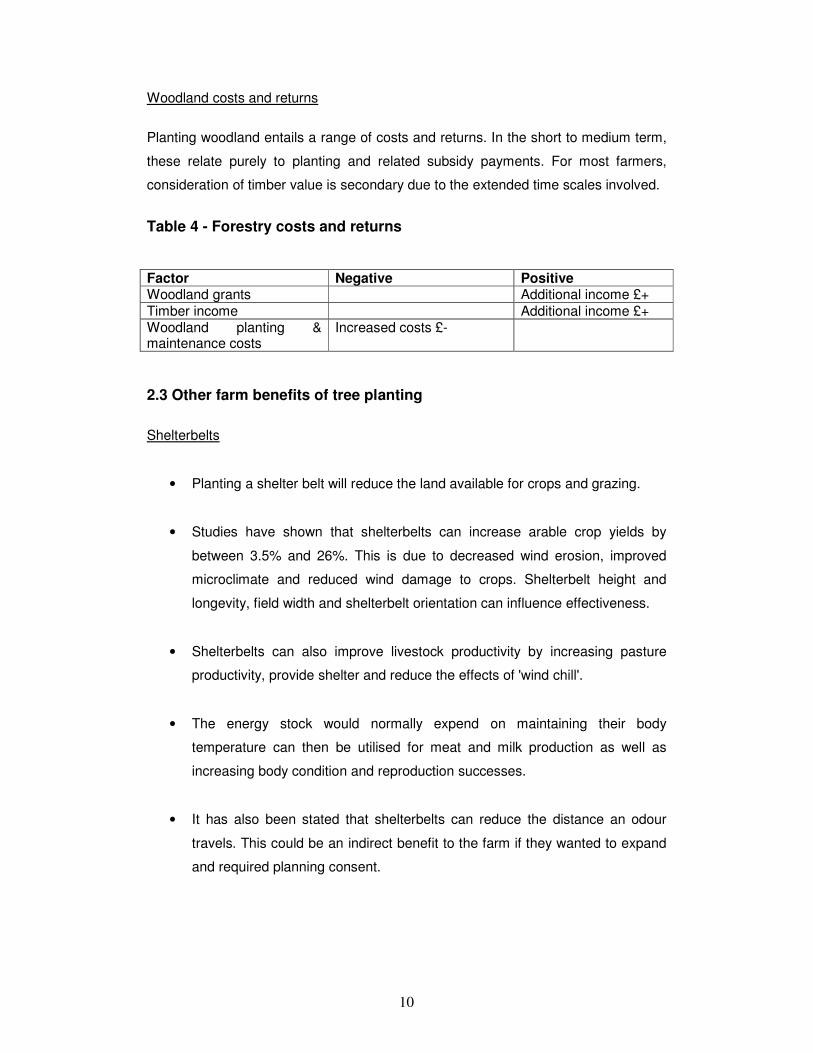
Woodland costs and returns
Planting woodland entails a range of costs and returns. In the short to medium term,
these relate purely to planting and related subsidy payments. For most farmers,
consideration of timber value is secondary due to the extended time scales involved.
Table 4 - Forestry costs and returns Factor Negative Positive Woodland grants Additional income £+
Timber income Additional income £+ Woodland planting & maintenance costs
Increased costs £-
2.3 Other farm benefits of tree planting
Shelterbelts
• Planting a shelter belt will reduce the land available for crops and grazing.
• Studies have shown that shelterbelts can increase arable crop yields by
between 3.5% and 26%. This is due to decreased wind erosion, improved
microclimate and reduced wind damage to crops. Shelterbelt height and
longevity, field width and shelterbelt orientation can influence effectiveness.
• Shelterbelts can also improve livestock productivity by increasing pasture
productivity, provide shelter and reduce the effects of 'wind chill'.
• The energy stock would normally expend on maintaining their body
temperature can then be utilised for meat and milk production as well as
increasing body condition and reproduction successes.
• It has also been stated that shelterbelts can reduce the distance an odour
travels. This could be an indirect benefit to the farm if they wanted to expand
and required planning consent.
11
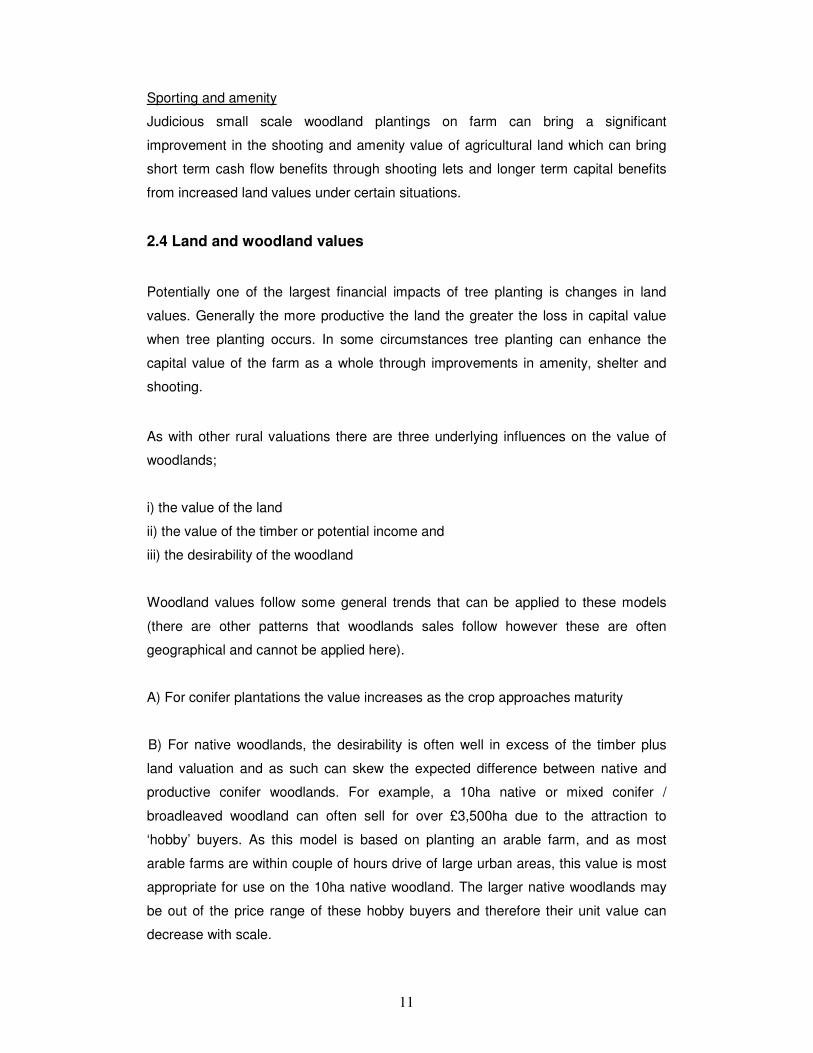
Sporting and amenity
Judicious small scale woodland plantings on farm can bring a significant
improvement in the shooting and amenity value of agricultural land which can bring
short term cash flow benefits through shooting lets and longer term capital benefits
from increased land values under certain situations.
2.4 Land and woodland values
Potentially one of the largest financial impacts of tree planting is changes in land
values. Generally the more productive the land the greater the loss in capital value
when tree planting occurs. In some circumstances tree planting can enhance the
capital value of the farm as a whole through improvements in amenity, shelter and
shooting.
As with other rural valuations there are three underlying influences on the value of
woodlands;
i) the value of the land
ii) the value of the timber or potential income and
iii) the desirability of the woodland
Woodland values follow some general trends that can be applied to these models
(there are other patterns that woodlands sales follow however these are often
geographical and cannot be applied here).
A) For conifer plantations the value increases as the crop approaches maturity
B) For native woodlands, the desirability is often well in excess of the timber plus
land valuation and as such can skew the expected difference between native and
productive conifer woodlands. For example, a 10ha native or mixed conifer /
broadleaved woodland can often sell for over £3,500ha due to the attraction to
‘hobby’ buyers. As this model is based on planting an arable farm, and as most
arable farms are within couple of hours drive of large urban areas, this value is most
appropriate for use on the 10ha native woodland. The larger native woodlands may
be out of the price range of these hobby buyers and therefore their unit value can
decrease with scale.
12
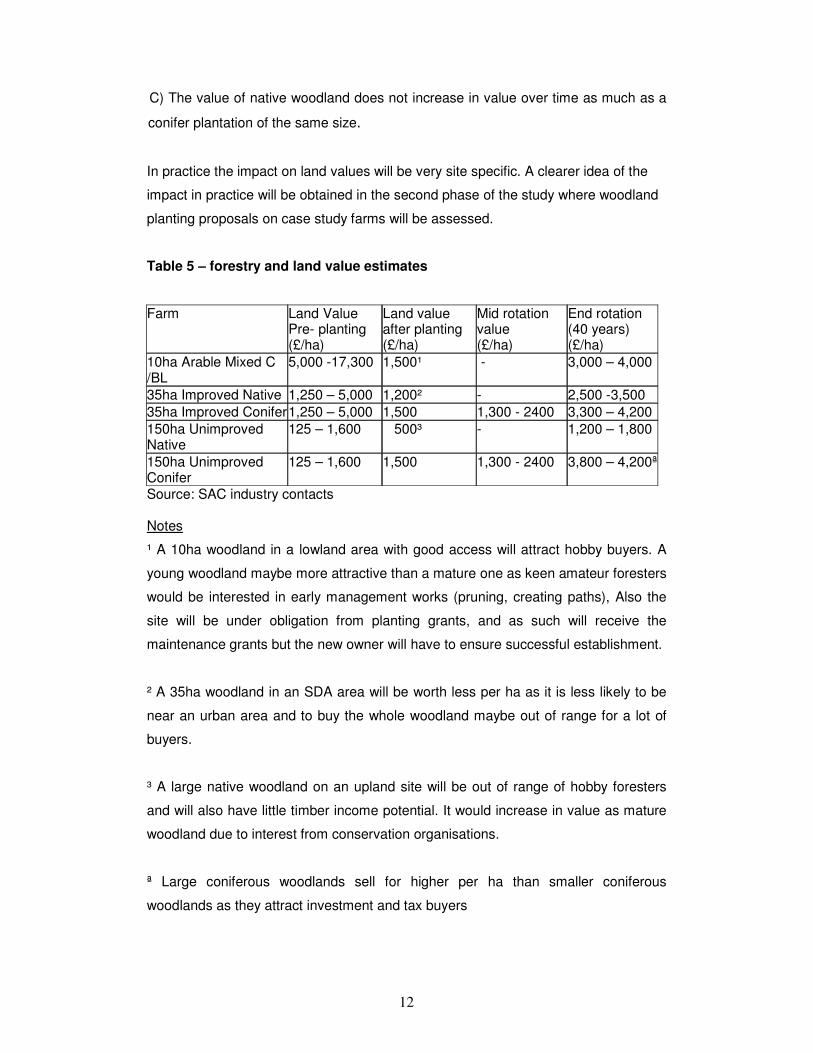
C) The value of native woodland does not increase in value over time as much as a
conifer plantation of the same size.
In practice the impact on land values will be very site specific. A clearer idea of the
impact in practice will be obtained in the second phase of the study where woodland
planting proposals on case study farms will be assessed.
Table 5 – forestry and land value estimates
Farm Land Value
Pre- planting (£/ha)
Land value after planting (£/ha)
Mid rotation value (£/ha)
End rotation (40 years) (£/ha)
10ha Arable Mixed C /BL
5,000 -17,300 1,500¹ - 3,000 – 4,000
35ha Improved Native 1,250 – 5,000 1,200² - 2,500 -3,500
35ha Improved Conifer 1,250 – 5,000 1,500 1,300 - 2400 3,300 – 4,200
150ha Unimproved Native
125 – 1,600 500³ - 1,200 – 1,800
150ha Unimproved Conifer
125 – 1,600 1,500 1,300 - 2400 3,800 – 4,200ª
Source: SAC industry contacts Notes
¹ A 10ha woodland in a lowland area with good access will attract hobby buyers. A
young woodland maybe more attractive than a mature one as keen amateur foresters
would be interested in early management works (pruning, creating paths), Also the
site will be under obligation from planting grants, and as such will receive the
maintenance grants but the new owner will have to ensure successful establishment.
² A 35ha woodland in an SDA area will be worth less per ha as it is less likely to be
near an urban area and to buy the whole woodland maybe out of range for a lot of
buyers.
³ A large native woodland on an upland site will be out of range of hobby foresters
and will also have little timber income potential. It would increase in value as mature
woodland due to interest from conservation organisations.
ª Large coniferous woodlands sell for higher per ha than smaller coniferous
woodlands as they attract investment and tax buyers

13
3) Methodology 3.1 Introduction
This report incorporates forestry costs and grants, agricultural market and subsidy
income forgone and costs saved.
Further assessment of the potential impact of changes in land valuation, woodland
valuation and timber values have been excluded from the model.
General assumptions
- Forestry plantings to supplement not replace agricultural activity.
This is a study of farm forestry, rather than creating forests on farms, therefore a
model has been used that retains a viable agricultural operation after a set area has
been taken up by tree planting. After looking at farm data sets and average farm size,
it was decided that each planting area would take up no more than 25% of the total
farm size. This has guided the choice of planted area; 10 ha on the arable unit, 35ha
on the improved grassland land and 150ha on the unimproved land.
- The farmer will always go for the most profitable option.
- based on a 15 year timescale
- Models and assumptions remain to be tested and may change
- as part of further practical farm case studies
14
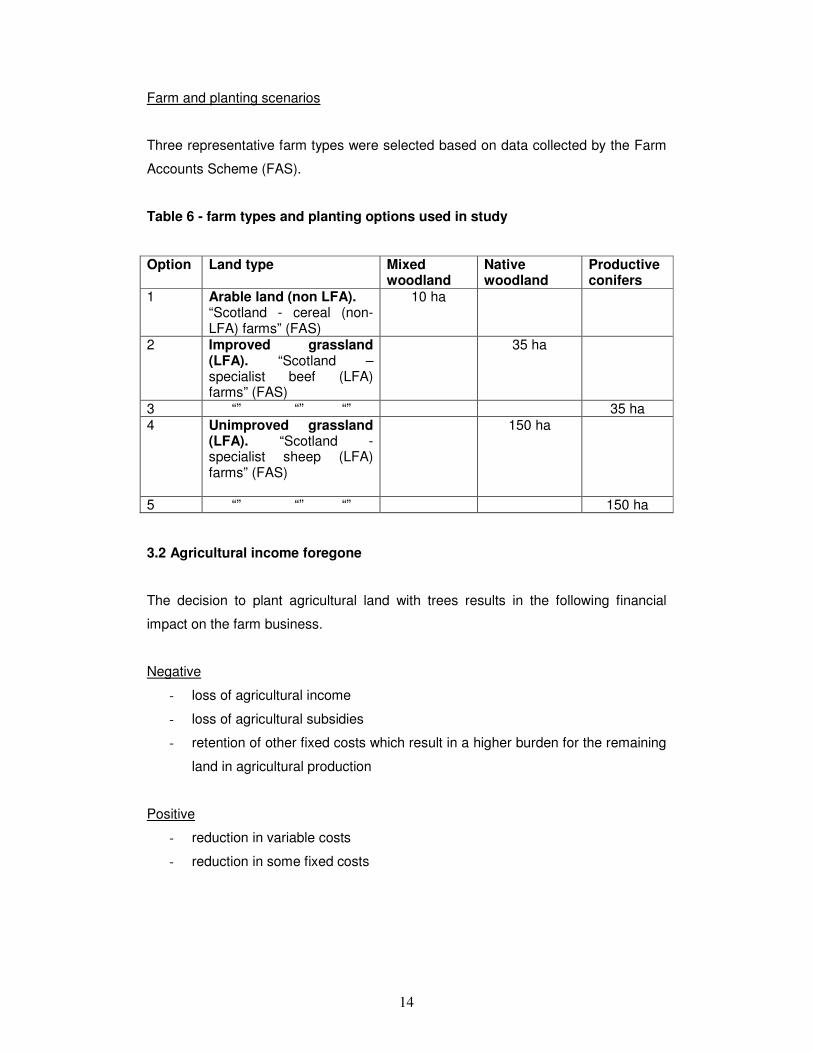
Farm and planting scenarios
Three representative farm types were selected based on data collected by the Farm
Accounts Scheme (FAS).
Table 6 - farm types and planting options used in study
Option Land type Mixed woodland
Native woodland
Productive conifers
1 Arable land (non LFA). “Scotland - cereal (non-LFA) farms” (FAS)
10 ha
2 Improved grassland (LFA). “Scotland – specialist beef (LFA) farms” (FAS)
35 ha
3 “” “” “” 35 ha 4 Unimproved grassland
(LFA). “Scotland - specialist sheep (LFA) farms” (FAS)
150 ha
5 “” “” “” 150 ha 3.2 Agricultural income foregone
The decision to plant agricultural land with trees results in the following financial
impact on the farm business.
Negative
- loss of agricultural income
- loss of agricultural subsidies
- retention of other fixed costs which result in a higher burden for the remaining
land in agricultural production
Positive
- reduction in variable costs
- reduction in some fixed costs

15
Estimates were prepared of the net loss to the farm business for every hectare of
land planted to trees. These estimates were based on the average of the Farm
Accounts Scheme data for 2006/07 and 2007/08 for the three farm types modelled.
Three farm cost scenario were assessed;
(i) Full – where the farm retains the full burden of fixed costs. In the short
term a farm may not be able to reduce its level of labour and machinery to
match the reduction in productive agricultural area. This is especially the
case where a farm relies on supplying its own labour and machinery
without the use of outside contractors.
(ii) Less Operations – where the farm is able to reduce the level of
operational fixed costs (labour & machinery). In the medium to longer term
most farms should be able to reduce their labour and machinery costs to
match the reduction in productive agricultural area. This is particularly true
were the farm uses contractors to supply labour and machinery rather
than supplying it in house. Land fixed costs will however be retained such
as rent, maintenance etc
(iii) + Less Farmer labour – as above but also with a reduction in the cost of
family labour. Most farm types record a considerable level of unpaid farm
labour. It is assumed that planting land with trees frees up family labour so
lowering these unaccounted for labour costs.
Based on the these scenarios estimates for agricultural income foregone per ha
planted with woodland were calculated as follows;
(i) Full = total fixed costs + Net Farm Income
LESS miscellaneous income (e.g. cottage and shooting lets which are not
assumed to be linked to agricultural activity)
(ii) Less operations = land fixed costs (rent, maintenance) + Net Farm
Income
LESS miscellaneous income
(iii) + Less Farmer labour = land fixed costs + NFI
LESS miscellaneous income + farmer labour
16
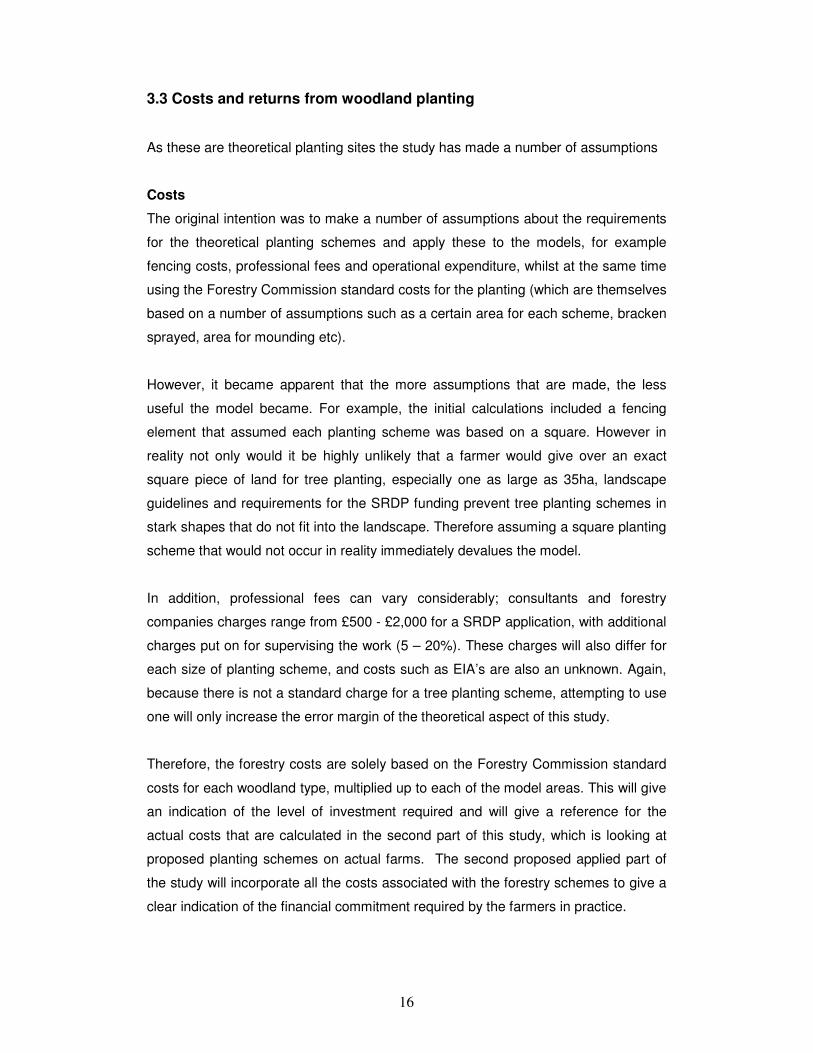
3.3 Costs and returns from woodland planting
As these are theoretical planting sites the study has made a number of assumptions
Costs
The original intention was to make a number of assumptions about the requirements
for the theoretical planting schemes and apply these to the models, for example
fencing costs, professional fees and operational expenditure, whilst at the same time
using the Forestry Commission standard costs for the planting (which are themselves
based on a number of assumptions such as a certain area for each scheme, bracken
sprayed, area for mounding etc).
However, it became apparent that the more assumptions that are made, the less
useful the model became. For example, the initial calculations included a fencing
element that assumed each planting scheme was based on a square. However in
reality not only would it be highly unlikely that a farmer would give over an exact
square piece of land for tree planting, especially one as large as 35ha, landscape
guidelines and requirements for the SRDP funding prevent tree planting schemes in
stark shapes that do not fit into the landscape. Therefore assuming a square planting
scheme that would not occur in reality immediately devalues the model.
In addition, professional fees can vary considerably; consultants and forestry
companies charges range from £500 - £2,000 for a SRDP application, with additional
charges put on for supervising the work (5 – 20%). These charges will also differ for
each size of planting scheme, and costs such as EIA’s are also an unknown. Again,
because there is not a standard charge for a tree planting scheme, attempting to use
one will only increase the error margin of the theoretical aspect of this study.
Therefore, the forestry costs are solely based on the Forestry Commission standard
costs for each woodland type, multiplied up to each of the model areas. This will give
an indication of the level of investment required and will give a reference for the
actual costs that are calculated in the second part of this study, which is looking at
proposed planting schemes on actual farms. The second proposed applied part of
the study will incorporate all the costs associated with the forestry schemes to give a
clear indication of the financial commitment required by the farmers in practice.
17
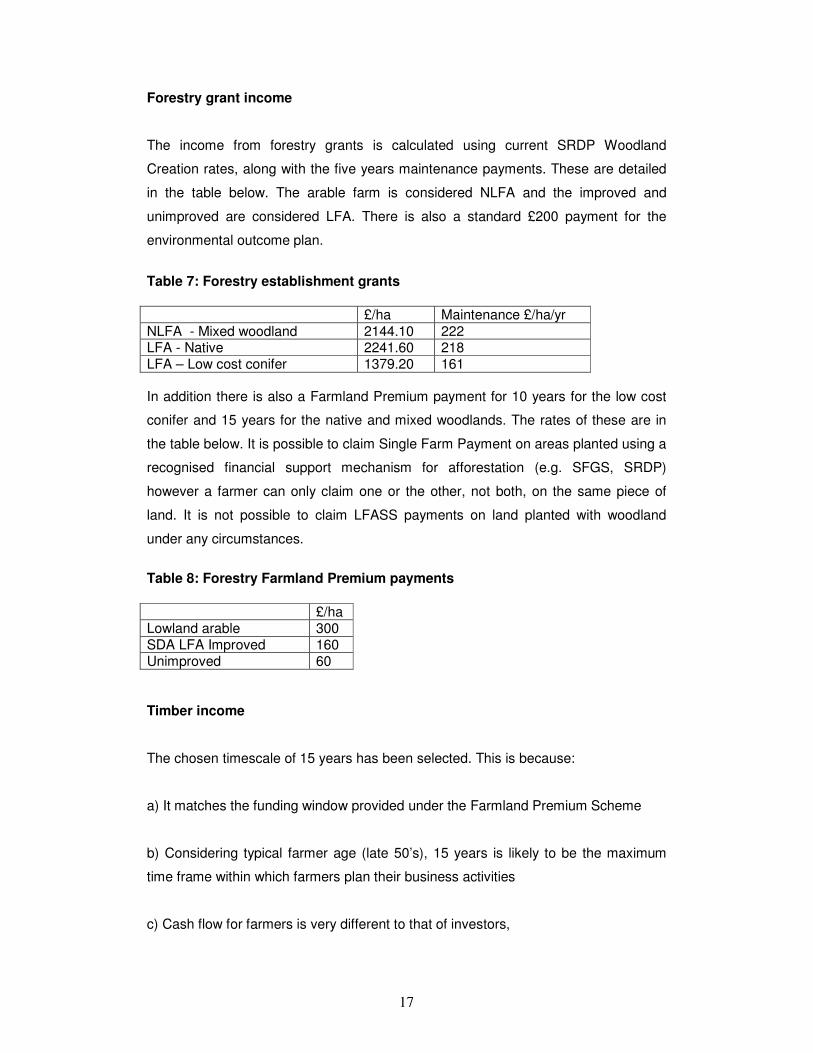
Forestry grant income
The income from forestry grants is calculated using current SRDP Woodland
Creation rates, along with the five years maintenance payments. These are detailed
in the table below. The arable farm is considered NLFA and the improved and
unimproved are considered LFA. There is also a standard £200 payment for the
environmental outcome plan.
Table 7: Forestry establishment grants
£/ha Maintenance £/ha/yr
NLFA - Mixed woodland 2144.10 222 LFA - Native 2241.60 218 LFA – Low cost conifer 1379.20 161
In addition there is also a Farmland Premium payment for 10 years for the low cost
conifer and 15 years for the native and mixed woodlands. The rates of these are in
the table below. It is possible to claim Single Farm Payment on areas planted using a
recognised financial support mechanism for afforestation (e.g. SFGS, SRDP)
however a farmer can only claim one or the other, not both, on the same piece of
land. It is not possible to claim LFASS payments on land planted with woodland
under any circumstances.
Table 8: Forestry Farmland Premium payments
£/ha Lowland arable 300 SDA LFA Improved 160 Unimproved 60
Timber income
The chosen timescale of 15 years has been selected. This is because:
a) It matches the funding window provided under the Farmland Premium Scheme
b) Considering typical farmer age (late 50’s), 15 years is likely to be the maximum
time frame within which farmers plan their business activities
c) Cash flow for farmers is very different to that of investors,
18
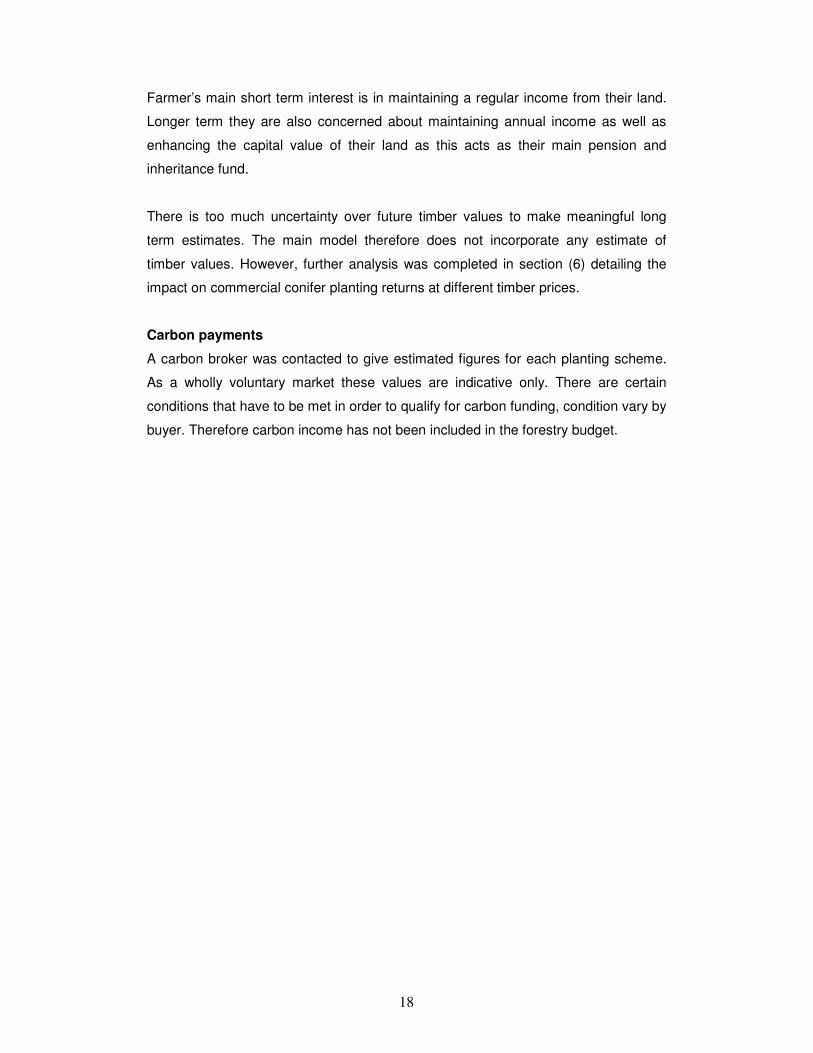
Farmer’s main short term interest is in maintaining a regular income from their land.
Longer term they are also concerned about maintaining annual income as well as
enhancing the capital value of their land as this acts as their main pension and
inheritance fund.
There is too much uncertainty over future timber values to make meaningful long
term estimates. The main model therefore does not incorporate any estimate of
timber values. However, further analysis was completed in section (6) detailing the
impact on commercial conifer planting returns at different timber prices.
Carbon payments
A carbon broker was contacted to give estimated figures for each planting scheme.
As a wholly voluntary market these values are indicative only. There are certain
conditions that have to be met in order to qualify for carbon funding, condition vary by
buyer. Therefore carbon income has not been included in the forestry budget.
19
4) Model results
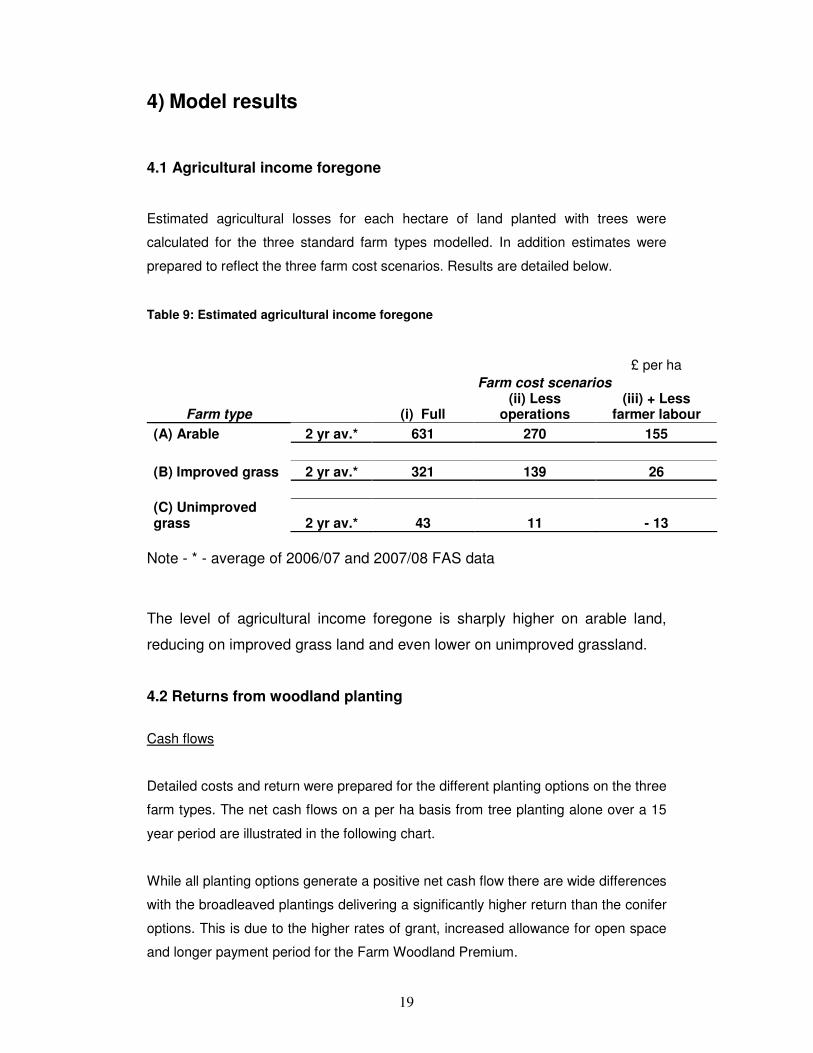
4.1 Agricultural income foregone
Estimated agricultural losses for each hectare of land planted with trees were
calculated for the three standard farm types modelled. In addition estimates were
prepared to reflect the three farm cost scenarios. Results are detailed below.
Table 9: Estimated agricultural income foregone
£ per ha
Farm cost scenarios
Farm type (i) Full (ii) Less
operations (iii) + Less
farmer labour
(A) Arable 2 yr av.* 631 270 155
(B) Improved grass 2 yr av.* 321 139 26
(C) Unimproved grass 2 yr av.* 43 11 - 13
Note - * - average of 2006/07 and 2007/08 FAS data
The level of agricultural income foregone is sharply higher on arable land,
reducing on improved grass land and even lower on unimproved grassland.
4.2 Returns from woodland planting
Cash flows
Detailed costs and return were prepared for the different planting options on the three
farm types. The net cash flows on a per ha basis from tree planting alone over a 15
year period are illustrated in the following chart.
While all planting options generate a positive net cash flow there are wide differences
with the broadleaved plantings delivering a significantly higher return than the conifer
options. This is due to the higher rates of grant, increased allowance for open space
and longer payment period for the Farm Woodland Premium.
20
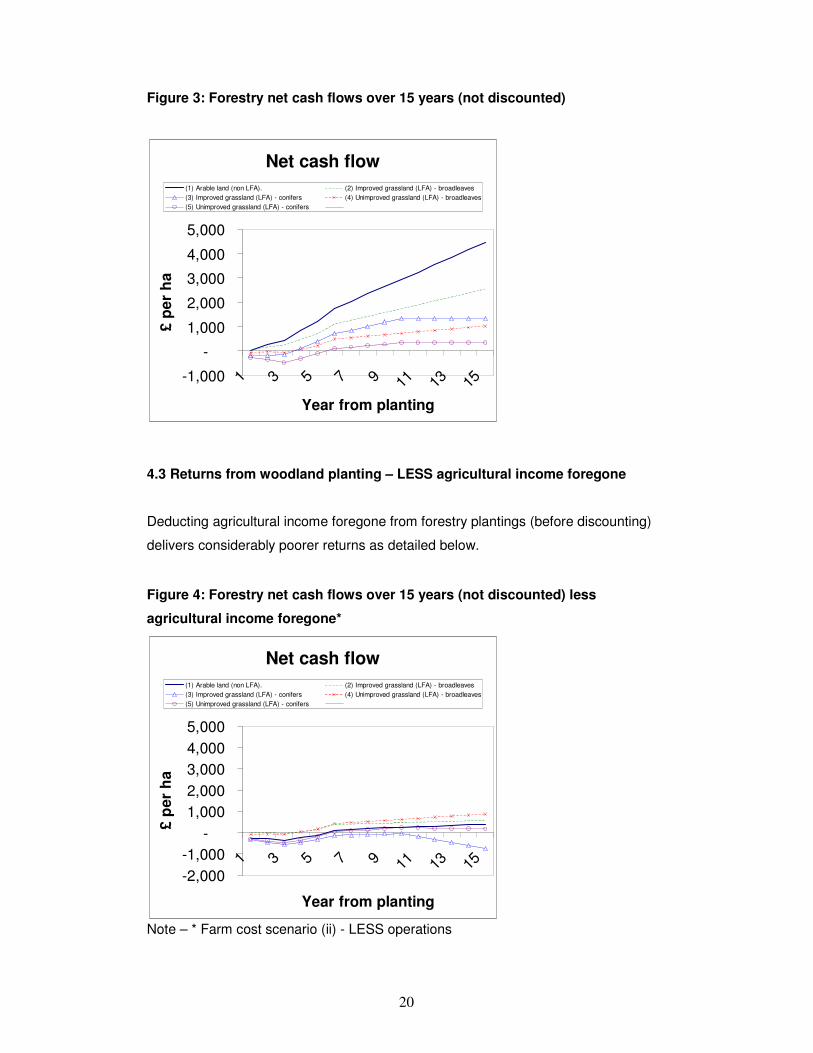
Figure 3: Forestry net cash flows over 15 years (not discounted)
Net cash flow
-1,000
-
1,000
2,000
3,000
4,000
5,000
1
3
5
7
9
11
13
15
Year from planting
£ p
er
ha
(1) Arable land (non LFA). (2) Improved grassland (LFA) - broadleaves
(3) Improved grassland (LFA) - conifers (4) Unimproved grassland (LFA) - broadleaves
(5) Unimproved grassland (LFA) - conifers
4.3 Returns from woodland planting – LESS agricultural income foregone
Deducting agricultural income foregone from forestry plantings (before discounting)
delivers considerably poorer returns as detailed below.
Figure 4: Forestry net cash flows over 15 years (not discounted) less
agricultural income foregone*
Net cash flow
-2,000
-1,000
-
1,000
2,000
3,000
4,000
5,000
1
3
5
7
9
11
13
15
Year from planting
£ p
er
ha
(1) Arable land (non LFA). (2) Improved grassland (LFA) - broadleaves
(3) Improved grassland (LFA) - conifers (4) Unimproved grassland (LFA) - broadleaves
(5) Unimproved grassland (LFA) - conifers
Note – * Farm cost scenario (ii) - LESS operations

21
Discounting
The financial benefit of forestry planting has been assessed using discounted cash
flows and Net Present Values (NPV) which account for the financial value of time.
Discounting cash flows at an interest rate of 6% enables the impact of timing to be
more fully accounted for. The principle is that costs and incomes in the future are
worth less than those incurred in the present.
NPV values for the five different planting options have been compared under the
three farm cost scenarios in the following table.
Without deducting agricultural income foregone all forestry planting schemes
generate a positive NPV led by the broadleaved planting on arable land.
However once agricultural income foregone is included under the (i) full farm cost
scenario then only broadleaved planting on unimproved grassland generates positive
cash flows and positive NPV. However where fixed costs can be reduced in line with
the fall in agricultural output then all woodland planting options generate a positive
NPV except conifer planting on improved land.
On the improved land types this positive NPV must be offset by the potential loss in
land value and loss of flexibility to benefit from improving agricultural returns in the
future.
The financial benefits of planting broadleaved trees are clearly apparent on all farm
types but especially on the unimproved land. Conifer planting is disadvantaged and
returns a negative NPV on all land types where full fixed costs are retained.

22
Table 10: Net Present Values of woodland options under different farm cost scenarios
NPV Farm cost scenarios £ per ha
Planting options (i) Full (ii) Less operations
(iii) + Less farmer labour
Trees only
(1) Arable land (non LFA). -5313 325 2120 4541 (2) Improved (LFA) - broadleaves -2409 433 2197 2603 (3) Improved (LFA) - conifers -3603 -761 1003 1409 (4) Unimproved (LFA) - broadleaves 215 525 759 632 (5) Unimproved (LFA) - conifers -397 102 477 274

23
5) Discussion and conclusions – the forestry
competitiveness gap
5.1 The competitiveness gap As the results section showed, most woodland planting options were not competitive
with average agricultural returns under the full farm cost scenario except for
broadleaved plantings on unimproved land.
In reality however most farms would be able to reduce operational (labour &
machinery) fixed costs over time as agricultural area fell through the use of
contractors, shedding labour and reducing machinery. Therefore the most realistic
comparison should be made under the central farm cost scenario; (ii) Less
Operations.
Under this scenario all planting would become competitive on both improved land
and unimproved without further improvements in margin except for conifers on
improved land.
The main issues is that many farmers would need a significant extra incentive to
encourage a change in behaviour and compensate for any perceived opportunity
costs of retreating from agricultural production. This incentive may also have to
provide compensation for any loss in land capital values which may occur.
Under the final farm cost scenario (iii) + farmer labour, then planting of both
broadleaves and conifers would become competitive without further improvement in
relative margins on all land types except arable. The difficulty would lie in making
farmers recognise the potential cost savings through reductions in their own labour
requirement by planting more trees. For many farmers farming is more of a lifestyle
than a business which means that they are often prepared to devote time to the
business without full financial recognition for this work. Older farmers and those
nearing retirement are most likely to be those most willing to recognise the benefits of
tree planting to reduce labour requirements. Due to the practical difficulties in making
farmers recognise these cost savings this scenario has not been considered realistic
in the short term.

24
The required relative improvement in margins could come from either an increase in
forestry margins, a fall in agricultural margins or a combination of the two.
Increased forestry margins
- reduced planting and establishment costs
- increased planting and annual grant payment
- timber value
Decreased agricultural margins
- reduced market returns
- reduced subsidy payments
- increased costs
It is the relative balance in performance between the two land uses that will drive any
change in land owner’s decision making.

25
5.2 CAP reform
Reform of the CAP is widely expected to result in a reduction in single farm payments
to many Scottish farmers with estimates of cuts of at least 20%. The expected move
towards flat rate area payments rather than historic will also have a significant impact
on individual farm businesses.
The table below details how SFP and LFASS payments on the three farm types
would be affected by different levels of cuts in subsidy payments based on 2007/08
FAS data.
Table 11: 2007/08 farm subsidy payments and potential future reductions
Subsidy payments in 2007/08 £ per farmed ha
Arable Improved grass Unimproved grass
- cereals - specialist beef LFA - specialist sheep
LFA
SFP 203 178 23
LFASS 1 43 10
Total 204 221 33
£ per farmed ha
Subsidy reduction
10% 20.40 22.10 3.30
20% 40.80 44.20 6.60
30% 61.20 66.30 9.90
40% 81.60 88.40 13.20
Assuming a 20% cut in agricultural subsidy payments, all else being equal, this would
bring about an improvement in the competitiveness of forestry of around £41/ha on
arable land, £44/ha on improved land and £7/ha on unimproved land.
26
Comparing these changes with the relative shortfall in forestry competitiveness
identified earlier, it is apparent that a 20% reduction in agricultural subsidies alone
would do little to alter the current situation.
It is also likely that a reduction in Single Farm Payment would be offset at least
partially by improved market returns. Much will depend on the sector and the degree
to which domestic (Scottish and EU) agricultural production can be replaced by
imports.
5.3 Impact of timber revenue
The model results so far indicate that conifers are currently uncompetitive with
broadleaved plantings due to lower payment rates for planting and the longer
duration of annual Farm Land Premium Payments. Conifer planting is also
uncompetitive with agriculture in many situations.
These results however, exclude any revenue from timber. This assumption has been
made due to the fact that farmers planting decisions are driven mainly by short term
cashflow considerations. This puts the emphasis on grant aid as the main income
stream. However timber returns have improved considerably in recent months and
future price levels are expected to be sustained by rising demand for both fuel and
building materials.
A further calculation has therefore been undertaken to determine the level of timber
price needed to significantly improve the competitiveness of conifer plantings.
Assumptions
Planting option - (5) 150ha unimproved conifer.
Planting costs and returns – as per base model (see previous section) including
income foregone of £11/ha per year
Species – 85% sitka spruce – 112.5ha
Yield class – 16
Rotation – 40yrs
Thinning commencing – 22 yrs

27
Figure 5 – discounted forestry cashflows – Option (5) conifers on unimproved
land
Net Present Values
-750-500-250-250500750
1,0001,2501,5001,7502,000
1
6
11
16
21
26
31
36
41
Year from planting
£ p
er
ha
£0/t £10/t £20/t £30/t
Note - timber prices are net standing values £/t across both thinnings and clear felling
Results
Timber prices of £10/t standing make little significant difference to the financial
competitiveness of conifer planting on unimproved land. A NPV of just
£296/ha over 40 years leaves little return for the investment and the risk
incurred. It is greater however than the negative returns delivered where no
timber income is generated.
Timber prices of £20/t standing start to make a significant difference to the
financial competitiveness of conifer planting on unimproved land. A NPV of
£983/ha over 40 years represents a modest return for the investment and the
risk incurred.
Timber prices of £30/t standing make a significant difference to the financial
competitiveness of conifer planting on unimproved land. A NPV of £1,670/ha
over 40 years represents a good return for the investment and the risk
incurred.

28
Rising timber prices could start to make timber income a more significant driver of
farmer’s planting decision. However cash flow remains a major obstacle and some
way would need to be found to generate cash flow earlier on.
On favourable sites short rotation forestry may offer the chance to commence
thinning and hence generate revenue at an earlier date. Alternatively some form of
lease payment from a long term investor such as a pension fund could offer an
alternative annual payment albeit at a relatively low level.
29
Appendix 1 - references Bell Ingram: 2009 Land and Sporting Capitals Review Bird, P.R. et al . "The role of shelter in Australia for protecting soils, plants and livestock". Agroforestry Systems18: 59-86 (1992). Caborn, J M The value of shelterbelts to farming, Agric. Rev. 2 (9) (1957), pp. 14–19 Carbon, J M Shelterbelts and microclimate. FC Bulletin 29 HMSO London CKD Galbraith: Woodland values calculations 2009 Forestry Commission, Standard costs and timber values Griffith, C Improvement of Air and Water Quality Around Livestock Confinement Areas Through the Use of Shelterbelts John Cleggs: Market Valuations 2010. Knot, J Benefits of windbreaks to field and forage crops. Agric Ecosystems 22/23 (1988) UPM Tilhill and Savills: Forest Market Report 2009 Edition 10 Scottish Government: Scottish Farm Accounts Scheme Woodlands For Sale: www.woodlandsforsale.com

30
Appendix 2 – farm cost and returns

31
2006/07 2007/08 2006/07 2007/08 2006/07 2007/08(A) Arable (A) Arable (B) Improved grass (B) Improved grass (C) Unimproved grass (C) Unimproved grass
Farmed area (ha) 150 157 188 187 614 690Adjusted area 148 155 120 116 614 690
Market returns (£) 94,903 133,012 60,222 60,406 21,503 18,924
Misc 12,821 15,953 3,802 3,986 6,355 8,855
Subsidies - SFP 31,276 31,853 33,722 33,311 15,134 15,977
Subsidies - LFAS 76 116 5,331 7,974 4,337 6,994
Subsidies - other 3,206 3,692 3,310 5,357 4,231 8,194
OUTPUT (£) 142,282 184,626 106,387 111,034 51,560 58,944
VARIABLE COSTS (£) 48,262 55,637 44,111 45,115 19,996 19,744
GROSS MARGIN (£) 94,020 128,989 62,276 65,919 31,564 39,200
Fixed costs - operations 51,568 59,253 33,699 34,542 21,644 19,453
Fixed costs - land 21,740 24,514 14,992 14,296 8,199 7,891
FIXED COSTS (£) 73,308 83,767 48,691 48,838 29,843 27,344
NET FARM INCOME (£) 20,712 45,222 13,585 17,081 1,721 11,856
Less farmer & spouse manual labour 16,724 18,600 20,280 22,040 14,665 16,885
M&I Income 3,988 26,622 -6695 -4959 -12944 -5029
Per farmed ha
2006/07 2007/08 2006/07 2007/08 2006/07 2007/08
(A) Arable (A) Arable (B) Improved grass (B) Improved grass (C) Unimproved grass (C) Unimproved grass
Farmed area (ha) 150 157 188 187 614 690
Adjusted area 148 155 120 116 614 690
Market returns (£) 633 847 320 323 35 27
Misc 85 102 20 21 10 13
Subsidies - SFP 209 203 179 178 25 23
Subsidies - LFAS 1 1 28 43 7 10
Subsidies - other 21 24 18 29 7 12
OUTPUT (£) 949 1,176 566 594 84 85
VARIABLE COSTS (£) 322 354 235 241 33 29
GROSS MARGIN (£) 627 822 331 353 51 57
Fixed costs - operations 344 377 179 185 35 28
Fixed costs - land 145 156 80 76 13 11
FIXED COSTS (£) 489 534 259 261 49 40
NET FARM INCOME (£) 138 288 72 91 3 17
Less farmer & spouse manual labour 111 118 108 118 24 24
M&I Income 27 170 -36 -27 -21 -7
Agricultural income foregone per ha planted
2yr av 2yr av 2yr av
(i) Basic 541 720 631 311 331 321 41 44 43
(ii)+ Operations 198 343 270 132 146 139 6 16 11 (i) + Farmer labour 86 224 155 24 29 26 -18 -9 13-

32
Appendix 3 – forestry costs and returns (Excluding agricultural income foregone)
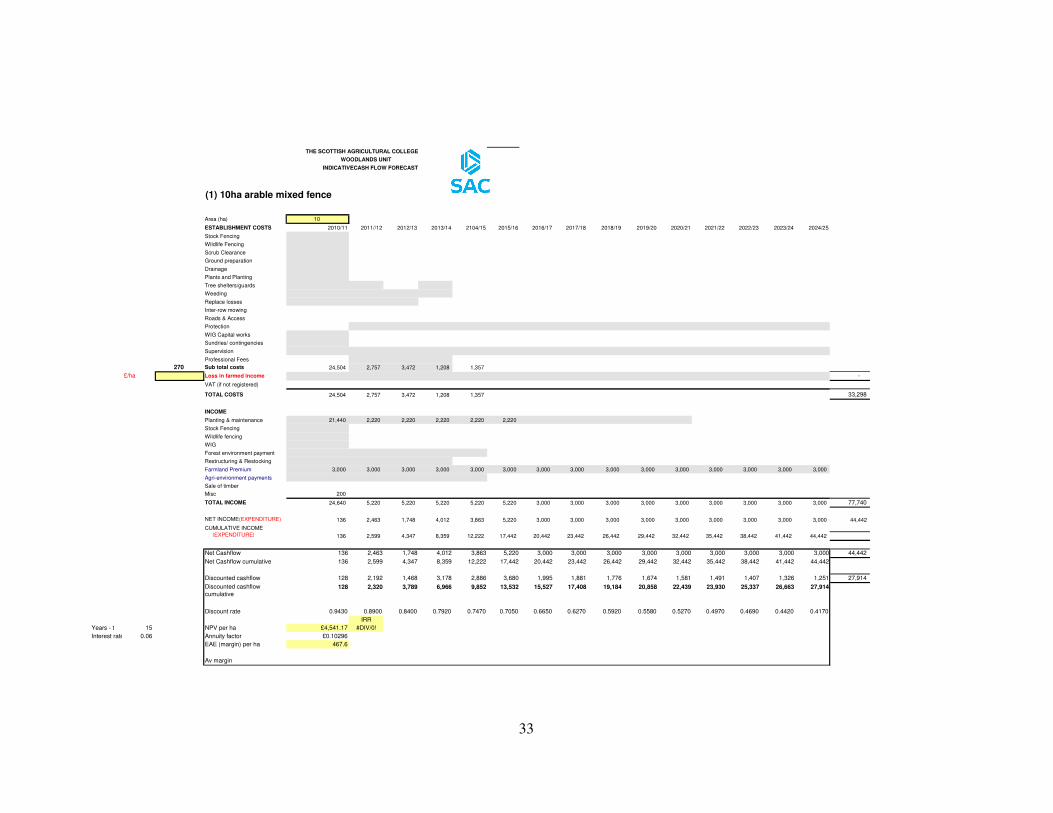
33
THE SCOTTISH AGRICULTURAL COLLEGE
WOODLANDS UNIT
(1) 10ha arable mixed fence
Area (ha) 10
ESTABLISHMENT COSTS 2010/11 2011//12 2012/13 2013/14 2104/15 2015/16 2016/17 2017/18 2018/19 2019/20 2020/21 2021/22 2022/23 2023/24 2024/25
Stock Fencing
Wildlife Fencing
Scrub Clearance
Ground preparation
Drainage
Plants and Planting
Tree shelters/guards
Weeding
Replace losses
Inter-row mowing
Roads & Access
Protection
WIG Capital works
Sundries/ contingencies
Supervision
Professional Fees
270 Sub total costs 24,504 2,757 3,472 1,208 1,357
£/ha Loss in farmed income -
VAT (if not registered)
TOTAL COSTS 24,504 2,757 3,472 1,208 1,357 33,298
INCOME
Planting & maintenance 21,440 2,220 2,220 2,220 2,220 2,220
Stock Fencing
Wildlife fencing
WIG
Forest environment payment
Restructuring & Restocking
Farmland Premium 3,000 3,000 3,000 3,000 3,000 3,000 3,000 3,000 3,000 3,000 3,000 3,000 3,000 3,000 3,000
Agri-environment payments
Sale of timber
Misc 200
TOTAL INCOME 24,640 5,220 5,220 5,220 5,220 5,220 3,000 3,000 3,000 3,000 3,000 3,000 3,000 3,000 3,000 77,740
NET INCOME(EXPENDITURE) 136 2,463 1,748 4,012 3,863 5,220 3,000 3,000 3,000 3,000 3,000 3,000 3,000 3,000 3,000 44,442
CUMULATIVE INCOME
(EXPENDITURE) 136 2,599 4,347 8,359 12,222 17,442 20,442 23,442 26,442 29,442 32,442 35,442 38,442 41,442 44,442
Net Cashflow 136 2,463 1,748 4,012 3,863 5,220 3,000 3,000 3,000 3,000 3,000 3,000 3,000 3,000 3,000 44,442
Net Cashflow cumulative 136 2,599 4,347 8,359 12,222 17,442 20,442 23,442 26,442 29,442 32,442 35,442 38,442 41,442 44,442
Discounted cashflow 128 2,192 1,468 3,178 2,886 3,680 1,995 1,881 1,776 1,674 1,581 1,491 1,407 1,326 1,251 27,914
Discounted cashflow
cumulative 128 2,320 3,789 6,966 9,852 13,532 15,527 17,408 19,184 20,858 22,439 23,930 25,337 26,663 27,914
Discount rate 0.9430 0.8900 0.8400 0.7920 0.7470 0.7050 0.6650 0.6270 0.5920 0.5580 0.5270 0.4970 0.4690 0.4420 0.4170
IRR
Years - t 15 NPV per ha £4,541.17 #DIV/0!
Interest rate - i 0.06 Annuity factor £0.10296
EAE (margin) per ha 467.6
Av margin
INDICATIVECASH FLOW FORECAST

34
THE SCOTTISH AGRICULTURAL COLLEGE
WOODLANDS UNIT
(2) 35ha improved native broadleaves
35
ESTABLISHMENT COSTS 2010/11 2011//12 2012/13 2013/14 2104/15 2015/16 2016/17 2017/18 2018/19 2019/20 2020/21 2021/22 2022/23 2023/24 2024/25
Stock Fencing
Wildlife Fencing
Scrub Clearance
Ground preparation
Drainage
Plants and Planting
Tree shelters/guards
Weeding
Replace losses
Inter-row mowing
Roads & Access
Protection
WIG Capital works
Sundries/ contingencies
Supervision
Professional Fees
139 Sub total costs 73,572 8,399 10,439 5,253 4,768
£/ha Loss in farmed income -
VAT (if not registered)
TOTAL COSTS 73,572 8,399 10,439 5,253 4,768
INCOME
Planting & maintenance 68,635 7,630 7,630 7,630 7,630 7,630
Stock Fencing
Wildlife fencing
WIG
Forest environment payment
Restructuring & Restocking
Farmland Premium 5,600 5,600 5,600 5,600 5,600 5,600 5,600 5,600 5,600 5,600 5,600 5,600 5,600 5,600 5,600
Agri-environment payments
Sale of timber
Misc 200
TOTAL INCOME 74,435 13,230 13,230 13,230 13,230 13,230 5,600 5,600 5,600 5,600 5,600 5,600 5,600 5,600 5,600 190,985
NET INCOME(EXPENDITURE) 863 4,831 2,791 7,977 8,462 13,230 5,600 5,600 5,600 5,600 5,600 5,600 5,600 5,600 5,600 190,985
CUMULATIVE INCOME
(EXPENDITURE) 863 5,694 8,484 16,461 24,923 38,153 43,753 49,353 54,953 60,553 66,153 71,753 77,353 82,953 88,553
Net Cashflow 863 4,831 2,791 7,977 8,462 13,230 5,600 5,600 5,600 5,600 5,600 5,600 5,600 5,600 5,600 88,553
Net Cashflow cumulative 139 4,970 7,760 15,737 24,199 37,429 43,029 48,629 54,229 59,829 65,429 71,029 76,629 82,229 87,829
Discounted cashflow 814 4,299 2,344 6,317 6,321 9,327 3,724 3,511 3,315 3,125 2,951 2,783 2,626 2,475 2,335 56,269
Discounted cashflow
cumulative 814 5,113 7,457 13,775 20,096 29,423 33,147 36,658 39,973 43,098 46,049 48,832 51,459 53,934 56,269
Discount rate 0.9430 0.8900 0.8400 0.7920 0.7470 0.7050 0.6650 0.6270 0.5920 0.5580 0.5270 0.4970 0.4690 0.4420 0.4170
IRR
Years - t 15 NPV per ha £2,603.85 #DIV/0!
Interest rate - i 0.06 Annuity factor £0.10296
EAE (margin) per ha 268.1
INDICATIVECASH FLOW FORECAST

35
THE SCOTTISH AGRICULTURAL COLLEGE
WOODLANDS UNIT
(3) 35ha improved conifer fence
35
ESTABLISHMENT COSTS 2010/11 2011//12 2012/13 2013/14 2104/15 2015/16 2016/17 2017/18 2018/19 2019/20 2020/21 2021/22 2022/23 2023/24 2024/25
Stock Fencing
Wildlife Fencing
Scrub Clearance
Ground preparation
Drainage
Plants and Planting
Tree shelters/guards
Weeding
Replace losses
Inter-row mowing
Roads & Access
Protection
WIG Capital works
Sundries/ contingencies
Supervision
Professional Fees
139 Sub total costs 54,306 10,824 10,775 2,737 949
£/ha Loss in farmed income -
VAT (if not registered)
TOTAL COSTS 54,306 10,824 10,775 2,737 949 79,591
INCOME
Planting & maintenance 42,210 5,635 5,635 5,635 5,635 5,635
Stock Fencing
Wildlife fencing
WIG
Forest environment payment
Restructuring & Restocking
Farmland Premium 5,600 5,600 5,600 5,600 5,600 5,600 5,600 5,600 5,600 5,600
Agri-environment payments
Sale of timber
Misc 200
TOTAL INCOME 48,010 11,235 11,235 11,235 11,235 11,235 5,600 5,600 5,600 5,600 126,585
NET INCOME(EXPENDITURE) (6,296) 411 460 8,498 10,286 11,235 5,600 5,600 5,600 5,600 46,994
CUMULATIVE INCOME
(EXPENDITURE) (6,296) (5,885) (5,425) 3,073 13,359 24,594 30,194 35,794 41,394 46,994 46,994 46,994 46,994 46,994 46,994
Net Cashflow - 6,296 411 460 8,498 10,286 11,235 5,600 5,600 5,600 5,600 - - - - - 46,994
Net Cashflow cumulative - 6,296 - 5,885 - 5,425 3,073 13,359 24,594 30,194 35,794 41,394 46,994 46,994 46,994 46,994 46,994 46,994
Discounted cashflow - 5,937 366 386 6,731 7,684 7,921 3,724 3,511 3,315 3,125 - - - - - 30,825
Discounted cashflow
cumulative
- 5,937 - 5,571 - 5,185 1,546 9,229 17,150 20,874 24,385 27,700 30,825 30,825 30,825 30,825 30,825 30,825
Discount rate 0.9430 0.8900 0.8400 0.7920 0.7470 0.7050 0.6650 0.6270 0.5920 0.5580 0.5270 0.4970 0.4690 0.4420 0.4170
IRR
Years - t 15 NPV per ha £1,409.40 58%
Interest rate - i 0.06 Annuity factor £0.10296
EAE (margin) per ha 145.1
Av margin
INDICATIVECASH FLOW FORECAST
36
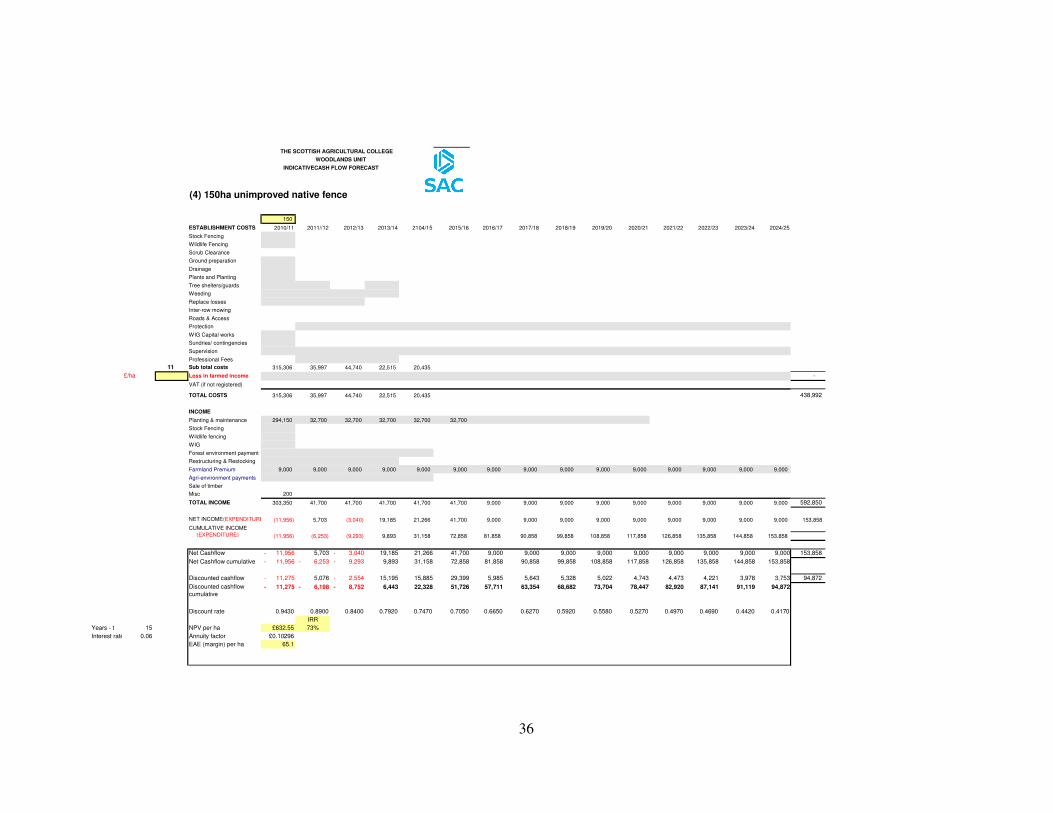
THE SCOTTISH AGRICULTURAL COLLEGE
WOODLANDS UNIT
(4) 150ha unimproved native fence
150
ESTABLISHMENT COSTS 2010/11 2011//12 2012/13 2013/14 2104/15 2015/16 2016/17 2017/18 2018/19 2019/20 2020/21 2021/22 2022/23 2023/24 2024/25
Stock Fencing
Wildlife Fencing
Scrub Clearance
Ground preparation
Drainage
Plants and Planting
Tree shelters/guards
Weeding
Replace losses
Inter-row mowing
Roads & Access
Protection
WIG Capital works
Sundries/ contingencies
Supervision
Professional Fees
11 Sub total costs 315,306 35,997 44,740 22,515 20,435
£/ha Loss in farmed income -
VAT (if not registered)
TOTAL COSTS 315,306 35,997 44,740 22,515 20,435 438,992
INCOME
Planting & maintenance 294,150 32,700 32,700 32,700 32,700 32,700
Stock Fencing
Wildlife fencing
WIG
Forest environment payment
Restructuring & Restocking
Farmland Premium 9,000 9,000 9,000 9,000 9,000 9,000 9,000 9,000 9,000 9,000 9,000 9,000 9,000 9,000 9,000
Agri-environment payments
Sale of timber
Misc 200
TOTAL INCOME 303,350 41,700 41,700 41,700 41,700 41,700 9,000 9,000 9,000 9,000 9,000 9,000 9,000 9,000 9,000 592,850
NET INCOME(EXPENDITURE) (11,956) 5,703 (3,040) 19,185 21,266 41,700 9,000 9,000 9,000 9,000 9,000 9,000 9,000 9,000 9,000 153,858
CUMULATIVE INCOME
(EXPENDITURE) (11,956) (6,253) (9,293) 9,893 31,158 72,858 81,858 90,858 99,858 108,858 117,858 126,858 135,858 144,858 153,858
Net Cashflow - 11,956 5,703 - 3,040 19,185 21,266 41,700 9,000 9,000 9,000 9,000 9,000 9,000 9,000 9,000 9,000 153,858
Net Cashflow cumulative - 11,956 - 6,253 - 9,293 9,893 31,158 72,858 81,858 90,858 99,858 108,858 117,858 126,858 135,858 144,858 153,858
Discounted cashflow - 11,275 5,076 - 2,554 15,195 15,885 29,399 5,985 5,643 5,328 5,022 4,743 4,473 4,221 3,978 3,753 94,872
Discounted cashflow
cumulative- 11,275 - 6,198 - 8,752 6,443 22,328 51,726 57,711 63,354 68,682 73,704 78,447 82,920 87,141 91,119 94,872
Discount rate 0.9430 0.8900 0.8400 0.7920 0.7470 0.7050 0.6650 0.6270 0.5920 0.5580 0.5270 0.4970 0.4690 0.4420 0.4170
IRR
Years - t 15 NPV per ha £632.55 73%
Interest rate - i 0.06 Annuity factor £0.10296
EAE (margin) per ha 65.1
INDICATIVECASH FLOW FORECAST

37
THE SCOTTISH AGRICULTURAL COLLEGE
WOODLANDS UNIT
(5) 150ha Unimproved Conifer
150
ESTABLISHMENT COSTS 2010/11 2011//12 2012/13 2013/14 2104/15 2015/16 2016/17 2017/18 2018/19 2019/20 2020/21 2021/22 2022/23 2023/24 2024/25
Stock Fencing
Wildlife Fencing
Scrub Clearance
Ground preparation
Drainage
Plants and Planting
Tree shelters/guards
Weeding
Replace losses
Inter-row mowing
Roads & Access
Protection
WIG Capital works
Sundries/ contingencies
Supervision
Professional Fees
11 Sub total costs 232,740 46,387 46,179 11,729 4,068
£/ha Loss in farmed income -
VAT (if not registered)
TOTAL COSTS 232,740 46,387 46,179 11,729 4,068 341,103
INCOME
Planting & maintenance 180,900 24,150 24,150 24,150 24,150 24,150
Stock Fencing
Wildlife fencing
WIG
Forest environment payment
Restructuring & Restocking
Farmland Premium 9,000 9,000 9,000 9,000 9,000 9,000 9,000 9,000 9,000 9,000
Agri-environment payments
Sale of timber
Misc 200
TOTAL INCOME 190,100 33,150 33,150 33,150 33,150 33,150 9,000 9,000 9,000 9,000 391,850
NET INCOME(EXPENDITURE) (42,640) (13,237) (13,029) 21,421 29,082 33,150 9,000 9,000 9,000 9,000 50,747
CUMULATIVE INCOME
(EXPENDITURE) (42,640) (55,877) (68,907) (47,486) (18,403) 14,747 23,747 32,747 41,747 50,747 50,747 50,747 50,747 50,747 50,747
Net Cashflow - 42,640 - 13,237 - 13,029 21,421 29,082 33,150 9,000 9,000 9,000 9,000 - - - - - 50,747
Net Cashflow cumulative - 42,640 - 55,877 - 68,907 - 47,486 - 18,403 14,747 23,747 32,747 41,747 50,747 50,747 50,747 50,747 50,747 50,747
Discounted cashflow - 40,210 - 11,781 - 10,945 16,966 21,725 23,371 5,985 5,643 5,328 5,022 - - - - - 21,103
Discounted cashflow
cumulative- 40,210 - 51,991 - 62,935 - 45,970 - 24,245 - 875 5,110 10,753 16,081 21,103 21,103 21,103 21,103 21,103 21,103
Discount rate 0.9430 0.8900 0.8400 0.7920 0.7470 0.7050 0.6650 0.6270 0.5920 0.5580 0.5270 0.4970 0.4690 0.4420 0.4170
IRR
Years - t 15 NPV per ha £273.89 16%
Interest rate - i 0.06 Annuity factor £0.10296
EAE (margin) per ha 28.2
INDICATIVECASH FLOW FORECAST

38

39
Appendix 4 – Notes on the Farm Accounts Scheme Net Farm Income – excluding any return for farmer manual work and Management and Investment Income The farm types are based on EC farm typology. Specialist sheep (LFA) Farms in the LFA with more than two-thirds of the total standard gross margin coming from sheep. Specialist beef (LFA) Farms in the LFA with more than two-thirds of the total standard gross margin coming from cattle. Cattle and sheep (LFA) Farms in the LFA with more than two-thirds of the standard gross margin coming from sheep and beef cattle together. Cereals Farms where more than two-thirds of the standard gross margin comes from cereals and oilseeds. General cropping Other farms where more than two-thirds of the total standard gross margin comes from all crops. Dairy Farms where more than two-thirds of the total standard gross margin comes from dairy cows. Lowground cattle & sheep Farms mainly NOT in the LFA with more than two-thirds of the total standard gross margin coming from sheep and beef cattle. Mixed Farms where no enterprise contributes more than two-thirds of gross margins Note - adjusted area is the total farmed area including rough grazing converted to an equivalent area of average quality grazing.