Impact of wastewater treatment plants on receiving surface ...
33
HAL Id: hal-01072988 https://hal.archives-ouvertes.fr/hal-01072988 Submitted on 8 Oct 2014 HAL is a multi-disciplinary open access archive for the deposit and dissemination of sci- entific research documents, whether they are pub- lished or not. The documents may come from teaching and research institutions in France or abroad, or from public or private research centers. L’archive ouverte pluridisciplinaire HAL, est destinée au dépôt et à la diffusion de documents scientifiques de niveau recherche, publiés ou non, émanant des établissements d’enseignement et de recherche français ou étrangers, des laboratoires publics ou privés. Impact of wastewater treatment plants on receiving surface waters and a tentative risk evaluation: the case of estrogens and beta blockers V. Gabet Giraud, Cecile Miege, R. Jacquet, Marina Coquery To cite this version: V. Gabet Giraud, Cecile Miege, R. Jacquet, Marina Coquery. Impact of wastewater treatment plants on receiving surface waters and a tentative risk evaluation: the case of estrogens and beta blockers. Environmental Science and Pollution Research, Springer Verlag, 2014, 21 (3), p. 1708 - p. 1722. 10.1007/s11356-013-2037-7. hal-01072988
Transcript of Impact of wastewater treatment plants on receiving surface ...

HAL Id: hal-01072988https://hal.archives-ouvertes.fr/hal-01072988
Submitted on 8 Oct 2014
HAL is a multi-disciplinary open accessarchive for the deposit and dissemination of sci-entific research documents, whether they are pub-lished or not. The documents may come fromteaching and research institutions in France orabroad, or from public or private research centers.
L’archive ouverte pluridisciplinaire HAL, estdestinée au dépôt et à la diffusion de documentsscientifiques de niveau recherche, publiés ou non,émanant des établissements d’enseignement et derecherche français ou étrangers, des laboratoirespublics ou privés.
Impact of wastewater treatment plants on receivingsurface waters and a tentative risk evaluation: the case
of estrogens and beta blockersV. Gabet Giraud, Cecile Miege, R. Jacquet, Marina Coquery
To cite this version:V. Gabet Giraud, Cecile Miege, R. Jacquet, Marina Coquery. Impact of wastewater treatment plantson receiving surface waters and a tentative risk evaluation: the case of estrogens and beta blockers.Environmental Science and Pollution Research, Springer Verlag, 2014, 21 (3), p. 1708 - p. 1722.�10.1007/s11356-013-2037-7�. �hal-01072988�

Impact of wastewater treatment plants on receiving surface waters and a
tentative risk evaluation: the case of estrogens and betablockers
V. Gabet-Giraud, C. Miège*, R. Jacquet, M. Coquery
Irstea, U.R. MALY, 5 rue de la Doua, CS70077, 69626 Villeurbanne Cedex, France
*: corresponding author, [email protected]
Abstract
Five estrogenic hormones (unconjugated + conjugated fractions) and 10 betablockers were
analyzed in three wastewater treatment plant (WWTP) effluents and receiving river waters in the
area of Lyon, France. In the different samples, only two estrogens were quantified: estrone and
estriol. Some betablockers, such as atenolol, acebutolol and sotalol, were almost always quantified,
but others, e.g. betaxolol, nadolol and oxprenolol were rarely quantified. Concentrations measured
in river waters were in the ng/L range for estrogens and between 0.3 and 210 ng/L for
betablockers, depending on the substance and the distance from the WWTP outfall. The impact of
the WWTP on the receiving rivers was studied, and showed a clear increase in concentrations near
the WWTP outfall. For estrogens, the persistence in surface waters was not evaluated given the
low concentrations levels (around 1 ng/L). For betablockers, concentrations measured downstream
of the WWTP outfall were up to 16 times higher than those measured upstream. Also, the
persistence of metoprolol, nadolol and propranolol was noted even 2 km downstream of the
WWTP outfall. The comparison of betablocker fingerprints in the samples collected in effluent and
in the river also showed the impact of WWTP outfall on surface waters. Finally, a tentative
environmental risk evaluation was performed on 15 sites by calculating the ratio of receiving water
concentrations to predicted non-effect concentrations (PNEC). For estrogens, a total PNEC of 5
ng/L was considered, and these substances were not linked to any potential environmental risk
Author-produced version of the article published in Environmental Science and Pollution Research (2014), vol. 21, n° 3, pp. 1708-1722 The original publication is available at http://link.springer.com/, doi:10.1007/s11356-013-2037-7

(only one site showed an environmental risk ratio above 1). Unfortunately, few PNECs are
available, and risk evaluation was only possible for 4 of the 10 betablockers studied: acebutolol,
atenolol, metoprolol and propranolol. Only propranolol presented a ratio near or above 1, showing
a possible environmental risk for 4 receiving waters out of 15.
Keywords: estrogens, betablockers, wastewater treatment plant, surface water, risk evaluation
Abbreviations: E1 (estrone), αE2 (17α-estradiol), βE2 (17β-estradiol), E3 (estriol), EE2
(ethynylestradiol), E1-D4 (estrone-D4), E2-D2 (17β-estradiol-D2), E3-D2 (estriol-D2), EE2-D4
(17α-ethynylestradiol-D4), Eff. (effluent), SW (surface water), WWTP (wastewater treatment
plant), ACE (acebutolol), ATE (atenolol), BET (betaxolol), BIS (bisoprolol), MET (metoprolol),
NAD (nadolol), OXP (oxprenolol), PROP (propranolol), SOT (sotalol), TIM (timolol), ATE-D7
(atenolol-D7), MET-D7 (metoprolol-D7), PROP-D7 (propranolol-D7), MEC (measured
environmental concentration), PNEC (predicted non-effect concentration), LC-MS/MS (liquid
chromatography coupled with tandem mass spectrometry), MRM (multiple reaction monitoring),
PEC (predicted environmental concentration), QMNA5 (5-year lowest water flow discharge),
NOEC (chronic non-observed effect concentration), EC50 (half maximal effective concentration)
1. Introduction
Pharmaceuticals have been quantified worldwide at the ng/L level in surface waters (Grujic
et al., 2009; Kasprzyk-Hordern et al., 2009; Zhou et al., 2009). Wastewater treatment plants
(WWTPs) are recognized as the main entryway of these substances into the aquatic environment
(Bendz et al., 2005; Castiglioni et al., 2006; Nakada et al., 2006). WWTPs are not designed to
treat and remove pharmaceuticals, which are only degraded to some degree during sewage
Author-produced version of the article published in Environmental Science and Pollution Research (2014), vol. 21, n° 3, pp. 1708-1722 The original publication is available at http://link.springer.com/, doi:10.1007/s11356-013-2037-7

treatment (Miege et al., 2009b). Betablockers are a class of drugs used for various indications such
as cardiac arrhythmias, hypertension and cardioprotection after a heart attack. These
pharmaceuticals are widely used in France, where, for example, more than 18 t of atenolol were
consumed in 2004 (Besse et al., 2008). Once consumed, betablockers are excreted partly
unchanged (Vieno et al., 2006; Hernando et al., 2007; Maurer et al., 2007). The consequences of
their presence in the aquatic environment are not well-documented but the problem arised since
beta-adrenergic receptors were found in fish (Haider and Baqri, 2000). Also, growth dysfunctions
were observed on invertebrates in the presence of 0.5 mg/L of propranolol (Huggett et al., 2002).
Unlike betablockers, estrogens can have a natural origin and are secreted daily by the human body
(Ternes and Joss, 2006). They can also be consumed to treat, for example, menopausal problems or
for contraception. In Europe, EE2, a synthetic estrogen, is commonly used in contraceptive pills: in
2004 in France, 40 kg of EE2 was consumed (Besse et al., 2008). These substances act as
endocrine-disrupting compounds and can induce effects on fish reproduction from the ng/L level
(Hansen et al., 1998; Larsson et al., 1999; Jobling et al., 2003; Gutjahr-Gobell et al., 2006).
Betablockers in WWTP effluents and surface waters have already been studied (Ternes,
1998; Andreozzi et al., 2003; Gros et al., 2006; Miege et al., 2006; Vieno et al., 2006), but most of
the analytical methods used are multi-residue methods (i.e. with a lower sensitivity) and only
aimed at analyzing 4 or 5 betablockers. In France, few data for concentrations in rivers are
available (Andreozzi et al., 2003; Miege et al., 2006; Coetsier et al., 2009) and to our knowledge,
no data are available for atenolol, nadolol and sotalol, which are among the most hydrophilic
betablockers, and widely used in France. Many studies have focused on estrogens and their
analysis in effluents and surface waters (Baronti et al., 2000; Kuch and Ballschmiter, 2001; Lagana
et al., 2004; Vethaak et al., 2005; Morteani et al., 2006; Vigano et al., 2006; Loos et al., 2007;
Kuster et al., 2008), but few have been conducted in France (Cargouet et al., 2004; Labadie and
Budzinski, 2005; Vulliet et al., 2008; Miege et al., 2009c). Although some estrogens are often
Author-produced version of the article published in Environmental Science and Pollution Research (2014), vol. 21, n° 3, pp. 1708-1722 The original publication is available at http://link.springer.com/, doi:10.1007/s11356-013-2037-7

analyzed (such as E1, βE2 and EE2), others, such as αE2 and E3 are less frequently studied.
Labadie et al. (2005) studied the impact of a WWTP on its receiving river by analyzing estrogens.
Samples were collected from 30 m to 10 km downstream of a WWTP outfall, and the work
focused on temporal and spatial steroid distributions along the river. Also, Castiglioni et al. (2006)
studied the distribution and fate of pharmaceuticals (including atenolol, estrone, 17β-estradiol and
ethynylestradiol) in surface water receiving effluents from a WWTP; percentage attenuation in
river water was also evaluated. However, these studies focused only on one site. In addition, Vieno
et al. (2006) studied phamaceuticals in two rivers impacted by a WWTP, but only 4 betablockers
were analyzed (acebutolol, atenolol, metoprolol and sotalol). The authors compared concentrations
at different sampling points in the river and estimated loss of the compounds by comparing the
load in the downstream river with the loads from all the WWTPs located on the river. Finally,
Miege et al. (2009) proposed a risk evaluation study on 5 rivers impacted by effluent release.
However, the study was based only on predictive environmental concentrations in rivers calculated
from measured concentrations in effluent. Hence further investigations are needed to improve our
knowledge of the extent of river contamination caused by WWTP outfall, which may vary
according to the geographical location or the type of WWTP.
The objective of this study was to evaluate the impact of selected French WWTPs on the
receiving waters. We analysed 10 betablockers: acebutolol (ACE), atenolol (ATE), betaxolol
(BET), bisoprolol (BIS), metoprolol (MET), nadolol (NAD), oxprenolol (OXP), propranolol
(PROP), sotalol (SOT) and timolol (TIM), and 5 estrogens: estrone (E1), 17α-estradiol (αE2), 17β-
estradiol (βE2), estriol (E3) and ethynylestradiol (EE2) selected for their high consumption, the
data available in the scientific literature or their toxicity. To evaluate the impact of WWTPs on
receiving rivers, three sites located in the Lyon area were studied and both effluent and river
samples were analyzed. For each site, concentrations measured in rivers upstream and downstream
of the WWTP outfalls were compared. A tentative risk evaluation was performed for these three
Author-produced version of the article published in Environmental Science and Pollution Research (2014), vol. 21, n° 3, pp. 1708-1722 The original publication is available at http://link.springer.com/, doi:10.1007/s11356-013-2037-7

sites, using either measured concentrations in rivers or predicted concentrations in rivers from
measured concentration in effluents. This tentative risk evaluation was completed using results
obtained on 12 WWTP effluents previously analysed (Gabet-Giraud et al, 2010), and after
calculation of predicted concentrations in downstream rivers.
2. Materials and methods
2.1. Sampling
To study the impact of wastewater treatment plants (WWTPs) on surface waters, river
water and effluent samples were collected at three sites (Beaujeu, Bourgoin-Jallieu and Fontaines-
sur-Saône, Figure 1). Automatic 24 h composite samples were collected for effluent according to
Gabet-Giraud et al (2010). Grab surface water samples were collected in 2.5 L amber glass bottles
previously rinsed twice with the sample water. All the samples were stored at 4 °C during transport
to the laboratory. Filtering and extractions were performed within 24 h after sampling.
Three rivers located in the area of Lyon (France) were selected for this study (Figure 1).
The River Saône (length 480 km) is the main tributary of the River Rhône. The sampling site, near
Fontaines-sur-Saône, is impacted by domestic and industrial contaminations. The River Ardières
(length 9.9 km) is a tributary of the River Saône. The site, near the town of Beaujeu, is impacted
by different contamination sources: wastewater treatment plants, industry and agriculture (mainly
vineyards). The River Bourbre (length 72.2 km) is another tributary of the River Rhône. This site,
near the town of Bourgoin-Jallieu, is impacted by domestic and industrial contamination.
Figure 1.
The characteristics of the WWTPs studied are presented in Table 1. Two are equipped with
a primary treatment system (primary settling). Biological treatments consist of activated sludge
(conventional or medium rate) or a biological filter.
Table 1.
Author-produced version of the article published in Environmental Science and Pollution Research (2014), vol. 21, n° 3, pp. 1708-1722 The original publication is available at http://link.springer.com/, doi:10.1007/s11356-013-2037-7

To study the impact of WWTPs, samples were collected in effluents and in rivers up- and
downstream of the effluent outfall, as described in Table 1. For the River Bourbre a more complex
configuration required a different sampling methodology (Figure 2). The River Bourbre was
sampled at one sampling point located 20 m upstream, and two sampling points located 5 m and
2000 m downstream of the confluence with the Bion, which receives the WWTP effluent. The
Bion was also sampled 2000 m upstream of the WWTP outfall.
To obtain representative results, sampling was performed once per week for at least three
consecutive weeks. The Saône River was sampled on 6 different days in November 2007 and June
2008. The River Ardières was sampled 3 times in June 2008. The River Bourbre was sampled 4
times in September 2008. The Bion River samples are not considered in this paper (River Bion
flow is negligible compared with the WWTP effluent flow). A total of 42 surface water samples
(18 for Saône, 12 for Ardières and 12 for Bourbre) and 8 effluent samples (2 for Saône, 2 for
Ardières and 4 for Bourbre) were collected between November 2007 and September 2008.
Figure 2.
2.2. Sample preparation and analysis
Water samples were first filtered through pyrolyzed (450 °C, 1 h) glass fiber filters
(GF/F, 0.7 µm pore size).
The analytical method for the 5 estrogens is described elsewhere (Miege et al., 2009a).
Briefly, aliquots of filtrate spiked with deuterated estrogens (E1-D4, E2-D2, E3-D2 and EE2-D4)
were extracted by solid phase extraction (SPE) on Oasis HLB® cartridges and purified on Florisil
cartridges. Extracts were evaporated to dryness and reconstituted in a solution of E2 acetate, used
as an internal standard. For the analysis of total estrogens (i.e. after hydrolysis of conjugated
forms), enzymatic cleavage was performed using β-glucuronidase isolated from Helix pomatia
before extraction.
Author-produced version of the article published in Environmental Science and Pollution Research (2014), vol. 21, n° 3, pp. 1708-1722 The original publication is available at http://link.springer.com/, doi:10.1007/s11356-013-2037-7

The 10 betablockers were analysed as described in Gabet-Giraud et al (2010). Briefly,
aliquots of acidified filtrate were extracted by SPE on Oasis MCX® cartridges, evaporated to
dryness and reconstituted in a solution of metoprolol impurity A, used as an internal standard.
Aliquots of each sample were also spiked with the 10 betablockers to define recoveries for each
type of sample (i.e. river or effluent).
Analysis of estrogens and betablockers was performed by liquid chromatography coupled
with tandem mass spectrometry (LC-MS/MS) with acquisition in multiple reaction monitoring
(MRM) mode. As recommended in the EU Commission Decision 2002/657/EC, the MS-MS
conditions included the use of two ionization transitions for each compound (except for the
deuterated surrogates), one for quantification and one for identity confirmation.
Final estrogen concentrations were calculated using recoveries obtained for the internal
deuterated surrogates (αE2 and βE2 were both corrected by E2D2). For betablockers, final
concentrations were calculated using recoveries obtained for the non-deuterated betablockers in
spiked samples: concentrations were corrected only if the recoveries were below 80% or above
120%.
Method limit of quantification (LOQ) was estimated for each substance/sample pair as
described elsewhere (Miege et al., 2009a). For E1, αE2, βE2 and E3, LOQ values ranged between
0.3 and 2.7 ng/L, it can reached 9.0 ng/L for EE2. For betablockers, LOQ ranged between 0.2 and
1.1 ng/L.
2.3. Environmental risk evaluation
To evaluate the potential impact of each substance on the aquatic environment, we
determined a quotient risk calculated as the ratio of a measured environmental concentration
(MEC) to a predicted non-effect concentration (PNEC). When MEC is not available, a predicted
Author-produced version of the article published in Environmental Science and Pollution Research (2014), vol. 21, n° 3, pp. 1708-1722 The original publication is available at http://link.springer.com/, doi:10.1007/s11356-013-2037-7

environmental concentration (PEC) can be used (European Commission, 2003). An ecological risk
is suspected when the ratio (MEC or PEC)/PNEC equals or exceeds 1 for a given substance.
A tentative risk evaluation was compared using either the MEC or the PEC obtained in the
three rivers studied (part 3.5). This tentative risk evaluation was completed (part 3.6) for receiving
rivers of 12 WWTPs located in France (Paris area, Lyon area and in the south of France) using the
PEC in rivers calculated from mean concentrations (n = 2 or 3) measured in effluent samples
(AMPERES project, Gabet-Giraud et al., 2010).
For PEC calculation, fluxes of micropollutants were calculated (from concentrations
measured in effluents and WWTP flow) and divided by the 5-year lowest water flow discharges of
the receiving river (European Commission, 2003).
The 15 WWTPs (including the three studied in this paper) have various capacities (between
2900 and 700,000 PE) and discharge their effluents into rivers of different sizes (from 0.02 to 600
m3/s).
3. Results and discussion
3.1. Occurrence of estrogens
The frequency of quantification and measured concentrations are presented in Table 2.
Three estrogens (αE2, βE2 and EE2) were never quantified in effluents or in surface waters. The
most frequently quantified estrogen was E1, present in all the effluent samples and in 98% of
surface water samples. Concentrations of E1 ranged from 1.7 to 20 ng/L (mean 1.6 ng/L) in
effluent samples and from 0.3 to 3.9 ng/L (mean 9.3 ng/L) in surface waters. Also, E1 is one of the
estrogen present at the highest concentrations in influent samples (Gabet-Giraud et al., 2010); it is
produced by biodegradation of βE2 and EE2 (Ternes et al., 1999a; Czajka and Londry, 2006; Ren
et al., 2007). E3 was quantified only in the effluent samples from Fontaines-sur-Saône WWTP,
and in 1 of the 9 samples collected in the River Saône downstream of the WWTP. The measured
Author-produced version of the article published in Environmental Science and Pollution Research (2014), vol. 21, n° 3, pp. 1708-1722 The original publication is available at http://link.springer.com/, doi:10.1007/s11356-013-2037-7

concentrations in the effluent samples were high (between 202 and 218 ng/L), but decreased to
26 ng/L in surface waters downstream from the WWTP.
In the literature, as here, αE2, βE2 and EE2 have not been quantified in effluent or in
surface water (Boyd et al., 2003; Rodriguez-Mozaz et al., 2004; Labadie and Budzinski, 2005;
Farre et al., 2006; Kuster et al., 2008; Vulliet et al., 2008). A recent review (Miege et al., 2009b)
showed that E1 was quantified in 93% of the effluent samples studied (n = 79), at concentrations
ranging between 0.6 and 95 ng/L (mean value 20.9 ng/L), in agreement with our results. This
review also showed that E3 was quantified in more than 90% of the effluent samples (n = 33); that
is in the range of the maximum values reported in our study. Results from the literature confirmed
a low quantification frequency of E3 in surface waters (Rodriguez-Mozaz et al., 2004; Labadie and
Budzinski, 2005; Farre et al., 2006; Kuster et al., 2008). Reported concentrations of E3 in surface
waters ranged from 1 to 50 ng/L (Morteani et al., 2006; Vigano et al., 2006; Kuster et al., 2008;
Peng et al., 2008). A study conducted on the Mississippi River in the United States (a site outside
the direct influence of discharge points from WWTPs) and on Lake Pontchartrain (Louisiana
USA), showed that E1 was never detected (n = 4, LOD = 0.3 ng/L) (Boyd et al., 2003). In a recent
survey conducted on several European rivers, including the Rivers Ardières and Bourbre, a
quantification frequency of 16% was reported for E1 (n = 122, average concentration of 4 ng/L)
(Loos et al., 2009); E1 was quantified at 3 ng/L in the River Bourbre, but was not quantified in the
River Ardières. However, in this study the LOD was relatively high for E1 (2 ng/L). By contrast,
in a study conducted in Italy in the Rivers Po and Lambro, E1 was quantified in all samples (n = 3)
between 4 and 47 ng/L (Vigano et al., 2006); E3 was also quantified in all samples (n = 3) at
concentrations ranging between 4 and 50 ng/L. In samples collected in the River Tamagawa and
Lake Kasumigaura (Japan) receiving WWTP outfall, E1 was quantified systematically at
concentrations between 0.2 and 3.8 ng/L (n = 8) and E3 was never detected (LOD of 1.5 ng/L)
(Isobe et al., 2003). In France, a study conducted on an urban dam (receiving effluents from
Author-produced version of the article published in Environmental Science and Pollution Research (2014), vol. 21, n° 3, pp. 1708-1722 The original publication is available at http://link.springer.com/, doi:10.1007/s11356-013-2037-7

various WWTPs and industrial effluents) and a lake (supplied by different rivers from rural zones)
in the Rhône-Alpes area, showed that E1 was only quantified in one lake sample at 0.3 ng/L
(Vulliet et al., 2008). E1 was never detected in the River Seine, between 200 and 355 km
downstream of the city of Paris (n = 6, LOD between 0.3 and 8.0 ng/L depending on the analyte
and the matrix) (Labadie and Budzinski, 2005), while it was quantified from 1.1 to 3.0 ng/L in all
samples (n = 6) collected in the Rivers Seine and Oise upstream and downstream (about 60 km) of
Paris (Cargouet et al., 2004). However, some studies reported higher concentrations: up to 65 ng/L
in a Chinese river located in one of the most developed and densely populated areas of China
(Peng et al., 2008).
The differences between total (i.e. conjugated + unconjugated fractions) and unconjugated
fractions of estrogens were not significant. The proportion of free (i.e. unconjugated) estrogens
represented on average about 80% of the total estrogens for effluent and surface waters. The
differences between estrogen concentrations measured in samples with and without hydrolysis
could be linked to the analytical uncertainty, which was estimated in the range 20–50% depending
on the measured concentration. Thus we can consider that most of the estrogens in surface water
and effluent samples are present in the free form. Comparable results were obtained in surface
water samples (Belfroid et al., 1999). Estrogens are excreted by bodies in conjugated forms
(glucuronide or sulfate) which are more soluble, but in activated sludge processes, cleavage (E1-3S
in E1, and E2-17G in βE2) was observed (Ternes et al., 1999b; Baronti et al., 2000).
Table 2
3.2. Occurrence of betablockers
Betablockers were analyzed in 8 effluents and 34 surface water samples (Table 2); they
were not measured in the River Saône sampled in June 2008.
Author-produced version of the article published in Environmental Science and Pollution Research (2014), vol. 21, n° 3, pp. 1708-1722 The original publication is available at http://link.springer.com/, doi:10.1007/s11356-013-2037-7

In effluent samples, ACE, ATE, BIS, MET, PROP and SOT were always quantified. The
other betablockers, TIM, NAD, OXP and BET were quantified in 88, 50, 38 and 25% of effluent
samples, respectively. The highest concentrations were observed for ATE, SOT, ACE and PROP,
with median concentrations above 138 ng/L. Median concentrations were lower than 50 ng/L for
NAD, MET, BIS and OXP, with only traces of TIM.
In surface waters, ACE, ATE and SOT were the most frequently quantified betablockers
(>90%), while NAD, BET and OXP were only quantified in fewer than 32% of the samples. BIS,
MET, PROP and TIM were quantified at intermediate frequencies (44–82%) in surface water
samples, respectively. ATE, ACE and SOT were present at the highest median concentrations: 17,
14 and 5.5 ng/L, respectively. Median concentrations ranged between 0.3 and 4.6 ng/L for other
betablockers.
In the literature, ACE, ATE, BIS, MET, PROP and SOT are generally quantified in effluent
samples (>86%) with mean concentrations ranging between 10 and 990 ng/L (Andreozzi et al.,
2003; Vieno et al., 2006; Miege et al., 2009b). Reported concentrations for a substance can vary
widely from one country to another. For example, while MET was quantified at 80 ng/L (n = 2) in
France (Andreozzi et al., 2003), concentrations between 910 and 1070 ng/L (n = 3) were measured
in Finland (Vieno et al., 2006). For NAD and OXP, reported detection frequencies were higher
than those observed in our study. In a study conducted in the United States of America, NAD was
quantified in 71% of the effluent samples (n = 34) at a median concentration of 51 ng/L (Huggett
et al., 2003). Also, in a WWTP effluent monitoring campaign conducted in 4 European countries
including France, OXP was quantified in 71% of the samples (n = 7, median concentration 20
ng/L) (Andreozzi et al., 2003). On the contrary, while TIM was quantified in 88% of the effluent
samples in our study (mean concentration of 3.6 ng/L), it was only quantified in fewer than 7% of
German effluents (n = 29); however, the LOQ in the German study was relatively high (25 ng/L)
(Ternes, 1998). For BET, which was only quantified in 25% of the effluent samples, a previous
Author-produced version of the article published in Environmental Science and Pollution Research (2014), vol. 21, n° 3, pp. 1708-1722 The original publication is available at http://link.springer.com/, doi:10.1007/s11356-013-2037-7

study in 4 European countries including France reported concentrations below LOD (Andreozzi et
al., 2003). However, the LOD were not detailed.
In surface water, various results have been reported. In a study conducted in the Rivers Po
and Lambro, in the most densely inhabited and industrialized areas of Italy, ATE was quantified in
all river samples (n = 8) between 3.4 and 241 ng/L (Calamari et al., 2003). By contrast, ATE was
quantified only in 60% of the samples collected in the River Vantaa, located in the most densely
populated area of Finland, at concentrations between 12 and 25 ng/L (Vieno et al., 2006); the same
study reported a quantification frequency of 80% (n = 5) for ACE, SOT and MET, with
concentrations between 2 and 8 ng/L, 15 and 52 ng/L and 20 and 116 ng/L, respectively.
Conversely, a study performed in the River Seine in the Paris area quantified MET in only 30% of
the collected samples (n = 10) at a mean concentration of 10 ng/L (Paffoni et al., 2006); ATE,
SOT, PROP and BIS were also analyzed (n = 10, quantification frequency of 100%, 100%, 50%
and 0, respectively) and measured with mean concentrations of 26, 45, 12 ng/L and <10 ng/L,
respectively. For PROP, the same quantification frequency (50%, n = 6) was observed in a study
conducted in the Rivers Taff (UK) and Warta (Poland) with measured concentrations between 5
and 6 ng/L (Kasprzyk-Hordem et al., 2007); ATE and MET were also found between 3 and
60 ng/L, and 7 and 155 ng/L, respectively (quantification frequency of 67% and 50%,
respectively). In surface water collected in Spain in the Ebro river basin, MET and PROP were not
detected (n = 10, LOD of 3 and 2, respectively) and SOT and ATE were quantified at up to 70 and
250 ng/L, respectively (Gros et al., 2006). Generally, reported concentrations of BIS, BET, NAD,
MET, PROP and TIM are below 10 ng/L (Ternes, 1998; Gros et al., 2006; Paffoni et al., 2006).
However, concentrations measured in surface water can reach high values: BIS and MET were
quantified at above 2000 ng/L in river water samples (Ternes, 1998).
3.3. Qualitative impact of WWTPs on surface waters
Author-produced version of the article published in Environmental Science and Pollution Research (2014), vol. 21, n° 3, pp. 1708-1722 The original publication is available at http://link.springer.com/, doi:10.1007/s11356-013-2037-7

Generally, among the three sites studied, the River Bourbre was the one where the impact
of the WWTP outfall was the most obvious (Figure 3, Supplementary material). The WWTP
outfall was the least diluted for this river: the average dilution factor (calculated as the ratio River
flow / WWTP flow) was 14, against 70 and 7000 for the Rivers Ardières and Saône, respectively.
Figure 3
For estrogens, because of the relatively low concentrations measured in effluent samples,
the impact of WWTPs in surface water was not significant; except in the River Bourbre, where the
high concentration of E1 in the effluent (maximum of 16 ng/L) lead to a slight increase in E1
concentration in the river (from 1.6 to 2.5 ng/L, on average) immediately downstream from the
WWTP. However, 2 km after the outfall of the WWTP (sampling point “Downstream 2”),
concentrations of E1 were equivalent to those measured upstream. E3 was only quantified in
effluent samples of Fontaines-sur-Saône (average concentration 210 ng/L) and in one sample
collected downstream of the outfall (at 26 ng/L). As only low concentrations of E1 and too few
data for E3 were measured in river water, the profile study and also the quantitative study of the
impact of WWTPs on downstream rivers (see below) were not conducted on these hormones.
For betablockers, the impact of WWTPs was also more visible in the River Bourbre. For
example, the average concentration increased after the WWTP outfall from 14 to 99 ng/L for ACE,
from 28 to 123 ng/L for ATE and from 8.4 to 120 ng/L for SOT. In the River Saône, the average
concentration increased from 14 to 76 ng/L for ACE, from 10 to 93 ng/L for ATE and from 22 to
67 ng/L for SOT. For these two rivers, the increase in concentrations after the WWTP was also
measurable for BIS, MET and PROP. In the River Ardières, average concentrations increased from
9.1 to 39 ng/L for ACE and from 2.2 to 29 ng/L for ATE after the WWTP outfall (for ATE,
concentration of upstream 1 was considered because of the abnormally high concentration in
upstream 2). However, in the River Ardières, the concentration of SOT from WWTP effluent did
not lead to a significant increase of concentration in the river (from 3.5 to 5.2 ng/L).
Author-produced version of the article published in Environmental Science and Pollution Research (2014), vol. 21, n° 3, pp. 1708-1722 The original publication is available at http://link.springer.com/, doi:10.1007/s11356-013-2037-7

To evaluate the impact of WWTP outfall on river water quality, we compared the profile of
the 10 betablockers in effluent samples with those of river water upstream and downstream of the
WWTP outfall. For each sampling point, the relative abundance of each substance was calculated
by dividing its concentration by the sum of all betablocker concentrations. This study was only
conducted on samples from the River Bourbre as this was the site where the WWTP impact was
the most visible (Figure 4). The river water collected immediately after the WWTP outfall
(Downstream 1) and the effluent had similar profiles, whereas the profile observed in river water
collected upstream of the WWTP was different from the profile of the effluent sample. Moreover,
the profiles of water samples collected upstream and downstream 2 were again similar, showing a
return to upstream conditions 2 km downstream the WWTP outfall.
Figure 4
3.4. Quantitative impact of WWTP on surface waters
To evaluate quantitatively the observed gradient from upstream to downstream of the
WWTP outfall, we calculated for betablockers a ratio of increase as follows:
Downstream Upstream
UpstreamIncrease
C C
C
−= ,
where CDownstream is the measured concentration in the river immediately downstream of the WWTP
outfall, and CUpstream is the measured concentration in the river immediately upstream of the
WWTP outfall.
When a significant increase was noted, an attenuation percentage was calculated as the
difference in concentration between downstream 1 and downstream 2 as follows:
100)(
)()((%)
1
21 ×−
−−−=
UpstreamDownstream
UpstreamDownstreamUpstreamDownstream
CC
CCCCnAttenuatio ,
Author-produced version of the article published in Environmental Science and Pollution Research (2014), vol. 21, n° 3, pp. 1708-1722 The original publication is available at http://link.springer.com/, doi:10.1007/s11356-013-2037-7

where CDownstream 1 is the measured concentration in the river immediately downstream of the
WWTP outfall, and CDownstream 2 is the measured concentration in the river at the second point
downstream of the WWTP outfall.
As shown in Table 3, concentrations of betablockers in surface waters downstream of the
WWTP outfall can be up to 13 times higher than concentrations measured upstream. Concerning
the 4 substances quantified in effluents at the highest concentrations (ACE, ATE, SOT and PROP),
concentrations increased by a factor of 3 to 13 in the River Bourbre, 0 to 12 in the River Ardières
and 2 to 8 in the River Saône. Also, the impact of WWTP outfall was generally greater on the
River Bourbre than on the Rivers Saône or Ardières (except for ATE) because of the lower
effluent dilution for the River Bourbre. For example, MET, which was quantified at similar
concentrations in effluent from Beaujeu and Bourgoin Jallieu WWTP (30–40 ng/L), showed a
concentration 6 times higher in surface water after WWTP outfall in the River Bourbre, while no
concentration variation was noted for the River Ardières. On the contrary, while ATE
concentration was multiplied by 3 after WWTP outfall in the River Bourbre, it was, surprisingly,
multiplied by 12 in the River Ardières; this result is linked to the high concentration of ATE
measured upstream of the WWTP outfall in the River Bourbre (mean concentration 28 ng/L). For
NAD and TIM, which were quantified at low concentrations in all effluent samples (<56 ng/L), the
impact of the WWTP outfall was not detected on river concentrations.
To study the fate and behavior of betablockers in the downstream rivers, the attenuation of
concentration between samples collected immediately after the effluent outfall (5 m) and samples
collected further downstream (2000 m for the River Bourbre and 20 m for the River Ardières) was
evaluated. MET and PROP seemed to be the most persistent betablockers, since their attenuation
was below 10% at Bourgoin. Higher attenuations of concentration were noted for ACE at both
sites: around 54%. Considering the low hydrophobicity of this substance (log Kow 1.42) (Detroyer
et al., 2001), it is not likely to be adsorbed on particulate matter. The attenuation of ACE may
Author-produced version of the article published in Environmental Science and Pollution Research (2014), vol. 21, n° 3, pp. 1708-1722 The original publication is available at http://link.springer.com/, doi:10.1007/s11356-013-2037-7
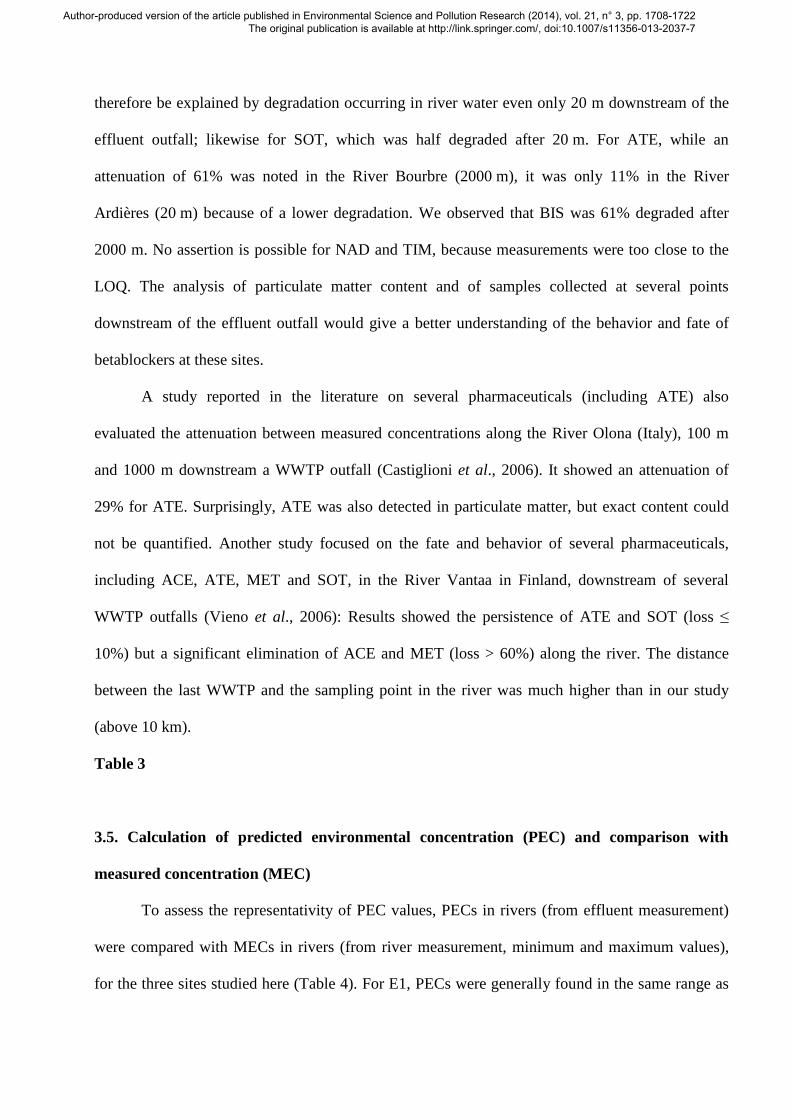
therefore be explained by degradation occurring in river water even only 20 m downstream of the
effluent outfall; likewise for SOT, which was half degraded after 20 m. For ATE, while an
attenuation of 61% was noted in the River Bourbre (2000 m), it was only 11% in the River
Ardières (20 m) because of a lower degradation. We observed that BIS was 61% degraded after
2000 m. No assertion is possible for NAD and TIM, because measurements were too close to the
LOQ. The analysis of particulate matter content and of samples collected at several points
downstream of the effluent outfall would give a better understanding of the behavior and fate of
betablockers at these sites.
A study reported in the literature on several pharmaceuticals (including ATE) also
evaluated the attenuation between measured concentrations along the River Olona (Italy), 100 m
and 1000 m downstream a WWTP outfall (Castiglioni et al., 2006). It showed an attenuation of
29% for ATE. Surprisingly, ATE was also detected in particulate matter, but exact content could
not be quantified. Another study focused on the fate and behavior of several pharmaceuticals,
including ACE, ATE, MET and SOT, in the River Vantaa in Finland, downstream of several
WWTP outfalls (Vieno et al., 2006): Results showed the persistence of ATE and SOT (loss ≤
10%) but a significant elimination of ACE and MET (loss > 60%) along the river. The distance
between the last WWTP and the sampling point in the river was much higher than in our study
(above 10 km).
Table 3
3.5. Calculation of predicted environmental concentration (PEC) and comparison with
measured concentration (MEC)
To assess the representativity of PEC values, PECs in rivers (from effluent measurement)
were compared with MECs in rivers (from river measurement, minimum and maximum values),
for the three sites studied here (Table 4). For E1, PECs were generally found in the same range as
Author-produced version of the article published in Environmental Science and Pollution Research (2014), vol. 21, n° 3, pp. 1708-1722 The original publication is available at http://link.springer.com/, doi:10.1007/s11356-013-2037-7

MECs for the River Bourbre. In contrast, for the Rivers Saône and Ardières, PECs for E1 were
systematically underestimated compared with MECs (i.e. PECs 20 to 100 times lower than MECs
in the River Saône, 3 to 16 times lower in the River Ardières). These differences can be explained
by the presence of other WWTPs upstream of the target WWTP that could contribute to the total
amount of micropollutants in the river. Concerning E3, which was only quantified in effluents
from one of the three sites studied, PECs were close to LOQ, and therefore it is difficult to draw
any firm conclusion. For betablockers, in the Rivers Bourbre and Ardières, 77% of PECs were
higher than the corresponding MECs by a factor of 1.1 to 4. Nonetheless, for these rivers, a
reasonably fit could generally be noted between PEC and MEC. In contrast, PECs calculated for
betablockers in the River Saône were generally underestimated, by a factor up to 30 for BIS. To
conclude, the use of PEC is not completely reliable and, unexpectedly, it does not always represent
the worst possible case; MEC values, when available, are to be preferred to PEC values.
Table 4
3.6. Tentative risk evaluation for the rivers downstream of 15 French WWTPs
To evaluate the environmental risk linked to the presence of estrogens and betablockers in
French rivers, MECs for the three rivers studied here and PECs for the receiving rivers of the 12
WWTPs previously studied were compared for each substance with PNEC values found in the
literature (Table 5).
The PNEC values were computed from toxicity tests, but are available only for some of the
substances studied. For estrogens, a rough estimation of PNEC at 5 ng/L was made (Stuer-
Lauridsen et al., 2000). For betablockers, PNEC were available for only 4 of the 10 betablockers
analyzed. One author estimated EC50 (half maximal effective concentration) for ATE, MET and
PROP on different species: an invertebrate (Daphnia magna), an alga (Desmodesmus subspicatus)
and an aquatic plant (Lemna minor). The PNECs were obtained by dividing the lowest EC50 by an
Author-produced version of the article published in Environmental Science and Pollution Research (2014), vol. 21, n° 3, pp. 1708-1722 The original publication is available at http://link.springer.com/, doi:10.1007/s11356-013-2037-7

assessment factor of 1000 (Cleuvers, 2005). The following results were obtained: PROP was the
most toxic substance with a PNEC at 0.73 µg/L; the PNECs of ATE and MET were evaluated at
7.9 and 310 µg/L, respectively. Another study reported a PNEC derived from chronic tests on fish
at 10 ng/L for PROP (Ferrari et al., 2004). For ACE, a PNEC was evaluated at 1250 µg/L on an
invertebrate (Ceriodaphnia dubia) by dividing the lowest NOEC (chronic non-observed effect
concentration) by 50 (Garric et al., 2006). No PNEC value was found for NAD, but the toxicity
tests performed on aquatic invertebrates showed that acute exposure to NAD at 100 mg/L resulted
in no change in species survival (Huggett et al., 2002). Thus the following PNECs were used for
this environmental risk evaluation study: 5 ng/L for total estrogens (“total” meaning the sum of
estrogens), 1250 µg/L for ACE, 7.9 µg/L for ATE, 310 µg/L for MET and 10 ng/L for PROP.
For estrogens, total risk evaluation ratios evaluated with MECs of the three rivers studied
ranged between 0.3 and 5.5 (Table 5). The atypical ratio of 5.5 is linked to the high concentration
of E3 measured in one of the samples collected in the River Saône (25.9 ng/L). Among the
receiving rivers of the 12 additional WWTPs studied, total risk evaluation ratios never exceeded
0.8. This shows a generally low predicted environmental risk associated with these substances in
the systems studied.
Concerning betablockers, for ACE, ATE and MET, the ratio between MEC (or PEC) and
PNEC were in most cases below 0.2, showing an non-significant predicted environmental risk. For
PROP, the mean ratios were 0.3, 0.8 and 1.7 for the Rivers Ardières, Saône and Bourbre,
respectively (ratio between 0.1 and 0.7 for the River Ardières, between 0.3 and 2.5 for River Saône
and between 0.8 and 3.5 for River Bourbre). For PROP, among the receiving rivers of the 15
WWTP effluents presented in Table 5, a ratio below 0.1 was calculated for 2 sites, while 8 sites
showed a ratio between 0.1 and 1, and 5 sites had a ratio higher than 1 and up to 34.2. These 5 sites
correspond to the rivers where the WWTP effluents were the least diluted (Rivers Bourbre,
Maurepas, Maldroit, Bouillide and Ardières). From Table 5, PROP may represent a potential
Author-produced version of the article published in Environmental Science and Pollution Research (2014), vol. 21, n° 3, pp. 1708-1722 The original publication is available at http://link.springer.com/, doi:10.1007/s11356-013-2037-7

environmental risk up to a dilution ratio of the effluent in the river of 13. A previous study
performed on two large French rivers (the Saône and the Rhône) presented lower ratios
PEC/PNEC for PROP: between 0.03 and 0.45 depending on the site studied (Miege et al., 2006).
In the present study, the fluxes of PROP were in the same range as those observed by Miege et al.
(2006) but the 5-year lowest water flow discharges were 100 times lower.
Table 5
4. Conclusion
Three different sites in the Lyon area of France, were studied, showing that among the 5
estrogens analyzed, only E1 and E3 were quantified in some effluents and river waters. The most
frequently quantified estrogen was E1. The concentration of estrogen reached 220 ng/L in effluent
(for E3) and 26 ng/L in river water (for E3). However, mean estrogen concentration in surface
water was generally at the ng/L level. Among the 10 betablockers analyzed, ACE, ATE and SOT
were quantified in almost all the collected samples. Other substances, such as BET, NAD and
OXP, were rarely quantified. Betablocker concentrations could reach up to 2450 ng/L in effluent
and 240 ng/L in surface water (for ATE), but mean concentrations of individual betablocker in
river water were below 50 ng/L.
The impact of WWTPs on the receiving rivers was manifest for all the sites studied, except
for estrogens at Fontaines-sur-Saône, where the effluent was highly diluted in the river (dilution by
nearly 7000). Concentrations of estrogens and betablockers generally increased downstream of the
WWTP outfall; this was particularly the case on the River Bourbre, which was, among the
different sites studied, the one where the effluent was the least diluted in the river. Downstream of
the effluent outflow, the betablocker concentrations could be up to 13 times higher than upstream
of the WWTP. The study of the attenuation of concentration between samples collected
immediately after the effluent outfall (5 m) and samples collected further downstream (20 m or 2
Author-produced version of the article published in Environmental Science and Pollution Research (2014), vol. 21, n° 3, pp. 1708-1722 The original publication is available at http://link.springer.com/, doi:10.1007/s11356-013-2037-7

km) showed that some betablockers, such as MET and PROP, were not degraded even 2 km after
the WWTP outfall, whereas others, like ACE were mostly degraded (more than 50% of
attenuation). The similarity of the relative distribution (i.e. fingerprint) of the betablockers was
shown between samples of effluent and river samples collected immediately downstream of the
effluent outflow.
An environmental risk evaluation was performed on 15 sites (including the three studied
here). For estrogens, the total risk evaluation ratios were systematically below 1, except for one
site, thus the low predictive environmental risk was low. With a ratio below 0.1, the predictive
environmental risk linked to the presence of ATE, ACE and MET in river water was negligible.
On the contrary, ratios above 1 were obtained for PROP, showing a possible environmental risk for
5 sites. Betablockers can represent a potential environmental risk up to a dilution ratio of the
effluent in the river of 13. Unfortunately, as no PNEC was found for SOT, it was impossible to
evaluate the risk linked to its presence in the aquatic environment, although we showed high
concentrations in rivers. Even though potential toxicity due to individual betablocker or estrogen
was not proved here, the environmental risk evaluation presented here did not take into account
synergistic, antagonist or bioaccumulation effects.
Acknowledgments
We thank O. Geffard and R. Mons for sampling assistance, and P. Bados and S. Schiavone
for analytical support. We also thank the Regional Water Agency of Rhône-Méditerranée-Corse
and the National Research Agency (ANR Precodd AMPERES project) for financial support.
References
Andreozzi R, Raffaele M, Nicklas P (2003) Pharmaceuticals in STP effluents and their solar photodegradation in aquatic environment. Chemosphere. 50 (10): 1319-1330. Baronti C, Curini R, D'Ascenzo G, Di Corcia A, Gentili A, Samperi R (2000) Monitoring natural and synthetic estrogens at activated sludge sewage treatment plants and in a receiving river water. Environ Sci Technol. 34 (24): 5059-5066.
Author-produced version of the article published in Environmental Science and Pollution Research (2014), vol. 21, n° 3, pp. 1708-1722 The original publication is available at http://link.springer.com/, doi:10.1007/s11356-013-2037-7

Belfroid AC, Van der Horst A, Vethaak AD, Schafer AJ, Rijs GBJ, Wegener J, Cofino WP (1999) Analysis and occurrence of estrogenic hormones and their glucuronides in surface water and waste water in The Netherlands. Science of the Total Environment. 225 (1-2): 101-108. Bendz D, Paxeus NA, Ginn TR, Loge FJ (2005) Occurrence and fate of pharmaceutically active compounds in the environment, a case study: Hoje River in Sweden. Journal of Hazardous Materials. 122 (3): 195-204. Besse JP, Kausch-Barreto C, Garric J (2008) Exposure assessment of pharmaceuticals and their metabolites in the aquatic environment: Application to the French situation and preliminary prioritization. Human and Ecological Risk Assessment. 14 (4): 665-695. Boyd GR, Reemtsma H, Grimm DA, Mitra S (2003) Pharmaceuticals and personal care products (PPCPs) in surface and treated waters of Louisiana, USA and Ontario, Canada. Science of the Total Environment. 311 (1-3): 135-149. Calamari D, Zuccato E, Castiglioni S, Bagnati R, Fanelli R (2003) Strategic survey of therapeutic drugs in the rivers Po and Lambro in northern Italy. Environ Sci Technol. 37 (7): 1241-1248. Cargouet M, Perdiz D, Mouatassim-Souali A, Tamisier-Karolak S, Levi Y (2004) Assessment of river contamination by estrogenic compounds in Paris area (France). Science of the Total Environment. 324 (1-3): 55-66. Castiglioni S, Bagnati R, Fanelli R, Pomati F, Calamari D, Zuccato E (2006) Removal of pharmaceuticals in sewage treatment plants in Italy. Environ Sci Technol. 40 (1): 357-363. Cleuvers M (2005) Initial risk assessment for three beta-blockers found in the aquatic environment. Chemosphere. 59 (2): 199-205. Coetsier CM, Spinelli S, Lin L, Roig B, Touraud E (2009) Discharge of pharmaceutical products (PPs) through a conventional biological sewage treatment plant: MECs vs PECs? Environment International. 35 (5): 787-792. Czajka CP, Londry KL (2006) Anaerobic biotransformation of estrogens. Science of the Total Environment. 367 (2-3): 932-941. Detroyer A, Heyden YV, Carda-Broch S, Garcia-Alvarez-Coque MC, Massart DL (2001) Quantitative structure-retention and retention-activity relationships of beta-blocking agents by micellar liquid chromatography. J Chromatogr A. 912 (2): 211-221. European Commission, EU Commission Decision of 12 August 2002 implementing Council Directive 96/23/EC concerning the performance of analytical methods and the interpretation of results (2002/657/EC), Offic. J. Eur. Commun. L221 (2002) 8. European Commission JRC (2003) Technical Guidance Document in support of Commission Directive 93/67/EEC on Risk Assessment for new notified substances, Commission Regulation (EC) No 1488/94 on Risk Assessment for existing substances, Directives 98/8/EC of the European Parliament and of the Council concerning the placing of biocidal products on the market, Part II Environmental Risk Assessment - Office for official publications of the European Communities, Luxembourg. Farre M, Brix R, Kuster M, Rubio F, Goda Y, de Alda MJL, Barcelo D (2006) Evaluation of commercial immunoassays for the detection of estrogens in water by comparison with high-performance liquid chromatography tandem mass spectrometry HPLC-MS/MS (QqQ). Anal Bioanal Chem. 385 (6): 1001-1011. Ferrari B, Mons R, Vollat B, Fraysse B, Paxeus N, Lo Giudice R, Pollio A, Garric J (2004) Environmental risk assessment of six human pharmaceuticals: Are the current environmental risk assessment procedures sufficient for the protection of the aquatic environment? Environ Toxicol Chem. 23 (5): 1344-1354. Gabet-Giraud V, Miege C, Choubert JM, Martin Ruel S, Coquery M (2010) Analysis of estrogens and beta blockers in the dissolved phase of wastewater treatment plants in France. Science of the Total Environment. 408: 4257–4269 Garric J, Ferrari B, Fraysse B, Mons R, Vollat B (2006) Effects of some human pharmaceutical on freshwater organisms (Impact de médicaments à usage humain sur les organismes aquatiques d'eau douce). Environnement, Risques et Santé. 5 (4): 290-295. Gros M, Petrovic M, Barcelo D (2006) Development of a multi-residue analytical methodology based on liquid chromatography-tandem mass spectrometry (LC-MS/MS) for screening and trace level determination of pharmaceuticals in surface and wastewaters. Talanta. 70 (4): 678-690. Grujic S, Vasiljevic T, Lausevic M (2009) Determination of multiple pharmaceutical classes in surface and ground waters by liquid chromatography-ion trap-tandem mass spectrometry. J Chromatogr A. 1216 (25): 4989-5000.
Author-produced version of the article published in Environmental Science and Pollution Research (2014), vol. 21, n° 3, pp. 1708-1722 The original publication is available at http://link.springer.com/, doi:10.1007/s11356-013-2037-7

Gutjahr-Gobell RE, Zaroogian GE, Horowitz DJB, Gleason TR, Mills LJ (2006) Individual effects of estrogens on a marine fish, Cunner (Tautogolabrus adspersus), extrapolated to the population level. Ecotox Environ Safe. 63 (2): 244-252. Haider S, Baqri SSR (2000) beta-Adrenoceptor antagonists reinitiate meiotic maturation in Clarias batrachus oocytes. Comparative Biochemistry and Physiology a-Molecular & Integrative Physiology. 126 (4): 517-525. Hansen PD, Dizer H, Hock B, Marx A, Sherry J, McMaster M, Blaise C (1998) Vitellogenin - a biomarker for endocrine disruptors. Trends Analyt Chem. 17 (7): 448-451. Hernando MD, Gomez MJ, Aguera A, Fernandez-Alba AR (2007) LC-MS analysis of basic pharmaceuticals (beta-blockers and anti-ulcer agents) in wastewater and surface water. Trends Anal. Chem. 26 (6): 581-594. Huggett DB, Brooks BW, Peterson B, Foran CM, Schlenk D (2002) Toxicity of select beta adrenergic receptor-blocking pharmaceuticals (B-blockers) on aquatic organisms. Archives of Environmental Contamination and Toxicology. 43 (2): 229-235. Huggett DB, Khan IA, Foran CM, Schlenk D (2003) Determination of beta-adrenergic receptor blocking pharmaceuticals in United States wastewater effluent. Environmental Pollution. 121 (2): 199-205. Isobe T, Shiraishi H, Yasuda M, Shinoda A, Suzuki H, Morita M (2003) Determination of estrogens and their conjugates in water using solid-phase extraction followed by liquid chromatography-tandem mass spectrometry. J Chromatogr A. 984 (2): 195-202. Jobling S, Casey D, Rodgers-Gray T, Oehlmann J, Schulte-Oehlmann U, Pawlowski S, Baunbeck T, Turner AP, Tyler CR (2003 ) Comparative responses of molluscs and fish to environmental estrogens and an estrogenic effluent. Aquatic Toxicology. 65 (2): 205-220. Kasprzyk-Hordem B, Dinsdale RM, Guwy AJ (2007) Multi-residue method for the determination of basic/neutral pharmaceuticals and illicit drugs in surface water by solid-phase extraction and ultra performance liquid chromatography-positive electrospray ionisation tandem mass spectrometry. J Chromatogr A. 1161 (1-2): 132-145. Kasprzyk-Hordern B, Dinsdale RM, Guwy AJ (2009) The removal of pharmaceuticals, personal care products, endocrine disruptors and illicit drugs during wastewater treatment and its impact on the quality of receiving waters. Water Research. 43 (2): 363-380. Kuch HM, Ballschmiter K (2001) Determination of endocrine-disrupting phenolic compounds and estrogens in surface and drinking water by HRGC-(NCI)-MS in the picogram per liter range. Environ Sci Technol. 35 (15): 3201-3206. Kummerer K (2009) The presence of pharmaceuticals in the environment due to human use - present knowledge and future challenges. Journal of Environmental Management. 90 (8): 2354-2366. Kuster M, de Alda MJ, Hernando MD, Petrovic M, Martin-Alonso J, Barcelo D (2008) Analysis and occurrence of pharmaceuticals, estrogens, progestogens and polar pesticides in sewage treatment plant effluents, river water and drinking water in the Llobregat river basin (Barcelona, Spain). Journal of Hydrology. 358 (1-2): 112-123. Labadie P, Budzinski H (2005) Development of an analytical procedure for determination of selected estrogens and progestagens in water samples. Anal Bioanal Chem. 381 (6): 1199-1205. Lagana A, Bacaloni A, De Leva I, Faberi A, Fago G, Marino A (2004) Analytical methodologies for determining the occurrence of endocrine disrupting chemicals in sewage treatment plants and natural waters. Analytica Chimica Acta. 501 (1): 79-88. Larsson DGJ, Adolfsson-Erici M, Parkkonen J, Pettersson M, Berg AH, Olsson PE, Forlin L (1999) Ethinyloestradiol - an undesired fish contraceptive? Aquatic Toxicology. 45 (2-3): 91-97. Loos R, Gawlik BM, Locoro G, Rimaviciute E, Contini S, Bidoglio G (2009) EU-wide survey of polar organic persistent pollutants in European river waters. Environmental Pollution. 157 (2): 561-568. Loos R, Wollgast J, Huber T, Hanke G (2007) Polar herbicides, pharmaceutical products, perfluorooctanesulfonate (PFOS), perfluorooctanoate (PFOA), and nonylphenol and its carboxylates and ethoxylates in surface and tap waters around Lake Maggiore in Northern Italy. Anal Bioanal Chem. 387 (4): 1469-1478. Maurer M, Escher BI, Richle P, Schaffner C, Alder AC (2007) Elimination of beta-blockers in sewage treatment plants. Water Research. 41 (7): 1614-1622. Miege C, Bados P, Brosse C, Coquery M (2009a) Method validation for the analysis of estrogens (including conjugated compounds) in aqueous matrices. Trends Analyt Chem. 28 (2): 237-244.
Author-produced version of the article published in Environmental Science and Pollution Research (2014), vol. 21, n° 3, pp. 1708-1722 The original publication is available at http://link.springer.com/, doi:10.1007/s11356-013-2037-7

Miege C, Choubert JM, Ribeiro L, Eusebe M, Coquery M (2009b) Fate of pharmaceuticals and personal care products in wastewater treatment plants - Conception of a database and first results. Environmental Pollution. 157 (5): 1721-1726. Miege C, Karolak S, Gabet V, Jugan ML, Oziol L, Chevreuil M, Levi Y, Coquery M (2009c) Evaluation of estrogenic disrupting potency in aquatic environments and urban wastewaters by combining chemical and biological analysis. Trends Analyt Chem. 28 (2): 186-195. Miege C, Favier M, Brosse C, Canler JP, Coquery M (2006) Occurrence of betablockers in effluents of wastewater treatment plants from the Lyon area (France) and risk assessment for the downstream rivers. Talanta. 70 (4): 739-744. Morteani G, Moller P, Fuganti A, Paces T (2006) Input and fate of anthropogenic estrogens and gadolinium in surface water and sewage plants in the hydrological basin of Prague (Czech Republic). Environmental Geochemistry and Health. 28 (3): 257-264. Nakada N, Tanishima T, Shinohara H, Kiri K, Takada H (2006) Pharmaceutical chemicals and endocrine disrupters in municipal wastewater in Tokyo and their removal during activated sludge treatment. Water Research. 40 (17): 3297-3303. Paffoni C, Welte B, Gousailles M, Montiel A (2006) New molecules involved by the european directives: from wastewater to drinking water treatment plants. European Journal of Water Quality. 37 (1): 21-38. Peng XZ, Yu YJ, Tang CM, Tan JH, Huang QX, Wang ZD (2008) Occurrence of steroid estrogens, endocrine-disrupting phenols, and acid pharmaceutical residues in urban riverine water of the Pearl River Delta, South China. Science of the Total Environment. 397 (1-3): 158-166. Ren HY, Ji SL, Ahmad NUD, Dao W, Cui CW (2007) Degradation characteristics and metabolic pathway of 17 alpha-ethynylestradiol by Sphingobacterium sp JCR5. Chemosphere. 66 (2): 340-346. Rodriguez-Mozaz S, de Alda MJL, Barcelo D (2004) Monitoring of estrogens, pesticides and bisphenol A in natural waters and drinking water treatment plants by solid-phase extraction-liquid chromatography-mass spectrometry. J Chromatogr A. 1045 (1-2): 85-92. Stuer-Lauridsen F, Birkved M, Hansen LP, Lutzhoft HCH, Halling-Sorensen B (2000) Environmental risk assessment of human pharmaceuticals in Denmark after normal therapeutic use. Chemosphere. 40 (7): 783-793. Ternes TA (1998) Occurrence of drugs in German sewage treatment plants and rivers. Water Research. 32 (11): 3245-3260. Ternes TA, Kreckel P, Mueller J (1999a) Behaviour and occurrence of estrogens in municipal sewage treatment plants - II. Aerobic batch experiments with activated sludge. Science of the Total Environment. 225 (1-2): 91-99. Ternes TA, Stumpf M, Mueller J, Haberer K, Wilken RD, Servos M (1999b) Behavior and occurrence of estrogens in municipal sewage treatment plants - I. Investigations in Germany, Canada and Brazil. Science of the Total Environment. 225 (1-2): 81-90. Ternes, T. A. and Joss, A. (2006) Human Pharmaceuticals, Hormones and Fragrances: The challenge of micropollutants in urban water management. IWA Publishing. Vethaak AD, Lahr J, Schrap SM, Belfroid AC, Rijs GBJ, Gerritsen A, de Boer J, Bulder AS, Grinwis GCM, Kuiper RV, Legler J, Murk TAJ, Peijnenburg W, Verhaar HJM, de Voogt P (2005) An integrated assessment of estrogenic contamination and biological effects in the aquatic environment of The Netherlands. Chemosphere. 59 (4): 511-524. Vieno NM, Tuhkanen T, Kronberg L (2006) Analysis of neutral and basic pharmaceuticals in sewage treatment plants and in recipient rivers using solid phase extraction and liquid chromatography-tandem mass spectrometry detection. J Chromatogr A. 1134 (1-2): 101-111. Vigano L, Mandich A, Benfenati E, Bertolotti R, Bottero S, Porazzi E, Agradi E (2006) Investigating the estrogenic risk along the River Po and its intermediate section. Archives of Environmental Contamination and Toxicology. 51 (4): 641-651. Vulliet E, Wiest L, Baudot R, Grenier-Loustalot MF (2008) Multi-residue analysis of steroids at sub-ng/L levels in surface and ground-waters using liquid chromatography coupled to tandem mass spectrometry. J Chromatogr A. 1210 (1): 84-91. Zhou JL, Zhang ZL, Banks E, Grover D, Jiang JQ (2009) Pharmaceutical residues in wastewater treatment works effluents and their impact on receiving river water. Journal of Hazardous Materials. 166 (2-3): 655-661.
Author-produced version of the article published in Environmental Science and Pollution Research (2014), vol. 21, n° 3, pp. 1708-1722 The original publication is available at http://link.springer.com/, doi:10.1007/s11356-013-2037-7

Figure 1. Location of the three sampling sites near Lyon, France
Figure 2. Configuration of the sampling points on the Bourgoin-Jallieu site
Bion
Bourbre
WWTP
Upstream Bourbre (20 m)
Downstream Bourbre 1
(5m)
Downstream Bourbre 2 (2000 m)
Upstream Bion
(2000 m)
Sampling point River River flow WWTP
Fontaines sur Saône
Beaujeu
Bourgoin Jallieu LYON
Author-produced version of the article published in Environmental Science and Pollution Research (2014), vol. 21, n° 3, pp. 1708-1722 The original publication is available at http://link.springer.com/, doi:10.1007/s11356-013-2037-7

Figure 3. Mean concentrations (± sd) of estrogens and betablockers at the different sampling
stations of the three sites studied (a, Ardières; b, Bourbre; c, Fontaines-sur-Saône)
Some data not shown (cf. Table 2): αE2, βE2 and EE2 were never quantified; E3 only quantified in Fontaines-sur-Saône (in all effluents and in one surface water sample); BET and OXP only quantified in the samples from Fontaines-sur-Saône (mean concentrations below 2 ng/L for surface water and of 18 and 30 ng/L in effluents for BET and OXP, respectively); TIM only quantified at low levels (mean concentrations below 3 ng/L in surface water and between 2.9 and 8.7 ng/L in effluent samples)
0
500
1000
1500
2000
2500
Saône Upstream
FontainesEffluent
Saône Downstream 1
Saône Downstream 2
Co
nce
ntr
atio
n (
ng
/L)
ACEATESOT
0
100
200
300
400
500
600
SaôneUpstream
Fontaines Effluent SaôneDownstream 1
SaôneDownstream 2
Co
nce
ntr
atio
n (
ng
/L)
BISMETNADPROPE1
0
200
400
600
ArdièresUpstream 1
ArdièresUpstream 2
BeaujeuEffluent
ArdièresDownstream 1
ArdièresDownstream 2
Co
nce
ntr
atio
n (
ng
/L)
ACE
ATE
SOT
0
200
400
600
800
Bourbre Upstream
Bourgoin JallieuEffluent
BourbreDownstream 1
BourbreDownstream 2
Co
nce
ntr
atio
n (
ng
/L)
ACE
ATE
SOT
0
20
40
60
80
Bourbre Upstream
Bourgoin JallieuEffluent
BourbreDownstream 1
BourbreDownstream 2
Co
nce
ntr
atio
n (
ng
/L)
BIS
MET
NAD
PROP
E1
0
10
20
30
40
ArdièresUpstream 1
ArdièresUpstream 2
BeaujeuEffluent
ArdièresDownstream 1
ArdièresDownstream 2
Co
ncen
trat
ion
(ng
/L)
BIS
MET
NAD
PROP
E1
~ 231 ng/L
Author-produced version of the article published in Environmental Science and Pollution Research (2014), vol. 21, n° 3, pp. 1708-1722 The original publication is available at http://link.springer.com/, doi:10.1007/s11356-013-2037-7

Figure 4. Relative abundance (%) of quantified betablockers for each sampling station in the River
Bourbre and in the effluent from the Bourgoin-Jallieu WWTP
Effluent Downstream 1 Downstream 2Upstream
ATE SOT ACE MET PROP BIS
Author-produced version of the article published in Environmental Science and Pollution Research (2014), vol. 21, n° 3, pp. 1708-1722 The original publication is available at http://link.springer.com/, doi:10.1007/s11356-013-2037-7

Table 1. Information on WWTP and sampling campaigns
WWTP
Treatment process
Population equivalent (PE)
Flow (m3/d)
Receiving River
Sampling points Sampling period
Low loaded activated sludge (C + N)*
2 900 750 Ardières Upstream 1 (4000m) Upstream 2 (20m) Effluent Downstream 1 (5m) Downstream 2 (20m)
June 2008
Bourgoin Primary settling + medium-rate activated sludge
78 000 17 500 Bourbre Cf Figure 2. Sept. 2008
Fontaines sur Saône
Primary settling + Biological filter (C + N)
30 000 6 500 Saône Upstream (200m) Effluent Downstream 1 (50m) Downstream 2 (200m)
Nov. 2007 and June 2008
* conventional activated sludge
Table 2. Concentrations of estrogens and betablockers measured in effluent and surface water
samples of three sites in France (Rivers Ardières, Bourbre and Saône and WWTPs) from
November 2007 to September 2008
Quantification frequency
(%)
Mean (ng/L)
Median (ng/L)
Min (ng/L)
Max (ng/L)
Eff. SW Eff. SW Eff. SW Eff. SW Eff. SW E1 100 98 9.3 1.6 8.7 1.5 1.7 0.3 20 3.9 E3 25 2 210 26 210 26 202 26 218 26 ACE 100 100 595 35 381 14 68 3.0 1455 183 ATE 100 97 1043 50 705 17 388 0.4 2450 240 BET 25 15 18 0.6 18 0.4 17 0.2 19 1.7 BIS 100 82 149 7.3 37 1.7 6.6 0.3 630 38 MET 100 71 77 4.4 38 1.8 22 0.4 223 29 NAD 50 32 40 9.2 48 4.0 2.1 0.4 61 42 OXP 38 9 20 1.3 27 0.3 0.8 0.1 32 3.4 PROP 100 65 158 8.1 138 4.6 62 0.7 294 35 SOT 100 91 495 34 435 5.5 97 1.6 918 213 TIM 88 44 4.6 1.5 3.6 1.6 1.5 0.8 9.5 2.0
Eff.: effluent (n = 8 for estrogens and betablockers)
SW: surface water (n = 42 for estrogens and 34 for betablockers)
(αE2, βE2, EE2 never detected)
Author-produced version of the article published in Environmental Science and Pollution Research (2014), vol. 21, n° 3, pp. 1708-1722 The original publication is available at http://link.springer.com/, doi:10.1007/s11356-013-2037-7

Table 3. Increase ratio for betablocker concentrations in river samples from upstream to
downstream of the WWTP outfall and attenuation (%) measured between the two sampling
stations downstream of the WWTP outfall
WWTP River Dilution factor of
effluent in river ACE ATE BIS MET NAD PROP SOT TIM Bourgoin Jallieu
Bourbre 14 6 3 6 6 -1 6 13 1
Beaujeu Ardières 70 3 12* 0 1 -1 0 1 0
Increase ratio
Fontaines Saône 7000 4 8 1 5 -1 2 2 1 Bourgoin Jallieu
Bourbre (2 km)
14 53 61 61 9 nc 5 51 nc
Attenuation (%)
Beaujeu Ardières (20 m)
70 54 11 nc nc nc nc 47 nc
*calculated with upstream 4000 m before WWTP outfall, because of one suspicious concentration for
upstream 20 m before WWTP outfall
nc: attenuation not calculated because measurements were too close to limits of quantification.
Author-produced version of the article published in Environmental Science and Pollution Research (2014), vol. 21, n° 3, pp. 1708-1722 The original publication is available at http://link.springer.com/, doi:10.1007/s11356-013-2037-7
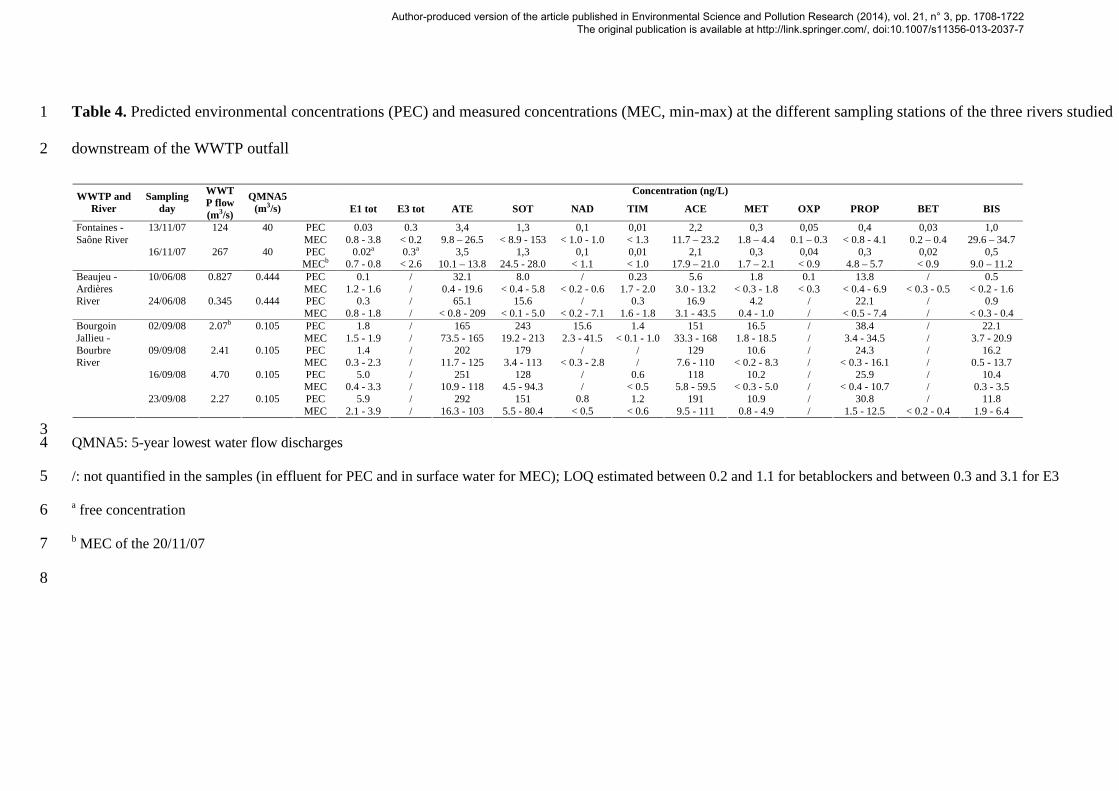
Table 4. Predicted environmental concentrations (PEC) and measured concentrations (MEC, min-max) at the different sampling stations of the three rivers studied 1
downstream of the WWTP outfall 2
Concentration (ng/L) WWTP and River
Sampling day
WWTP flow (m3/s)
QMNA5 (m3/s)
E1 tot E3 tot ATE SOT NAD TIM ACE MET OXP PROP BET BIS
13/11/07 124 40 PEC 0.03 0.3 3,4 1,3 0,1 0,01 2,2 0,3 0,05 0,4 0,03 1,0 MEC 0.8 - 3.8 < 0.2 9.8 – 26.5 < 8.9 - 153 < 1.0 - 1.0 < 1.3 11.7 – 23.2 1.8 – 4.4 0.1 – 0.3 < 0.8 - 4.1 0.2 – 0.4 29.6 – 34.7
16/11/07 267 40 PEC 0.02a 0.3a 3,5 1,3 0,1 0,01 2,1 0,3 0,04 0,3 0,02 0,5
Fontaines - Saône River
MECb 0.7 - 0.8 < 2.6 10.1 – 13.8 24.5 - 28.0 < 1.1 < 1.0 17.9 – 21.0 1.7 – 2.1 < 0.9 4.8 – 5.7 < 0.9 9.0 – 11.2 10/06/08 0.827 0.444 PEC 0.1 / 32.1 8.0 / 0.23 5.6 1.8 0.1 13.8 / 0.5
MEC 1.2 - 1.6 / 0.4 - 19.6 < 0.4 - 5.8 < 0.2 - 0.6 1.7 - 2.0 3.0 - 13.2 < 0.3 - 1.8 < 0.3 < 0.4 - 6.9 < 0.3 - 0.5 < 0.2 - 1.6 24/06/08 0.345 0.444 PEC 0.3 / 65.1 15.6 / 0.3 16.9 4.2 / 22.1 / 0.9
Beaujeu - Ardières River
MEC 0.8 - 1.8 / < 0.8 - 209 < 0.1 - 5.0 < 0.2 - 7.1 1.6 - 1.8 3.1 - 43.5 0.4 - 1.0 / < 0.5 - 7.4 / < 0.3 - 0.4 02/09/08 2.07b 0.105 PEC 1.8 / 165 243 15.6 1.4 151 16.5 / 38.4 / 22.1
MEC 1.5 - 1.9 / 73.5 - 165 19.2 - 213 2.3 - 41.5 < 0.1 - 1.0 33.3 - 168 1.8 - 18.5 / 3.4 - 34.5 / 3.7 - 20.9 09/09/08 2.41 0.105 PEC 1.4 / 202 179 / / 129 10.6 / 24.3 / 16.2
MEC 0.3 - 2.3 / 11.7 - 125 3.4 - 113 < 0.3 - 2.8 / 7.6 - 110 < 0.2 - 8.3 / < 0.3 - 16.1 / 0.5 - 13.7 16/09/08 4.70 0.105 PEC 5.0 / 251 128 / 0.6 118 10.2 / 25.9 / 10.4
MEC 0.4 - 3.3 / 10.9 - 118 4.5 - 94.3 / < 0.5 5.8 - 59.5 < 0.3 - 5.0 / < 0.4 - 10.7 / 0.3 - 3.5 23/09/08 2.27 0.105 PEC 5.9 / 292 151 0.8 1.2 191 10.9 / 30.8 / 11.8
Bourgoin Jallieu - Bourbre River
MEC 2.1 - 3.9 / 16.3 - 103 5.5 - 80.4 < 0.5 < 0.6 9.5 - 111 0.8 - 4.9 / 1.5 - 12.5 < 0.2 - 0.4 1.9 - 6.4
3 QMNA5: 5-year lowest water flow discharges 4
/: not quantified in the samples (in effluent for PEC and in surface water for MEC); LOQ estimated between 0.2 and 1.1 for betablockers and between 0.3 and 3.1 for E3 5
a free concentration 6
b MEC of the 20/11/07 7
8
Author-produced version of the article published in Environmental Science and Pollution Research (2014), vol. 21, n° 3, pp. 1708-1722 The original publication is available at http://link.springer.com/, doi:10.1007/s11356-013-2037-7

Table 5. Risk assessment for estrogens (total risk) and four betablockers (ACE, ATE, MET and PROP) in rivers downstream of WWTP outfall et 15 sites in 9
France 10
MEC (mean value) or PEC (ng/L) PEC/PNEC ratio WWTP River Population equivalent
(PE)
WWTP outflow (m3/d)
5 years lowest water
flow discharges
(m3/s)
Calculated dilution factor
E1 αE2 βE2 E3 EE2 ACE ATE MET PROP Sum of estrogens
ACE ATE MET PROP
Beaujeu Ardières 2 900 750 0.11 13 1.5 / / / / 19.0 36.2 0.9 3.2 0.3 < 0.1 < 0.1 < 0.1 0.3 Bourgoin
Jallieu Bourbre 78 000 17 500 0.44 2 1.8 / / / / 76.3 94.4 8.8 17.0 0.4 < 0.1 < 0.1 < 0.1 1.7
Fontaines sur Saône
Saône 30 000 6 500 40 532 1.6 / / 25.9 / 44.7 51.7 6.9 8.4 5.5 < 0.1 < 0.1 < 0.1 0.8
1 Maurepas 36000 4430 0.11 2 3.1 / / / / 18.1 400 28.9 179 0.6 < 0.1 0.1 < 0.1 17.8 2 Seine 250000 26737 63.0 204 0.3*10-2 / / / / 0.2 2.0 1.2 1.2 0.0 < 0.1 < 0.1 < 0.1
0.1 3 Maldroit 50000 6486 0.09 1 3.9 / / / / 155 277 34.9 217 0.8 < 0.1 < 0.1 < 0.1 21.7 4 Gave of
Pau 110000 14513 14.0 83 0.9*10-2 / / / / 1.2 7.3 1.6 1.9 < 0.1 < 0.1 < 0.1 < 0.1
0.2
5 Vallon St Antoine
24000 1459 0.78 46 0.4*10-2 / / / / 3.6 9.7 0.5 2.6 < 0.1 < 0.1 < 0.1 < 0.1 0.3
6 Bouillide 26000 3750 0.02 1 0.8 / / / / 518 1378 165 342 0.2 < 0.1 0.2 < 0.1 34.2 7 CanteRan
e 1000 81 0.03 34 1.5 0.2 0.3 0.7 / / / / 2.2 0.5 < 0.1 < 0.1 < 0.1
0.2
8 Ardières 2900 674 0.10 13 0.6 / / / / 15.6 55.7 2.3 26.3 0.1 < 0.1 < 0.1 < 0.1 2.6 9 Rhône 13000 1061 600 48860 0.3*10-3 / 0.5*10-4 / / 0.4*10-2 0.2*10-1 0.1*10-1 0.3*10-2 < 0.1 < 0.1 < 0.1 < 0.1 < 0.1 10 Rhône 700000 312767 600 166 0.4*10-1 / / / / / 8.2 1.2 1.2 < 0.1 < 0.1 < 0.1 < 0.1 0.1 11 Rhône 88000 7150 600 7250 0.1*10-2 0.3*10-3 0.4*10-3 0.7*10-2 0.3*10-
3 0.4 0.3 0.1 0.1 0.0 < 0.1 0.0 0.0
0.0
12 Arvan 17000 1198 0.74 54 0.1 / 0.3 0.6 / 15.8 8.9 5.0 3.6 0.2 < 0.1 0.0 0.0 0.4
11 /: not quantified 12
PNEC: 5 ng/L for estrogens (Stuer-Lauridsen et al., 2000), 1250000 ng/L for ACE (Garric et al., 2006), 7900 ng/L for ATE (Cleuvers, 2005), 310000 for MET 13
(Cleuvers, 2005) and 10 ng/L for PROP (Ferrari et al., 2004). 14
15
16
Author-produced version of the article published in Environmental Science and Pollution Research (2014), vol. 21, n° 3, pp. 1708-1722 The original publication is available at http://link.springer.com/, doi:10.1007/s11356-013-2037-7

Supplementary material. Mean concentrations (min-max, in ng/L) of estrogens and betablockers measured in the different sampling points of the three 17
sites studied 18
ACE ATE BIS BET MET NAD OXP PROP SOT TIM E1 Bourbre Upstream
(20 m) 14
(6.0-33) 28
(11-74) 1.6
(0.3-3.7) / 1.3 c
(0.8-1.8) 42a
(42-42) / 2.5 c
(1.5-3.4) 8.4
(3.4-19) /
1.6 (0.5-3.9)
Bourgoin Jallieu WWTP
Effluent 393 (289-521)
599 (470-796)
41 (26-63)
/ 32
(25-47) 23
(2.1-45)
/ 80
(62-110) 470
(315-695) 2.9
(1.5-3.9) 9.2
(3.5-16.1)
Bourbre Downstream 1 (5 m)
99 (58-168)
123 (85-165)
11 (3.5-21)
/ 9.0 (4.4-19)
3.4c (2.8-4.0)
/ 17 (7.6-35)
120 (60-213)
1.0 a (1.0-1.0)
2.5 (1.9-3.3)
Bourbre Downstream 2 (2000 m)
54 (5.8-111)
65 (10-137)
5.2 (0.3-13)
/ 8.3 c (4.9-12)
2.3 a (2.3-2.3)
/ 16 c (12-21)
63 (4.5-158)
0.8 a (0.8-0.8)
1.2 (0.3-2.1)
Ardières Upstream 1 (4000 m)
5.0 (3.1-7.3)
2.2d (2.1-2.4)
0.9 d (0.9-0.9)
/ 0.4 d (0.4-0.5)
/ / 1.4 d
(0.7-2.1) 2.3 d
(1.6-3.0) 1.8
(1.5-2.0) 1.4
(0.8-2.3)
Ardières Upstream 2 (20 m)
9.1 (3.0-16)
76 (0.4-209)
1.0b (1.0-1.0)
/ 0.7 d (0.5-0.9)
3.7 d (0.4-7.1)
/ 1.4 b (1.4-1.4)
3.5 d (3.3-3.6)
1.6 (1.4-1.8)
1.4 (1.2-1.5)
Beaujeu WWTP
Effluent 147 (68-226)
628 (388-868)
9.5 (6.6-12)
/ 39 (22-55)
/ / 231
(167-294) 153
(97-208) 3.2
(2.8-3.6) 2.7
(1.7-3.7)
Ardières Downstream 1 (5 m)
39 (12-62)
29 (13-56)
1.4 d (1.2-1.6)
/ 1.2 (0.9-1.8)
0.6 b (0.6-0.6)
/ 1.8 (1.1-2.9)
5.2 (4.9-5.8)
1.6 (1.3-1.8)
1.4 (1.1-1.6)
Ardières Downstream 2 (20 m)
23 (13-30)
26 (19-41)
1.1 (0.4-1.1)
/ 1.2 (1.0-1.4)
/ / 6.3
(4.5-7.4) 4.4
(3.5-5.1) 1.6
(1.5-1.7) 1.6
(1.5-1.8)
Saône Upstream (200 m)
14 (12-18)
10 (9.8 – 10)
14 (1.3-30)
0.2b (0.2-0.2)
1.9 (1.7-2.3)
18 b (18-18)
0.1 b (0.1-0.1)
3.8 d (2.8-4.8)
22 (16-28)
/ 1.4 (1.9-0.7)
Fontaines sur Saône WWTP
Effluent 1446 (1436-1455)
2345 (2240-2450)
507 (383-630)
18 (17-19)
206 (190-223)
56 (52-61)
30 (27-32)
240 (237-243)
886 (855-918)
8.7 (8.0-9.5)
16.2 (12.4-20)
Saône Downstream 1 (50 m)
76 (21-183)
93 (14-240)
27 (9.0-38)
1.1d (0.4-1.7)
12 (2.1-29)
2.7 d (1.0-4.4)
1.9 d (0.3-3.4)
11 (4.1-25)
67 (22-153)
1.0 b (1.0-1.0)
1.7 (1.3-2.0)
Saône Downstream 2 (200 m)
NA NA NA NA NA NA NA NA NA NA 1.6 (1.0-1.9)
19 a quantification frequency of 25%, b quantification frequency of 33%, c quantification frequency of 50%, d quantification frequency of 66%, (if not specified, 20
quantification frequency of 100%) 21
/: not quantified (LOQ between 0.2 and 1.1 ng/L depending on the sample and the substance), NA: not analyzed22
Author-produced version of the article published in Environmental Science and Pollution Research (2014), vol. 21, n° 3, pp. 1708-1722 The original publication is available at http://link.springer.com/, doi:10.1007/s11356-013-2037-7

32
Author-produced version of the article published in Environmental Science and Pollution Research (2014), vol. 21, n° 3, pp. 1708-1722 The original publication is available at http://link.springer.com/, doi:10.1007/s11356-013-2037-7