Impact of Using EDF9 on Credit Portfolio Analysis · Impact of Using EDF9 on Credit Portfolio...
23
Impact of Using EDF9 on Credit Portfolio Analysis Abstract EDF metrics, provided by the Moody’s Analytics Public Firm EDF™ (Expected Default Frequency) model, are forward-looking probabilities of default for public firms. The recently introduced EDF9 model, the 9 th generation, incorporates insights attained by evaluating the behavior of the prior versions, over the course of the recent financial and sovereign debt crises. EDF9 utilizes a larger dataset, given the global expansion of the equity markets, enhanced data quality, and improvements in computational performance. This paper investigates the impact of using EDF9 instead of EDF8 values as inputs for estimating credit portfolio risk measures within Moody’s Analytics RiskFrontier™. The recent EDF9 enhancements affect portfolio risk analysis via various channels — due not only to new values for default probabilities, but also because the market Sharpe ratio (i.e. market-level risk premium) and asset return-based correlations for corporate exposures depend on time series of EDF measures. In this paper, we focus on the question of how using the new EDF9 default probabilities alter patterns in portfolio risk measures. In a separate analysis, we investigate how credit migration models based on EDF9 and EDF7 affect portfolio risk statistics. We compare EDF9 with EDF7 because the Distance to Default (DD) Dynamics model in current RiskFrontier is estimated with EDF7 data. We find that transition matrices estimated with EDF7 and EDF9 data produce very similar credit migration risks when we analyze a well-represented global portfolio in RiskFrontier using these two matrices. Moreover, EDF9 credit migration effect is stable across geographic regions. The results suggest that it is appropriate to combine EDF9-based PD term structures with DD Dynamics credit migration when analyzing credit portfolios in RiskFrontier. It is worth highlighting that EDF9 values are not generally higher or lower than EDF8 values, and, therefore, the portfolio risk measures do not change in one direction. Instead, the direction and magnitude of movements depend on firm characteristics — their region, their sector, their size, as well as their financial situation and, thus, credit quality. An important aspect of the analysis is also the economic environment; the comparisons of EDF9 versus EDF8 and the resulting portfolio risk measures can change with the economic cycle. Finally, one aspect of the EDF model enhancements affects EDF term structure, which means that even if the one-year EDF8 and EDF9 values are similar, the longer-term values may differ, which propagates into any analysis of portfolios containing longer-maturity instruments. Authors Noelle Hong Jimmy Huang Albert Lee Sunny Kanugo Marc Mitrovic Tiago Pinheiro Libor Pospisil Andriy Protsyk Yashan Wang Contact Us Americas +1.212.553.1653 [email protected] Europe +44.20.7772.5454 [email protected] Asia-Pacific (Excluding Japan) +85 2 3551 3077 [email protected] Japan +81 3 5408 4100 [email protected] JUNE 2017 JUNE 2017
Transcript of Impact of Using EDF9 on Credit Portfolio Analysis · Impact of Using EDF9 on Credit Portfolio...
MODELING METHODOLOGY
Impact of Using EDF9 on Credit Portfolio Analysis
Abstract
EDF metrics, provided by the Moody’s Analytics Public Firm EDF™ (Expected Default Frequency) model, are forward-looking probabilities of default for public firms. The recently introduced EDF9 model, the 9th generation, incorporates insights attained by evaluating the behavior of the prior versions, over the course of the recent financial and sovereign debt crises. EDF9 utilizes a larger dataset, given the global expansion of the equity markets, enhanced data quality, and improvements in computational performance.
This paper investigates the impact of using EDF9 instead of EDF8 values as inputs for estimating credit portfolio risk measures within Moody’s Analytics RiskFrontier™. The recent EDF9 enhancements affect portfolio risk analysis via various channels — due not only to new values for default probabilities, but also because the market Sharpe ratio (i.e. market-level risk premium) and asset return-based correlations for corporate exposures depend on time series of EDF measures. In this paper, we focus on the question of how using the new EDF9 default probabilities alter patterns in portfolio risk measures.
In a separate analysis, we investigate how credit migration models based on EDF9 and EDF7 affect portfolio risk statistics. We compare EDF9 with EDF7 because the Distance to Default (DD) Dynamics model in current RiskFrontier is estimated with EDF7 data. We find that transition matrices estimated with EDF7 and EDF9 data produce very similar credit migration risks when we analyze a well-represented global portfolio in RiskFrontier using these two matrices. Moreover, EDF9 credit migration effect is stable across geographic regions. The results suggest that it is appropriate to combine EDF9-based PD term structures with DD Dynamics credit migration when analyzing credit portfolios in RiskFrontier.
It is worth highlighting that EDF9 values are not generally higher or lower than EDF8 values, and, therefore, the portfolio risk measures do not change in one direction. Instead, the direction and magnitude of movements depend on firm characteristics — their region, their sector, their size, as well as their financial situation and, thus, credit quality. An important aspect of the analysis is also the economic environment; the comparisons of EDF9 versus EDF8 and the resulting portfolio risk measures can change with the economic cycle. Finally, one aspect of the EDF model enhancements affects EDF term structure, which means that even if the one-year EDF8 and EDF9 values are similar, the longer-term values may differ, which propagates into any analysis of portfolios containing longer-maturity instruments.
Authors Noelle Hong Jimmy Huang Albert Lee Sunny Kanugo Marc Mitrovic Tiago Pinheiro Libor Pospisil Andriy Protsyk Yashan Wang
Contact Us Americas +1.212.553.1653 [email protected]
Europe +44.20.7772.5454 [email protected]
Asia-Pacific (Excluding Japan) +85 2 3551 3077 [email protected]
Japan +81 3 5408 4100 [email protected]
JUNE 2017 JUNE 2017
Table of Contents
1. Introduction 3
2.EDF9 Enhancements 5
3.Role of EDF Measures Within the RiskFrontier Framework 8
4.Impact of Using EDF9 vs. EDF8 Inputs on EC and RC 9
5.Impact of Using EDF9 vs EDF7 on Migration Risk 13
6.Summary 17
Appendix A Impact of EDF9 market Sharpe ratio 𝜆𝜆𝜆𝜆 on Credit Portfolio Measure 18
Appendix B Term Structure of EDF9 with U.S. Synthetic Portfolio 19
Appendix C Test Portfolio used for Migration Risk Comparison between EDF7 and EDF9 20
References 22
2 JUNE 2017 IMPACT OF USING EDF9 ON CREDIT PORTFOLIO ANALYSIS

1. Introduction
All credit portfolios face uncertainty in losses. The challenge for risk and portfolio managers is to measure and understand the economic risks in their portfolio, ensuring they are properly compensated for taking on that risk. An active portfolio manager cannot achieve this goal without practical and conceptually sound methods for measuring the stand-alone credit risk of instruments (expressed, among others, by default probabilities) and understanding concentration and diversification effects across instruments.
Moody’s Analytics RiskFrontier is a Monte Carlo simulation-based framework that estimates credit portfolio risk measures. RiskFrontier inputs include default probabilities (PDs), expected loss given default values (LGDs), and correlations of credit qualities (called asset correlations).1 Many organizations define probability of default for listed corporates using Moody’s Analytics’ Public Firm EDF (Expected Default Frequency) model. The model has been the industry-leading PD model since its introduction in the early 1990s. Since that time, the model has undergone considerable development. The model continues to evolve, providing unequalled global coverage of 35,000-plus public firms on a daily basis.
EDF values often serve as RiskFrontier inputs, and any enhancement or change to the EDF model impacts RiskFrontier outcomes — credit portfolio risk measures. This paper examines how the most recent enhancements in EDF9 impact portfolio risk metrics across firms, regions, sectors, and time.
Since the release of the previous version of the Public Firm EDF model, EDF8, in 2007, the global economy experienced a financial crisis that expanded into what has been called the Great Recession.2 Europe dealt with a sovereign credit crisis, which, at points, put the monetary union at break-up risk. Monetary policy took on an unprecedented role in the broader economy. Considerations of quantitative easing, as well as bailouts, became important pricing factors for fixed-income securities. The term SIFI3 was introduced, and many new regulations were implemented around the world, affecting capital market structures and the roles both private and public institutions play in the financial system. At the same time, the BRIC4 countries and other emerging markets continued to expand, resulting in a large increase in the number of publicly traded firms. Subsequently, data feeds expanded coverage outside of North America.
In light of these events, Moody’s Analytics revisited its process of measuring PDs. The updated model and data used in EDF9 reflect new lessons learned from the most recent credit cycle. An important revision expands the EDF9 dataset for financial firm failures, which improves the ability to predict defaults for these entities. Financial firms typically present a different default dynamic when compared to non-financial corporations. The increase in the number of financial firm failures in our default database enabled us to significantly refine the Public Firm EDF model’s treatment of financial firms.
EDF9 not only changes RiskFrontier PD inputs, but it also affects other parameter estimations as well — whether valuation parameters via a new market Sharpe ratio (i.e. market-level market-risk premium) or correlations via a time series of asset returns, implied from the EDF model. For the most part of this paper, we focus on isolating the effects of using EDF9 as RiskFrontier’s input PD source instead of EDF8. Specifically, we illustrate how three different aspects between EDF9 and EDF8 impact portfolio risk:
» Differences across firms, with an emphasis on financial versus non-financial firms
» Variation in differences over time, depending on changing economic environment
» Differences in EDF term structure
One RiskFrontier input that has not changed with the new EDF model is the credit migration matrix. This matrix describes the likelihood of migrating between credit states and it is a key determinant of migration risk. The question arises whether migration risk would change if we were to re-estimate the migration matrix using EDF9 data. We address this question in the last part of this paper.
1 Levy (2008) describes the RiskFrontier framework. 2 We use the term “Great Recession” to refer to the period that began with a financial crisis in late 2007 and then spread, impacting non-financial firms, to the unemployment rate, other macroeconomic variables, and sovereign credit risk. This recessionary period ended in mid-2009.
3 Systemically Important Financial Institutions. 4 Brazil, Russia, India, and China.
3 JUNE 2017 IMPACT OF USING EDF9 ON CREDIT PORTFOLIO ANALYSIS

We organize the remainder of this paper as follows:
» Section 2 provides a brief introduction to EDF9 and describes the primary differences between EDF9 and EDF8.
» Section 3 describes how components of the RiskFrontier framework depend on EDF values.
» Section 4 explains the impact of default probability changes from EDF8 to EDF9 on credit portfolio risk measures.
» Section 5 compares the impact of transition matrices based on EDF 9 vs. earlier EDF models on portfolio risk measures
» Section 6 concludes.
4 JUNE 2017 IMPACT OF USING EDF9 ON CREDIT PORTFOLIO ANALYSIS

2. EDF9 Enhancements
While EDF9 uses the same conceptual framework as EDF8, based on a structural model of credit risk, EDF9 also includes a number of important enhancements. In this section, we highlight several. For a specific overview and technical details of the EDF9 methodology and enhancements, see Nazeran and Dwyer (2015).
For the first time, the EDF model includes financial firm-specific DD-to-EDF mapping, which utilizes international financial firm failures spanning 1987–2014. The numerous financial firm failures observed during the last seven years makes such mapping feasible. Given the dynamics of the most recent financial crisis, EDF9 values for financial firms also represent the risk of not only default but also of government bailout.
As Figure 1 illustrates, financial firm-specific mapping significantly improves granularity, because the DD-to-EDF mapping for non-financials does not capture the observed default patterns of financial firms — for a given high DD level (low credit risk), the financial default rate is higher than the non-financials’ mapping would suggest. This trait, together with enhancements to default point modeling, means that EDF9 improvements affect analysis of financial firm more than non-financial firms.
Figure 1 Global Rated Non-Financial EDF (denoted as “EDF9 Corp”) vs. Financial Default Rate (denoted as “ODF” or Observed Default Rate).
The new EDF9 model also refines the asset volatility calculation by adding a forward-looking component (thus, in a historically low-volatility environment, the forward-looking component adjusts the volatility upward, and vice-versa). As Figure 2 and Figure 3 show, thanks to the separate DD-to-EDF mapping for financial firms, which differs considerably from non-financials’ mapping, and adding a forward-looking component to the asset volatility for all firms, EDF9 values are typically not as low as EDF8 during growth periods and not as high as EDF8 during periods of market turmoil. This effect is more visible for financial firms.
5 JUNE 2017 IMPACT OF USING EDF9 ON CREDIT PORTFOLIO ANALYSIS

Figure 2 Time Series Patterns in One-Year EDF: Global Rated Non-Financials.
Figure 3 Time Series Patterns in One-Year EDF: Global Rated Financials.
The third important aspect of EDF9 is its flexibility when modeling term structure. For example, the slope of the term structure can now vary with economic conditions, and this change implies that that longer-term EDF9 values are more stable over time than the longer-term EDF8 values. The new term structure reflects the intuition that the longer-term EDF values capture credit risk over more economic environments, not just the current one. If we consider a 7Y (seven-year) EDF measure, for instance, it should reflect credit quality during a seven-year period, which typically contains recessionary as well as growth years. Figure 4 depicts this scenario, where we see cyclicality in the slope of the term structure — in good times the credit risk term structure is steeper. As a result, in EDF9, a seven-year EDF measure can deviate from the one-year EDF measure more than it did in the EDF8 model.
6 JUNE 2017 IMPACT OF USING EDF9 ON CREDIT PORTFOLIO ANALYSIS

Figure 4 Time Series of One-Year and Seven-Year EDF9 Values: North American Large Non-Financials.
7 JUNE 2017 IMPACT OF USING EDF9 ON CREDIT PORTFOLIO ANALYSIS

3. Role of EDF Measures Within the RiskFrontier Framework
In this section, we provide an overview of the role of EDF measures in RiskFrontier and how EDF9 can affect the estimation of portfolio risk measures.
Figure 5 presents input components of the RiskFrontier framework and how they interact during the calculation of portfolio risk measures, such as portfolio Economic Capital (EC) or instrument Risk Contributions (RC).
Figure 5 Components of the RiskFrontier Framework.
We next discuss how portfolio analysis uses EDF values, and how the EDF9 model enhancements affect the individual input components:
» EDF values are often used as PDs for listed firms. They have two roles in portfolio analysis: (1) determining default frequency across simulation trials on horizon, and (2) instrument valuation as of both analysis date and horizon. We highlight that, for lattice valuation, the entire term structure of EDF value matters, not just the EDF value to horizon.
» Sometimes LGD values from the Moody’s Analytics LossCalc™ model are utilized. 5 Therefore, we note that, as estimation of LossCalc is contingent on EDF data, EDF9 can change LossCalc outputs. 6
» The market Sharpe ratio (or market-level risk premium), 𝜆𝜆, is calibrated by matching EDF values implied by bond spreads to observed bond spreads. Thus, the EDF model impacts the 𝜆𝜆 level, which is treated as a fixed parameter used in risk-neutral valuation.
» DD dynamics is estimated from DD time series, which depends on the EDF model. A migration matrix is used in lattice valuation and also determines the frequency of migrating to credit states on a horizon in Monte Carlo simulation.
» Listed firms’ asset correlations are often based on the GCorr Corporate model, estimated from asset return time series that, in turn, depend on the EDF model. 7 Asset correlations are used in Monte Carlo simulation to generate correlated changes in credit qualities.
Section 4 focuses on changes in portfolio risk measures related to replacing EDF8 with EDF9 as the input PD, while keeping all other inputs, e.g. DD dynamics, risk premiums, and correlations unchanged. In Section 5 we also discuss how portfolio risk measures may change if we re-estimate the credit migration matrix using EDF9 data.
5 For details regarding the Moody’s Analytics LossCalc model, see Dwyer and Korablev (2009). 6 A new version of the LossCalc model, based on EDF9, will be released in the second half of 2015. 7 GCorr 2015 Corporate, to be released at the end of 2015, will be based on EDF9 data. The 2014 version of the GCorr model employs EDF8 asset return data.
8 JUNE 2017 IMPACT OF USING EDF9 ON CREDIT PORTFOLIO ANALYSIS

4. Impact of Using EDF9 vs. EDF8 Inputs on EC and RC
In this section, we investigate how changing input PDs from EDF8 to EDF9 impacts RiskFrontier credit portfolio risk measures. In order to perform this analysis, we construct nine portfolios containing loans to public firms in three regions and three sectors:
» Three regions: U.S., Europe, and Global (U.S. + Europe + Asia + Australia).
» Three sectors: all non-financials firms, higher credit quality non-financials (1Y EDF8<100bps), and large financials (assets above $25 billion USD).
Figure 6 illustrates dispersion in EDF8 and EDF9 across the large U.S. financials and U.S. non-financials. 8 Figure 6 shows EDF8 and EDF9 for the U.S. non-financials at roughly similar levels across all credit risk levels. On the other hand, EDF9 values for the large U.S. financials are higher than EDF8 values for lower risk firms, but lower for high risk firms. This finding occurs because, in EDF9, financial firm-specific DD-to-EDF mapping is flatter than for non-financials, as Figure 1 illustrates.
Figure 6 EDF8 vs. EDF9 Scatter Plot (log scale) — each dot corresponds to one instrument.
The median EDF values in Table 1 summarize a dispersion in default probabilities across the nine portfolios. They show how the EDF values change from EDF8 to EDF9. May 2015 is a growth economic environment (and a low market-volatility environment) in the U.S., and, thus, EDF9 is much higher than EDF8 for financials. This finding is not the case in Europe, where the financial sector is still recovering from the Eurozone sovereign crisis and the subsequent recession. As a result, the median EDF9 value for large European financials is lower than the median EDF8 value. Some non-financial portfolios, such as higher credit quality European non-financials, have very similar median EDF8 and EDF9 levels.
Looking at longer-term EDF measures in Table 2 specifically 10-year EDF values, we can see that the EDF9 values are now higher than EDF8 values for all portfolios, because the slope of the term structure is steeper — considerably for some portfolios— as of May 2015. These values result from the term structure enhancement explained in Section 2. We note, however, that this enhancement can have the opposite effect during poor economic environments.
8 In all portfolios, we considered only firms with EDF values of less than 10%, in order to avoid the situation where the overall results are impacted by several outliers.
9 JUNE 2017 IMPACT OF USING EDF9 ON CREDIT PORTFOLIO ANALYSIS

Table 1
One-Year EDF as of May 2015
PORTFOLIO NO. OF FIRMS MEDIAN EDF9 MEDIAN EDF8 DIFFERENCE % DIFFERENCE
Global
Non-financials 21,205 0.32% 0.16% 0.16% 99.18%
Non-financials with Higher Credit Quality 16,069 0.16% 0.10% 0.06% 64.94%
Financials, Assets > $25 billion USD 463 0.43% 0.26% 0.18% 67.96%
U.S.
Non-financials 2,721 0.15% 0.11% 0.04% 35.75%
Non-financials with Higher Credit Quality 2,320 0.10% 0.08% 0.01% 17.31%
Financials, Assets > $25 billion USD 79 0.24% 0.05% 0.20% 415.01%
Europe
Non-financials 3,857 0.21% 0.15% 0.07% 45.29% Non-financials with
Higher Credit Quality 3,165 0.12% 0.10% 0.02% 25.25%
Financials, Assets > $25 billion USD 122 0.43% 0.50% -0.07% -14.27%
Table 2
10-Year EDF as of May 2015
PORTFOLIO NO.OF FIRMS MEDIAN EDF9 MEDIAN EDF8 DIFFERENCE % DIFFERENCE
Global
Non-financials 21,205 0.94% 0.42% 0.52% 124.55%
Non-financials with Higher Credit Quality
16,069 0.53% 0.27% 0.26% 94.15%
Financials, Assets > $25 billion USD 463 1.28% 0.82% 0.46% 56.64%
U.S. Non-financials 2,721 0.93% 0.33% 0.59% 178.00%
Non-financials with Higher Credit Quality 2,320 0.57% 0.25% 0.31% 122.98%
Financials, Assets > $25 billion USD 79 0.46% 0.17% 0.29% 168.91%
Europe Non-financials 3,857 0.94% 0.40% 0.54% 135.35%
Non-financials with Higher Credit Quality
3,165 0.57% 0.29% 0.28% 97.44%
Financials, Assets > $25 billion USD 122 1.81% 1.42% 0.38% 26.95%
We analyze each of the nine portfolios on a stand-alone basis in RiskFrontier. Table 3 and Tale 4 show the corresponding EC values with EDF8 and EDF9. As expected, directional changes in EC are in-line with the changes from EDF8 to EDF9; while the capital level is affected by the name concentration (numbers of firms in the portfolio) and correlations (large financials tend to have very high correlations9).
9 See for example, Huang, et al. (2015).
10 JUNE 2017 IMPACT OF USING EDF9 ON CREDIT PORTFOLIO ANALYSIS
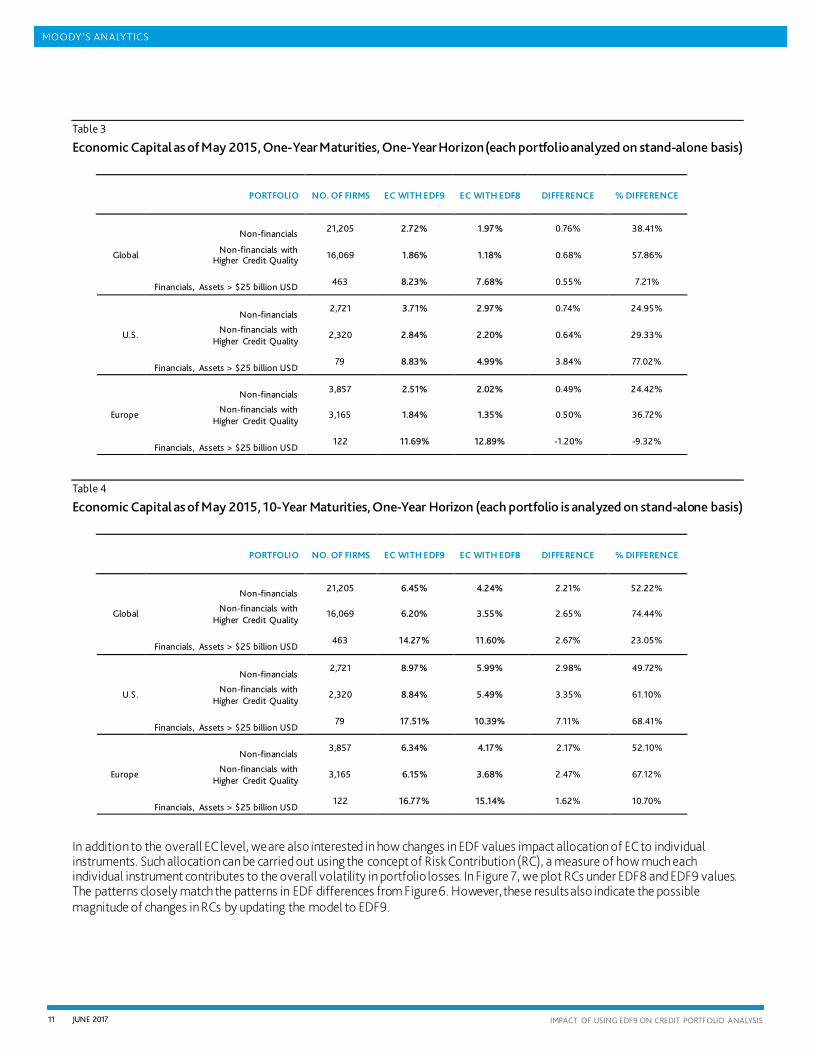
Table 3
Economic Capital as of May 2015, One-Year Maturities, One-Year Horizon (each portfolio analyzed on stand-alone basis)
PORTFOLIO NO. OF FIRMS EC WITH EDF9 EC WITH EDF8 DIFFERENCE % DIFFERENCE
Global
Non-financials 21,205 2.72% 1.97% 0.76% 38.41%
Non-financials with Higher Credit Quality 16,069 1.86% 1.18% 0.68% 57.86%
Financials, Assets > $25 billion USD 463 8.23% 7.68% 0.55% 7.21%
U.S.
Non-financials 2,721 3.71% 2.97% 0.74% 24.95%
Non-financials with Higher Credit Quality
2,320 2.84% 2.20% 0.64% 29.33%
Financials, Assets > $25 billion USD 79 8.83% 4.99% 3.84% 77.02%
Europe
Non-financials 3,857 2.51% 2.02% 0.49% 24.42%
Non-financials with Higher Credit Quality
3,165 1.84% 1.35% 0.50% 36.72%
Financials, Assets > $25 billion USD 122 11.69% 12.89% -1.20% -9.32%
Table 4
Economic Capital as of May 2015, 10-Year Maturities, One-Year Horizon (each portfolio is analyzed on stand-alone basis)
PORTFOLIO NO. OF FIRMS EC WITH EDF9 EC WITH EDF8 DIFFERENCE % DIFFERENCE
Global
Non-financials 21,205 6.45% 4.24% 2.21% 52.22%
Non-financials with Higher Credit Quality
16,069 6.20% 3.55% 2.65% 74.44%
Financials, Assets > $25 billion USD 463 14.27% 11.60% 2.67% 23.05%
U.S.
Non-financials 2,721 8.97% 5.99% 2.98% 49.72%
Non-financials with Higher Credit Quality
2,320 8.84% 5.49% 3.35% 61.10%
Financials, Assets > $25 billion USD 79 17.51% 10.39% 7.11% 68.41%
Europe
Non-financials 3,857 6.34% 4.17% 2.17% 52.10%
Non-financials with Higher Credit Quality
3,165 6.15% 3.68% 2.47% 67.12%
Financials, Assets > $25 billion USD 122 16.77% 15.14% 1.62% 10.70%
In addition to the overall EC level, we are also interested in how changes in EDF values impact allocation of EC to individual instruments. Such allocation can be carried out using the concept of Risk Contribution (RC), a measure of how much each individual instrument contributes to the overall volatility in portfolio losses. In Figure 7, we plot RCs under EDF8 and EDF9 values. The patterns closely match the patterns in EDF differences from Figure 6. However, these results also indicate the possible magnitude of changes in RCs by updating the model to EDF9.
11 JUNE 2017 IMPACT OF USING EDF9 ON CREDIT PORTFOLIO ANALYSIS

Figure 7 Risk Contribution Scatter Plot (log scale) — each dot corresponds to one instrument.
Table 5 shows an example of how changing the analysis date, and especially the economic environment, can impact results. We repeat the analysis as of April 2009 — near the peak of the financial crisis — for the three U.S. portfolios. Due to some of the reasons discussed in Section 2, the financials portfolio now has lower median EDF9 values when compared to EDF8 and, thus, lower EC. On the other hand, the median EDF9 values are now higher for non-financial portfolios and EC becomes higher. This analysis highlights the importance of putting EDF8 versus EDF9 comparisons within the context of the economic environment in which the analysis is conducted.
Table 5
U.S. Portfolios as of 2009 April (each portfolio analyzed on stand-alone basis)
NON-FINANCIALS NON-FINANCIALS,
HIGHER CREDIT QUALITY
FINANCIALS, ASSETS > $25 BILLION USD
Number of Firms 2073 1795 66
Median EDF9 (One-Year) 1.19% 0.88% 0.91%
Median EDF8 (One-Year) 0.77% 0.62% 1.11%
EDF Difference 0.42% 0.26% -0.20%
% EDF Difference 54.55% 41.94% -18.02%
EC with EDF9; Five-Year Maturity
947 874.9 2164.9
EC with EDF8; Five-Year Maturity
852.2 774.7 2204.8
EC Difference 94.8 100.2 -39.9
% EC Difference 11.12% 12.93% -1.81%
Median EDF9 (Five-Year) 1.17% 0.94% 0.90%
Median EDF8 (Five-Year) 1.25% 1.04% 1.81%
EDF Difference -0.08% -0.10% -0.91%
% EDF Difference -6.40% -9.62% -50.28%
EC with EDF9; Five-Year Maturity
1209.9 1164.2 2444.1
EC with EDF8; Five-Year Maturity
1201.6 1160.2 2465.5
EC Difference 8.3 4.0 -21.4
% EC Difference 0.69% 0.34% -0.87%
12 JUNE 2017 IMPACT OF USING EDF9 ON CREDIT PORTFOLIO ANALYSIS

5. Impact of Using EDF9 vs EDF7 on Migration Risk
In this section we compare the impact of credit migration on portfolio risk measures when we analyze a portfolio with transition matrices based on EDF9 and EDF7 data. We use EDF7 instead of EDF8 data because the current preset credit migration model in RiskFrontier — distance to default dynamics — is based on EDF7 data.
Migration risk is a key part of portfolio risk. For example, in the global portfolio of bonds described below, migration risk accounts for 77% of the standard deviation of portfolio values at one-year horizon. The key determinant of migration risk is a transition matrix that describes an entity’s distribution of future credit states given its current credit state. The question then arises whether using EDF9 data to estimate the migration matrix leads to a significantly different contribution of migration risk to portfolio risk.
To address this question we first estimate annual migration matrices for North America Non-Financial firms based on EDF7 data. We also estimate annual migration matrices for North America Non-Financial firms based on EDF9 data. We then run RiskFrontier analysis of a representative portfolio of global credit instruments using these matrices as user-supplied migration matrices and obtain portfolio risk statistics. We calculate the impact of credit migration by running the analysis in full migration mode and in default/no-default mode and take the difference in risk statistics as the contribution of credit migration.
Our sample is made of monthly observations of two versions of EDF (EDF7 and EDF9) for publicly traded firms in North America (as well as EMEA and APAC regions) from 1990–2007. The estimation procedure of the transition matrices is the same for all of them. EDF7 values are bounded between 20% and 2bps in our data. Correspondingly, we restrict the EDF9 values to lay within the same bounds. We consider transitions between twenty-eight non-default credit-states that correspond to 28 buckets which are equally-spaced using a pseudo Distance-to-Default measure. This is a transformation of the EDF measure and is calculated as the negative of the inverse of the standard normal at the firm’s one-year EDF, i.e., 𝑝𝑝𝑝𝑝𝑝𝑝𝑖𝑖,𝑡𝑡 = −𝑁𝑁−1�𝐸𝐸𝑝𝑝𝐸𝐸𝑖𝑖,𝑡𝑡� for a firm i at time t.
We keep track of a firm’s credit-state in a given month and one-year later after removing the observations where the firm was in default. We then pool all observations that started in a given credit-state, and compute estimates of the transition probabilities to all credit-states one-year later using the observed transition frequencies in our data. We use these estimates to form the non-default part of a transition matrix. The rest of the transition matrix is composed of probabilities of default that characterize each credit-quality bucket. To facilitate the comparison between different transition matrices, we keep the definition of each credit-quality bucket, i.e., the probabilities of default of each bucket, constant across all transition matrices.
We use each transition matrix in RiskFrontier as a user-supplied matrix to obtain several risk measures for the same synthetic portfolio, which is made of short- and long-term bonds with annual-coupons issued by global publicly traded companies. To value this portfolio we use book valuation at analysis and horizon dates with linear approximation (linear amortization) between these two dates. Our horizon is one year. When calculating the distributions of portfolio value given each transition matrix we keep the instrument spreads and the rest of the portfolio characteristics constant.10 We focus the comparison between transition matrices on the following measures of portfolio risk: Economic Capital in excess of Total Spread and Expected Shortfall in excess of Total Spread.
The results of comparing EDF7 with EDF9 transition matrices for North American non-financial firms are in Table 6. Results show that the effect of migration risk on portfolio risk measures is similar when using EDF7 or EDF9 transition matrices. The relative difference between the two transition matrices in the effect of migration risk on both Economic Capital and Expected Shortfall is less than 2%.
Table 6
Migration Risk in ED7 and EDF9 North America Non-Financial Firms Transition Matrices
NORMALIZED PORTFOLIO RISK MEASURES MIGRATION RISK EFFECT ONLY
EDF7 NORTH AMERICA NON-FINANCIAL
EDF9 NORTH AMERICA NON-FINANCIAL
DIFFERENCE % DIFFERENCE
Economic Capital TS 6.95E-02 7.08E-02 1.34E-03 1.93%
Expected Shortfall TS 7.51E-02 7.62E-02 1.10E-03 1.47%
10 For example, by using book-linear valuation, we keep constant the expected value of the portfolio.
13 JUNE 2017 IMPACT OF USING EDF9 ON CREDIT PORTFOLIO ANALYSIS

Next, we perform similar analysis using EDF7- and EDF9-based migration matrices estimated over different time periods. This analysis focuses on the underlying data used for estimating DD Dynamics and shows that it is still applicable to modeling credit migration. To this end, we estimate an EDF7-based annual matrix using data from January 1990–February 1999 and compare it with an EDF9-based annual migration matrix estimated using data from January 1990–December 2015.
This comparison allows us to capture migration differences between EDF7 and EDF9 due to both EDF version change and time period change. Since we estimate the DD Dynamics migration model using the EDF7 data from January 1990–February 1999, we use the exact same period and obligor data to estimate the EDF7-based migration matrix. Whereas, for the EDF9-based matrix, we use all available data up to 2015, including data from the financial crisis period. Given the EDF7 estimation sample spans only nine years, instead of using the previously defined twenty-eight non-default ratings, we use a coarser rating representation of 10 ratings. This helps mitigate potential issues due to estimation noise, while allowing us to capture the migration differences (if any) between the two models. For details on the test portfolio used in the analysis, please refer to Appendix C.
Table 7 presents the portfolio-level migration risk measures using the two migration matrices estimated over different time periods. We find that the migration risk differences between EDF9 (1990–2015) and EDF7 (1990–1999) are somewhat higher than those observed between the EDF9 and EDF7 matrices estimated over the same time period (1990–2007). However, given the EDF9 model estimation includes data from the financial crisis period (2008–2009), the magnitude of differences is still reasonable. It is also worth noting that the differences include the effect of both EDF version change and time period change.
Table 7
Migration Risk in ED7 (1990–1999) and EDF9 (1990-2015) North America Non-Financial Firms Transition Matrices
NORMALIZED PORTFOLIO RISK MEASURES MIGRATION RISK EFFECT ONLY
EDF7 (1990–1999) EDF9 (1990–2015) DIFFERENCE % DIFFERENCE
Economic Capital TS 5.96E-02 6.43E-02 4.67E-03 7.8%
Expected Shortfall TS 6.38E-02 6.83E-02 4.46E-03 7.0%
Within the EDF9 (1990–2015) and EDF7 (1990–1999) migration analysis, we also study the allocation of portfolio-level EC to individual instruments. For this process, we compare the average risk contributions (RCs) and tail risk contributions (TRCs) for rating and RSQ-rating segments. In Figures 8 and 9, we plot the average RCs and TRCs for each non-default rating based on EDF7 and EDF9 matrices. Except for small differences in high credit quality ratings (i.e., low PD ratings), the average RCs and TRCs are very similar for both migration matrices. The EDF9-based RCs and TRCs are a slightly higher than EDF7, especially for good ratings, driven by the relatively higher number of credit downgrades during the financial crisis period.
Figure 8 Average Risk Contributions by Rating — each dot corresponds to one rating.
14 JUNE 2017 IMPACT OF USING EDF9 ON CREDIT PORTFOLIO ANALYSIS

Figure 9 Average Tail Risk Contributions by Rating — each dot corresponds to one rating.
Besides rating segments, we also study the risk allocations across different RSQ buckets, namely low RSQ (0-20%), medium RSQ (20-35%), and high RSQ (35-65%). Figure 10 and 11 plot the RCs and TRCs by rating for the three RSQ buckets. For each RSQ bucket, the differences in average RCs and TRCs by rating are very similar to those for the entire portfolio. These findings suggest that the migration risk and risk allocation to sub-portfolios using EDF9 data-based migration matrix are comparable to those based on EDF7 data (1990–1999), also used to estimate the RiskFrontier’s DD Dynamics model.
Figure 10 Average Risk Contributions by Rating for different RSQ buckets — each dot corresponds to one rating.
Figure 11 Average Tail Risk Contributions by Rating for different RSQ buckets — each dot corresponds to one rating.
In addition to the comparison between EDF7 and EDF9 credit migration models, we also explore EDF9 credit migration along other dimensions. First, we estimate transition matrices based on the EDF9 data with firms in the EMEA and APAC regions and compare the resulting risk measures with those from the North America matrix. We find slightly larger regional migration effect differences than those between EDF7 and EDF9. Table 8 shows that the transition matrix based on North America firms leads to slightly higher risk measures than the matrices from the other two regions.
15 JUNE 2017 IMPACT OF USING EDF9 ON CREDIT PORTFOLIO ANALYSIS

Table 8
Migration Risk in EDF9 North America, EMEA, and APAC Transition Matrices
NORMALIZED PORTFOLIO RISK MEASURES MIGRATION RISK EFFECT ONLY
EDF9 NORTH AMERICA EDF9 EMEA % DIFFERENCE EDF9 APAC % DIFFERENCE
Economic Capital TS 6.87E-02 6.52E-02 -5.1% 6.74E-02 -1.81%
Expected Shortfall TS 7.43E-02 7.06E-02 -4.97% 7.33E-02 -1.28%
Finally, we compare the credit migration of financial firms and non-financial firms. Because of the nature of the business of financial firms, the complexity and opaqueness of their financial statements, and potential government bailout upon distress, it is generally more difficulty to predict financial firm default probability levels than those of non-financial firms. The relationship between EDF9 and observed default rates for financial firms, as depicted in Figure 1, reflects the fact that the EDF measure for financial firms noisier than for non-financial firms and does not fully capture the underlying credit risk. On the other hand, the Distance-to-Default (DD) is an intrinsic measure of firm credit risk. We find that the credit migration volatility measured in the DD space is very similar between financial and non-financial firms, while the transition matrix estimated directly with financial firm EDF9 data exhibits lower migration risk As a result, we recommend using the transition matrix of non-financial firms to calculate the credit migration risk of financial firms.
16 JUNE 2017 IMPACT OF USING EDF9 ON CREDIT PORTFOLIO ANALYSIS

6. Summary
This paper analyzes how updating the probability of default inputs generated via the new EDF9 model vs. the EDF8 model affect Economic Capital and other portfolio risk measures within RiskFrontier. We discuss the main differences between EDF8 and EDF9 and the dependency of RiskFrontier on EDF inputs. We also analyze the effect on migration risk and portfolio risk measures of not updating the credit migration matrix based on EDF9 data.
Some of the primary changes between the two EDF versions include the introduction of a financial firm-specific DD-to-EDF mapping, the addition of forward-looking components to asset volatilities, and additional flexibility when modeling the term structure in EDF9.
While EDF9 affects RiskFrontier EC calculations via multiple channels, in most of this paper, we focus only on their use as default probabilities, which impacts portfolio analyses via the determination of the default frequency across simulation trials and influence on instrument valuation.
Further, we conduct a capital impact analysis where we assess changes in median EDF values and economic capital for portfolios that utilize EDF9 and EDF8. In particular, we consider portfolios containing three types of firms: non-financial firms, non-financials with higher credit quality, and large financials; we also consider three regions: Global, the U.S., and Europe. In order to delineate differences coming from the EDF model, we conduct our analyses during the current economic environment (May 2015) and during a poorer stage of the economic cycle (April 2009). We analyze term structure effects using one-year maturity and 10-year maturity portfolios.
The overall conclusion: when using one-year EDF values, we find the general levels of EDF values and capital of non-financial portfolios have roughly similar levels when comparing results derived from EDF9 and EDF8. Differences for financial portfolios are more pronounced due to the new financial firm-specific DD-to-EDF mapping. In economically benign times, such as in May 2015 for the U.S., we find that, in large financial portfolios, low-risk firms have higher EDF levels using EDF9 and high-risk firms have lower EDF levels for low risk firms but lower EDF levels for high-risk firms when compared to using EDF8 inputs. This finding is due to the financial firm-specific mapping generating more stable EDF values over time. Thus, the economy, being in a favorable stage of the economic cycle leads to, in particular for low risk firms, increases in EDF levels. Conversely, during a poorer state of the economic cycle, such as in April 2009, we find lower financial EDF values and capital levels. For European financials, the situation is different, since many of them still (as of May 2015) suffer from the effects of Eurozone sovereign debt crisis and the subsequent recession. For these firms, the EDF9 levels currently tend to be higher than EDF8 levels.
In the case of using EDF values for higher maturities, such as the 10-year EDF measure in this paper, we find differences in the portfolio EDF levels as well as more pronounced capital levels when compared to using only one-year EDF values. This finding holds across financial and non-financial portfolios due to enhancements in the modeling of term structure effects in EDF9, such as making the slope of the term structure dependent on economic conditions.
The last part of this paper examines the use of EDF9 as the basis to estimate the credit migration matrix. Even though the preset migration model in RiskFrontier, DD Dynamics, has not been changed with the new EDF model, we want to understand how migration risk may be impacted if we were to re-estimate the model. We study the portfolio-level differences in migration risk between EDF7 and EDF9 with and without controlling for time period change, and also compare the risk allocation to different rating and RSQ segments. Our analysis shows that the effect on portfolio risk due to credit migration is virtually the same whether we use a transition matrix estimated from the EDF9 data of North America Non-Financial firms or the EDF7 data of the same region and sector, which is also the basis of DD Dynamics model estimation. Similarly we find small differences in segment-level risk allocation based on EDF7 and EDF9 migration matrices. Our overall results suggest that DD Dynamics can be used with EDF9 PD term structures in RiskFrontier.
17 JUNE 2017 IMPACT OF USING EDF9 ON CREDIT PORTFOLIO ANALYSIS
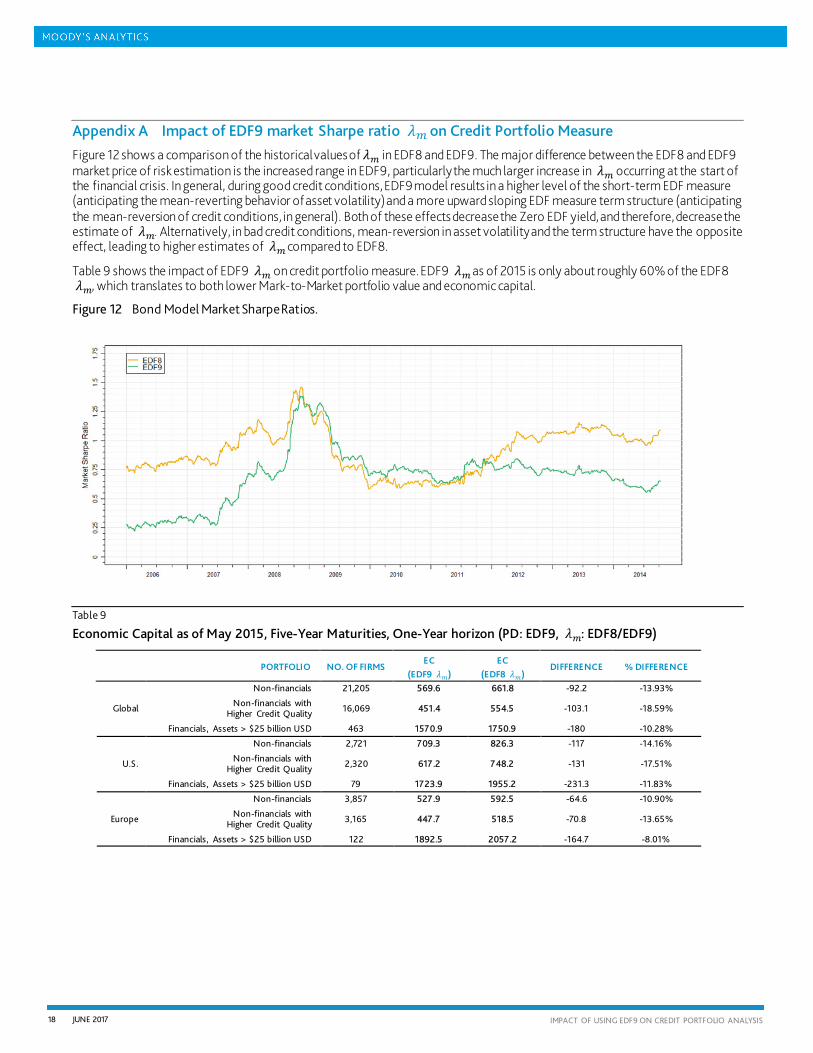
Appendix A Impact of EDF9 market Sharpe ratio 𝜆𝜆𝑚𝑚 on Credit Portfolio Measure Figure 12 shows a comparison of the historical values of 𝜆𝜆𝑚𝑚 in EDF8 and EDF9. The major difference between the EDF8 and EDF9 market price of risk estimation is the increased range in EDF9, particularly the much larger increase in 𝜆𝜆𝑚𝑚 occurring at the start of the financial crisis. In general, during good credit conditions, EDF9 model results in a higher level of the short-term EDF measure (anticipating the mean-reverting behavior of asset volatility) and a more upward sloping EDF measure term structure (anticipating the mean-reversion of credit conditions, in general). Both of these effects decrease the Zero EDF yield, and therefore, decrease the estimate of 𝜆𝜆𝑚𝑚. Alternatively, in bad credit conditions, mean-reversion in asset volatility and the term structure have the opposite effect, leading to higher estimates of 𝜆𝜆𝑚𝑚 compared to EDF8.
Table 9 shows the impact of EDF9 𝜆𝜆𝑚𝑚 on credit portfolio measure. EDF9 𝜆𝜆𝑚𝑚 as of 2015 is only about roughly 60% of the EDF8 𝜆𝜆𝑚𝑚, which translates to both lower Mark-to-Market portfolio value and economic capital.
Figure 12 Bond Model Market Sharpe Ratios.
Table 9
Economic Capital as of May 2015, Five-Year Maturities, One-Year horizon (PD: EDF9, 𝜆𝜆𝑚𝑚: EDF8/EDF9)
PORTFOLIO NO. OF FIRMS EC
(EDF9 𝜆𝜆𝑚𝑚) EC
(EDF8 𝜆𝜆𝑚𝑚) DIFFERENCE % DIFFERENCE
Global
Non-financials 21,205 569.6 661.8 -92.2 -13.93%
Non-financials with Higher Credit Quality 16,069 451.4 554.5 -103.1 -18.59%
Financials, Assets > $25 billion USD 463 1570.9 1750.9 -180 -10.28%
U.S.
Non-financials 2,721 709.3 826.3 -117 -14.16%
Non-financials with Higher Credit Quality 2,320 617.2 748.2 -131 -17.51%
Financials, Assets > $25 billion USD 79 1723.9 1955.2 -231.3 -11.83%
Europe
Non-financials 3,857 527.9 592.5 -64.6 -10.90%
Non-financials with Higher Credit Quality 3,165 447.7 518.5 -70.8 -13.65%
Financials, Assets > $25 billion USD 122 1892.5 2057.2 -164.7 -8.01%
18 JUNE 2017 IMPACT OF USING EDF9 ON CREDIT PORTFOLIO ANALYSIS

Appendix B Term Structure of EDF9 with U.S. Synthetic Portfolio Figure 13 and Figure 14 show the comparison between the EDF8 and EDF9 term structure.
Figure 13 Median EDF Term Structure as of April 2009
Figure 14 Median EDF Term Structure as of May 2015
0.00%
0.50%
1.00%
1.50%
2.00%
2.50%
1 year 2 years 3 years 4 years 5 years 6 years 7 years 8 years 9 years 10 years
EDF9 - U.S. Non-FinacialEDF8 - U.S. Non-FinacialEDF9 - U.S. FinacialEDF8 - U.S. Finacial
0.00%
0.20%
0.40%
0.60%
0.80%
1.00%
1.20%
1.40%
1.60%
1.80%
1 year 2 years 3 years 4 years 5 years 6 years 7 years 8 years 9 years 10 years
EDF9 - U.S. Non-FinacialEDF8 - U.S. Non-FinacialEDF9 - U.S. FinacialEDF8 - U.S. Finacial
19 JUNE 2017 IMPACT OF USING EDF9 ON CREDIT PORTFOLIO ANALYSIS

Appendix C Test Portfolio used for Migration Risk Comparison between EDF7 and EDF9 The test portfolio used for comparing the migration risk between EDF7 and EDF9 is constructed using U.S. public-firm obligor data, representing all U.S. industries. The portfolio consists of two (bullet) term loans per obligor, with commitment amounts proportional to the obligor’s current and long-term liabilities and remaining maturities of two and five years, respectively.
There are 8,142 instruments (4,071 counterparties), and the total notional is $23 billion. Each obligor is assigned a PD and an LGD from the Moody’s EDF9 and LossCalc 3.0 models, respectively. For RSQ and counter-industry weights, we use data from the Moody’s Analytics GCorr™ 2016 model. The mean and median PD are 1.92% and 0.22%, respectively. The average LGD is about 53%, and the average RSQ is 24%. Figure 15 presents the distribution of rating, RSQ, and sector in the test portfolio. Note, Rating 2 corresponds to the lowest credit quality and Rating 11 the highest credit quality.
Figure 15 Distribution of Rating, RSQ, and Sector in the Test Portfolio.
20 JUNE 2017 IMPACT OF USING EDF9 ON CREDIT PORTFOLIO ANALYSIS

21 JUNE 2017 IMPACT OF USING EDF9 ON CREDIT PORTFOLIO ANALYSIS

References
Dwyer, D. and I. Korablev, “Moody’s KMV LossCalc™ V3.0.” Moody’s Analytics White Paper, 2009.
Huang, J., M. Mitrovic , O. Ozkanoglu, N. Patel, and L. Pospisil, “Understanding GCorr® 2014 Corporate.” Moody’s Analytics White Paper, 2015.
Levy, A., “An Overview of Modeling Credit Portfolios.” Moody’s Analytics White Paper, 2008.
Nazeran, P. and D. Dwyer, “Credit Risk Modeling of Public Firms: EDF9.” Moody’s Analytics White Paper, 2015.
22 JUNE 2017 IMPACT OF USING EDF9 ON CREDIT PORTFOLIO ANALYSIS

© Copyright 2017 Moody’s Corporation, Moody’s Investors Service, Inc., Moody’s Analytics, Inc. and/or their licensors and affiliates (collectively, “MOODY’S”). All rights reserved.
CREDIT RATINGS ISSUED BY MOODY'S INVESTORS SERVICE, INC. (“MIS”) AND ITS AFFILIATES ARE MOODY’S CURRENT OPINIONS OF THE RELATIVE FUTURE CREDIT RISK OF ENTITIES, CREDIT COMMITMENTS, OR DEBT OR DEBT-LIKE SECURITIES, AND CREDIT RATINGS AND RESEARCH PUBLICATIONS PUBLISHED BY MOODY’S (“MOODY’S PUBLICATIONS”) MAY INCLUDE MOODY’S CURRENT OPINIONS OF THE RELATIVE FUTURE CREDIT RISK OF ENTITIES, CREDIT COMMITMENTS, OR DEBT OR DEBT-LIKE SECURITIES. MOODY’S DEFINES CREDIT RISK AS THE RISK THAT AN ENTITY MAY NOT MEET ITS CONTRACTUAL, FINANCIAL OBLIGATIONS AS THEY COME DUE AND ANY ESTIMATED FINANCIAL LOSS IN THE EVENT OF DEFAULT. CREDIT RATINGS DO NOT ADDRESS ANY OTHER RISK, INCLUDING BUT NOT LIMITED TO: LIQUIDITY RISK, MARKET VALUE RISK, OR PRICE VOLATILITY. CREDIT RATINGS AND MOODY’S OPINIONS INCLUDED IN MOODY’S PUBLICATIONS ARE NOT STATEMENTS OF CURRENT OR HISTORICAL FACT. MOODY’S PUBLICATIONS MAY ALSO INCLUDE QUANTITATIVE MODEL-BASED ESTIMATES OF CREDIT RISK AND RELATED OPINIONS OR COMMENTARY PUBLISHED BY MOODY’S ANALYTICS, INC. CREDIT RATINGS AND MOODY’S PUBLICATIONS DO NOT CONSTITUTE OR PROVIDE INVESTMENT OR FINANCIAL ADVICE, AND CREDIT RATINGS AND MOODY’S PUBLICATIONS ARE NOT AND DO NOT PROVIDE RECOMMENDATIONS TO PURCHASE, SELL, OR HOLD PARTICULAR SECURITIES. NEITHER CREDIT RATINGS NOR MOODY’S PUBLICATIONS COMMENT ON THE SUITABILITY OF AN INVESTMENT FOR ANY PARTICULAR INVESTOR. MOODY’S ISSUES ITS CREDIT RATINGS AND PUBLISHES MOODY’S PUBLICATIONS WITH THE EXPECTATION AND UNDERSTANDING THAT EACH INVESTOR WILL, WITH DUE CARE, MAKE ITS OWN STUDY AND EVALUATION OF EACH SECURITY THAT IS UNDER CONSIDERATION FOR PURCHASE, HOLDING, OR SALE.
MOODY’S CREDIT RATINGS AND MOODY’S PUBLICATIONS ARE NOT INTENDED FOR USE BY RETAIL INVESTORS AND IT WOULD BE RECKLESS FOR RETAIL INVESTORS TO CONSIDER MOODY’S CREDIT RATINGS OR MOODY’S PUBLICATIONS IN MAKING ANY INVESTMENT DECISION. IF IN DOUBT YOU SHOULD CONTACT YOUR FINANCIAL OR OTHER PROFESSIONAL ADVISER.
ALL INFORMATION CONTAINED HEREIN IS PROTECTED BY LAW, INCLUDING BUT NOT LIMITED TO, COPYRIGHT LAW, AND NONE OF SUCH INFORMATION MAY BE COPIED OR OTHERWISE REPRODUCED, REPACKAGED, FURTHER TRANSMITTED, TRANSFERRED, DISSEMINATED, REDISTRIBUTED OR RESOLD, OR STORED FOR SUBSEQUENT USE FOR ANY SUCH PURPOSE, IN WHOLE OR IN PART, IN ANY FORM OR MANNER OR BY ANY MEANS WHATSOEVER, BY ANY PERSON WITHOUT MOODY’S PRIOR WRITTEN CONSENT.
All information contained herein is obtained by MOODY’S from sources believed by it to be accurate and reliable. Because of the possibility of human or mechanical error as well as other factors, however, all information contained herein is provided “AS IS” without warranty of any kind. MOODY'S adopts all necessary measures so that the information it uses in assigning a credit rating is of sufficient quality and from sources MOODY'S considers to be reliable including, when appropriate, independent third-party sources. However, MOODY’S is not an auditor and cannot in every instance independently verify or validate information received in the rating process or in preparing the Moody’s Publications.
To the extent permitted by law, MOODY’S and its directors, officers, employees, agents, representatives, licensors and suppliers disclaim liability to any person or entity for any indirect, special, consequential, or incidental losses or damages whatsoever arising from or in connection with the information contained herein or the use of or inability to use any such information, even if MOODY’S or any of its directors, officers, employees, agents, representatives, licensors or suppliers is advised in advance of the possibility of such losses or damages, including but not limited to: (a) any loss of present or prospective profits or (b) any loss or damage arising where the relevant financial instrument is not the subject of a particular credit rating assigned by MOODY’S.
To the extent permitted by law, MOODY’S and its directors, officers, employees, agents, representatives, licensors and suppliers disclaim liability for any direct or compensatory losses or damages caused to any person or entity, including but not limited to by any negligence (but excluding fraud, willful misconduct or any other type of liability that, for the avoidance of doubt, by law cannot be excluded) on the part of, or any contingency within or beyond the control of, MOODY’S or any of its directors, officers, employees, agents, representatives, licensors or suppliers, arising from or in connection with the information contained herein or the use of or inability to use any such information.
NO WARRANTY, EXPRESS OR IMPLIED, AS TO THE ACCURACY, TIMELINESS, COMPLETENESS, MERCHANTABILITY OR FITNESS FOR ANY PARTICULAR PURPOSE OF ANY SUCH RATING OR OTHER OPINION OR INFORMATION IS GIVEN OR MADE BY MOODY’S IN ANY FORM OR MANNER WHATSOEVER.
MIS, a wholly-owned credit rating agency subsidiary of Moody’s Corporation (“MCO”), hereby discloses that most issuers of debt securities (including corporate and municipal bonds, debentures, notes and commercial paper) and preferred stock rated by MIS have, prior to assignment of any rating, agreed to pay to MIS for appraisal and rating services rendered by it fees ranging from $1,500 to approximately $2,500,000. MCO and MIS also maintain policies and procedures to address the independence of MIS’s ratings and rating processes. Information regarding certain affiliations that may exist between directors of MCO and rated entities, and between entities who hold ratings from MIS and have also publicly reported to the SEC an ownership interest in MCO of more than 5%, is posted annually at www.moodys.com under the heading “Shareholder Relations — Corporate Governance — Director and Shareholder Affiliation Policy.”
For Australia only: Any publication into Australia of this document is pursuant to the Australian Financial Services License of MOODY’S affiliate, Moody’s Investors Service Pty Limited ABN 61 003 399 657AFSL 336969 and/or Moody’s Analytics Australia Pty Ltd ABN 94 105 136 972 AFSL 383569 (as applicable). This document is intended to be provided only to “wholesale clients” within the meaning of section 761G of the Corporations Act 2001. By continuing to access this document from within Australia, you represent to MOODY’S that you are, or are accessing the document as a representative of, a “wholesale client” and that neither you nor the entity you represent will directly or indirectly disseminate this document or its contents to “retail clients” within the meaning of section 761G of the Corporations Act 2001. MOODY’S credit rating is an opinion as to the creditworthiness of a debt obligation of the issuer, not on the equity securities of the issuer or any form of security that is available to retail clients. It would be dangerous for “retail clients” to make any investment decision based on MOODY’S credit rating. If in doubt you should contact your financial or other professional adviser.
23 JUNE 2017 IMPACT OF USING EDF9 ON CREDIT PORTFOLIO ANALYSIS