Impact of Trade Liberalisation on the Indian Electronics ...
46
Transcript of Impact of Trade Liberalisation on the Indian Electronics ...


IMPACT OF TRADE LIBERALISATION
ON THE INDIAN ELECTRONICS INDUSTRY:
Some Aspects of the Industrial Policy Dynamics
of Global Value Chain Engagement
Smitha Francis
Institute for Studies in Industrial Development
4, Institutional Area, Vasant Kunj Phase II, New Delhi ‐ 110 070
Phone: +91 11 2676 4600 / 2689 1111; Fax: +91 11 2612 2448
E‐mail: [email protected]; Website: http://isid.org.in
July 2016
ISID
Working Paper
192

© Institute for Studies in Industrial Development, 2016
ISID Working Papers are meant to disseminate the tentative results and findings obtained from the ongoing research activities at the Institute and to attract comments and suggestions which may kindly be addressed to the author(s).
CONTENTS
Abstract 1
1. Introduction 2
1.1 Statement of the Problem and Methodology 4
2. Industrial Policy and Trade Liberalisation in the Electronics Industry 6
2.1 Industrial Policy Dynamics in the Electronics Industry: A Macro View 6
2.2 Trade Liberalisation under the ITA‐1 and FTAs 9
3. Changing Nature of Electronics Industry Trade Flows 15
4. Inter‐ and Intra‐Industry Trade Patterns in the Electronics Industry 25
5. Conclusion 33
References 38
List of Figure(s)
Figure 1 India’s average MFN tariff on ITA‐1 products and
the number of HS 6 digit tariff lines 10
Figure 2 Trends in India’s Overall Electronics Trade, 1996–2014 16
Figure 3 Share of Electronics Trade in India’s Total Manufactured
Goods Trade, 1996‐2014 16
List of Table(s)
Table 1 Distribution of Non‐ITA‐1 Electronics Products Liberalised
under the India‐ASEAN FTA 11
Table 2 Major Non‐ITA‐1 Electronic Products that became Tariff‐free in 2013
under the India‐ASEAN FTA 11
Table 3 Distribution of Non‐ITA‐1 Electronic Products Liberalised
under the India‐South Korea CEPA 12
Table 4 Distribution of Non‐ITA‐1 Electronic Products Liberalised
under the India‐Japan CEPA 13
Table 5 Indiaʹs Major Electronics Exports, 1996–2014 17
Table 6 Indiaʹs Major Electronics Imports, 1996–2014 19

Table 7 India’s Major Suppliers for Electronics Imports, 1996‐2014 24
Table 8 Change in the Relative Importance of IIT
in Indiaʹs Bilateral Trade in Electronics 27
Table 9 Change in the Relative Importance of Vertical IIT
in India’s Bilateral IIT in Electronics 28
Table 10 Status of India vis‐à‐vis Major Partners in Bilateral VIIT 29
Table 11 Share of VIIT Imports in Total Bilateral VIIT 30
Table 12 Major Products Involved in India’s Bilateral VIIT with China, 2014 31
Annexe 1 Concordance Table for Electronics Products across ISIC
Revised Classifications 36

Impact of Trade Liberalisation
on the Indian Electronics Industry:
Some Aspects of the Industrial Policy Dynamics
of Global Value Chain Engagement*
Smitha Francis*
[Abstract: This paper examines the interplay between trade liberalisation and industrial policies
and its implications for industrial restructuring in order to understand how trade liberalisation has
influenced Indian electronics firms’ engagement in global value chains. The domestic electronics
industry’s pre‐liberalisation development trajectory shows that there were inadequate government‐
directed efforts for creating technological capabilities and scale in domestic firms, and for
developing synergies at the industry level. As a result, the industry’s premature exposure to severe
external competitive pressures with rapid trade liberalisation of the computer and
telecommunications industries under the WTO’s ITA‐1 from 1997 became a major obstacle in its
subsequent development. A significant part of the learning process required for technological catch‐
up and potential for systemic synergies was further lost because direct imports took over and
domestic manufacturing was avoided in the case of a large number of products in the absence of
strategic industrial policy support. Moreover, under successive governments’ liberal FDI regimes,
there were nil or ineffective industrial policy measures in place linking foreign‐invested firms and
the domestic supplier base to ensure positive spill‐over effects. These policy failures to correct for
market failures were compounded by India’s FTAs with East and Southeast Asian countries, with
the latter extending tariff liberalisation to consumer electronics and professional, medical, and
scientific instruments. The deep and broad trade liberalisation, the liberal FDI regime, and the
absence of vertical industrial policies have together removed tariff‐hopping and other policy‐driven
incentives for MNCs and domestic firms to undertake local production. The consequences are
revealed in the continuously growing electronics imports and in the particular nature of India’s
two‐way trade in electronics products. In the case of all the major trade partners, analysis of
India’s bilateral intra‐industry trade (IIT) undisputedly established that the rise in intra‐industry
trade involving both horizontal and vertical differentiation has only contributed to India’s rising
trade deficit with each of them. The paper argues that along with vertical industrial policies for
upgrading firm‐ and industry‐level productivity and improved infrastructure, a calibrated
* This paper originated from the project titled “Understanding India’s Industrial Development
Puzzle through the Interactions between Industrial Policy and Trade Liberalisation: A case study
of the Electronics Industry”, which was undertaken while the author was a Consultant at ISID.
The author acknowledges with gratitude the useful comments received from Chalapati Rao as
the reviewer and those from Dinesh Abrol, M.R. Murthy, and others at the seminar at ISID. The
usual caveat applies. * Smitha Francis, Consultant

2
approach towards trade and FDI policies such that they do not negate incentives for value adding
local production is an imperative for enabling domestic firms to engage in global value chains in a
sustainable manner.]
JEL Classification: F14; F15; L50; L63; O25
Keywords: Indian electronics industry, intra‐industry trade, free trade agreements, sectoral
agreements, ITA‐1, WTO‐plus trade liberalisation, industrial policy, global value chains
1. Introduction
With India’s industrial production figures on a decline, there has been much discourse on
manufacturing sector revival strategies. Despite the fact that the capabilities which India
had accumulated on the eve of the 1990s’ reforms are a legacy of her domestically‐
oriented industrial policies in the post‐independence decades and that these have played
a critical role in her development trajectory, it is common to relate the faster growth rates
in Indian exports and the export success of a few sectors solely to the post‐1991 import
liberalisation and export promotion policies (Francis and Kallummal 2013).
Misinterpreting the causal interactions between trade liberalisation, industrial policy, and
indigenous capability development can lead to wrong inferences and result in
inappropriate policy formulations. Towards this, it is important to examine the
interactions between trade liberalisation and other industrial policies and the attendant
restructuring dynamics in particular industries in a systematic manner. This is critical in
strategic sectors like electronics, chemicals, transport equipment, pharmaceuticals,
machinery, etc. as well as in labour‐intensive industries. The present study attempts to
examine the interplay between trade liberalisation and industrial policy dynamics and its
implications for domestic manufacturing sector development trajectory by focussing on
the electronics industry.
The electronics industry is strategic for any country because of the wide applicability of
these products and technologies across sectors, and their economy‐wide productivity‐
enhancing impact. At present, while India is considered a “global super power” in the IT
services sector, the electronics industry is one of the top contributors to Indiaʹs
merchandise imports. After nearly two decades of trade liberalisation, the gap between
country’s electronics demand and domestic production capacity has only been widening.
Further, according to the National Electronics Policy 2012, the value addition in
domestically produced electronics products ranged between only 5 to 10 per cent in most
cases.
Several parallel processes of trade and investment liberalisation have impacted the
electronics industry in India. One of these is the Information Technology Agreement
(ITA‐1) signed by India in 1996, which is a plurilateral agreement of the WTO. ITA‐1 was
designed to achieve elimination of all entry barriers on information technology products
in six product groups, namely, computers, telecom equipment, semiconductors,
semiconductor manufacturing and testing equipment, software, and scientific

3
instruments. India also undertook trade liberalisation under its comprehensive Free
Trade Agreements (FTAs) with East and Southeast economies such as Singapore,
ASEAN, Japan, South Korea, and Malaysia. It must be remembered that this has occurred
in a context wherein India has been continuously liberalising its foreign direct investment
(FDI) policies since 1991.
Trade liberalisation through FTAs has been argued to enable rapid and “efficient
industrial restructuring”1 by allowing countries to participate in global production
networks and global value chains (GVCs). As well recognised, production sharing
between countries by multinational corporations (MNCs) involved in regional or global
production networks typically leads to an expansion in two‐way trade (simultaneous
increase in exports and imports) across those countries, in particular, intra‐industry trade
in intermediate goods (Athukorala (2003), Fukao, Ishido and Ito (2003), and Haddad
(2007)). Analysis based on the Harmonised System (HS) categorisation of trade flows at
the 2‐digit level showed that there has been a significant increase in two‐way trade in
India’s global trade in electrical machinery and non‐electrical machinery, apart from
others such as petroleum & petroleum products, gems & jewellery, organic chemicals,
articles of iron and steel, automobiles, etc. In addition to these sectors, India has
witnessed increased two‐way trade with Indonesia, Malaysia, Thailand, and Singapore in
the category of optical, photo, technical, and medical, apparatus also (Francis 2011). It
should be noted that the HS chapters of electrical machinery, non‐electrical machinery,
and optical, photo, technical, and medical apparatus together constitute most of the
electronics products.
The increase in India’s two‐way trade with these Southeast economies has been linked to
the industrial restructuring being carried out by MNCs in the region, in response to the
WTO‐plus trade liberalisation that India began undertaking with these countries under
the Early Harvest Program of the Thai‐India FTA (2004) and the Comprehensive
Economic Cooperation Agreement (CECA) with Singapore in 2005 (Kumar 2007 and
Francis 2009). Francis and Kallummal (2013) argued further that the significant increase
observed in India’s two‐way trade in intermediate products with these countries would
point towards India’s growing involvement with GVCs centred on ASEAN and China. It
was also argued that the emerging MNC‐driven industrial restructuring involving India
and the East Asian economies was likely to intensify in particular industries, including
the electrical and non‐electrical machinery industries, following the entry into force of the
overlapping FTAs with ASEAN, South Korea, Japan, and Malaysia (Francis 2015b).
1 India’s participation in FTAs, especially with the East and Southeast Asian economies, had been
argued to offer mutually beneficial linkages through dynamic industrial restructuring within the
region leading to greater competition and improved efficiency; as well as gains from greater
inter‐ and intra‐industry specialisation, economies of scale, and learning‐by‐doing (Francis and
Kallummal 2013 and Francis 2015b).

4
Apart from foreign MNCs, however, industry‐level restructuring in response to trade
liberalisation clearly involves consequent changes in domestic firms’ business strategies
too. As a result, production restructuring undertaken by the latter also contributes to
changes in the industry’s trade pattern. That is, rapid and deep trade liberalisation
through overlapping FTAs has wider ramifications for domestic industrial development
than currently acknowledged (Francis and Kallummal 2013). This case study of the
electronics industry is an attempt to examine these issues empirically.
1.1 Statement of the Problem and Methodology
The increase in India’s two‐way trade with Southeast Asian economies seems to offer
preliminary evidence of India’s integration into electronics industry value chains.
However, whether India obtains broad‐based productivity benefits from the
opportunities for MNC‐driven industrial restructuring arising from trade liberalisation
(such as greater inter‐ and intra‐industry specialisation, economies of scale, and learning‐
by‐doing) depends on India’s position in the value chain for particular products (Francis
and Kallummal 2013). This is because the division of labour in a specific product is the
fundamental determinant of how the value added and profits are distributed among
different countries involved in its value chain. Above all other factors, division of labour
in GVCs, particularly under tariff‐free trade, is based on countries’ relative technological
capabilities.2 That is, the nature of participation of a country in an industry’s GVCs
(under tariff‐free trade) can be a reasonable proxy for the level of national technological
capabilities in that particular industry. To the extent that India is involved in production networks in the electronics industry, it is expected to be reflected in high shares of intra‐
industry trade (IIT) in intermediate products.
However, the rapid trade liberalisation under the ITA‐1 and the subsequent WTO‐plus
liberalisation under India’s comprehensive FTAs in the region have significantly changed
the incentives facing producers in the Indian electronics industry. At one level, in the
context of a liberal investment policy regime that had nil or ineffective industrial policy
measures in place to develop competitive indigenous production and technological
capability build‐up,3 deep trade liberalisation under overlapping FTAs not only enlarges
the market, but also removes the tariff‐hopping and other policy‐driven incentives for
2 Also see the empirical evidence from UNCTAD (2012 and 2016). 3 Here the reference is to vertical industrial policies which seek to influence the pattern of national
industrial development by policy interventions that guide and promote investment domestically
towards new activities and sectors with higher productivity, better paid jobs and greater
technological potential (i.e., increasing returns activities). Policies aimed at promoting backward
and forward linkages between foreign‐invested enterprises and domestic supplier firms in
particular sectors also belong to this category. In contrast, horizontal industrial policies seek to
improve infrastructure, business entry and exit regulations, taxation and customs
administration, investment promotion and facilitation, etc., while carrying out hands‐off trade
and financial liberalisation to allow greater play of market forces.
5
MNCs to maintain parallel operations in India along with other countries for the same
product lines. This leads them to rationalise their operations to exploit “locational
advantages”. That is, MNCs can meet the demand in specific regional or even global
markets in particular products through affiliates in particular countries and choose to
close similar production facilities in others (Kumar 2007, Francis and Kallummal 2013,
and Francis 2015b). At another level, deep and broad trade liberalisation‐ in the absence
of industrial policies to build up national technological capabilities and a competitive
domestic production base‐ , also increases domestic firms’ incentives for importing raw
materials and intermediate products from FTA partners to carry out local assembly of
final products, or may completely remove their incentive to undertake any local
production/assembly and lead to increased trading in electronics.
Thus all two‐way trade observed at an aggregated level may not be a reflection of IIT at
the product level. If India has adequate production capabilities in several product lines, it
would help integrate India into GVCs, which would get reflected in an increase in IIT at
sufficiently dis‐aggregated product levels. If that is not the case, trade liberalisation under the ITA‐1 and FTAs would have only led to increased import dependence, and
therefore, an increase in inter‐industry trade when we consider data at the product level.
It would appear that the latter would be a clear‐cut outcome if there was no attempt on
the government’s part to develop domestic technological and manufacturing capabilities,
and to support indigenisation of production by foreign‐invested companies prior to and
along with tariff liberalisation. Trade flow analysis at a sufficiently disaggregated level is
therefore needed to examine the nature of the observed increase in India’s electronics
two‐way trade. This is crucial to understanding the development trajectory and the level
of national sufficiency in this strategic industry.
While the traditional Grubel‐Lloyd (GL) index can be applied for any level of
aggregation, it does not capture the nature of specialisation involved in intra‐industry
trade (IIT) as distinguished between horizontal and vertical product differentiation. IIT
itself can be: IIT in horizontally differentiated (i.e. similar priced) products and IIT in
vertically differentiated products (i.e. differing by quality, and hence, price) (Fontagné et
al. 1996). VIIT is characterised by differences in created capabilities (rather than static
factor endowments), which play the critical role in the division of labour in GVCs. An
increase in VIIT in bilateral trade flows at a product level may therefore be considered as
reflecting increased participation in GVCs (more later).
Towards examining these issues, this study involves analysis of the structural changes in
the pattern of trade flows in the electronics industry since the 1990s and analysing the
industrial policy dynamics that has impacted this restructuring. In particular, trade
liberalisation under the ITA‐1 and the recent FTAs are examined. The analysis will seek
to understand the extent to which increased two‐way trade in the electronics industry
reflects increase in vertical IIT due to India’s involvement in electronics industry value
chains and explore India’s position along the value chain.

6
Given our focus on trade flows, the study involved identifying and collating trade data
that is available in the HS classification, which is concordant with the International
Standard Industrial Classification (ISIC). This study uses trade flow data at the HS 6‐digit
level available from the WITS website. Data based on the 1996 HS nomenclature is used,
for which the time series starts with 1996 data, the year before ITA‐1 entered into force.
Under the HS 1996 nomenclature, there are a total of 5113 items at the 6‐digit level.
Starting from the ISIC Rev.1 categories of non‐electrical machinery and electrical
machinery, we used concordance tables between various ISIC revised classifications to
arrive at ISIC Rev.3 categories (at the 4‐digit level) representing electronics sub‐sectors.
Subsequently, we used concordance between ISIC Rev. 3 and HS 1996 to arrive at a list of
HS products belonging to the electronics industry. A definition guide to the electronics
industry from the World Electronics Yearbook that gives HS 4‐digit level product groups
of electronics industry sub‐sectors (that are concordant with SITC Revision 3) was also
used while finalising the list of HS 1996 products chosen as belonging to the electronics
industry. The final comprehensive list of 372 products at the HS 6‐digit level also
included some products like unrecorded media (see Annexe 1). The remainder of this paper is organised as follows. Following a brief discussion on the
post‐independent evolution of industrial policy in the electronics industry, Section 2
analyses the nature of trade liberalisation under the ITA‐1 and FTAs. Section 3 carries out
an in depth analysis of electronics industry trade flows. Section 4 enquires into the nature
of the observed two‐way trade for understanding the development of IIT involving
India’s major trading partners. This involves the decomposition of India’s bilateral
electronics industry trade flows into inter‐industry trade, horizontal IIT, and vertical IIT
and estimating them using the methodology described therein. Section 5 makes
concluding observations.
2. Industrial Policy and Trade Liberalisation in the Electronics Industry
2.1 Industrial Policy Dynamics in the Electronics Industry: A macro view
India had stressed upon indigenous technological capability development early on in its
independent history. By the late 1960s, the concept of IT as an industry had begun to take
root as a direct outcome of government‐supported programmes and policies (Kallummal,
2012). On the electronics hardware front, while the Indian government had pursued a
highly restrictive policy framework for electronics industry in favour of self‐reliance in
the post‐independence period, there was limited opening up in the early 1980s, which
involved a series of reforms for ensuring a greater play of market forms. The industry
experienced significant growth in the 1980s as compared to the late 1970s (Joseph 1989
and Majumdar 2010).
One of the industrial policy measures that pushed Indian IT software firms to strive for
competitiveness was the fact that these firms were required to export software in the

7
early days of the industry, while the government provided most of the infrastructural
support. On the other side, the high tariffs for the hardware sector meant that there was
some domestic production of hardware products including PCs, peripherals, and
components. This was aided by the general reduction in duty on components and liberal
import of capital goods for component manufacture under the Components Policy of
1981. Meanwhile, all segments of the domestic PC industry grew under high tariffs and
quantitative restrictions.
However, the nature of incentives for software exports and the absence of vertical
industrial policies led to a disconnect between subsequent boom in software export
growth and the domestic IT hardware and telecommunication production trajectories.
This is despite the fact that the Telecommunication Policy of 1984 had opened up telecom
equipment manufacture to the private sector and the Computer Policy of the same year
had allowed all Indian companies to enter all segments of the computer industry without
any capacity restrictions. In fact, the mid‐1980s saw the highest number of industrial
licences and letters of intent in electrical equipment and telecommunication (Majumdar
2010, p. 73). The 1984 Computer Policy had also emphasised that planning for software
development must be integrally connected with the plan for hardware development and
system engineering. But under the Computer Software Policy of 1986, import of
computer systems on a custom duty free basis was allowed for 100 per cent software
export, without reference to indigenous angle clearance.4 This is a clear reflection of the
lack of coherence in the industrial policies of the time. Similar policies were continued
under the Software Technology Parks of India (STPI) Scheme launched in 1990. Given
that the governments did not seek to link the increase in demand for computers that
originated from the growth of software exports to domestic hardware producers through
vertical industrial policies, this meant that the local IT hardware and related component
producers did not benefit from the growth in software exports either to realise the
economies of scale necessary to make them viable, or by facing the competitive pressure
to build up technological capabilities along with advancements in the ICT sector. There
was inadequate policy focus to push existing domestic producers in computers,
telecommunication equipment, or parts and components to improve their productivity.
By the 1990s, the computer sector had come to be characterised by three segments:
premium producers like Wipro who controlled the upper‐end market; large volume
producers like Sterling Computers and HCL who survived on lower per unit margins;
and finally, a large number of assemblers catering to the lower‐end market
(Chandrasekhar 2005, 70). But the disconnect between the growth of the software and
hardware segments of the Indian information and communication technology (ICT)
sector had become entrenched with the initiation of export‐oriented economic reforms
from the early 1990s. This presents a significant contrast to the electronics industry
development trajectories in countries such as Singapore, South Korea, or Taiwan, where
4 See Table 1 on page 5 in Kumar and Joseph (2004), and also pp. 4–6.
8
the governments adopted various combinations of vertical industrial policies for
production upgradation and skill development in selected industry segments within an
overall industrial development strategy, which involved performance‐linked
incentivisation to induce productivity growth while pursuing simultaneous trade
strategies of import substitution and export promotion.5
It appears that the Indian state, which was able to identify the developmental
opportunities in the software sector way back in the sixties and seventies, was myopic
when it came to the electronics manufacturing sector. This may be attributed to three
factors. Firstly, the government failed to build on the synergies that arise from the
integral interconnectedness of the software sector and the ICT hardware sectors through
coherent and coordinated industrial policies. Secondly, there was a misreading of the
software export success sector. The proponents of economic reforms in 1991 attributed
the growing export potential of the software sector to its “comparative advantage”, while
paradoxically, the export success that India has had in software exports was based on the
“acquired comparative advantage” developed through explicit and implicit public policy
support consistently since the 1950s, along with a strategic alliance between the public
and the private sectors.6 Thirdly, from the early 1990s onwards, partly due to BoP
concerns and partly owing to the increased negotiation strength of software firms arising
from their export success, the export interests of software firms increasingly came to
dominate the policymaking framework, and contributed to relegating any erstwhile
policy intention of developing national capabilities in the hardware sector to the
backburner (Kallummal and Francis, 2012).
In the telecom equipment sector, even though the country had built up considerable
capability in the design and manufacture of digital switching equipment domestically –
led by public sector research and manufacturing firms and aided by the public
procurement policy of the government – the lack of “a credible innovation policy and
proper technology forecasting” meant that the domestic telecom research sector did not
create enough capability in mobile switch technologies which began gaining prominence
in the 1990s (Mani 2005, p. 315). After the government had opened up the telecom
equipment sector to 100 per cent FDI in 1991, five leading MNCs had set up
manufacturing facilities in India in the early 1990s – Alcatel, Lucent Technologies,
Ericsson, Siemens, and Fujitsu7 – owing to the public procurement policy of the then
main domestic consumer, the Department of Telecom. Consequently, when the increase
in domestic demand for telecom equipment following the de‐licensing of telecom
services in 1999 came to be driven by growth in the cellular mobile and internet services
segments, the shift away from fixed switches benefited these global players, all of whom
have been involved in assembly (Mani 2005, pp. 287–315). As of now, the Indian telecom
5 See detailed discussions in Lall (1996), Wade (1990), Amsden (2001 and 2006), etc. 6 See Kallummal (2012), Saraswati (2013), Mathur (2007), Saith and Vijayabaskar (2005), and
Kumar and Joseph (2004). 7 Some of these were joint ventures. See Mani (2005).
9
manufacturing sector is dominated by Alcatel and Ericsson, and more recently, by
Huawei and ZTE (Ernst 2014, p. 3).
In the case of the consumer electronics industry, although internal liberalisation
(relaxation of licensing requirements) took place in 1996 and import liberalisation
occurred only later under the FTAs, the lack of government policies pursuing indigenous
capability build‐up meant that domestic producers did not invest in scale or new
technologies during the period of protection. Thus they could not adjust to the increased
competition from foreign investors who had set up local production. Consequently, this
segment has also been dominated by MNCs such as Sony, LG, Samsung, etc.
Similarly, the lack of a strategic policy thrust for developing strong and varied
technological capabilities has meant that while India currently has a strong integrated
circuit (IC) design base located within MNCs, Indian chip design engineers lack the
breadth and depth in capabilities required for semiconductor fabrication, component
manufacturing, as well as in system design and systems manufacturing (Ernst 2014, p. 24).
2.2 Trade Liberalisation under the ITA‐1 and FTAs
Given the incoherence in industrial policy approach cemented by an understanding of
market‐led industrialisation that gives credence only to passive industrial policies,
India’s decision to join the ITA‐1 in 1996 was driven by the government’s belief that
lowering duties on a range of ICT products under the ITA‐1 would boost the competitive
advantage of India’s software exports. The ITA‐1 was designed to establish tariff‐free
trade in a total of 165 products belonging to computers, telecom equipment,
semiconductors, semiconductor manufacturing and testing equipment, software and
scientific instruments.
Under the mandate of the ITA‐1, the participating countries had agreed to eliminate all
tariffs as well as other duties and charges on these products in four equal stages in 1997,
1998, 1999 and 2000. But under the Special and Differential Treatment (S&DT) principles,
the developing country signatories of ITA‐1 – Costa Rica, Indonesia, India, South Korea,
Malaysia, Chinese Taipei, and Thailand – had flexibility in cutting their tariffs to zero by
2005.
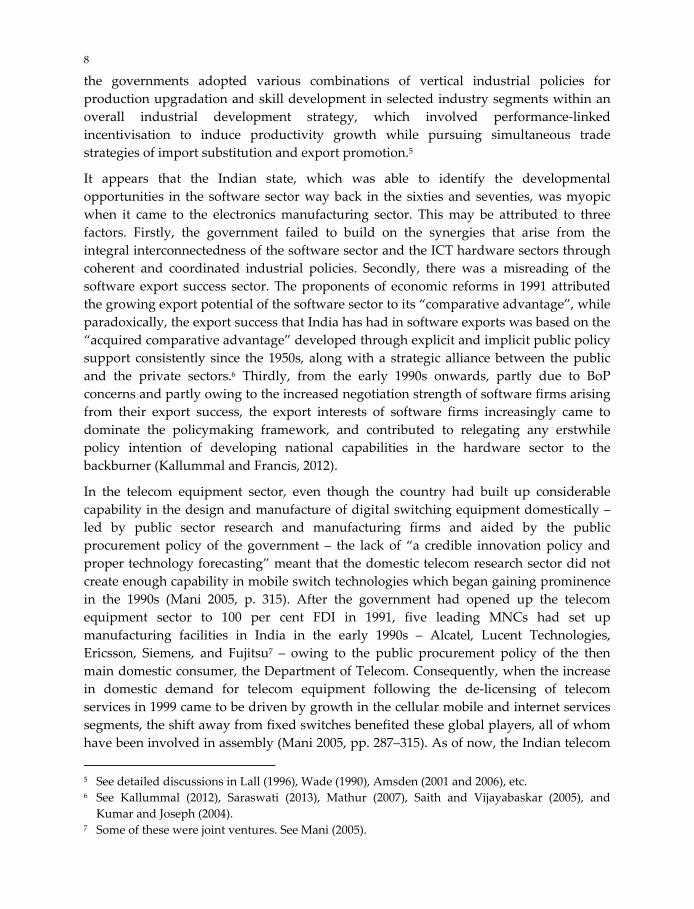
India’s 1996 average base duty of 66.4 per cent on the 165 products dropped to 37.8 per
cent in March 1997. The average tariff continued to drop at regular intervals to 12 per
cent in 2000 and further to about 10 per cent in 2004, and was completely eliminated by
2005 (Kallummal, 2012). In fact, the narrow policy focus on IT software export promotion
meant that India stood out among developing countries in average applied tariff
reduction as well as in terms of the number of tariff lines that were brought under
concessions.8
8 India offered concessions on 66 per cent of its pre‐ITA‐1 tariff rates (Ernst, 2014; p. 19). This was
far greater than the concessions of even a country like Thailand (30.9 per cent), which was well

10
Figure 1: India’s average MFN tariff on ITA‐1 products and the number of HS 6 digit tariff lines
Source: Kallummal (2012)
However, as shown in Majumdar (2010), tariff liberalisation and increase in foreign
investments from the early 1990s or other policies such as decrease in industrial licensing
and reduction in excise duties, did not result in greater competition and improved
productivity in the electronics hardware industry. This study analysed total factor
productivity growth (TFPG) for organised sector electronics firms for two periods 1993–
98 and 1999–2004. As compared to the first period, all the four sub‐sectors, computer
hardware, consumer electronics, telecommunication, and components, had witnessed a
significant net decline in TFPG in the second period after external liberalisation was
intensified from 1997 onwards under the ITA‐1. The poor productivity growth of
electronics firms despite liberalisation was explained by the fact that as competition
increased due to liberalisation, R&D per sales witnessed a sharp decline for firms in the
industry. R&D expenditure as a percentage of capital imports also decreased
substantially for the computer hardware and consumer electronics sub‐sectors
(Majumdar 2010, p. 76). This clearly reflected the shift in firms’ preference to undertake
investments to assimilate imported technology rather than develop in‐house technology
through R&D, in the absence of any industrial policy emphasis on promoting indigenous
technological development.
Thus when protection was withdrawn, the small computer assemblers were in no
position to use the opportunity afforded by protection to build capabilities of a kind that
would allow them to compete with large international suppliers (Chandrasekhar 2005).
On the other hand, with the government not enforcing any programs of R&D‐based
integrated into electronics production networks and might have stood to gain from the trade
liberalisation.
66.4
37.8
29.0
20.9
11.8
19.9
15.4 14.3
9.7 0.0
0.0
10.0
20.0
30.0
40.0
50.0
60.0
70.0
0
50
100
150
200
250
Base
rate
(1996)
1997 1998 1999 2000 2001 2002 2003 2004 2005
Tariff lines covered (Sec. axis) Average Tariff for 165 ITA‐1 Products

11
competitive production in the premium segment, the premium producers chose to enjoy
the large profit margins, and also did not concentrate on developing indigenous sources
of supply of components and accessories for reducing costs, or on developing innovation
capabilities.9 As a result, many of them moved into trading or other activities. The same
was true of the other sub‐sectors too. For example, in the telecom equipment industry,
printed circuit boards (PCBs) and other components account for around 90 per cent of the
product cost. But currently, with the exception of cable harnesses and packaging, no such
components are produced in India (Ernst 2014, p.2), which has led to higher import
dependence among telecom assemblers. In the absence of productivity growth, only
domestic firms that cater to demand for low end technological products would be able to
survive increased external competition. While this was the state of productivity performance in the Indian electronics industry by
the mid‐2000s, the impact of ITA‐1 was exacerbated by the equally non‐strategic tariff
liberalisation carried out by India under its FTAs with ASEAN, Japan, and South Korea –
countries that are already deeply integrated into global electronics value chains.
The India‐ASEAN FTA came into force in 2010. Out of the total 216 non‐ITA‐1 electronics
tariff lines (at the HS 6‐digit level) for which India made tariff liberalisation commitments
to ASEAN, only 11 were kept in the Sensitive Track and two were excluded.10 India made
170 non‐ITA‐1 tariff lines duty free by 2013 (Normal Track‐1) (Table 1). For 96 tariff lines,
this trade liberalisation was drastic as their MFN tariff in the base year 2007 was 10 per
cent, which was reduced to zero over just three years between 2010 and 2013. Another 73
products saw their tariffs reduced from 7.5 per cent to zero in 2013 (Table 2).
Table 1: Distribution of Non‐ITA‐1 Electronics Products Liberalised under the India‐ASEAN FTA
(Number of HS 6‐digit tariff lines)
Base MFN rate in 2007 (Per cent) 0 7.5 10 Total
Excluded List 0 2 0 2
Normal Track‐1 1 73 96 170
Normal Track‐2 0 21 12 33
Sensitive Track 0 6 5 11
Total non‐ITA tariff lines 1 102 113 216
Source: Author’s calculation based on India’s tariff reduction schedule with ASEAN‐5 in India‐
ASEAN FTA
Importantly, another 33 tariff lines became duty free in 2016 (Normal Track‐2). These
include products and parts like loudspeakers and their parts, TV picture tubes of 20”, etc.
9 Chandrasekhar (2005, pp. 71–2). 10 Interestingly, one of these already had an MFN duty of zero in 2007.

12
Table 2: Major Non‐ITA‐1 Electronic Products that became Tariff‐free in 2013 under the India‐
ASEAN FTA
Products with base year (2007) duty of 10 per cent Products with base year (2007) duty of 7.5 per cent
Professional video tape recorders, radio
broadcast receivers, electric air heaters, cooking
devices, personal weighing machines, electrical
signalling/traffic control equipment for railways
and their parts, other electric sound or visual
signalling apparatus and their parts,
photographic/cinematographic equipment like
cameras, projectors, instant print cameras, etc.
and their parts, etc.
Microwave tubes (magnetrons, klystrons etc.),
parts of cathode‐ray tubes, TV camera tubes,
vacuum tubes and other valves, etc.
Radar apparatus, communication jamming
equipment, transformers, photocopy machines,
office‐type offset printing machinery, automatic
circuit breakers, navigational instruments,
range of equipments used in medical, surgical,
dental or veterinary sciences including MRI and
X‐ray machines and their parts, measuring and
checking instruments and their parts, etc.
Number of products = 96 Number of products = 73
Source: Author’s compilation based on India’s tariff reduction schedule with ASEAN‐5 in India‐
ASEAN FTA
It is important to note that while consumer electronics and professional apparatus such
as video cameras, photocopiers, medical equipments, etc. were not included under ITA‐1
tariff liberalisation, several of them got liberalised under the ITA‐1‐plus tariff reduction
schedules under the FTAs.
In the case of India’s CEPA with South Korea, which also came into force in 2010, 8 non‐
ITA‐1 product lines (E0; 2010) that had MFN duty of 12.5 per cent in the base year 2006
came under duty free trade immediately (Table 3). However, in five years, that is, from
January 2014, another 60 tariff lines (E‐5) with MFN duty of 12.5 per cent in 2006 came
under duty free trade (E‐5). A further 277 lines (E‐8) became tariff free from January 2016.
Only products listed under the excluded category (EXC) are totally exempt from tariff
reduction.
Table 3: Distribution of Non‐ITA‐1 Electronic Products Liberalised under the India‐South Korea
CEPA (Number of HS 6‐digit tariff lines)
Base MFN rate in 2007
(Per cent)
E‐0 E‐5 E‐8 EXC RED SEN Total non‐ITA
tariff lines
0 1 0 0 0 0 0 1
12.5 8 60 277 45 21 16 427
Source: Author’s calculation based on India’s tariff reduction schedule with South Korea in India‐
South Korea CEPA
Tariffs for products under the Sensitive list (SEN) have been getting reduced in ten equal
annual stages from 2010 and will get to half their base rates by January 2019. An
important product in this category is TV, imports of which were not liberalised under the
ITA‐1 or the ASEAN FTA. All TV sets (of screen size less than 35 cm up to 105 cm),

13
including LCD TVs (of screen size between 25 cm and 63 cm) had a duty of 12.5 per cent
in 2006.These have been getting reduced since 2010. Meanwhile, LCD TV sets of screen
size below 25 cm became duty free from January 2016 (E‐8).
India’s CEPA with Japan came into force in 2011. Under this, India will bring down the
tariffs on 132 non‐ITA‐1 HS 6 digit lines with 10 per cent base duty to zero in ten equal
reductions (B10) by 2020 (Table 4). Another 206 product lines with base duty of 7.5 per
cent will also become duty free by 2020. 36 non‐ITA‐1 tariff lines denoted with “X” were
excluded from any duty reduction or elimination.
Table 4: Distribution of Non‐ITA‐1 Electronic Products Liberalised under the India‐Japan CEPA
(Number of HS 6‐digit tariff lines)
Base duty (2007 MFN)
(Per cent)
Number of Non‐ITA tariff lines Total non‐ITA tariff
lines A B10 X
5 0 3 0 3
7.5 0 206 0 206
10 0 132 0 132
Total 1 341 36 378
Note: Duties on tariff lines denoted by A were reduced to zero in 2011.
Source: Author’s calculation based on India’s tariff reduction schedule with Japan in India‐Japan
CEPA
It is clear that the margin of preference obtained under these FTAs for imports from
ASEAN, South Korea and Japanese firms were as high as 12.5 and 10 per cent in several
non‐ITA‐1 electronics products. Thus the drastic tariff liberalisation of the computer and
telecommunications industries under the ITA‐1 got broadened by the WTO‐plus
liberalisation carried out by India under its FTAs with ASEAN, South Korea and Japan,
with the latter extending it to several non‐ITA‐1 electronics products, including
consumer electronics and home appliances as well as professional, medical and scientific
instruments and their parts.
It should be noted that the 2001 report of the Planning Commission’s Working Group on
Information Technology for the Formulation of the Tenth Five Year Plan had recognised
the scenario of the IT sector to be grimmer than the other Indian manufacturing sub‐
sectors and had called for a clear comprehensive national policy for hardware
manufacturing industry for making the Indian manufacturing sector globally competitive
(Kallummal, 2012). However, it is clear that despite the realisation by the early 2000s that
output and employment in the domestic electronics industry had been severely affected
adversely by the import surge under the ITA‐1, the governments continued with deep

14
and non‐strategic tariff liberalisation without any attempt to link it with a coherent
industrial policy for the long‐term development of the industry.11
A trade policy that promotes duty‐free imports will clearly reduce incentives for
domestic production, particularly in a scenario of absent or ineffective policy push to
instil productivity growth at the firm and industry levels. This also meant that trade
liberalisation under the FTAs could not help Indian firms to make use of the
opportunities to get involved in the electronics industry GVCs. For instance, while
domestic production of TVs was being carried out through imported intermediate parts
such as picture tubes (despite the relatively high tariffs), there was no attempt during the
period of protection to support localisation of such major parts through innovative
industrial policy measures as has been done in selected industries by China or Brazil.12
Currently, imports of TV picture tubes have become duty‐free from 2016 under the
ASEAN FTA. Simultaneously, imports of the final products, LCD TVs, have also been
made duty free under the South Korean CECA from 2016. This reveals the absence of any
strategic intent for the development of the industry. Further, the very fact that such a
tariff liberalisation schedule by India became known at least from around 2010 would
have definitely influenced the local production decisions of the MNCs which dominate
domestic TV production.
It is relevant to note that attracting FDI for enabling India’s integration into production
networks was an avowed policy objective behind the spree of FTAs with East and South
East Asian countries. However, a comprehensive analysis of what are considered “real
FDI” inflows13 by Rao and Dhar (2016) showed that such inflows into the electronics sub‐
sectors namely, (i) office, accounting and computing machinery, (ii) radio, television &
communication equipment and (iii) medical, precision & optical instruments, watches,
were quite small. Thus neither the ITA‐1 nor the FTAs with ASEAN countries and East
Asian economies helped in attracting substantial inward FDI into the electronics
industry.
Such low levels of inward FDI into India’s electronics industry is in fact related to the
liberal FDI policy regime in place since 1991 and the nature of trade liberalisation since
11 It is notable that India was among the developing country absentees from the ITA‐2 agreement,
which was adopted by a group of WTO member countries on 24 July 2015, committing tariff‐free
trade at the multilateral level in a further 155 electronics tariff lines (based on HS 2007
classification). However, this may have come too late having lost most of India’s trade policy
maneuverability with respect to the electronics industry under the FTAs with the GVC‐linked
economies in East and Southeast Asia. 12 See UNCTAD (2014 and 2016) for the use of WTO‐compatible industrial policy measures by
these and other countries. 13 Rao and Dhar (2016) consider foreign investors as belonging to two broad categories: one, who
merely seek return on their investments and the other perceiving the host country operations as
integral to their global operations. The first category essentially comprises a host of financial
investors. It is the second category, which is considered as real FDI (RFDI).

15
the late 1990s, which meant that large foreign original equipment manufacturers (OEMs)
and electronics manufacturing service providers have had no incentive to invest in local
production in India. As a result, they typically set up only final assembly plants (Ernst
2014, p.8).
The resultant adverse impact of the above discussed tariff liberalisation policies
enveloped within a liberal FDI policy regime gets reflected in the composition of imports
and exports when we analyse changes in electronics industry trade flows in detail.
3. Changing Nature of Electronics Industry Trade Flows
India’s electronics exports constituted 3.2 per cent of India’s total manufactured exports
in 1996.14 After growing at an average annual growth rate of just 3.5 per cent during
1996–2000, they did grow faster from 2001 onwards, at an average of about 22 per cent
and 31 per cent during 2001–05 and 2006–10 respectively. But subsequently, electronics
exports grew at much lower rates (just averaging 2.6 per cent during 2011–14) than
India’s total manufactured exports. As a result, their share in manufactured exports
declined to 2.7 per cent in 2014, which was lower than that in 1996. Clearly, there was no
sustained favourable impact of trade liberalisation on India’s electronics export
performance.
On the other side, the share of electronics imports in India’s total manufactured imports,
which was at about 5 per cent in 1996, increased continuously and went up to nearly 12
per cent in 2003. Average annual import growth rate for electronics, which was already at
about 22 per cent during 1996–2000, went up to about 35 per cent during 2002–05 and
remained strong until 2011.15 Even though growth in electronics imports became weak
after 2011, the share of electronics imports in manufactured imports increased again from
2012 and stood at 9.3 per cent in 2014.
Figure 2 shows the rapid increase in electronics industry trade deficit as a result of the
huge increase in electronics imports relative to exports from the mid‐2000s. The
diverging trends in electronics exports and imports after 2012 – when exports declined in
value and imports began rising again – is captured in Figure 3. It also reveals the loss of
importance of electronics exports among total manufactured exports. We will examine
the composition of electronics exports and imports in order to understand these shifts.
14 In the ensuing analysis, we consider the following major break points in the time series data for
the 19 years covering 1996–2014: (1) 1996 (the year prior to the beginning of tariff reduction
under the ITA‐1); (2) 2001 (the year immediately after the ITA‐1 was implemented by all
developed countries); (3) 2005 (the year by which tariffs were eliminated on all ITA‐1 products
by India and also the year in which the India‐Singapore CECA came into being); (4) 2010 (the
year in which the FTAs with ASEAN and South Korea took effect); and (5) 2014. 15 These averages exclude 2001 and 2008 with negative growth rates due to global slowdown in
those years.

16
Figure 2: Trends in India’s Overall Electronics Trade, 1996–2014
Source: Authorʹs calculations based on WITS COMTRADE data.
Figure 3: Share of Electronics Trade in India’s Total Manufactured Goods Trade, 1996‐2014
Source: Authorʹs calculations based on WITS COMTRADE data. In 1996, the top three major electronics exports were: computer storage units (such as
hard disk drives); parts and accessories of computers; and automatic circuit breakers. The
first two accounted for about 14 per cent each of the total. Other products constituting the
top ten exports were colour TVs, hybrid and monolithic integrated circuits (ICs),
magnetic tape recorders, etc (Table 5). By 2001, computer storage devices had moved out
‐40000
‐30000
‐20000
‐10000
0
10000
20000
30000
40000
50000
1996 1997 1998 1999 2000 2001 2005 2008 2010 2014
Electronics trade balance Total electronics exports
Total electronics imports
1.4
2.2
1.1
2.8
6.9
5.6
0
5000
10000
15000
20000
25000
30000
35000
40000
45000
0.0
1.0
2.0
3.0
4.0
5.0
6.0
7.0
8.0
1996
1997
1998
1999
2000
2001
2002
2003
2004
2005
2006
2007
2008
2009
2010
2011
2012
2013
2014
Total electronics exports (Million USD)
Total electronics imports (Million USD)
Share of electronics exports in total mfg. trade

17
of the top ten list. Parts and accessories of computers became the single largest export
item with 20 per cent share of the total. Other parts of computers had the second largest
share of 5 per cent of the total. X‐ray tubes, magnetic discs and electro‐diagnostic
appliances followed with 3 per cent shares each. Photosensitive semiconductor devices
and light emitting diodes (LEDs) also registered significant exports.
Table 5: Indiaʹs Major Electronics Exports, 1996–2014
SN HS 1996
Product
Code
Product description Liberalisatio
n category
Ranks (Based on percentage share in total
electronics exports in each year)
Share
(Percen
tage)
1996 2001 2006 2010 2014
1 852520 Transmit‐receive apparatus
for radio, telephone, etc.
ITA‐1 63 14 5 1 7.5
2 851790 Parts of line
telephone/telegraph
equipment, nes.
ITA‐1 28 46 18 7 6.6
3 850440 Static converters ITA‐1 54 37 1 4 5.9
4 851780 Other telephonic or
telegraphic apparatus
(encryption devices, data
security equipment, DSL,
VPN, etc.)
ITA‐1 91 179 87 8 3.2
5 852812 Colour TVs Non‐ITA‐1 4 12 12 5 2.9
6 901839 Syringes, needles, catheters,
cannulae and the like :‐‐
Other
Non‐ITA‐1 90 27 16 18 2.9
7 901890 Other instruments and
appliances
Non‐ITA‐1 16 9 11 12 2.7
8 852390 Unrecorded sound
recording media except
photo/magnetic
ITA‐1 29 65 63 11 2.6
9 854140 Photosensitive
semiconductor devices; light
emitting diodes
ITA‐1 40 6 3 3 2.3
10 850490 Parts for transformers,
inductors, converters, etc.
ITA‐1 24 8 10 15 2.2
11 903289 Regulating or controlling
instruments other than
thermostats, monostats,
hydraulic or pneumatic
Non‐ITA‐1 25 36 32 38 2.1
12 853400 Printed circuits ITA‐1 9 7 8 2 2.0

18
SN HS 1996
Product
Code
Product description Liberalisatio
n category
Ranks (Based on percentage share in total
electronics exports in each year)
Share
(Percen
tage)
1996 2001 2006 2010 2014
13 850423 Liquid dielectric
transformers :‐‐ Having a
power handling capacity
exceeding 10,000 kVA
Non‐ITA‐1 33 11 4 6 1.9
14 852990 Other aerials ITA‐1 34 17 6 21 1.7
15 841821 Refrigerators, household
type :‐‐ Compression‐type
Non‐ITA‐1 99 44 21 26 1.7
16 850421 Liquid dielectric
transformers :‐‐ Having a
power handling capacity not
exceeding 650 kVA
Non‐ITA‐1 12 25 28 19 1.6
17 847330 Computer parts and
accessories
ITA‐1 2 1 2 9 1.5
18 853650 Other switches ITA‐1 72 48 17 25 1.5
19 853620 Automatic circuit breakers Non‐ITA‐1 64 61 24 34 1.4
20 903300 Parts and accessories (n.e.s.)
for machines, appliances,
instruments or apparatus of
Chapter 90
Non‐ITA‐1 53 19 50 17 1.4
Source: Author’s calculations based on WTIS COMTRADE.
While the cumulative share of top ten electronics exports declined continuously from
about 51 per cent in 1996 to 42 per cent in 2006, there was considerable diversification
especially between 2001 and 2006. By 2006, the share of computer parts and accessories
came down to just 6.5 per cent although its rank dropped only to the second place. Static
converters became India’s largest electronics export product, with a share of 11 per cent.
A lot of new products had come into the top ten export list, including transformers,
medical equipments and their parts, transmit‐receive apparatus for radio, telephone, etc.
Exports of colour TV and parts of line telephone/telegraph equipment, nes. continued to
be significant. In 2010, cell phones (within the category ‘transmit‐receive apparatus for
radio, telephone, etc.’ ‐ HS 852520) became the single largest exports with a 20 per cent
share of total electronics exports.16 This was accompanied by significant surges in the
shares of printed circuits, photovoltaic devices and LEDs, colour TVs, parts of telecom
equipment, and other telephonic or telegraphic apparatus (encryption devices, data
security equipment, DSL, VPN, etc.). On the contrary, computer parts and accessories
registered a major drop in its share after 2006 and dropped out of the top ten list after
16 This had led to an increase in the top ten cumulative share from 42 per cent in 2006 to 55 per cent
in 2010.

19
2010. While transmit‐receive apparatus for radio, telephone, etc. continued to be the top
electronics export product, its share dropped significantly after 2010 to 7.5 per cent in
2014.
On the import side, it is seen that concentration has increased significantly. The
cumulative share accounted by the top ten imports increased from about 39 per cent in
1996 to 48 per cent in 2001, and further to 58.5 per cent in 2006. Since the mid‐2000s, this
cumulative share has been sticky around 58 per cent (Table 6).
In 1996, when domestic production of computers was still significant, India’s single
largest import item was computer parts and accessories with a share of 9 per cent of the
total. The second and third positions were held by other monolithic digital ICs, as well as
parts for radio telephony, TV, radar apparatus, etc. Imports of cathode ray tubes (CRTs)
for colour TVs and video monitors, as well as optical or magnetic readers were also
important, which continued to be the case in 2001. However, in 2001, within five years of
the tariff reduction initiated under the ITA‐1, the share of computer parts and accessories
went up to 16 per cent of the total, followed by computer storage units in the second rank
(Table 3). This reflects the increase in domestic assembly of computer sets in this phase
using imported parts and components that had become cheaper due to ITA‐1. Similarly,
there was a huge increase in the shares of telecom imports too.
Table 6: Indiaʹs Major Electronics Imports, 1996–2014
SN HS 1996
Product
Code
Product description Liberalisati
on category
Ranks
(Based on percentage share
in total electronics imports
in each year)
Share
(Perce
ntage)
1996 2001 2006 2010 2014
1 852520 Transmit‐receive apparatus
for radio, telephone, etc.
ITA‐1 10 3 1 1 18.8
2 851780 Other telephonic or
telegraphic apparatus
(encryption devices, data
security equipment, DSL,
VPN, etc.)
ITA‐1 69 68 22 3 7.8
3 851790 Parts of line
telephone/telegraph
equipment, nes.
ITA‐1 15 9 8 2 6.9
4 847130 Laptops and other portable
units
ITA‐1 53 19 7 6 5.7
5 854230 Other monolithic integrated
circuits
ITA‐1 39 27 10 7 3.7
6 847330 Computer parts and
accessories
ITA‐1 1 1 2 5 3.6
7 852390 Unrecorded sound recording
media except photo/magnetic
ITA‐1 62 47 59 4 3.0

20
SN HS 1996
Product
Code
Product description Liberalisati
on category
Ranks
(Based on percentage share
in total electronics imports
in each year)
Share
(Perce
ntage)
1996 2001 2006 2010 2014
8 847160 Computer input or output
units
ITA‐1 12 8 5 12 2.8
9 852812 Colour TVs Non‐ITA‐
1
109 112 14 10 2.7
10 852990 Other prepared unrecorded
media for sound recording
ITA‐1 3 5 4 8 2.7
11 847150 Other digital processing
units, whether or not
containing in the same
housing one or two of the
following types of unit :
storage units, input units,
output units
ITA‐1 108 16 9 13 2.3
12 847170 Storage units ITA‐1 8 2 6 9 2.3
13 854140 Photosensitive semiconductor
devices, light emitting diodes
ITA‐1 73 61 26 18 1.9
14 850440 Static converters ITA‐1 24 20 12 11 1.9
15 901890 Other instruments and
appliances
Non‐ITA‐
1
11 6 11 14 1.4
16 852540 Still image video cameras and
other video camera recorders
ITA‐1 257 94 31 17 1.3
17 903180 Other scientific instruments,
appliances and machines
Non‐ITA‐
1
6 11 13 15 1.3
18 854389 Other machines and
apparatus :‐‐ Other
ITA‐1 38 25 15 19 1.1
19 903289 Regulating or controlling
instruments other than
thermostats, monostats,
hydraulic or pneumatic
Non‐ITA‐
1
22 21 17 21 1.0
20 850490 Parts of transformers,
converter, inductors, etc.
ITA‐1 23 28 38 23 0.8
Source: Author’s calculations based on WTIS COMTRADE.
By 2006, transmit‐receive apparatus for radio, telephone, etc. – which had already
become the third largest import by 2001 – came to top imports constituting nearly one‐
fourth of all electronics imports.17 While computer parts and accessories continued in the
17 Given that the WITS COMTRADE data does not provide 8‐digit level data, we examined the 8
digit level data for India’s exports and imports for the product category HS 852520 using DGCIS
data. It was clearly seen that while imports of two‐way radio communication equipment and

21
second place even in 2006, we also observe a significant increase in the shares of laptops,
printers and key boards, computer storage devices, and other monolithic ICs. Transmit‐
receive apparatus for radio, telephone, etc. (HS 852520) continued to be the single largest
import in 2010 and 2014 with a share of 18 per cent of the total. Other telephonic or
telegraphic apparatus (encryption devices, data security equipment, DSL, VPN, etc.),
along with parts of line telephone/telegraph equipment, continued to be the next largest
imports. Computer parts and accessories, laptops, printers and key boards, and other
monolithic digital ICs, other prepared unrecorded media for sound recording, colour
TVs, etc. remained the other major imports.
Out of the top twenty imports, the majority were ITA‐1 products whose import shares
went up significantly following the rapid trade liberalisation under ITA‐1. These
included telecommunication apparatus and parts, computers, laptops, monolithic ICs,
semiconductor devices and LEDs, and static converters. Exceptions among ITA‐1
products whose import shares dropped were computer parts and accessories, computer
storage units, and unrecorded media for sound recording. As discussed in the previous
section, in the absence of strategic industrial policy support that had failed to
domestically link the growth in demand for hardware arising from the success in
software exports, Indian computer hardware producers lost out to imports. This got
reflected in the decline in the share of computer parts and accessories within exports too.
Once India began importing greater volumes of finished computers, laptops, etc., duty
free, it adversely impacted most segments of the domestic computer industry and the
need for parts and accessories reduced. However, as expected, import demand for
computer input/output units, remained steady. On the other side, imports of cell phone
parts also increased to support import‐dependent assembly of cell phones (‘transmit‐
receive apparatus for radio, telephone, etc.’), as did other telecom equipment imports
that increased in tandem with the huge expansion in the domestic telecom market in the
2000s. In the case of non‐ITA‐1 products such as transformer parts and scientific
instruments too, import demand remained significant. On the other side, import share of
colour TVs, a non‐ITA‐1 product had already begun increasing by 2006, well before TV
imports were liberalised under the India‐South Korea CEPA from 2016. This, as we saw
earlier, reflected the poor competitiveness and technological upgradation capabilities of
the domestic TV industry, which despite having built up a few national brands like
Videocon could not survive the increased import competition in the absence of
productivity growth.
It is clear that given the domestic electronics industry’s development path of the
preceding decades without any government‐directed effort in creating capabilities and
scale, its sudden exposure to severe external competitive pressures with trade
liberalisation under the ITA‐1 from the late 1990s, which was compounded by trade
other radio communication equipment (like VHF, UHF, and microwave equipment) dominated
imports till 2001, cell phones have been the dominant import product in this category since then.

22
liberalisation under the FTAs from the mid‐2000s has led to a continued surge in imports.
It is also clearly seen that tariff liberalisation did not lead to any sustainable expansion in
India’s electronics exports after the initial surge.
The above analysis of the composition of imports and exports also reveals that while
there was some two‐way trade in computers along with their parts and accessories as
well as ICs in the first period, the nature of two‐way trade changed by the mid‐2000s. In
particular, since 2006, the majority of two‐way trade is observed among various kinds of
telecommunication apparatus and parts, as well as ICs, static converters, other electronic
parts and components along with scientific, measuring instruments. We will examine
these changes in detail in the following section. Towards this, it is useful to identify the
major trading partners and those with whom there was significant two‐way trade.
The cumulative share of top ten markets for Indian electronics exports dropped
continuously between 1996 and 2014, falling from 80 per cent in 1996 to 55 per cent in
2014. This was mainly accounted for by the drop in the shares of the US, Singapore and
the UK. In the case of electronics exports, the US was the single largest market for India
throughout the study period 1996–2014. But its share in India’s exports dropped from
about 26 per cent to 15 per cent in 2014. The other major markets have been Singapore,
Germany, UK, and the UAE, which have consistently remained among the next top five
markets with varying ranks. The UAE, which was the third largest market from 2001
onwards, became the second largest in 2014.18 Malaysia was an important market for
Indian electronics exports between 1996 and 2001, but dropped out of the top six list
subsequently. China, which had moved up to the seventh rank in 2005, went down to the
10th rank in 2010 and climbed up to the fourth rank in 2014. The share of India’s
electronics exports going to China increased from 0.2 per cent in 1996 to 4.5 per cent in
2014. The odd one out was Austria which became the second largest market in one year
alone (2010) with a share of 7 per cent. However, other EU members such as France, Italy
and the Netherlands continued to be among the top ten markets.
The sole developing country export market in the early phase was Bangladesh, which
dropped in share and rank after 2001. However, Nigeria followed by Saudi Arabia,
Vietnam, Turkey, Indonesia, South Africa, Brazil, Sri Lanka, etc. have become other
important developing country markets with increasing shares of electronics exports.
Thailand’s share shows a minor increase, while that of the Philippines declined. In the
case of other major FTA partners such as Japan and South Korea, there was a slight
reversal in the declining shares of both these countries between 2010 and 2014. But,
interestingly, the fastest growing markets during 2005–10 and 2010–14 were the African
states like Guinea‐Bissau, Somalia, Central African Republic, Lesotho, etc., or island
18 This is mainly explained by the fact that the UAE, particularly Dubai, is a major import hub for
the Middle East region aided by the Free Zones created in Dubai. Majority of the African market
is also served through the re‐export route. (E&Y, 2015)

23
states like Aruba, French Polynesia, Cayman Islands, St. Kitts and Nevis, Monsterrat, and
Iceland, as well as some European countries like Portugal, Hungary and Estonia.
It is clear that Indian electronics exports going to developed country markets have all
declined in share when compared to those to developing countries. To the extent that
there are domestic firms involved in production, this would reflect domestic firms’
inability to meet the standards in developed country markets with technologically
superior demand. But given that the dominant producers in the Indian electronics
industry are MNCs, this is reflective of their market strategy, which in turn is determined
by their division of labour across countries. The above trend is evidence of the fact that
because of the lack of national capabilities, MNCs’ production strategy in India involves
only some exports to developing countries, while being mainly geared towards the large
domestic market.
It is relevant to note here that exporting to developed country markets have become
more difficult because of their growing use of non‐tariff measures in the form of technical
barriers to trade (TBT) (Kallummal, 2012). Not only did developed countries account for
a majority of the total TBT notifications to the WTO, the majority of these were national
standards (Kallummal 2012).19 Current barriers to trade are primarily linked to
requirements on product standards, testing and certification, consumer protection, and
the environment. Further, there are differences between the standards and regulations in
the US and the EU (National Board of Trade, 2015). All of these make significantly
greater demands on production sophistication in the case of exports to developed
country markets. In this sense, the fact that India’s export market access in developed
countries has not been sustained and that firms have instead taken the low road through
increased exports to developing countries is also evidence of the market failure that
arises in the absence of strategic industrial policies to develop the national technological
base.
When it comes to imports, the US, followed by Singapore and Japan were the top three
import suppliers for India until 2001. However, the shares of India’s electronics imports
originating from all these countries have seen continuous decline. China became the
single largest import supplier after 2001 (Table 7). Its share in electronics imports, which
increased from 3 per cent in 1996 to 8 per cent in 2001, had shot up to 23 per cent by 2005
and continued to increase further. With a share of about 48 per cent, almost half of all
India’s electronics imports in 2014 originated from China. Despite the sharp drop in the
US share from 22 per cent in 1996 to just 7 per cent in 2014, it has remained the second
most important import supplier. Singapore’s share dropped from 13 per cent to 4.5 per
cent between 1996 and 2014. Japan’s share dropped from 12 per cent in 1996 to about 3
per cent in 2014.
19 National standards are specific legislations that need to be adhered to by foreign producers to
operate or sell in those markets. These may be different from the internationally harmonised
standards by the International Standards Organisation (ISO). For details, see Kallummal (2012).

24
Table 7: India’s Major Suppliers for Electronics Imports, 1996‐2014
(Percentage share in each year’s total imports)
SN Country 1996 2001 2005 2010 2014 CAGR (2005‐14)
1 China 3.1 7.9 23.0 41.5 47.5 8.4
2 United States 21.6 16.5 12.3 8.0 7.3 ‐5.6
3 South Korea 5.1 7.3 12.9 5.8 5.7 ‐8.6
4 Singapore 13.4 12.7 9.7 6.0 4.5 ‐8.2
5 Germany 8.7 7.1 5.5 5.2 4.5 ‐2.3
6 Malaysia 5.0 7.3 5.1 4.1 4.2 ‐1.9
7 Vietnam 0.0 0.0 0.0 1.2 2.8 78.4
8 Japan 11.6 7.0 4.4 3.5 2.8 ‐5.2
9 Thailand 1.1 4.3 1.7 1.7 2.4 3.6
10 Other Asia, n.e.s. 4.4 4.1 2.6 2.4 2.3 ‐1.1
Total imports
Source: Author’s calculation based on WITS COMTRADE database.
South Korea has remained the other major import supplier, with its rank ranging
between 2nd and 4th. Germany has been another major supplier with its rank hovering
around 5th, even as its share witnessed a drop. Similarly, Malaysia has maintained a rank
around 6th position. Meanwhile, Vietnam registered one of the strongest export growth to
India in electronics, with its import share jumping from 2010 onwards, the year in which
the India‐ASEAN FTA came into existence. As a result, Vietnam’s rank among India’s
electronics import suppliers jumped from 221 in 1996 to 16 in 2014. Thailand also moved
up from the 18th to the 9th rank between 1996 and 2014. In the 10th rank was other Asia
n.e.s., which appears to be Taiwan Province of China. While the share of India’s imports
from most European countries experienced a drop, those of Mexico and Israel increased.
It is important to note that even though China had joined the ITA‐1 only in 2004, it had
tariff‐free access in ITA‐1 products to the Indian market from 1997 when India had begun
reducing tariffs.20 Interestingly, India’s overall electronics imports from China were
already dominated by ITA‐1 products in 1996, reflecting the integration of China into the
East Asian electronics value chains by the early 1990s. Parts for sound/video recording
and reproducing apparatus as well as parts for radio/TV/transmission apparatus were
the largest imports. But cathode‐ray colour TV picture tubes, a non‐ITA product, were
the third largest imports from China in 1996. There were three more non‐ITA‐1 products
with at least a one per cent share in imports from China in this phase. However, by 2001,
the drastic trade liberalisation that India carried out under the ITA‐1 meant that ITA‐1
products became more significant and constituted all the top ten imports from China.
There was a change in composition of the top ten imports, with an initial sharp increase
in the shares of computer parts and accessories, although this declined significantly
thereafter. Transmit‐receive apparatus for radio & TV became the single largest
electronics import from China by 2006 and has remained so. Laptops became the second
20 This is because the ITA‐1 signatories had to extend the trade liberalisation to the non‐ITA
members of the WTO also following the Most Favoured Nation (MFN) principle.
25
largest import item by 2010 and were followed by parts of electrical apparatus for line
telephony/telegraphy. But an important change that occurred is that the share of colour
TVs – a non‐ITA product – too began increasing from 2010 onwards. By 2014, India was
importing photo‐sensitive semiconductor devices also from China. It is ironic that while
China had not signed the ITA‐1 until 2004 nor signed an FTA with India until now,
Chinese firms which had matured under strategic guidance from the state were able to
gain significant market access in India. The successful latecomer entry by Chinese firms
into the global electronics oligopoly market was made possible only as a result of China’s
extensive and highly interventionist long‐term industrial development strategy (Ernst
2014, p. 26 and 31).
China accounted for nearly 58 per cent of India’s total electronics industry trade deficit in
2014. India’s electronics trade deficit with South Korea has also increased tremendously,
followed by that of Malaysia, Vietnam and Thailand (all FTA partners), while India
continues to have high trade deficit with the US, Germany, Singapore and Japan.
Countries with which India has had a consistent trade surplus in electronics trade are all
developing countries like the UAE, Nigeria, Saudi Arabia, Bangladesh, Turkey, Kenya,
Sri Lanka, Nepal and Myanmar, while South Africa has also emerged recently with trade
surplus.21
4. Inter‐ and Intra‐Industry Trade Patterns in the Electronics Industry
Against the backdrop of the observed intra‐industry trade (IIT) flows, this sub‐section
carries out an in‐depth analysis of bilateral trade flows in order to understand the extent
and nature of India’s participation in electronics value chains. The attempt here is not to
examine the entire value chain, as the downstream segments of applied R&D and design
and the upstream segments of marketing and retailing are well recognised to be
dominated by developed country firms. While value addition from the manufacturing
segment of the value chain is relatively lower compared to these service functions,
following Amsden (2001) and Khan (2009), we attach special significance to accretion in
productive employment, build‐up and diffusion of technological capabilities and
sustainability, which accrue from carrying out manufacturing processes domestically.
Moreover, if any export success in services is to be sustainable, it must generate
significant backward linkages in the economy, for which the existence and continuous
upgradation of manufacturing capabilities is in turn necessary. Therefore we need to
critically consider our understanding of IIT in order to be able to fathom the connections
between trade and investment liberalisation, firm strategies, and the accompanying
production restructuring.
As mentioned in the introductory section, not all increase in two‐way trade observed in
India’s trade in HS chapters 84 (non‐electrical machinery) and 85 (electrical machinery)
21 Thus SAFTA seems to have played some role here, although it will be useful to look at bilateral
trade flows to delineate the impact of the ITA‐1.

26
can be considered as IIT. An example of such a case is the following: even as there is
significant two‐way trade in HS Chapter 84, this is occurring as imports of hard disk
drives (HDDs) and exports of computer input or output units. That is, the country is
importing the HDDs as an intermediate into the production of a final good, computer, for
the domestic market. This is a case of inter‐industry trade. Intermediate inputs imported
by a country for use in its sale of goods to final consumers in the export market also
cannot be linked to GVCs (Fontagné, Freudenberg and Gaulier 2006). This too will get
captured under inter‐industry trade when the imported intermediate product and the
exported final good are represented by different product codes. However, this subsumes
the case when intermediate products are imported by a country for assembly into a final
product for export as part of an MNC’s GVC strategy (and can underestimate IIT). The
latter can be examined at the firm‐level through an analysis of related party transactions
of foreign‐invested enterprises in India, which is not attempted in this study.
Once we delineate inter‐industry trade, a distinction is made between varieties of IIT to
capture the nature of vertical specialisation arising from participation in GVCs. In order
to identify vertical and horizontal IIT, we adopt the methodology used by studies such as
Fontagné, Freudenberg and Gaulier (2006), Fukao et al. (2003), Hurley (2003), etc. The
starting point is the assumption that differences in prices (unit values) within one
product category mirror differences in quality.22 First of all, trade in those HS 6‐digit
products for which the difference between the bilateral export and import values is more
than 10 per cent is identified as IIT. In the next step, unit values (UV) of exports and
imports are employed to delineate the two types of IIT.23 Within IIT, vertical IIT is thus
identified as that portion of identified intra‐industry trade, which involves products with
relative export/import unit values greater than 1.25. For products which exhibit VIIT, we
look at the unit value difference with a trading partner to understand whether India is
exporting the higher priced, and therefore, higher quality, product within a product
category or not.24 While the decomposition of IIT based on unit value dispersion is
considered the most comprehensive approach to date, unusual dispersion of unit values
signals a high probability of classification failure due to the heterogeneity of the HS 6‐
digit heading or due to a measurement error (Fontagne et al., 2006).
The advantage of this method is that it allows us to understand the extent of India’s
participation in GVCs as well as the nature of its engagement in GVCs in order to
understand India’s relative position via‐a‐vis her major trading partners at the product
22 This assumption is only acceptable with the most detailed trade data, where aggregation of
different products within one product category is minimised. Since relying on national tariff line
level data would restrict international comparisons (Fontagné, et al, 2006), we have used HS 6‐
digit trade data. 23 As a result, we had to leave out products for which unit value data was unavailable. 24 However, as Fontagne et al (2006) pointed out, unusual dispersion of unit values signals a high
probability of classification failure due to the heterogeneity of the HS 6‐digit heading or due to a
measurement error.

27
level. This approach may be considered as going beyond the analysis that is done using
the Trade‐In‐Value‐Added (TiVA) database, especially given the disadvantages
associated with the use of guesstimates in the I‐O tables used for constructing TiVA. In this study, we examined the changes in the nature of bilateral IIT in Indian electronics
industry trade between 1999 and 2014.25,26 The analysis was carried out for all of India’s
major import suppliers (Table 8). The table summarises the results of the exercise in terms
of the changes in the levels of bilateral intra‐industry trade (IIT) between India and these
countries. It is clearly observable that between 1999 and 2014, the levels of IIT within
bilateral trade increased across‐the‐board, with significant increase in seven out of these
ten major trading partners. The largest increase was seen in the case of Vietnam, which
was followed by China, South Korea, Japan and Thailand.
Table 8: Change in the Relative Importance of IIT in Indiaʹs Bilateral Trade in Electronics
SN Trading partner Share of IIT in total bilateral trade (Percentage)
1999 2014 Change (1999–2014)
(Percentage points)
1 China 61.0 98.2 37.2
2 South Korea 17.6 53.5 35.9
3 Singapore 90.0 90.5 0.5
4 Malaysia 91.7 98.4 6.7
5 Thailand 69.9 96.7 26.8
6 US 93.7 99.1 5.4
7 Germany 86.2 94.4 8.2
8 UK 85.3 97.5 12.2
9 Japan 65.0 94.5 29.5
10 Vietnam 3.8 92.3 88.5
Source: Author’s calculations based on WITS COMTRADE.
The further decomposition of India’s bilateral IIT with these countries in terms of
horizontal and vertical IIT shows interesting results (Table 8). In the case of China and
South Korea, the share of vertical IIT in total bilateral intra‐industry trade showed a
drastic decline by 2014. In both these cases, India was therefore trading more in
horizontally differentiated products in 2014 (Table 9).
25 The starting year had to be taken as 1999 as the relevant series of RBI’s export and import price
indices – used for deflating export‐import values ‐ has a base of 1999–2000=100. This however
means that we do not have the opportunity to estimate the IIT values for 1996, to examine the
pre‐ITA‐1 pattern. 26 Following accepted international practice prescribed by the IMF, import values in c.i.f. terms
were discounted by 10% to obtain the corresponding f.o.b. values.

28
Table 9: Change in the Relative Importance of Vertical IIT in India’s Bilateral IIT in Electronics
SN Trading partner Share of VIIT in bilateral IIT (Percentage)
1999 2014 Change (1999–2014)
(Percentage points)
1 China 99.0 78.6 ‐20.4
2 South Korea 100.0 47.5 ‐52.5
3 Singapore 96.8 96.5 ‐0.3
4 Malaysia 33.2 99.6 66.4
5 Thailand 77.1 98.3 21.2
6 US 18.7 25.6 6.9
7 Germany 72.3 79.6 7.3
8 UK 84.2 87.8 3.6
9 Japan 88.8 80.9 ‐7.9
10 Vietnam 32.3 91.0 58.7
Source: Author’s calculations based on WTIS COMTRADE.
In the case of China too, it was seen that while expansion in horizontal IIT contributed to
the increase in IIT between 1999 and 2014, this involved a large number of non‐ITA
products contrary to the pattern seen in India’s overall bilateral trade with China. But as
much as 96 per cent of bilateral HIIT was imports. Clearly, the volume of exports from
India was very low.
In the US case, despite some increase in VIIT, the high level of IIT continued to be
dominated by trade in horizontally differentiated products. But overall, imports
dominated HIIT with the US and more non‐ITA products than ITA‐1 products were
involved in this trade in 2014. India’s top most exports involved in HIIT were colour TVs,
electro‐diagnostic devices, along with other professional instruments and appliances,
parts and accessories of professional and scientific appliances, etc., which were all non‐
ITA products. Two ITA‐1 products among the top ten horizontally differentiated exports
to the US were photosensitive semiconductors and printed circuits, for which India’s
exports were greater than imports from the US. On the other side, top HIIT imports from
the US were miscellaneous electro‐diagnostic apparatus, other electrical machines and
apparatus, other computers, other testing/professional appliances, other monolithic ICs,
as well as a range of medical appliances and instruments, etc.
The increase in bilateral IIT observed for Germany and the UK was also mostly driven by
increased trade in horizontally differentiated products. India had trade deficits with
these countries too.
There is significant heterogeneity in India’s electronics trade transactions with her major
FTA partners. On the one side, as we saw above, in the case of two major partners, China
and South Korea, most of the increased bilateral IIT was due to increase in trade in

29
horizontally differentiated products. On the other side, India’s trade with Japan
continued to be dominated by vertically differentiated products, despite a decline in its
share as compared to 1999. When it comes to ASEAN partners, India’s vertical IIT was
always high with Singapore, which is attributable to the latter’s entrepot role in the
context of the East Asian electronics production networks (that was well established by
the early nineties). However, we observe a significant rise in the relative importance of
vertical IIT in the case of Malaysia, Thailand, and Vietnam. This would point to an
increased degree of trade integration between India and the ASEAN trading partners
involving vertical specialisation. However, given that some heterogeneity in products
was observed at the 6‐digit level categorisation of products (which was also reflected in
very high unit value dispersion in certain cases), we have to keep in mind that there
could be some overestimation of IIT as well as VIIT.
A comparison of India’s bilateral export and import unit values (based on deflated US
dollar values) in vertically differentiated products (Table 10) helps us to examine the
relative quality levels of Indian products involved in observed bilateral IIT. It is observed
that a larger proportion of India’s VIIT with China in 2014 involved exports with higher
unit value vis‐à‐vis imports when compared with 1999. This was true in the case of
India’s VIIT with Thailand also and to a lesser extent in the case of Vietnam and Japan. In
contrast, in the case of US, Germany and South Korea, India was predominantly
importing VIIT products with higher unit values. India’s VIIT with Singapore and
Malaysia appeared more balanced in terms of numbers.
Table 10. Status of India vis‐à‐vis Major Partners in Bilateral VIIT
Bilateral
partner
Percentage share of
VIIT products in
which India had
higher unit value in
1999 (Based on
number of products)
Percentage share of
VIIT products in
which India had
higher unit value in
2014 (Based on
number of products)
Share in Indiaʹs
electronics imports
(2014)
Indiaʹs Electronics
trade balance with
the partner (2014)
China 73 85 47.5 Deficit
US 38 41 7.3 Deficit
South Korea 75 41 5.7 Deficit
Germany 30 45 4.5 Deficit
Singapore 42 55 4.5 Deficit
Malaysia 47 54 4.2 Deficit
Thailand 45 73 2.4 Deficit
Vietnam 50 65 2.8 Deficit
Japan 43 62 2.8 Deficit
Source: Author’s calculations based on WTIS COMTRADE.

30
However, when we analysed the share of import value (based on deflated US dollar
value and adjusted to f.o.b. terms) in total bilateral vertical IIT, it is seen that despite the
large proportion of VIIT products in which India had higher unit value, the import share
of VIIT products in bilateral VIIT had gone up in the case of China and Vietnam as well
as South Korea (Table 11). Imports dominated VIIT in the case of Thailand, Malaysia,
Japan, Singapore, and Germany too. However, in the case of the US, the share of imports
in bilateral VIIT showed a dramatic decline.
Table 11. Share of VIIT Imports in Total Bilateral VIIT
Partner Percentage share of VIIT imports in total bilateral VIIT
1999 2014
China 92 97
US 88 59
Germany 87 74
South Korea 53 60
Singapore 90 74
Malaysia 94 83
Thailand 92 87
Vietnam 74 92
Japan 89 84
Source: Author’s calculations based on WTIS COMTRADE.
In order to further understand the relative importance of India’s higher unit value
exports in VIIT, we analysed their shares in bilateral trade. In the case of China, we
examined the VIIT products in which India had higher export unit value bilaterally. It
was observed that in only 11 out of these 175 products, Indian exports accounted for even
a 0.1 per cent share in total bilateral electronics trade in 2014. On the contrary, in 13 of
these products Indian imports constituted at least a one per cent share in total bilateral
trade, with imports of transmit‐receive apparatus for radio & TV alone accounting for 32
per cent of total bilateral electronics trade. That is, although there were a large number of
products in which India had higher export unit value bilaterally, these products were not
significant in bilateral trade. All major VIIT imports from China, except colour TVs, were
ITA‐1 products (Table 12).
Similarly, in the case of Vietnam, not a single product in which India exhibited higher
export unit value in VIIT in 2014 had even a 0.5 per cent share in total bilateral trade. As a
result, the bilateral trade share of exports of all the VIIT products in which India saw
higher export unit value added up to just 1.5 per cent. On the contrary, the bilateral trade
share of imports in all these VIIT products (in which India saw higher export unit value)
added up to 11 per cent. The top‐most vertically integrated products were again the ITA‐
1 product, transmit‐receive apparatus for radio & TV with an import share of 48 per cent
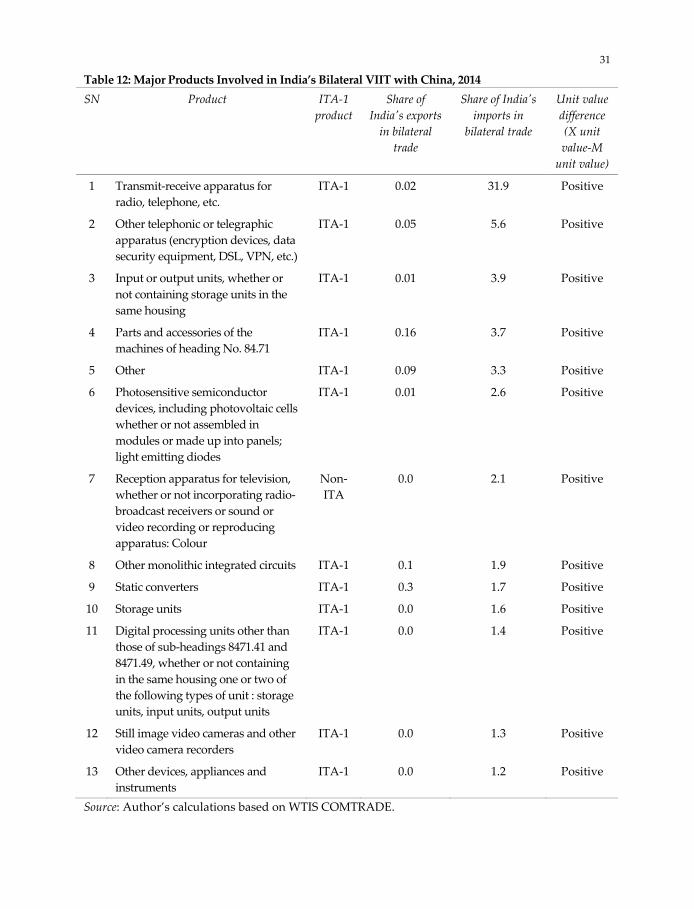
31
Table 12: Major Products Involved in India’s Bilateral VIIT with China, 2014
SN Product ITA‐1
product
Share of
Indiaʹs exports
in bilateral
trade
Share of Indiaʹs
imports in
bilateral trade
Unit value
difference
(X unit
value‐M
unit value)
1 Transmit‐receive apparatus for
radio, telephone, etc.
ITA‐1 0.02 31.9 Positive
2 Other telephonic or telegraphic
apparatus (encryption devices, data
security equipment, DSL, VPN, etc.)
ITA‐1 0.05 5.6 Positive
3 Input or output units, whether or
not containing storage units in the
same housing
ITA‐1 0.01 3.9 Positive
4 Parts and accessories of the
machines of heading No. 84.71
ITA‐1 0.16 3.7 Positive
5 Other ITA‐1 0.09 3.3 Positive
6 Photosensitive semiconductor
devices, including photovoltaic cells
whether or not assembled in
modules or made up into panels;
light emitting diodes
ITA‐1 0.01 2.6 Positive
7 Reception apparatus for television,
whether or not incorporating radio‐
broadcast receivers or sound or
video recording or reproducing
apparatus: Colour
Non‐
ITA
0.0 2.1 Positive
8 Other monolithic integrated circuits ITA‐1 0.1 1.9 Positive
9 Static converters ITA‐1 0.3 1.7 Positive
10 Storage units ITA‐1 0.0 1.6 Positive
11 Digital processing units other than
those of sub‐headings 8471.41 and
8471.49, whether or not containing
in the same housing one or two of
the following types of unit : storage
units, input units, output units
ITA‐1 0.0 1.4 Positive
12 Still image video cameras and other
video camera recorders
ITA‐1 0.0 1.3 Positive
13 Other devices, appliances and
instruments
ITA‐1 0.0 1.2 Positive
Source: Author’s calculations based on WTIS COMTRADE.

32
in bilateral trade in 2014, followed by parts of electrical apparatus for line telephony with
an import share of 14 per cent. Interestingly, all the top ten products involved in VIIT
with Vietnam in 2014 were ITA‐1 products. But wherever products that got liberalised
under normal Track‐1 or Normal Track‐2 of India‐ASEAN FTA came into the top thirty
list, imports clearly dominated over exports.
In the case of Thailand, out of the 107 VIIT products in which India had higher unit value
exports, there were just two products with more than one per cent share in total bilateral
trade. These were lighting and signalling equipment as well as other medical/dental
apparatus. But only in the case of the latter did Indian exports hold a greater share in
bilateral trade as compared to imports. In all the other products, India’s imports from
Thailand significantly outweighed India’s exports to that country. Within these, imports
of computer storage devices constituted as much as 21 per cent of total bilateral trade,
even when India showed a higher unit export value.
Among the 91 products in VIIT with Malaysia in which India exhibited higher export
unit values, significant exports happened only in three products. Among these the export
share was greater than import share only in two products. These were: liquid dielectric
transformers and parts for burglar/fire alarms and similar apparatus. On the other side,
top imports were colour TVs (with 22 per cent share ‐ non‐ITA product), followed by
computer parts and accessories as well as other telephonic or telegraphic apparatus
(encryption devices, data security equipment, DSL, VPN, etc.).
In VIIT trade with Singapore, India’s exports were even a little bit significant in bilateral
trade (with shares ranging between 0.5 per cent and 2 per cent) only in 8 out of 115
products in which India was exporting products with higher unit value. In the remaining
majority of such products, imports dominated over exports. Overall, imports were more
diversified compared to the cases above, with top import among VIIT products having a
share of 13 per cent in bilateral trade (‘other computers’).
That is, even though India exported an increased number of higher value added products
in the observed vertical integration with most of the major trade partners (except the US,
South Korea and Germany) in 2014, they involved insignificant shares in bilateral trade.
Within the vast majority of vertically traded products in which India showed higher unit
export value, volume of imports far outweighed that of exports. At one level, this means
that while India appears to have export capabilities in some higher value added
products, the scale of such export production is abysmally low to have a significant
impact on broader productivity growth. These export capabilities could be of the
“enclave” sort, limited to some MNCs’ production facilities. The dominance of imports
evident from the detailed analysis of aggregate as well as intra‐industry trade flows
makes it clear that even the small level of the FDI inflows that came into the electronics
sector did not result in developing substantial production capabilities domestically. This,
as we discussed earlier, is due to the fact that incentives for domestic production were
negated by the non‐strategic trade liberalisation which created larger markets for duty‐

33
free trade in electronics products, and the absence of industrial policies promoting
domestic linkages or technological development.
At another level, the above finding could also mean that only a small proportion of the
imported intermediates got used in export production, which in turn points towards
significantly increased import intensity of domestic production. The continuing growth
in India’s total electronics imports despite the declining trend in electronics exports
would also point to this. The reason why this is not getting captured in higher inter‐
industry trade levels could be because of the inclusion of different types of products
under the same 6‐digit category. This is possible in such an industry with rapid
technologic changes, owing to the rise of new products. This might have resulted in some
classification errors27 and could lead to an overestimation of IIT and VIIT even at the 6‐
digit level. This would point to an underestimation of inter‐industry trade in electronics
even at the 6‐digit level. Thus it is important to interpret the individual bilateral IIT
results presented above with care. Further, the above discussion points to the potential
for serious flaws in interpreting IIT results as reflecting countries’ engagement in GVCs,
without considering them in the context of the value of exports and imports.
However, the findings undisputedly establish that the observed rise in overall intra‐
industry trade, whether it involved horizontal or vertical product differentiation, has
only contributed to India’s rising trade deficit with all her major electronics trading
partners. If productivity were simply a function of the type of machinery and
intermediate goods used, then the availability of intermediate inputs following trade and
investment liberalisation under the ITA‐1 and FTAs should have helped India to be a
manufacturer of quality electronic products, especially given that many of the operating
technologies are freely available. What is missing, as Khan (2010) has argued, is the mix
of organizational, operational and technological capabilities and skills that can only be
developed through actual experience. This is the part of the learning process that is lost
when domestic manufacturing is avoided and direct imports take over. This implies that
apart from firm‐ and industry‐level productivity and economy‐wide ‘infrastructural’
conditions, the existence of incentives for domestic production are important. This clearly
points to the need to re‐evaluate the premises underlying India’s current trade and
industrial policies, including those being pursued with the purported objective of
promoting GVC engagement.
5. Conclusion
This paper examined the interplay between trade liberalisation and industrial policies
and its implications for India’s electronics industry restructuring, towards understanding
whether and how trade liberalisation has influenced India’s engagement in GVCs.
27 The very high unit value dispersion observed in some products categorised as VIIT could also be
a reflection of this.

34
It is clear that given the domestic electronics industry’s development path of the
preceding decades without adequate government‐directed effort for creating
technological capabilities and scale in domestic firms, the industry’s exposure to severe
external competitive pressures with rapid trade liberalisation under the ITA‐1 from the
late 1990s created a major obstacle in its development trajectory. The tariff liberalisation
of the computer and telecommunications industries under the ITA‐1 was worsened by
the tariff liberalisation under India’s FTAs with East and Southeast Asian countries, with
the latter extending it to several non‐ITA‐1 products, including consumer electronics and
home appliances as well as professional, medical and scientific instruments and their
parts.
A trade policy that promotes duty‐free imports will clearly reduce incentives for
domestic production in the absence of other policies that promote domestic production.
Moreover, the fact that there was no industrial strategy guiding tariff liberalisation in any
strategic manner led to many final products becoming duty‐free, while several
components had to be imported paying tariffs. Despite having the advantage of a large
domestic market, this became an adverse factor influencing producers’ incentives even
for domestic assembly, in the absence of a sufficiently developed domestic parts and
components supply base. Moreover, successive governments’ policies towards FDI with
a hands‐off approach meant that there were also no policies linking foreign invested
firms and the domestic supply base (unlike, for instance, the indigenisation policy in the
automobile industry), which could have let to vertical spillage effects and technological
upgrading among domestic firms. Consequently, trade liberalisation has only seen
India’s growing demand for electronics products leading to high import dependence.
The underlying reason behind the erosion of electronics manufacturing capabilities
appears to be the absence of a visionary state with a long‐term industrial development
strategy, which guides trade liberalisation and ensures focussed implementation of
structural support policies that push firms to be productive and innovative as well as
ensure backward linkages from foreign invested companies to the domestic supplier
base, as it happened in South Korea, Taiwan, and more recently, in China.
The consequences are in the nature of the observed increase in India’s two‐way trade in
electronics products. It appears that there is overestimation of IIT even while using 6‐
digit level data given that there is some heterogeneity in products at the 6‐digit level
categorisation of products. Even so, irrespective of whether horizontal IIT or vertical IIT
dominated bilateral IIT, imports outweighed exports. The findings undisputedly
establish that the observed rise in overall intra‐industry trade, involving both horizontal
and vertical differentiation has only contributed to India’s rising trade deficit with all her
major electronics trading partners. Wherever there was an increase in trade integration
between India and the ASEAN trading partners involving vertical specialisation that
might be interpreted as being driven by engagement in GVCs, India’s exports involved
insignificant volumes compared to imports. This analysis clearly points to the potential
for serious flaws in interpreting IIT results as reflecting countries’ engagement in GVCs,

35
without considering them in the context of the value of exports and imports. The study
findings also established that this kind of development trajectory has made the country’s
production lines and consumption heavily dependent on other countries’ production
systems, in particular, China.
The development trajectory of the Indian electronics industry clearly shows that in the
absence of coherent and coordinated industrial policy support to effectuate the firm‐
level, industry‐level and economy‐wide productivity conditions, non‐strategic trade and
investment policy liberalisation diluted and negated incentives for local production for
both Indian and foreign producers. The huge increase in aggregate import dependence
that has been experienced by the Indian electronics industry, the low level of FDI into the
electronics industry, and the evidence in import growth thrown up by the analysis of
inter‐industry and intra‐industry trade are all stark reflections of the impact of the
interplay between the trade and investment policy liberalisation that has been carried out
by India and the market failures associated with non‐strategic trade and investment
liberalisation. This clearly points to the need to re‐evaluate the premises underlying
India’s current trade and industrial policies, including those being pursued with the
purported objective of promoting GVC engagement.
Trade and investment policies and other industrial policy measures for skill and
technological capability development have to be coordinated within a strategic industrial
development vision to achieve sustainable development of any industry. This implies
that along with vertical industrial policies for upgrading firm‐ and industry‐level
productivity and improved infrastructure, a calibrated approach towards trade and FDI
policies such that they do not negate incentives for value adding local production is an
imperative for enabling domestic firms to engage in global value chains in a sustainable
manner.Government efforts to reinvigorate investments into the electronics industry and
the continuing desire to enter into new FTAs need to keep these policy lessons in mind.
These findings also have implications for other industries and other developing
countries.

36
Annexe 1: Concordance Table for Electronics Products across ISIC Revised Classifications
ISIC (R1) ISIC (R2) ISIC (R3) ISIC (R3.1) Industry Segment
360 3825 2919 2919 Manufacture of weighing machines
3000 3000 Manufacture of office, accounting &
computing machinery
3829 2930 2930 Manufacture of domestic appliances n.e.c.
(domestic cooking ranges, refrigerators,
laundry machines)
370 3832 3110 3110 Manufacture of radio transformers
3120 3120 Manufacture of semi‐conductor circuits
3190 3190 Manufacture of visual and sound signalling
and traffic control apparatus
3210 3210 Manufacture of electronic valves and tubes
and other electronic components including
fixed and variable electronic capacitors
3220 3220 Manufacture of television and radio
transmitters and apparatus for line
telephony and line telegraphy
3230 3230 Manufacture of television and radio
receivers, sound or video recording or
reproducing apparatus and associated goods
and radio transmitters and apparatus for line
telephony and line telegraphy
3311 3311 Manufacture of X‐ray apparatus;
electrotherapeutic apparatus
3312 3312 Manufacture of radar equipment, radio
remote control apparatus
3530 Not
included
Manufacture of communication satellites
391 3851 3311 3311 Manufacture of surgical, medical, dental
equipment, instruments and supplies;
orthopaedic and prosthetic appliances
3312 3312 Manufacture of instruments and appliances
for measuring and controlling equipment,
except industrial process control equipment
3313 3313 Manufacture of industrial process control
equipment

37
ISIC (R1) ISIC (R2) ISIC (R3) ISIC (R3.1) Industry Segment
3852 3000 3000 Manufacture of photo‐copying machines
(R3)
3311 3311 Manufacture of ophthalmic instruments
3312 3312 Manufacture of scientific measuring
instruments
392 3320 3320 Manufacture of optical instruments and
photographic equipment
393 3853 3330 3330 Manufacture of watches and clocks
395 3902 3692 3692 Manufacture of musical instruments

38
References
Amsden, Alice H (1989), Asia’s Next Giant: South Korea and Late Industrialization, Oxford
University Press, Oxford.
Amsden, Alice H (2001), The Rise of “The Rest”: Challenges to the West from Late‐Industrializing
Economies, New York, Oxford University Press.
Athukorala, Prema‐chandra (2003), “Product Fragmentation and trade patterns in East Asia”,
Trade and Development Discussion Paper 2003/21, Division of Economics, Research School of
Pacific and Asian Studies, The Australian National University, Canberra.
Chandrasekhar, C. P. (2005). “The Diffusion of Information Technology and Implications for
Development: A perspective based on the Indian experience in ICTs and Indian Economic
Development, Ashwani Saith and M. Vijayabasker (ed), Sage Publications, New Delhi.
DEITy (2012), National Policy on Electronics (2012), Department of Electronics and
Information Technology (DIETy), Ministry of Communications and Information
Technology. Government of India.
DEITy, Report of the Working Group on Information Technology Sector, Twelfth Five Year
Plan (2012 – 17), Ministry of Communications and Information Technology., Government
of India.
Department of Scientific and Industrial Research, IT Hardware and Electronics, D&B Report.
Ernst & Young and FICCI (2015), Study on Indian Electronics and Consumer Durables
Segment.
Ernst, Dieter (2014). Upgrading Indiaʹs Electronics Manufacturing Industry: Regulatory
Reform and Industrial Policy, A Special Study, Honolulu, Hawaii: East‐West Centre.
Fontagne, L., M. Freudenberg, and G. Gaulier, (2006), “A Systematic Decomposition of World
Trade into Horizontal and Vertical IIT,” Weltwirtschaftliches Archiv, 142 (3), 459–475.
Fontagné, Lionel, Michael Freudenberg and Guillaume Gaulier (2005), “Disentangling
Horizontal and Vertical Intra‐Industry Trade”, CEPII Working Paper No. 2005‐10, CEPII,
Paris.
Francis, Smitha (2009), “Impact of China and India’s Emergence on Developing Asia: A case
study of Thailand” in IDEAs (2009), “China, India and Asia: The Anatomy of an Economic
Relationship”, available at http://www.networkideas.org/ideasact/nov09/Draft_Report.pdf
Francis, Smitha (2011), ‘The ASEAN‐India Free Trade Agreement: A sectoral impact analysis
of increased trade integration in goods’, Economic & Political Weekly, Vol. XIVI, No. 2, pp.
46‐55.
Francis, Smitha (2015a), “India’s Manufacturing Sector Exports: A Focus on Missing Domestic
Inter‐sectoral Linkages”, ISID Working Paper No. 182, ISID, New Delhi.
Francis, Smitha (2015b), “Preferential Trade Agreements: An exploration into emerging issues
in Indiaʹs changing trade policy landscape”, in Ghosh, Jayati (ed.) India and the World
Economy, ICSSR and Oxford University Press, New Delhi.

39
Francis, Smitha and Murali Kallummal (2013), “India’s Comprehensive Trade Agreements:
Implications for development trajectory”, Economic & Political Weekly, Vol. XlVIII, No. 31,
pp. 109‐122.
Government of India, Ministry of Commerce & Industry, Department of Industrial Policy &
Promotion (Manufacturing Policy Section), “National Manufacturing Policy 2011”. Press
Note no. 2 (2011 Series).
India Electronics and Semiconductor Association (IESA) (2014), Indian Electronic System
Design and Manufacturing (ESDM) Disability Identification Study, IESA‐E&Y Joint Study,
Bangalore.
Joseph, K J (1989), “Bridling Growth of Electronics?”, Economic & Political Weekly, Vol. 24 (16),
pp. 855‐56.
Joseph, K.J and Govindan Parayil (2006), ‘Trade Liberalization and Digital Divide: An
Analysis of the Information Technology Agreement of WTO’, CDS Working Paper No. 381,
Centre for Development Studies, Thiruvananthapuram.
Joseph, T. J. and V. Nagi Reddy (2009), “FDI Spillovers and Export Performance of Indian
Manufacturing Firms after Liberalisation”, Economic & Political Weekly, Vol. XLIV, No. 52,
pp. 97‐105.
Kallummal, Murali (2012), ʺProcess of Trade Liberalisation under the Information Technology
Agreement (ITA): The Indian Experienceʺ, CWS Working Paper No. CWS/WP/200/3, Centre
for WTO Studies, New Delhi.
Kallummal, Murali and Smitha Francis (2012), “Impact of Sectoral Trade Liberalization under
the WTO’s Information Technology Agreement on the Indian Electronics Industry”, Paper
presented at the APEA Annual Conference, Thammasat University, Bangkok.
Khan, Mushtaq H (2009), “Learning, Technology Acquisition and Governance Challenges in
Developing Countries”, DFID Research Paper Series on Governance for Growth, School of
Oriental and African Studies, University of London.
Kumar, Nagesh and Joseph K. J. (2004), “National Innovation Systems and India’s IT
Capability: Are there any Lessons for ASEAN New Comers?”, RIS Discussion Paper No.
72/2004, New Delhi: Research and Information System for Non‐Aligned and other
Developing Countries (RIS).
Kumar, Nagesh (2007), “Regional Economic Integration, Foreign Direct Investment and
Efficiency‐Seeking Industrial Restructuring in Asia: The case of India”, RIS Discussion
Paper 123, RIS, New Delhi.
Majumdar, Rumki (2010), “Indian Electronics Hardware Industry: Growth and Productivity
(1993‐2004)”, Economic and Political Weekly, Vol. XLV, No. 14, pp. 72‐77.
Mani, Sunil (2005), “Innovation Capability in Indiaʹs Telecommunication Equipment
Industry”, in ICTs and Indian Economic Development, Ashwani Saith and M. Vijayabasker
(ed)., Sage Publications, New Delhi.
National Board of Trade (2015), Regulatory Co‐operation and Technical Barriers to Trade
within Transatlantic Trade and Investment Partnership (TTIP), Government of Sweden,

40
available at http://www.kommers.se/Documents/dokumentarkiv/publikationer/2015/Publ‐
Regulatory‐Co‐operation‐and‐Technical‐Barriers‐to‐Trade‐within‐TTIP.pdf
Lall, Sanjaya (1996), Learning from the Asian Tigers‐ Studies in Technology and Industrial Policy,
Macmillan Press, London.
Rao, K.S. Chalapati and Biswajit Dhar (2016), India’s Inward FDI Experience in the Post‐
liberalisation Period, Study Report Sponsored by the Indian Council of Social Science
Research (ICSSR), Institue for Studies in Industrial Development (ISID), New Delhi.
Saraswati, Jyoti (2013), ʺA National Export‐Led Growth Plan: Lessons from the Software
Industryʺ. Economic and Political Weekly, Vol. XLVIII (7), pp. 22–14.
Turkcan, Kemal and Aysegul Ates (2014), “Structure and Determinants of Intra‐Industry
Trade in the U.S. Auto‐Industry”, Journal of International and Global Economic Studies, 2(2),
pp. 15–46.
UNCTAD (2012), Technology and Innovation Report, Geneva.
UNCTAD (2014), Trade and Development Report, Global Governance and Policy Space for
Development, Geneva.
UNCTAD (2016), Trade and Development Report, Structural Transformation for Inclusive and
Sustained Growth, Geneva.
Wade, Robert H (1990), Governing the Market: Economic Theory and the Role of Government in
East Asian Industrialization, Princeton and Oxford, Princeton University Press.