Impact of the Orphan Drug Tax Credit on treatments for … BIO Orphan...Approved orphan drugs-...
40
Impact of the Orphan Drug Tax Credit on treatments for rare diseases Prepared for the Biotechnology Industry Organization and the National Organization for Rare Disorders June 2015
Transcript of Impact of the Orphan Drug Tax Credit on treatments for … BIO Orphan...Approved orphan drugs-...
Impact of the Orphan Drug Tax Credit on treatments for rare diseases
Prepared for the Biotechnology Industry Organization and the National Organization for Rare Disorders
June 2015

Impact of the Orphan Drug Tax Credit on treatments for rare diseases
(Page intentionally left blank)
EY | i
Executive summary
Nearly 30 million Americans suffer from a rare disease or condition. Despite the large
number of patients living with rare diseases, only four percent of rare diseases have an
approved treatment. As such, many patients suffering from a rare disease lack any
treatment options.
Before the Orphan Drug Act (ODA) was enacted in 1983, drug developers were often
hesitant to invest in developing new treatments for rare diseases because the small patient
populations made it difficult to recover development costs. For rare diseases, clinical trial
costs alone can total thousands of dollars per person diagnosed with the disease. Promising
new drugs to treat rare diseases could languish without a sponsor willing to fund further
development – hence the term “orphan drug.”
Rising investment in treatments for rare diseases can be attributed in large part to the
incentives provided by the ODA. Since the law’s enactment, 486 orphan products have been
approved, which includes a mix of more effective formulations, new indications, dosages,
and sources of supply. In that time, more than 200 new orphan drugs have been approved
by the Food and Drug Administration (FDA) – compared with only 34 approved before
enactment of the ODA. This report defines new orphan drugs as new molecular entities
(NMEs) and new biologic license applications (BLAs) that have been approved by the Food
and Drug Administration (FDA).
One of the ODA’s key provisions is the Orphan Drug Tax Credit (ODTC), which is designed
to promote research spending on orphan drug development. The ODTC allows orphan drug
developers to receive a tax credit for 50 percent of qualified clinical trial costs for new
orphan drugs. By lowering development costs, the ODTC makes it more likely that
treatments for rare diseases will advance from the lab and be developed. More general R&D
incentives may also provide important societal benefits but may generally encourage
investment to flow into research activities that carry less risk and offer more reward than
treatments for rare diseases.
This report uses detailed data on the costs and timeline of drug development to construct an
economic model of the impact of the ODTC on the cost of, and investment in, orphan drug
development. This type of cost of capital
framework is a methodology commonly
used to analyze the impacts of changes in
tax policy on investment incentives. This
report’s key findings are:
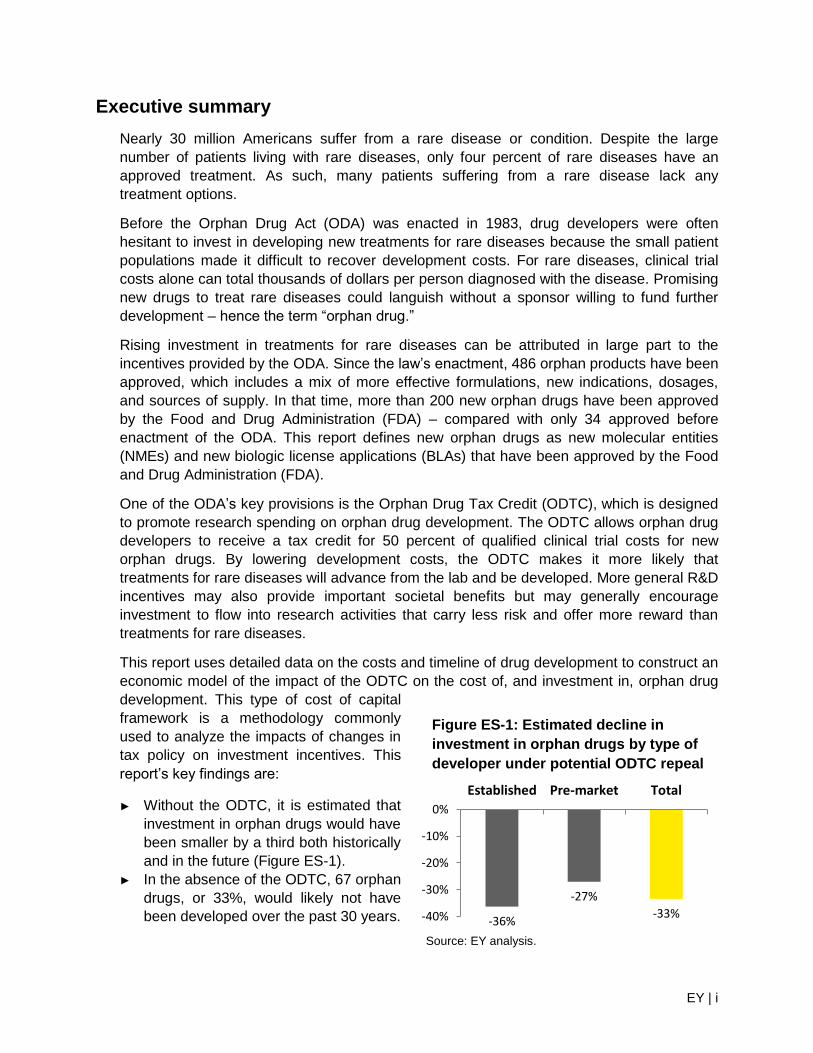
► Without the ODTC, it is estimated that
investment in orphan drugs would have
been smaller by a third both historically
and in the future (Figure ES-1).
► In the absence of the ODTC, 67 orphan
drugs, or 33%, would likely not have
been developed over the past 30 years. -36%
-27%
-33% -40%
-30%
-20%
-10%
0%
Established Pre-market Total
Figure ES-1: Estimated decline in
investment in orphan drugs by type of
developer under potential ODTC repeal
Source: EY analysis.
EY | ii
► Going forward, if the ODTC were repealed, it is estimated that 57, or 33%, fewer new
orphan drugs would be approved over the next 10 years.
As shown in Figure ES-1, pre-market companies without existing drug portfolios would see a
smaller decline because they cannot use tax credits until they begin to have tax liability,
often not until after their first drug is approved. This is not to imply that the ODTC is not
valuable for pre-market companies. In the absence of the ODTC, the net cost to a pre-
market company of developing an orphan drug would increase by 30 percent. Despite the
reduced incentives offered to pre-market companies, smaller companies are heavy users of
the benefits offered by the ODA. Nearly a third of all companies receiving an orphan drug
approval had never had a drug approved before.
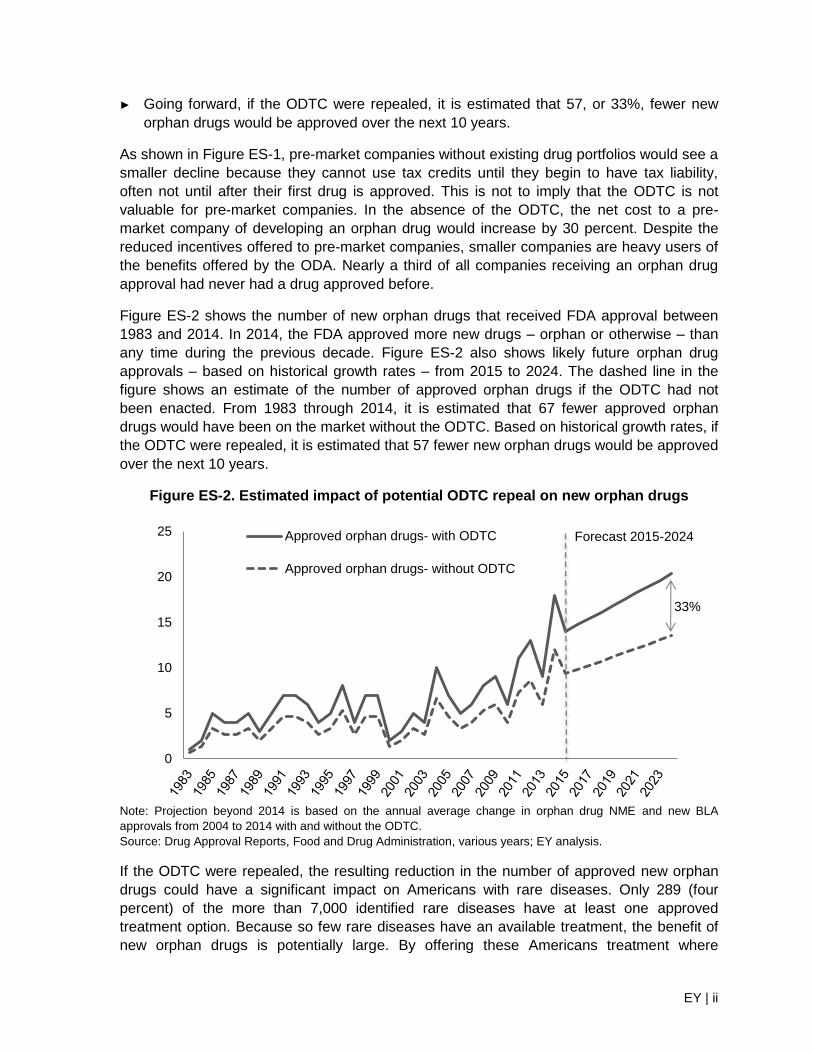
Figure ES-2 shows the number of new orphan drugs that received FDA approval between
1983 and 2014. In 2014, the FDA approved more new drugs – orphan or otherwise – than
any time during the previous decade. Figure ES-2 also shows likely future orphan drug
approvals – based on historical growth rates – from 2015 to 2024. The dashed line in the
figure shows an estimate of the number of approved orphan drugs if the ODTC had not
been enacted. From 1983 through 2014, it is estimated that 67 fewer approved orphan
drugs would have been on the market without the ODTC. Based on historical growth rates, if
the ODTC were repealed, it is estimated that 57 fewer new orphan drugs would be approved
over the next 10 years.
Figure ES-2. Estimated impact of potential ODTC repeal on new orphan drugs
Note: Projection beyond 2014 is based on the annual average change in orphan drug NME and new BLA
approvals from 2004 to 2014 with and without the ODTC.
Source: Drug Approval Reports, Food and Drug Administration, various years; EY analysis.
If the ODTC were repealed, the resulting reduction in the number of approved new orphan
drugs could have a significant impact on Americans with rare diseases. Only 289 (four
percent) of the more than 7,000 identified rare diseases have at least one approved
treatment option. Because so few rare diseases have an available treatment, the benefit of
new orphan drugs is potentially large. By offering these Americans treatment where
0
5
10
15
20
25 Approved orphan drugs- with ODTC
Approved orphan drugs- without ODTC
Forecast 2015-2024
33%

EY | iii
previously none existed, new orphan drugs can affect multiple dimensions of public health
including longevity, participation in everyday activities, mobility, and the ability to work. While
these benefits can be difficult to measure, they are an important part of the benefit new
orphan drugs provide. Patients can benefit from new orphan drugs through longer life spans
and higher quality of life, while society as a whole can benefit from increased patient
productivity and a potential decline in the amount of resources devoted to health care and
related government spending.
EY | iv
Contents
1. Introduction ......................................................................................................................... 1
1.1. History of orphan drugs in the United States ................................................................ 2
2. Barriers to orphan drug development before the ODA......................................................... 3
2.1. Market barriers ............................................................................................................. 3
2.2. Regulatory barriers ...................................................................................................... 4
3. The ODA ............................................................................................................................. 5
3.1. Becoming an orphan drug ............................................................................................ 5
3.2. Major provisions in the ODA ........................................................................................ 6
Box1: Examples of orphan drugs developed since the ODTC ................................................ 7
3.3. Other laws that encourage orphan drug production ...................................................... 8
3.4. Amendments to the ODA ............................................................................................. 9
4. Impact of the ODA .............................................................................................................10
4.1. Increased production of orphan drugs .........................................................................10
4.2. Distribution of orphan drug development .....................................................................11
5. Impact of the ODTC ...........................................................................................................12
5.1. Overview of the ODTC ................................................................................................12
5.2. ODTC case studies .....................................................................................................13
Box 2: Impact of potential repeal of the ODTC .......................................................................15
5.3. Quantifying the effect of repealing the ODTC ..............................................................17
5.4. Impact of the ODTC on the cost of capital ...................................................................18
Box 3: Impact of repealing the ODTC ....................................................................................18
5.5. ODTC and drug development investment ...................................................................19
5.6. Potential impact of repealing the ODTC ......................................................................19
6. Qualitative impact of the ODTC ..........................................................................................22
6.1. Impact of orphan drugs on patients’ lives ....................................................................22
6.2. Economic impact of orphan drugs ...............................................................................23
7. Conclusion .........................................................................................................................24
Appendix A: Rare diseases with at least one FDA-approved treatment .....................................25
Appendix B: Selected orphan drug timeline ...............................................................................29
Appendix C: Search methodology .............................................................................................31
Endnotes ...................................................................................................................................32
EY | 1
Impact of the Orphan Drug Tax Credit on treatments for rare
diseases
1. Introduction
In the United States, nearly one out of every 10 people suffers from a rare disease.1 Rare
diseases are much less likely to have an approved treatment than are more common
diseases (see Appendix A for a list of all rare diseases with at least one Food and Drug
Administration (FDA) approved treatment). For drugs designed to treat patients with rare
diseases, a number of market and regulatory barriers discourage the investment required to
find new, potentially life-saving treatments. The Orphan Drug Act (ODA), passed in 1983,
was designed to reduce these barriers and spur innovation in the development of new
treatments for these patients.
The ODA defines a rare disease as one that affects fewer than 200,000 patients in the
United States, and an orphan drug is any drug intended to treat a rare disease. Prior to the
ODA, drug developers were often hesitant to invest in developing new treatments for
diseases with small patient populations because these treatments offered limited potential to
recover development costs. Promising new drugs to treat rare diseases could languish
without a sponsor willing to fund further development – hence the term “orphan drug.”2
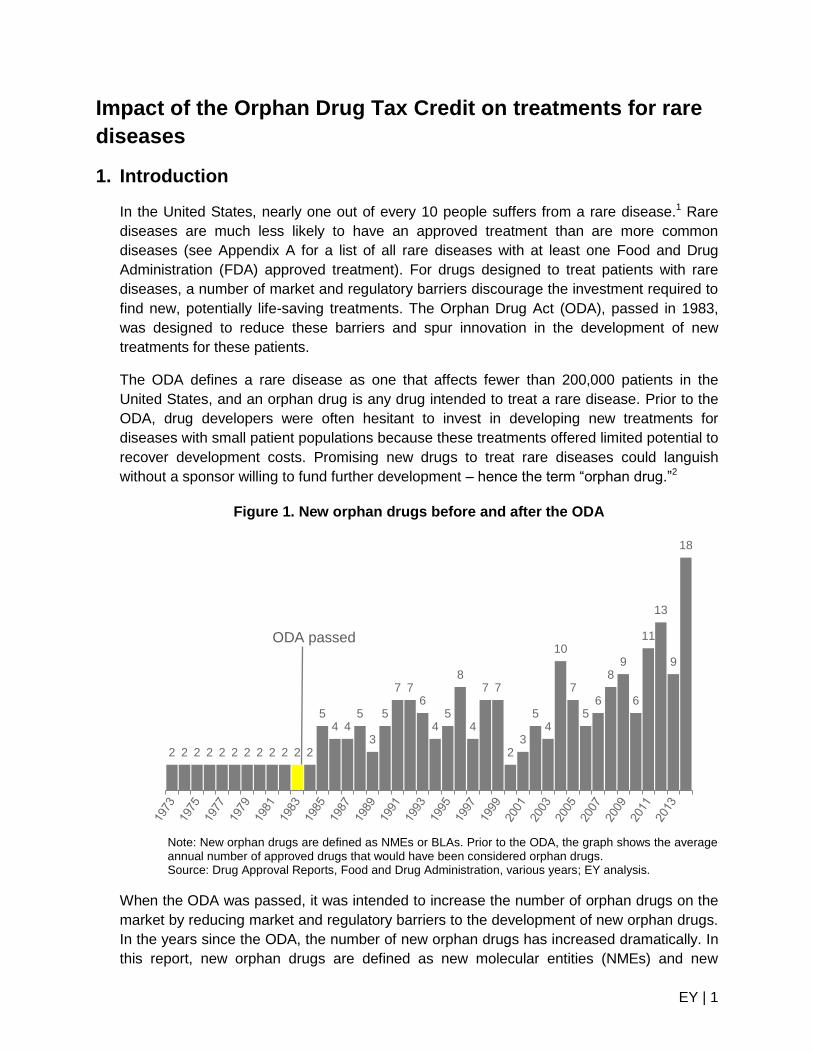
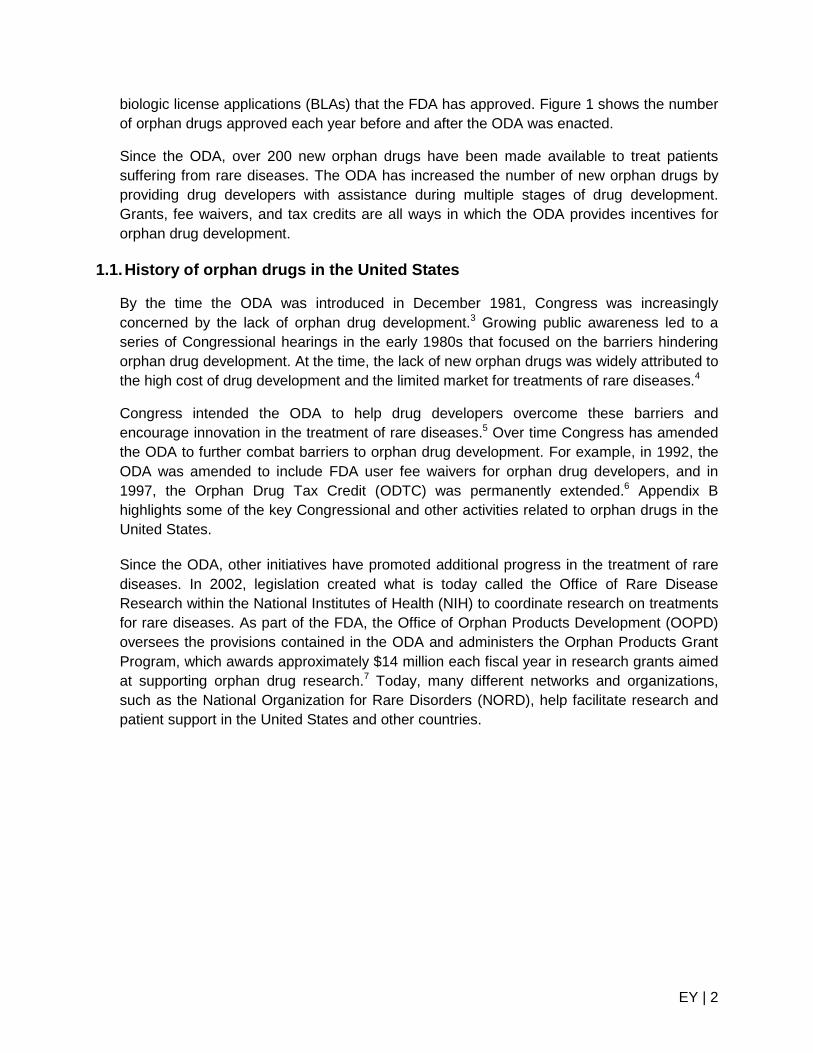
Figure 1. New orphan drugs before and after the ODA
Note: New orphan drugs are defined as NMEs or BLAs. Prior to the ODA, the graph shows the average annual number of approved drugs that would have been considered orphan drugs. Source: Drug Approval Reports, Food and Drug Administration, various years; EY analysis.
When the ODA was passed, it was intended to increase the number of orphan drugs on the
market by reducing market and regulatory barriers to the development of new orphan drugs.
In the years since the ODA, the number of new orphan drugs has increased dramatically. In
this report, new orphan drugs are defined as new molecular entities (NMEs) and new
2 2 2 2 2 2 2 2 2 2 2 2
5 4 4
5
3
5
7 7 6
4 5
8
4
7 7
2 3
5 4
10
7
5 6
8 9
6
11
13
9
18
ODA passed
EY | 2
biologic license applications (BLAs) that the FDA has approved. Figure 1 shows the number
of orphan drugs approved each year before and after the ODA was enacted.
Since the ODA, over 200 new orphan drugs have been made available to treat patients
suffering from rare diseases. The ODA has increased the number of new orphan drugs by
providing drug developers with assistance during multiple stages of drug development.
Grants, fee waivers, and tax credits are all ways in which the ODA provides incentives for
orphan drug development.
1.1. History of orphan drugs in the United States
By the time the ODA was introduced in December 1981, Congress was increasingly
concerned by the lack of orphan drug development.3 Growing public awareness led to a
series of Congressional hearings in the early 1980s that focused on the barriers hindering
orphan drug development. At the time, the lack of new orphan drugs was widely attributed to
the high cost of drug development and the limited market for treatments of rare diseases.4
Congress intended the ODA to help drug developers overcome these barriers and
encourage innovation in the treatment of rare diseases.5 Over time Congress has amended
the ODA to further combat barriers to orphan drug development. For example, in 1992, the
ODA was amended to include FDA user fee waivers for orphan drug developers, and in
1997, the Orphan Drug Tax Credit (ODTC) was permanently extended.6 Appendix B
highlights some of the key Congressional and other activities related to orphan drugs in the
United States.
Since the ODA, other initiatives have promoted additional progress in the treatment of rare
diseases. In 2002, legislation created what is today called the Office of Rare Disease
Research within the National Institutes of Health (NIH) to coordinate research on treatments
for rare diseases. As part of the FDA, the Office of Orphan Products Development (OOPD)
oversees the provisions contained in the ODA and administers the Orphan Products Grant
Program, which awards approximately $14 million each fiscal year in research grants aimed
at supporting orphan drug research.7 Today, many different networks and organizations,
such as the National Organization for Rare Disorders (NORD), help facilitate research and
patient support in the United States and other countries.
EY | 3
2. Barriers to orphan drug development before the ODA
Prior to enactment of the ODA in 1983, very few orphan drugs were available on the market
to treat patients with rare diseases. It is estimated that only 34 orphan drugs were approved
before the ODA.8 There have been over 200 approved since. A combination of market and
regulatory barriers limited the ability of drug developers to bring new orphan drugs to
market, and, while many of those barriers remain in place today, the ODA has significantly
reduced their impact.
2.1. Market barriers
The two most significant market barriers to the development of new orphan drugs are high
development costs and limited patient populations. Each new orphan drug requires a
substantial investment in research and development with limited chance the drug will make
it to market. The small pool of potential patients further reduces a drug developer’s ability to
recover their research investment.
Drug development costs are high in part because relatively few drugs make it through the
development process. By the time compounds enter the preclinical phase of testing, only 1
out of 5 remaining drugs will receive market approval.9 The total research and development
cost to produce a single approved drug includes not only the cost to develop the successful
approved drug, but also the cost of the unsuccessful drugs.
Before the ODA came into effect, academic research began to show rising drug
development costs.10 In the 1970s, the total cost of bringing a new drug to market was $182
million (in 2014 dollars), and by the 1980s, that number had risen to $205 million (in 2014
dollars).11 A 2007 estimate of the total cost to bring a new drug to market is $1.5 billion (in
2014 dollars).12 A not-yet-released study indicates that costs have risen to $2.6 billion (in
2014 dollars).13 The total cost of bringing a new drug to market includes: out-of-pocket costs,
the cost of failures (since most new compounds are never approved), and the cost of
capital.
After a drug receives market approval, the developer can begin to recover its investment in
the discovery and research process. For orphan drugs, the opportunity is diminished due to
the limited pool of potential patients, which is one reason many drug developers find it
difficult to justify the investment required to develop treatments for rare diseases. According
to the ODA, orphan drugs are designed to treat conditions that exist in less than 200,000
patients in the United States, and for many rare diseases, the number of cases may be far
less than 200,000.14
Spreading the cost of developing a new drug over small patient populations could result in a
per-patient cost of tens of thousands of dollars. As a result, prior to the ODA, many
promising discoveries never received the investments required to turn them into viable
orphan drugs.
EY | 4
2.2. Regulatory barriers
In addition to high costs and other market-based disincentives, significant regulatory barriers
existed prior to the ODA. A robust and comprehensive FDA approval process is important to
ensure drugs reaching the market are safe and efficacious, but it also increases the timeline
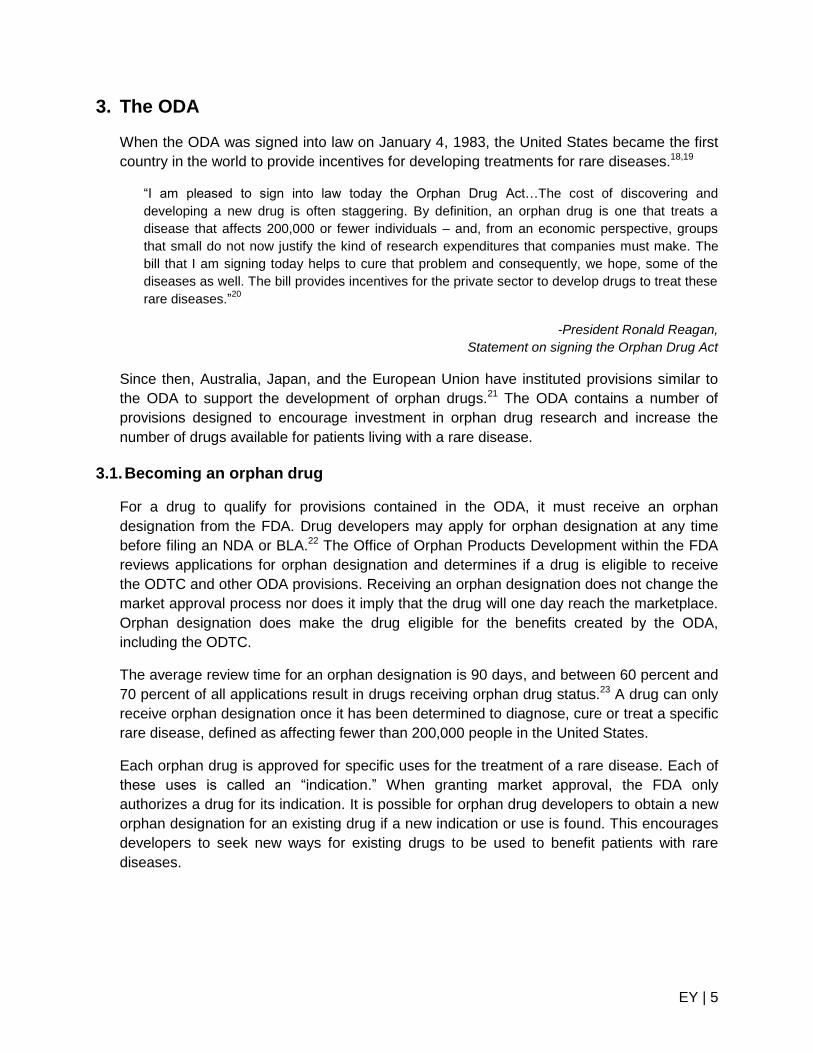
and cost of drug development. As shown in Figure 2, it takes an average of 12.5 years and
$1.5 billion (in 2014 dollars) to bring a new drug from the preclinical stage through FDA
market approval.15 For potential developers of new orphan drugs, who have a limited patient
pool from which to recover these costs, the incentives available under the ODA can be a
factor in determining which investments to pursue.
Figure 2. Typical drug development timeline
Source: Joseph A. DiMasi and Henry G. Grabowski, “The cost of biopharmaceutical R&D: is biotech different?”
Managerial and Decision Economics, (John Wiley & Sons, Ltd, 2007).
Once a new potential drug is discovered it enters preclinical testing during which initial
safety assessments take place in a laboratory. Before being tested in humans (i.e., clinical
trials), the developer must submit an Investigational New Drug Application (IND) to the FDA.
Once the FDA approves the IND, clinical trials can begin.
Clinical testing culminates in Phase III with randomized trials in human volunteers. This
phase can be particularly challenging for developers of orphan drugs who may struggle to
find the necessary number of trial participants to achieve statistically significant results.
If a drug successfully completes each clinical trial phase, the developer can submit a New
Drug Application (NDA) or Biologic License Application (BLA) to the FDA for market
approval. If the FDA grants market approval, the treatment becomes available to patients.
Once a drug becomes available to patients, the costs of development may not end. Though
not included in Figure 2, the FDA can require drug developers to participate in Phase IV
post-market monitoring, which may further increase the overall costs of drug development.16
The span of time between new drug discovery and market approval means there could be
relatively few years remaining of patent protection by the time the drug reaches the market.
This is particularly challenging for orphan drug developers who already face a limited market
from which to recover their research costs. As a result, developers can be discouraged from
investing in drugs with a potentially limited market value.17
EY | 5
3. The ODA
When the ODA was signed into law on January 4, 1983, the United States became the first
country in the world to provide incentives for developing treatments for rare diseases.18,19
“I am pleased to sign into law today the Orphan Drug Act…The cost of discovering and
developing a new drug is often staggering. By definition, an orphan drug is one that treats a
disease that affects 200,000 or fewer individuals – and, from an economic perspective, groups
that small do not now justify the kind of research expenditures that companies must make. The
bill that I am signing today helps to cure that problem and consequently, we hope, some of the
diseases as well. The bill provides incentives for the private sector to develop drugs to treat these
rare diseases.”20
-President Ronald Reagan,
Statement on signing the Orphan Drug Act
Since then, Australia, Japan, and the European Union have instituted provisions similar to
the ODA to support the development of orphan drugs.21 The ODA contains a number of
provisions designed to encourage investment in orphan drug research and increase the
number of drugs available for patients living with a rare disease.
3.1. Becoming an orphan drug
For a drug to qualify for provisions contained in the ODA, it must receive an orphan
designation from the FDA. Drug developers may apply for orphan designation at any time
before filing an NDA or BLA.22 The Office of Orphan Products Development within the FDA
reviews applications for orphan designation and determines if a drug is eligible to receive
the ODTC and other ODA provisions. Receiving an orphan designation does not change the
market approval process nor does it imply that the drug will one day reach the marketplace.
Orphan designation does make the drug eligible for the benefits created by the ODA,
including the ODTC.
The average review time for an orphan designation is 90 days, and between 60 percent and
70 percent of all applications result in drugs receiving orphan drug status.23 A drug can only
receive orphan designation once it has been determined to diagnose, cure or treat a specific
rare disease, defined as affecting fewer than 200,000 people in the United States.
Each orphan drug is approved for specific uses for the treatment of a rare disease. Each of
these uses is called an “indication.” When granting market approval, the FDA only
authorizes a drug for its indication. It is possible for orphan drug developers to obtain a new
orphan designation for an existing drug if a new indication or use is found. This encourages
developers to seek new ways for existing drugs to be used to benefit patients with rare
diseases.
EY | 6
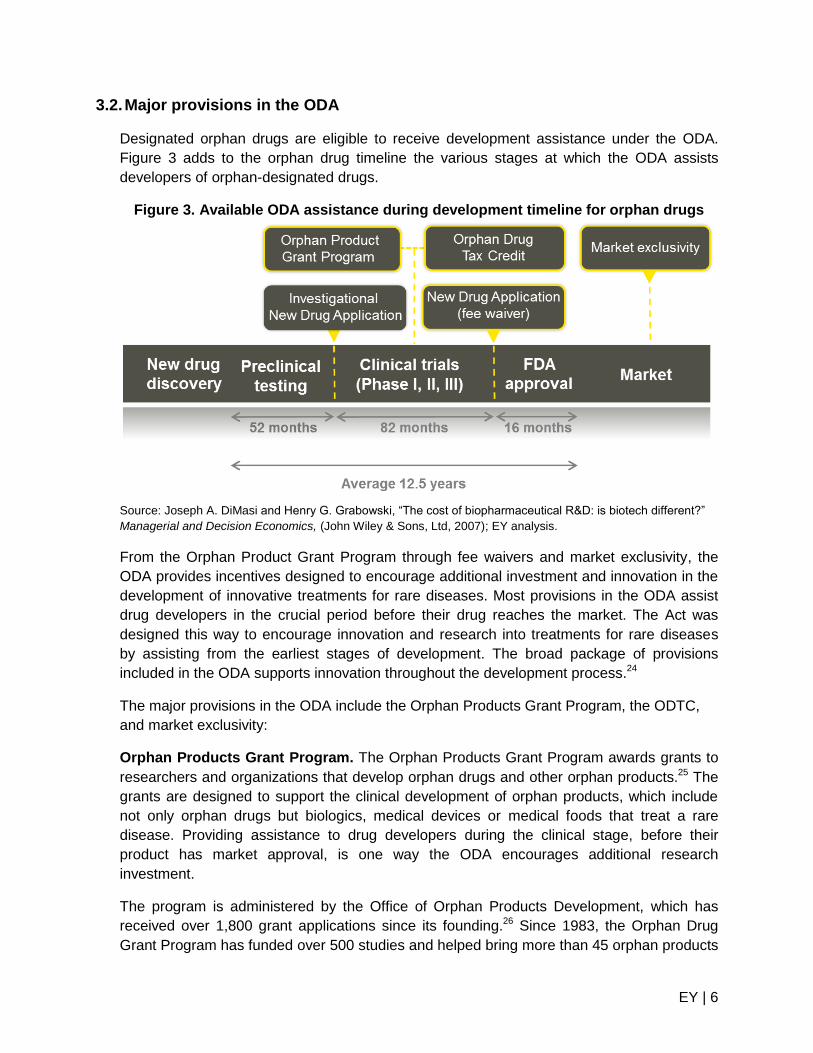
3.2. Major provisions in the ODA
Designated orphan drugs are eligible to receive development assistance under the ODA.
Figure 3 adds to the orphan drug timeline the various stages at which the ODA assists
developers of orphan-designated drugs.
Figure 3. Available ODA assistance during development timeline for orphan drugs
Source: Joseph A. DiMasi and Henry G. Grabowski, “The cost of biopharmaceutical R&D: is biotech different?”
Managerial and Decision Economics, (John Wiley & Sons, Ltd, 2007); EY analysis.
From the Orphan Product Grant Program through fee waivers and market exclusivity, the
ODA provides incentives designed to encourage additional investment and innovation in the
development of innovative treatments for rare diseases. Most provisions in the ODA assist
drug developers in the crucial period before their drug reaches the market. The Act was
designed this way to encourage innovation and research into treatments for rare diseases
by assisting from the earliest stages of development. The broad package of provisions
included in the ODA supports innovation throughout the development process.24
The major provisions in the ODA include the Orphan Products Grant Program, the ODTC,
and market exclusivity:
Orphan Products Grant Program. The Orphan Products Grant Program awards grants to
researchers and organizations that develop orphan drugs and other orphan products.25 The
grants are designed to support the clinical development of orphan products, which include
not only orphan drugs but biologics, medical devices or medical foods that treat a rare
disease. Providing assistance to drug developers during the clinical stage, before their
product has market approval, is one way the ODA encourages additional research
investment.
The program is administered by the Office of Orphan Products Development, which has
received over 1,800 grant applications since its founding.26 Since 1983, the Orphan Drug
Grant Program has funded over 500 studies and helped bring more than 45 orphan products
EY | 7
to market that otherwise may not have been
able to attract enough outside investment.27
The Orphan Products Grant Program awards
approximately $14 million for orphan product
research grants per fiscal year.28
ODTC. The ODTC offers drug developers a tax
credit equal to 50 percent of qualified clinical
trial costs related to the development of
designated orphan drugs. Average out-of-
pocket costs incurred by drug developers
during the clinical trial phase are $425 million
per approved drug, in 2014 dollars.29 The
clinical trial costs covered by the ODTC are a
portion of the total cost of bringing a new drug
to market.
Like most provisions in the ODA, the ODTC
offers assistance before drugs have received
market approval. This helps to alleviate some of
the risk developers face when making large
investments in treatments for rare diseases
where the ability to recover their costs from very
small patient populations may be uncertain.
Because the ODTC is a non-refundable tax
credit, pre-market drug developers – those
without tax liability – cannot use their ODTC
immediately even though they incur the same
costs as established developers. However, the
ODTC can be carried forward to future tax
years until the pre-market drug developer has
generated sufficient federal income tax to utilize
the tax credit, up to 20 years.
The ODTC encourages additional investment in
orphan drug development by reducing the
investment barrier – sometimes called the cost
of capital – for drug developers. This barrier can
be especially large for small, start-up drug
developers who often face additional funding
constraints.
Market exclusivity. The FDA grants market
exclusivity for different periods of time and for
one of several reasons, including for an orphan
drug, a new chemical, a pediatric application, or
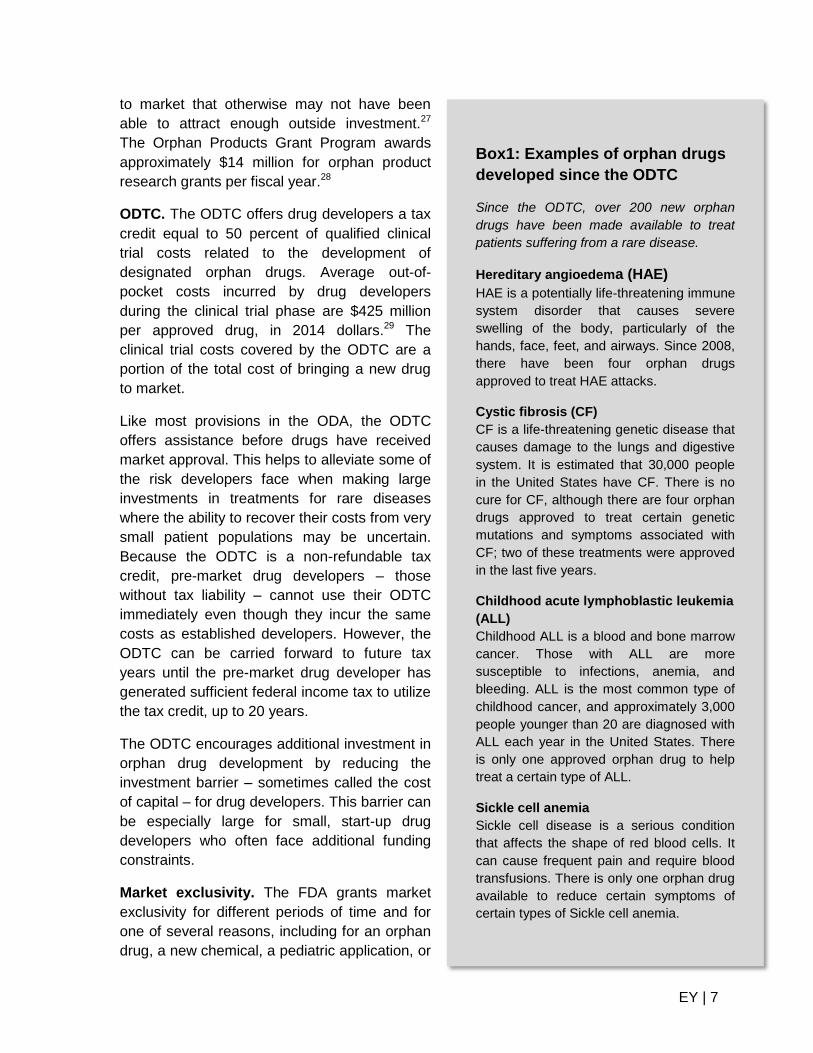
Box1: Examples of orphan drugs
developed since the ODTC
Since the ODTC, over 200 new orphan
drugs have been made available to treat
patients suffering from a rare disease.
Hereditary angioedema (HAE)
HAE is a potentially life-threatening immune
system disorder that causes severe
swelling of the body, particularly of the
hands, face, feet, and airways. Since 2008,
there have been four orphan drugs
approved to treat HAE attacks.
Cystic fibrosis (CF)
CF is a life-threatening genetic disease that
causes damage to the lungs and digestive
system. It is estimated that 30,000 people
in the United States have CF. There is no
cure for CF, although there are four orphan
drugs approved to treat certain genetic
mutations and symptoms associated with
CF; two of these treatments were approved
in the last five years.
Childhood acute lymphoblastic leukemia
(ALL)
Childhood ALL is a blood and bone marrow
cancer. Those with ALL are more
susceptible to infections, anemia, and
bleeding. ALL is the most common type of
childhood cancer, and approximately 3,000
people younger than 20 are diagnosed with
ALL each year in the United States. There
is only one approved orphan drug to help
treat a certain type of ALL.
Sickle cell anemia
Sickle cell disease is a serious condition
that affects the shape of red blood cells. It
can cause frequent pain and require blood
transfusions. There is only one orphan drug
available to reduce certain symptoms of
certain types of Sickle cell anemia.
EY | 8
a patent challenge. In the case of orphan drugs, market exclusivity is the exclusive right to
sell a specific orphan drug for treatment of a specific rare disease. The FDA awards orphan
drug developers seven years of market exclusivity, which is intended to provide them the
opportunity to recover the significant investment required to bring a drug to market. It is the
only major ODA provision to apply after market approval.
Drug patents are granted for 20 years, but, because it takes an average of 12.5 years to
complete the FDA drug approval process, orphan drugs can reach the market with relatively
few years of patent protection remaining. Market exclusivity extends the time orphan drug
developers have to recover their investment. The smaller markets for orphan drugs make it
harder for developers to recover costs through sales during the short window of protection
granted by a patent. Drugs developed for more common diseases are better able to spread
those costs over larger patient populations.
Market exclusivity is designed to balance the need to provide additional incentives for
orphan drug development and encourage innovations that benefit patients. Market
exclusivity does not prohibit other drug developers from receiving market approval for a
different orphan drug for the same condition. In addition, if a new drug is more effective,
safer, or provides a major contribution to patient care, it may be introduced even if an earlier
drug’s market exclusivity is still in effect.
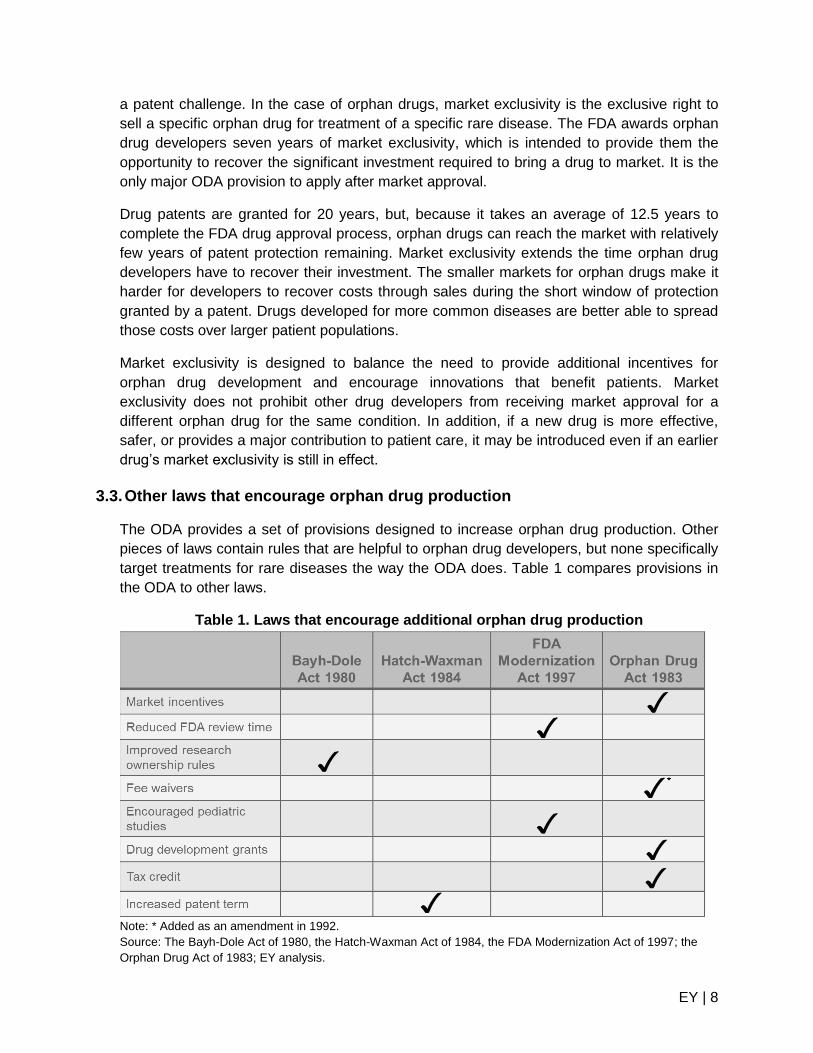
3.3. Other laws that encourage orphan drug production
The ODA provides a set of provisions designed to increase orphan drug production. Other
pieces of laws contain rules that are helpful to orphan drug developers, but none specifically
target treatments for rare diseases the way the ODA does. Table 1 compares provisions in
the ODA to other laws.
Table 1. Laws that encourage additional orphan drug production
Note: * Added as an amendment in 1992.
Source: The Bayh-Dole Act of 1980, the Hatch-Waxman Act of 1984, the FDA Modernization Act of 1997; the
Orphan Drug Act of 1983; EY analysis.

EY | 9
The Bayh-Dole Act (1980) updated research ownership rules by allowing researchers
funded in part by federal funds or grants to retain ownership of their inventions. In 1984, the
Hatch-Waxman Act (also known as the Drug Price Competition and Patent Term
Restoration Act) addressed the pharmaceutical industry’s problem of shorter effective patent
terms by allowing patents to be extended for the number of years the drug is reviewed by
the FDA plus half the time the drug is in preclinical trials (maximum extension of 5 years).
Longer patent terms incentivize pharmaceutical companies to pursue treatments that might
be more costly to develop because they have longer patent terms post-approval to recover
their investment. The market exclusivity provision in the ODA follows the same principle by
guaranteeing drug developers a fixed length of time to recover their research costs, though
unlike the Hatch-Waxman Act, it applies to both patentable and un-patentable drugs.
The FDA Modernization Act of 1997 (FDAMA) includes multiple provisions, but most
importantly for orphan drugs, it increased patient access to information about experimental
treatments, created an accelerated review process for important medications, and created
the Pediatric Exclusivity Extension, which gives developers who conduct pediatric clinical
trials an additional six months of market exclusivity.30 Approximately 50 percent of those
affected by rare diseases are children.31
As part of its goal to increase access to information, the FDAMA created a data bank with
information on clinical trials for serious or life-threatening diseases where patients can see
eligibility criteria to participate in clinical trials and contact the sponsor if they wish to
participate. This is especially useful for those suffering from a rare disease as it can be
difficult to find a sufficient number of participants for clinical trials.32
3.4. Amendments to the ODA
Since its enactment in 1983, Congress has repeatedly amended the ODA to include
additional incentives and support for orphan drug development. Some changes have simply
improved the clarity and focus of the provisions, such as the 1984 amendments to the ODA,
which defined rare diseases as affecting fewer than 200,000 patients in the United States.
Others have strengthened the original Act, such as by extending market exclusivity to
patentable, as well as un-patentable products.33 Congress waived certain fees for orphan
drug developers in 1992, and in 1997 permanently extended the ODTC. According to the
FDA, fee waivers for orphan drug developers can total $2 million, which can offer significant
assistance, especially for small, pre-market developers.34
The permanency of the ODTC may enhance its ability to incentivize additional investments
in orphan drugs. Given the long and varied time period required to develop an orphan drug,
uncertainty around the ODTC’s status could discourage developers from committing to the
process. As a result, fewer developers might be willing to invest in research and
development if they believed the ODTC was not permanent.
EY | 10
4. Impact of the ODA
On average, in the decade before the ODA, only two new orphan drugs were produced each
year.35 Post-ODA, there has been a dramatic increase in the number of new orphan drugs
brought to market. The number of new orphan drugs in the development pipeline has
increased rapidly as well.
“Enactment of the Orphan Drug Act in 1983 has proved to be a very successful venture in public
policy, focusing private dollars and intellect on these vexing and often fatal diseases.”36
-Senator Ron Wyden (D-OR), 4 October 1994,
Statement on the introduction of the Office of Rare Disease Research Act
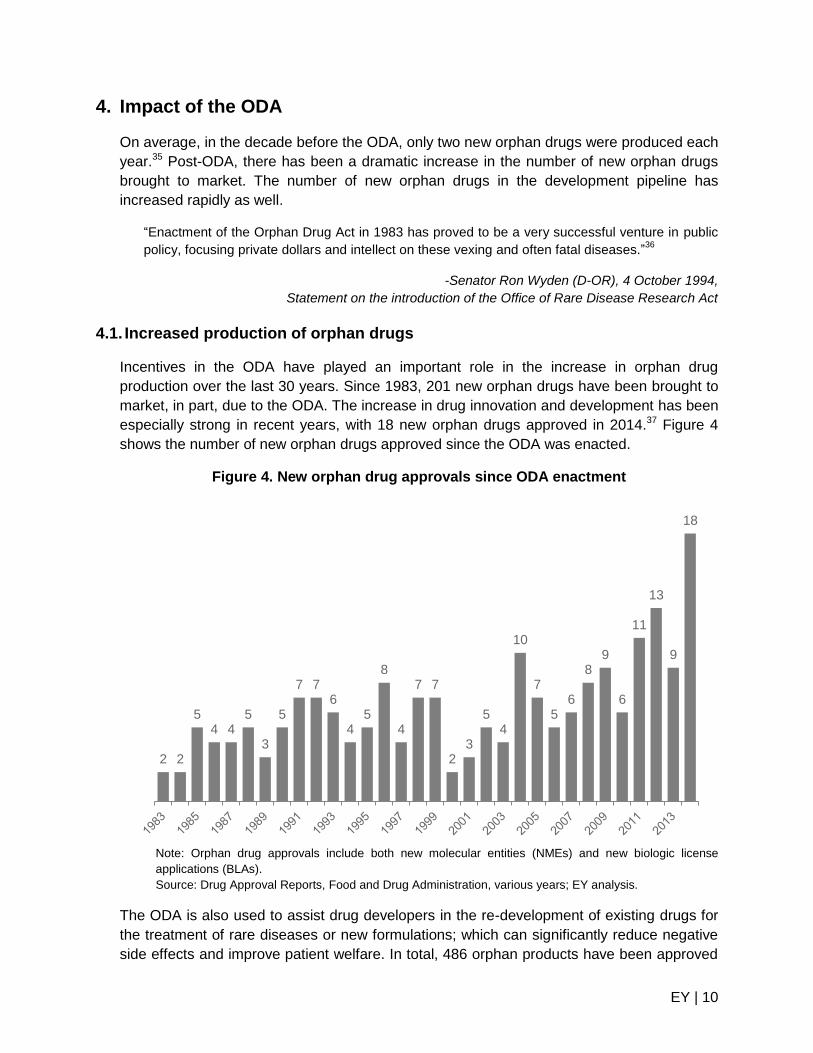
4.1. Increased production of orphan drugs
Incentives in the ODA have played an important role in the increase in orphan drug
production over the last 30 years. Since 1983, 201 new orphan drugs have been brought to
market, in part, due to the ODA. The increase in drug innovation and development has been
especially strong in recent years, with 18 new orphan drugs approved in 2014.37 Figure 4
shows the number of new orphan drugs approved since the ODA was enacted.
Figure 4. New orphan drug approvals since ODA enactment
Note: Orphan drug approvals include both new molecular entities (NMEs) and new biologic license
applications (BLAs).
Source: Drug Approval Reports, Food and Drug Administration, various years; EY analysis.
The ODA is also used to assist drug developers in the re-development of existing drugs for
the treatment of rare diseases or new formulations; which can significantly reduce negative
side effects and improve patient welfare. In total, 486 orphan products have been approved
2 2
5 4 4
5
3
5
7 7 6
4 5
8
4
7 7
2 3
5 4
10
7
5 6
8 9
6
11
13
9
18
EY | 11
since ODA enactment.38 This includes a mix of more effective formulations, new indications,
dosages, sources of supply, and other changes that have illustrated clinical superiority.39
While not all approvals represent a new drug, they have the potential to improve outcomes
for the patients they were designed to treat.
The development pipeline for new orphan drugs also continues to increase. Between 2004
and 2014, the FDA has awarded nearly 2,000 orphan designations.40 That includes
designations for new drugs, as well as other product improvements or updates.
4.2. Distribution of orphan drug development
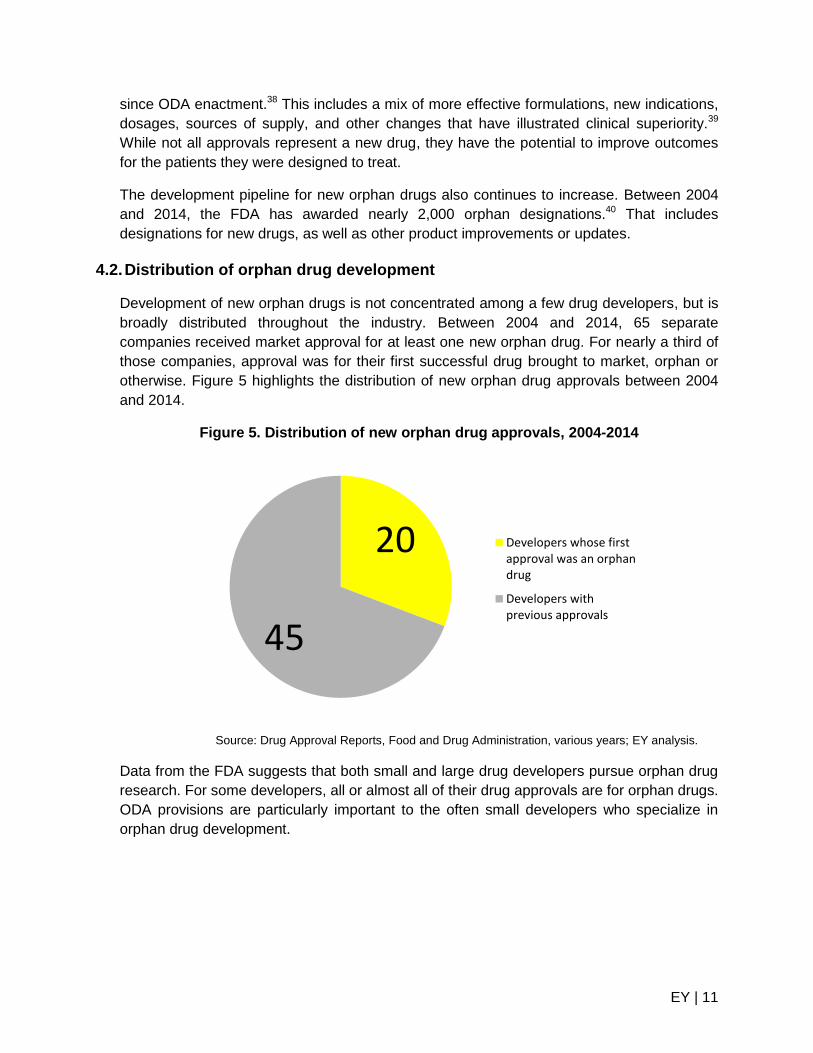
Development of new orphan drugs is not concentrated among a few drug developers, but is
broadly distributed throughout the industry. Between 2004 and 2014, 65 separate
companies received market approval for at least one new orphan drug. For nearly a third of
those companies, approval was for their first successful drug brought to market, orphan or
otherwise. Figure 5 highlights the distribution of new orphan drug approvals between 2004
and 2014.
Figure 5. Distribution of new orphan drug approvals, 2004-2014
Source: Drug Approval Reports, Food and Drug Administration, various years; EY analysis.
Data from the FDA suggests that both small and large drug developers pursue orphan drug
research. For some developers, all or almost all of their drug approvals are for orphan drugs.
ODA provisions are particularly important to the often small developers who specialize in
orphan drug development.
20
45
Developers whose firstapproval was an orphandrug
Developers withprevious approvals
EY | 12
5. Impact of the ODTC
A central provision of the ODA is the ODTC, which allows orphan drug developers to receive
a tax credit for a portion of their clinical trial costs. The ODTC provides an incentive for drug
developers to invest additional resources in orphan drug development. The ODTC reduces
the size of the investment barrier – sometimes called the cost of capital – for drug
developers.
“Few provisions of the tax code can claim to have clearly reduced human suffering and to have
expanded our store of medical knowledge. This credit has done both.”41
-Senator Orrin Hatch (R-UT), 20 July 1995,
Statement on 1995 amendment to the Orphan Drug Act
5.1. Overview of the ODTC
The ODTC allows orphan drug developers to claim a tax credit for up to 50 percent of
qualified clinical testing expenses. Clinical testing costs are a subset of the total cost to bring
a new drug to market. Qualified expenses for the ODTC include certain human clinical
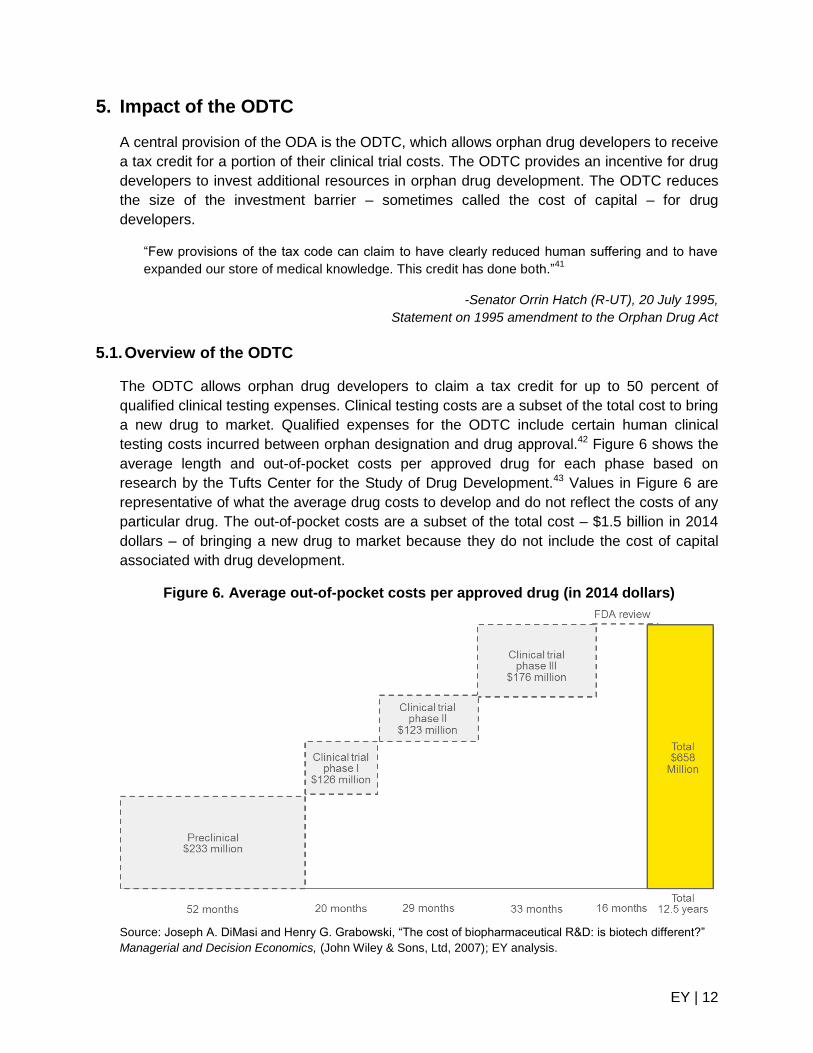
testing costs incurred between orphan designation and drug approval.42 Figure 6 shows the
average length and out-of-pocket costs per approved drug for each phase based on
research by the Tufts Center for the Study of Drug Development.43 Values in Figure 6 are
representative of what the average drug costs to develop and do not reflect the costs of any
particular drug. The out-of-pocket costs are a subset of the total cost – $1.5 billion in 2014
dollars – of bringing a new drug to market because they do not include the cost of capital
associated with drug development.
Figure 6. Average out-of-pocket costs per approved drug (in 2014 dollars)
Source: Joseph A. DiMasi and Henry G. Grabowski, “The cost of biopharmaceutical R&D: is biotech different?”
Managerial and Decision Economics, (John Wiley & Sons, Ltd, 2007); EY analysis.
EY | 13
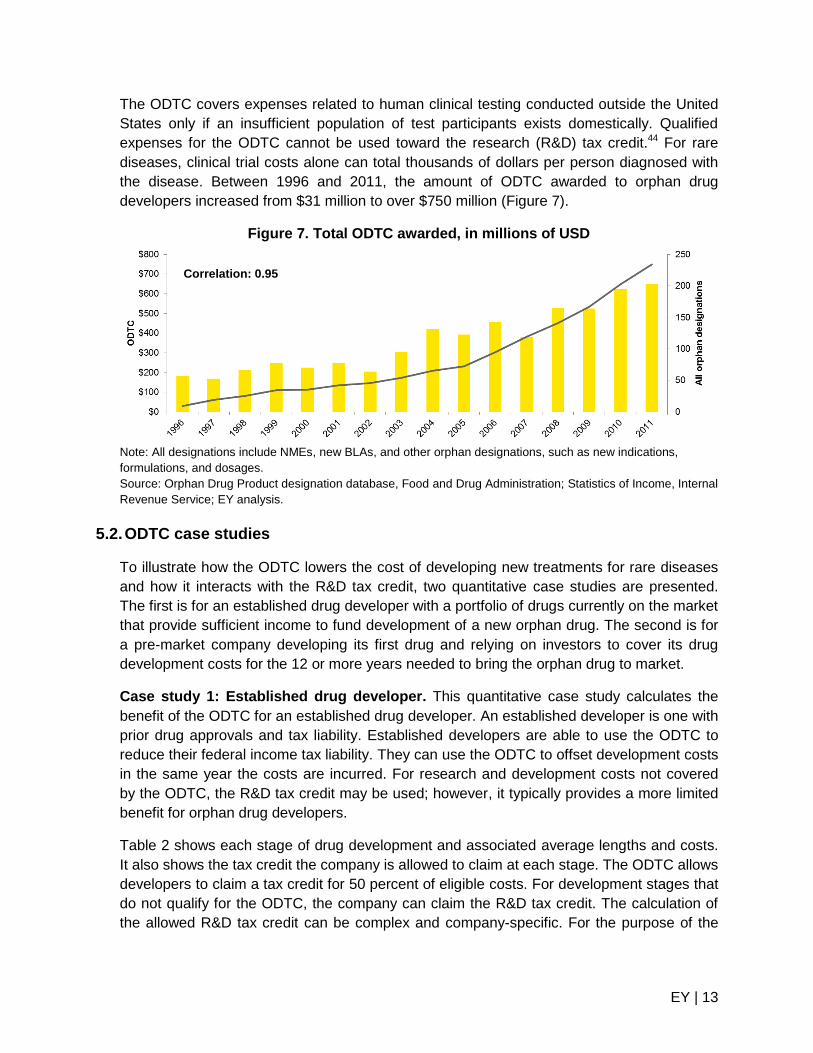
The ODTC covers expenses related to human clinical testing conducted outside the United
States only if an insufficient population of test participants exists domestically. Qualified
expenses for the ODTC cannot be used toward the research (R&D) tax credit.44 For rare
diseases, clinical trial costs alone can total thousands of dollars per person diagnosed with
the disease. Between 1996 and 2011, the amount of ODTC awarded to orphan drug
developers increased from $31 million to over $750 million (Figure 7).
Figure 7. Total ODTC awarded, in millions of USD
Note: All designations include NMEs, new BLAs, and other orphan designations, such as new indications,
formulations, and dosages.
Source: Orphan Drug Product designation database, Food and Drug Administration; Statistics of Income, Internal
Revenue Service; EY analysis.
5.2. ODTC case studies
To illustrate how the ODTC lowers the cost of developing new treatments for rare diseases
and how it interacts with the R&D tax credit, two quantitative case studies are presented.
The first is for an established drug developer with a portfolio of drugs currently on the market
that provide sufficient income to fund development of a new orphan drug. The second is for
a pre-market company developing its first drug and relying on investors to cover its drug
development costs for the 12 or more years needed to bring the orphan drug to market.
Case study 1: Established drug developer. This quantitative case study calculates the
benefit of the ODTC for an established drug developer. An established developer is one with
prior drug approvals and tax liability. Established developers are able to use the ODTC to
reduce their federal income tax liability. They can use the ODTC to offset development costs
in the same year the costs are incurred. For research and development costs not covered
by the ODTC, the R&D tax credit may be used; however, it typically provides a more limited
benefit for orphan drug developers.
Table 2 shows each stage of drug development and associated average lengths and costs.
It also shows the tax credit the company is allowed to claim at each stage. The ODTC allows
developers to claim a tax credit for 50 percent of eligible costs. For development stages that
do not qualify for the ODTC, the company can claim the R&D tax credit. The calculation of
the allowed R&D tax credit can be complex and company-specific. For the purpose of the
Correlation: 0.95
EY | 14
case studies presented in Table 2 and Table 3, the R&D tax credit is assumed to cover six
percent of eligible drug development expenses.45
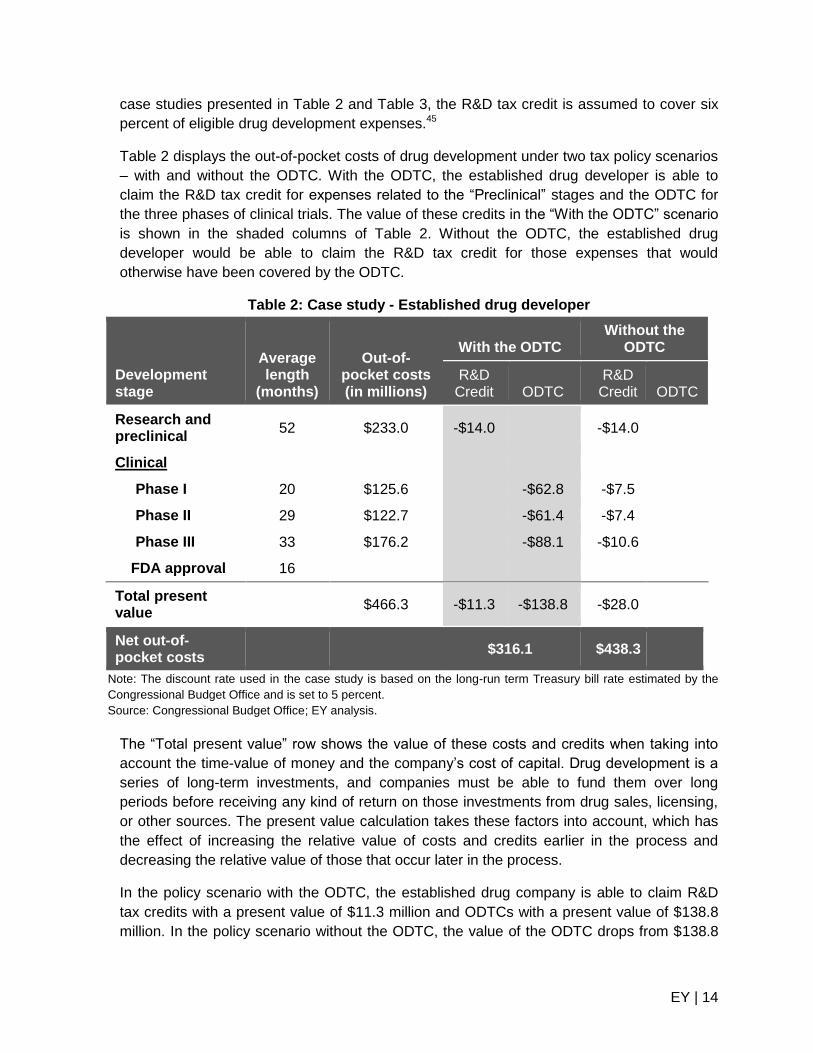
Table 2 displays the out-of-pocket costs of drug development under two tax policy scenarios
– with and without the ODTC. With the ODTC, the established drug developer is able to
claim the R&D tax credit for expenses related to the “Preclinical” stages and the ODTC for
the three phases of clinical trials. The value of these credits in the “With the ODTC” scenario
is shown in the shaded columns of Table 2. Without the ODTC, the established drug
developer would be able to claim the R&D tax credit for those expenses that would
otherwise have been covered by the ODTC.
Table 2: Case study - Established drug developer
Development stage
Average length
(months)
Out-of-pocket costs (in millions)
With the ODTC Without the
ODTC
R&D Credit ODTC
R&D Credit ODTC
Research and preclinical
52 $233.0 -$14.0
-$14.0
Clinical
Phase I 20 $125.6
-$62.8 -$7.5
Phase II 29 $122.7
-$61.4 -$7.4
Phase III 33 $176.2
-$88.1 -$10.6
FDA approval 16
Total present value
$466.3 -$11.3 -$138.8 -$28.0
Net out-of-pocket costs
$316.1 $438.3
Note: The discount rate used in the case study is based on the long-run term Treasury bill rate estimated by the
Congressional Budget Office and is set to 5 percent.
Source: Congressional Budget Office; EY analysis.
The “Total present value” row shows the value of these costs and credits when taking into
account the time-value of money and the company’s cost of capital. Drug development is a
series of long-term investments, and companies must be able to fund them over long
periods before receiving any kind of return on those investments from drug sales, licensing,
or other sources. The present value calculation takes these factors into account, which has
the effect of increasing the relative value of costs and credits earlier in the process and
decreasing the relative value of those that occur later in the process.
In the policy scenario with the ODTC, the established drug company is able to claim R&D
tax credits with a present value of $11.3 million and ODTCs with a present value of $138.8
million. In the policy scenario without the ODTC, the value of the ODTC drops from $138.8
EY | 15
million to zero and the R&D tax credit increases from $11.3 million to $28.0 million. The
increased R&D tax credit would be about one-tenth of the lost ODTC.
The “Net out-of-pocket costs” row shows the present value of the out-of-pocket costs less
the present value of the tax credits received. For the policy scenario with the ODTC, the cost
for an established drug developer to develop a new drug is reduced from $466.3 million to
$316.1 million. For the scenario without the ODTC, the available R&D tax credits would
reduce the cost to develop a new drug from $466.3
million to $438.3 million.
For this established drug developer, the ODTC
lowers the net out-of-pocket cost of developing a
new orphan drug by $122.2 million (the difference
between the two policy scenarios). By reducing the
cost of development by more than one-third, the
ODTC helps developers to recoup their investment in
orphan drug research. The additional research
investment generated by the ODTC is expected to
lead to future increases in the number of new orphan
drugs available for patients suffering from a rare
disease.
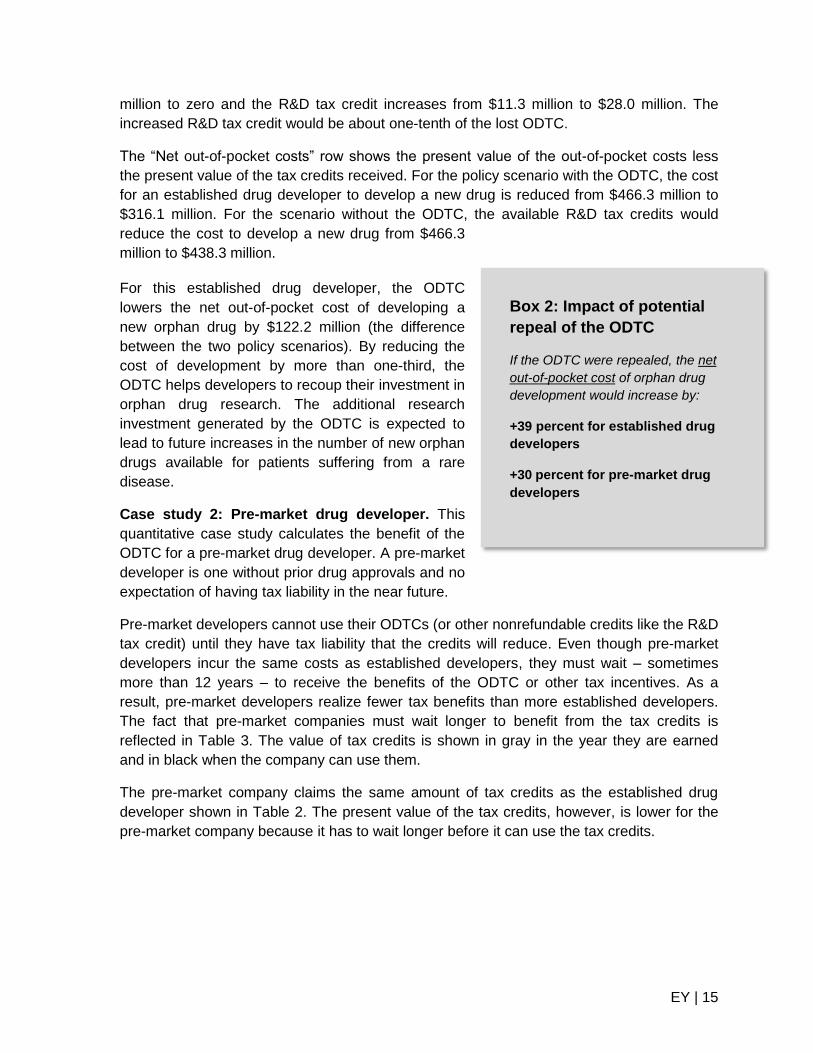
Case study 2: Pre-market drug developer. This
quantitative case study calculates the benefit of the
ODTC for a pre-market drug developer. A pre-market
developer is one without prior drug approvals and no
expectation of having tax liability in the near future.
Pre-market developers cannot use their ODTCs (or other nonrefundable credits like the R&D
tax credit) until they have tax liability that the credits will reduce. Even though pre-market
developers incur the same costs as established developers, they must wait – sometimes
more than 12 years – to receive the benefits of the ODTC or other tax incentives. As a
result, pre-market developers realize fewer tax benefits than more established developers.
The fact that pre-market companies must wait longer to benefit from the tax credits is
reflected in Table 3. The value of tax credits is shown in gray in the year they are earned
and in black when the company can use them.
The pre-market company claims the same amount of tax credits as the established drug
developer shown in Table 2. The present value of the tax credits, however, is lower for the
pre-market company because it has to wait longer before it can use the tax credits.
Box 2: Impact of potential
repeal of the ODTC
If the ODTC were repealed, the net
out-of-pocket cost of orphan drug
development would increase by:
+39 percent for established drug
developers
+30 percent for pre-market drug
developers
EY | 16
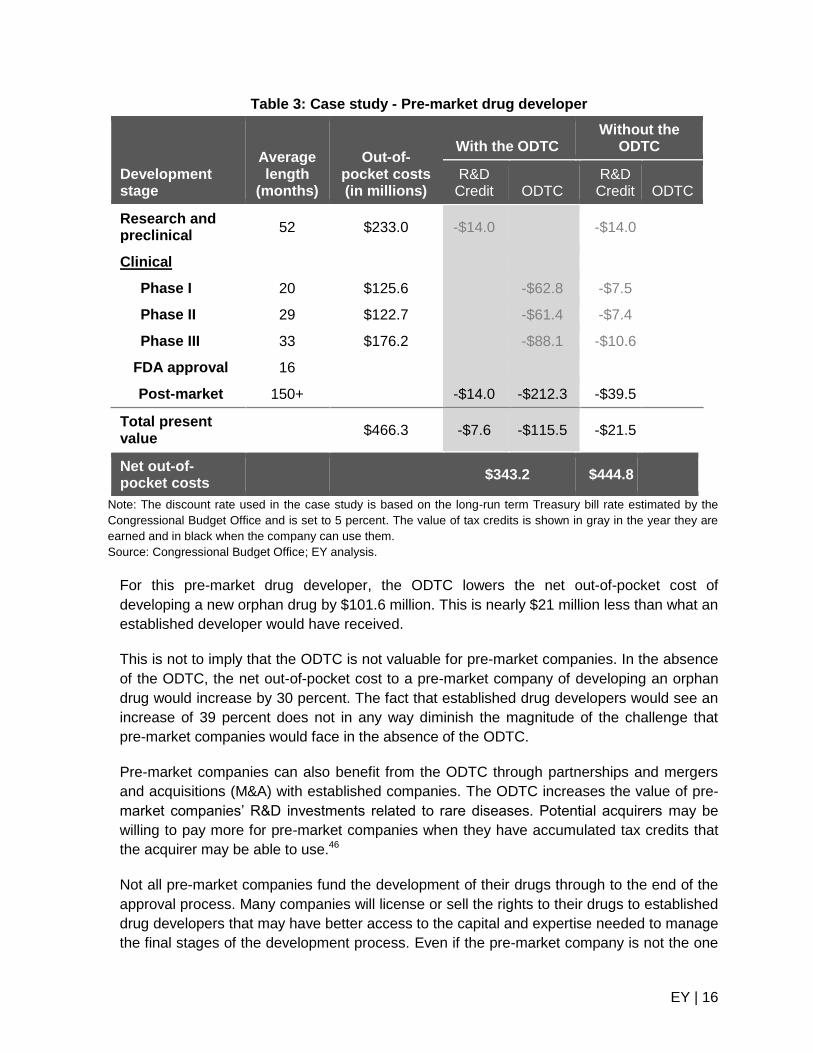
Table 3: Case study - Pre-market drug developer
Development stage
Average length
(months)
Out-of-pocket costs (in millions)
With the ODTC Without the
ODTC
R&D Credit ODTC
R&D Credit ODTC
Research and preclinical
52 $233.0 -$14.0
-$14.0
Clinical
Phase I 20 $125.6
-$62.8 -$7.5
Phase II 29 $122.7
-$61.4 -$7.4
Phase III 33 $176.2
-$88.1 -$10.6
FDA approval 16
Post-market 150+ -$14.0 -$212.3 -$39.5
Total present value
$466.3 -$7.6 -$115.5 -$21.5
Net out-of-pocket costs
$343.2 $444.8
Note: The discount rate used in the case study is based on the long-run term Treasury bill rate estimated by the
Congressional Budget Office and is set to 5 percent. The value of tax credits is shown in gray in the year they are
earned and in black when the company can use them.
Source: Congressional Budget Office; EY analysis.
For this pre-market drug developer, the ODTC lowers the net out-of-pocket cost of
developing a new orphan drug by $101.6 million. This is nearly $21 million less than what an
established developer would have received.
This is not to imply that the ODTC is not valuable for pre-market companies. In the absence
of the ODTC, the net out-of-pocket cost to a pre-market company of developing an orphan
drug would increase by 30 percent. The fact that established drug developers would see an
increase of 39 percent does not in any way diminish the magnitude of the challenge that
pre-market companies would face in the absence of the ODTC.
Pre-market companies can also benefit from the ODTC through partnerships and mergers
and acquisitions (M&A) with established companies. The ODTC increases the value of pre-
market companies’ R&D investments related to rare diseases. Potential acquirers may be
willing to pay more for pre-market companies when they have accumulated tax credits that
the acquirer may be able to use.46
Not all pre-market companies fund the development of their drugs through to the end of the
approval process. Many companies will license or sell the rights to their drugs to established
drug developers that may have better access to the capital and expertise needed to manage
the final stages of the development process. Even if the pre-market company is not the one
EY | 17
that ultimately earns the ODTC, the fact that they have developed a promising drug that will
qualify for the ODTC increases the amount the pre-market company can demand to license
its discovery.47
5.3. Quantifying the effect of repealing the ODTC
The ODTC assists drug developers by reducing the cost of investment to research and
develop a new orphan drug. By lowering the cost of capital for orphan drug developers, the
ODTC attracts additional investment to orphan drug development activities. While not every
new drug is successful, additional investment can be expected to lead to an increase in
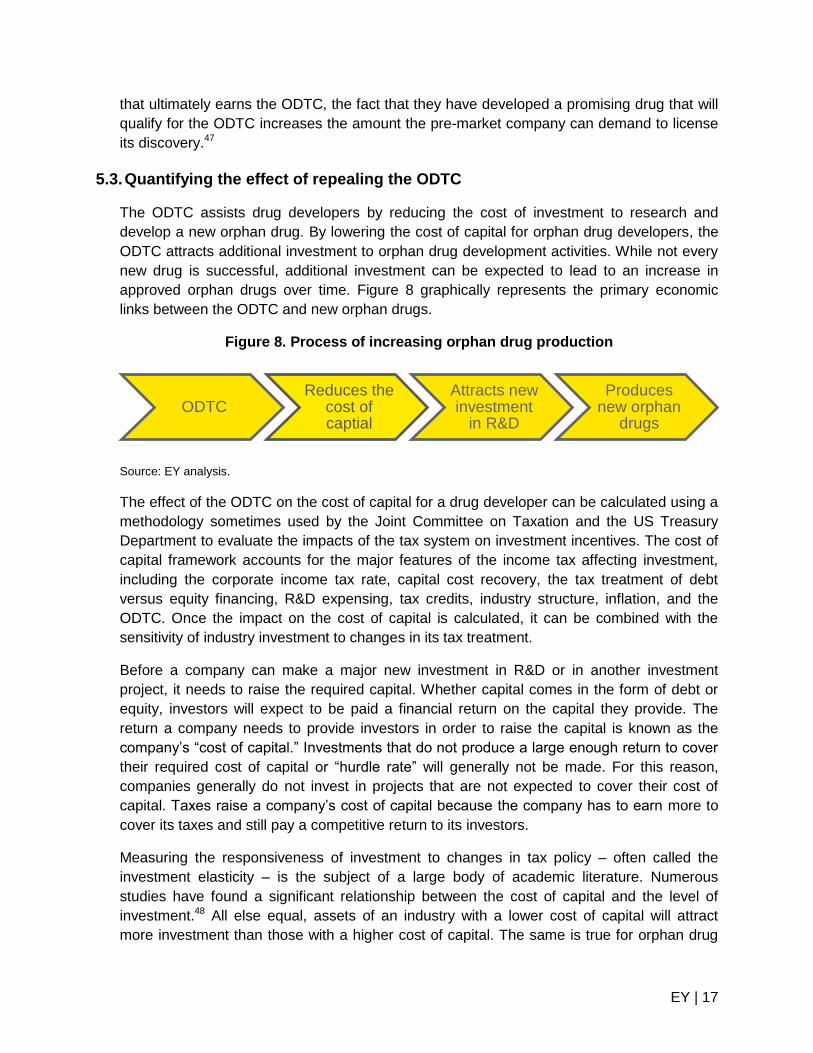
approved orphan drugs over time. Figure 8 graphically represents the primary economic
links between the ODTC and new orphan drugs.
Figure 8. Process of increasing orphan drug production
Source: EY analysis.
The effect of the ODTC on the cost of capital for a drug developer can be calculated using a
methodology sometimes used by the Joint Committee on Taxation and the US Treasury
Department to evaluate the impacts of the tax system on investment incentives. The cost of
capital framework accounts for the major features of the income tax affecting investment,
including the corporate income tax rate, capital cost recovery, the tax treatment of debt
versus equity financing, R&D expensing, tax credits, industry structure, inflation, and the
ODTC. Once the impact on the cost of capital is calculated, it can be combined with the
sensitivity of industry investment to changes in its tax treatment.
Before a company can make a major new investment in R&D or in another investment
project, it needs to raise the required capital. Whether capital comes in the form of debt or
equity, investors will expect to be paid a financial return on the capital they provide. The
return a company needs to provide investors in order to raise the capital is known as the
company’s “cost of capital.” Investments that do not produce a large enough return to cover
their required cost of capital or “hurdle rate” will generally not be made. For this reason,
companies generally do not invest in projects that are not expected to cover their cost of
capital. Taxes raise a company’s cost of capital because the company has to earn more to
cover its taxes and still pay a competitive return to its investors.
Measuring the responsiveness of investment to changes in tax policy – often called the
investment elasticity – is the subject of a large body of academic literature. Numerous
studies have found a significant relationship between the cost of capital and the level of
investment.48 All else equal, assets of an industry with a lower cost of capital will attract
more investment than those with a higher cost of capital. The same is true for orphan drug
ODTC Reduces the
cost of captial
Attracts new investment
in R&D
Produces new orphan
drugs
EY | 18
development, which is why the ODTC was designed to reduce the cost of capital for
investment in orphan drugs.
5.4. Impact of the ODTC on the cost of capital
The cost of clinical trials is a qualified expense for purpose of the ODTC. If the ODTC were
repealed, drug developers would instead likely claim the R&D tax credit for their clinical trial
costs. This analysis assumes that development costs incurred during the discovery and
preclinical phases (which are not qualified expenses for purpose of the ODTC) are eligible
for the R&D tax credit.
An important factor in determining the cost of capital
for drug developers is the length of time associated
with each stage of development. As shown in Figure
6, drug development can be a lengthy process and
the average development time of an approved drug
takes an average of 12.5 years. As a result, the R&D
tax credit and ODTC claimed during different phases
of drug development provide different benefits when
considered in terms of present value.
Established drug developers with tax liability have
access to all of their credits in the same year
development costs are incurred. Pre-market drug
developers (those without tax liability) must wait until
they have tax liability, usually after drug approval, to
use their credits. The present value of the tax credits is lower for the pre-market company
because they have to wait longer before they can use the tax credits.
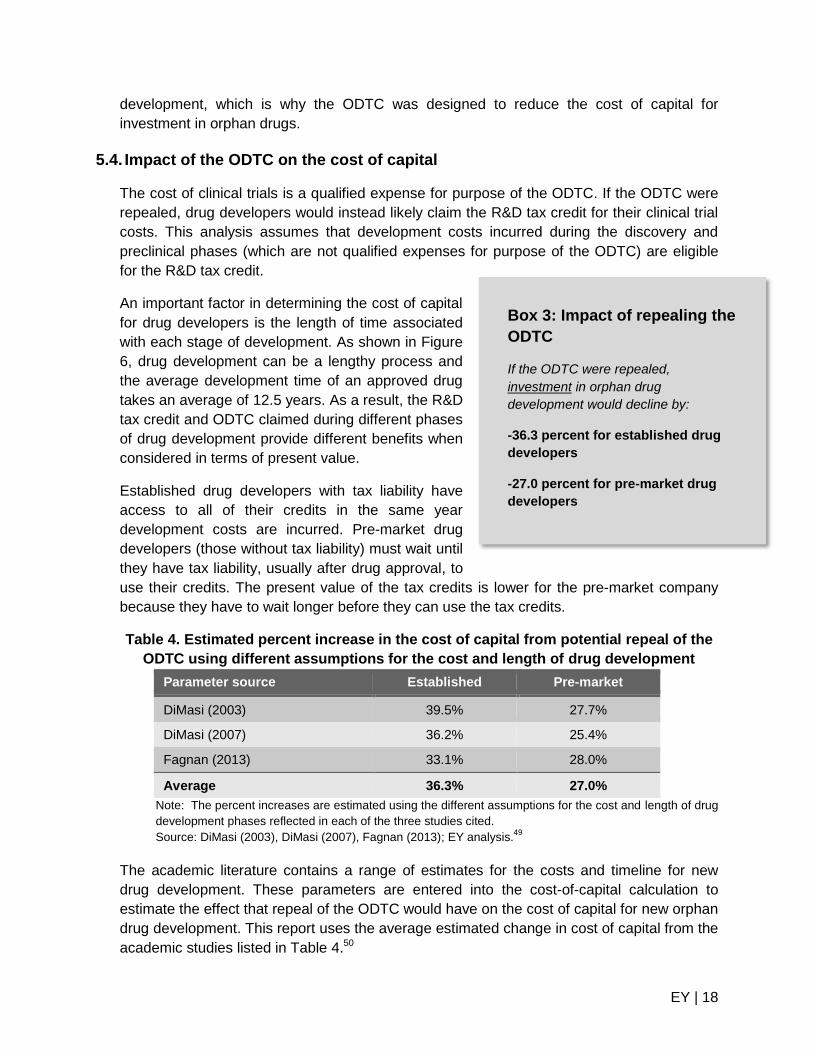
Table 4. Estimated percent increase in the cost of capital from potential repeal of the
ODTC using different assumptions for the cost and length of drug development
Parameter source Established Pre-market
DiMasi (2003) 39.5% 27.7%
DiMasi (2007) 36.2% 25.4%
Fagnan (2013) 33.1% 28.0%
Average 36.3% 27.0%
Note: The percent increases are estimated using the different assumptions for the cost and length of drug
development phases reflected in each of the three studies cited.
Source: DiMasi (2003), DiMasi (2007), Fagnan (2013); EY analysis.49
The academic literature contains a range of estimates for the costs and timeline for new
drug development. These parameters are entered into the cost-of-capital calculation to
estimate the effect that repeal of the ODTC would have on the cost of capital for new orphan
drug development. This report uses the average estimated change in cost of capital from the
academic studies listed in Table 4.50
Box 3: Impact of repealing the
ODTC
If the ODTC were repealed,
investment in orphan drug
development would decline by:
-36.3 percent for established drug
developers
-27.0 percent for pre-market drug
developers
EY | 19
5.5. ODTC and drug development investment
Based on a review of the economic research that examines the responsiveness of R&D
spending to its tax treatment, the long-run responsiveness of R&D investment to its cost of
capital is approximately one, meaning that for every one-percent increase in the cost of
capital, research investment will fall by one percent.51
Applying these estimates of the long-run responsiveness of R&D spending to its tax
treatment suggests that if the ODTC were repealed, investment in orphan drug development
would decline by 36.3 percent and 27.0 percent for established and pre-market drug
developers, respectively (Figure 9). The reduction in investment could be expected to
reduce the number of new orphan drugs in the future. As fewer orphan drugs enter the
development pipeline, the number of orphan drug approvals would also likely decline.
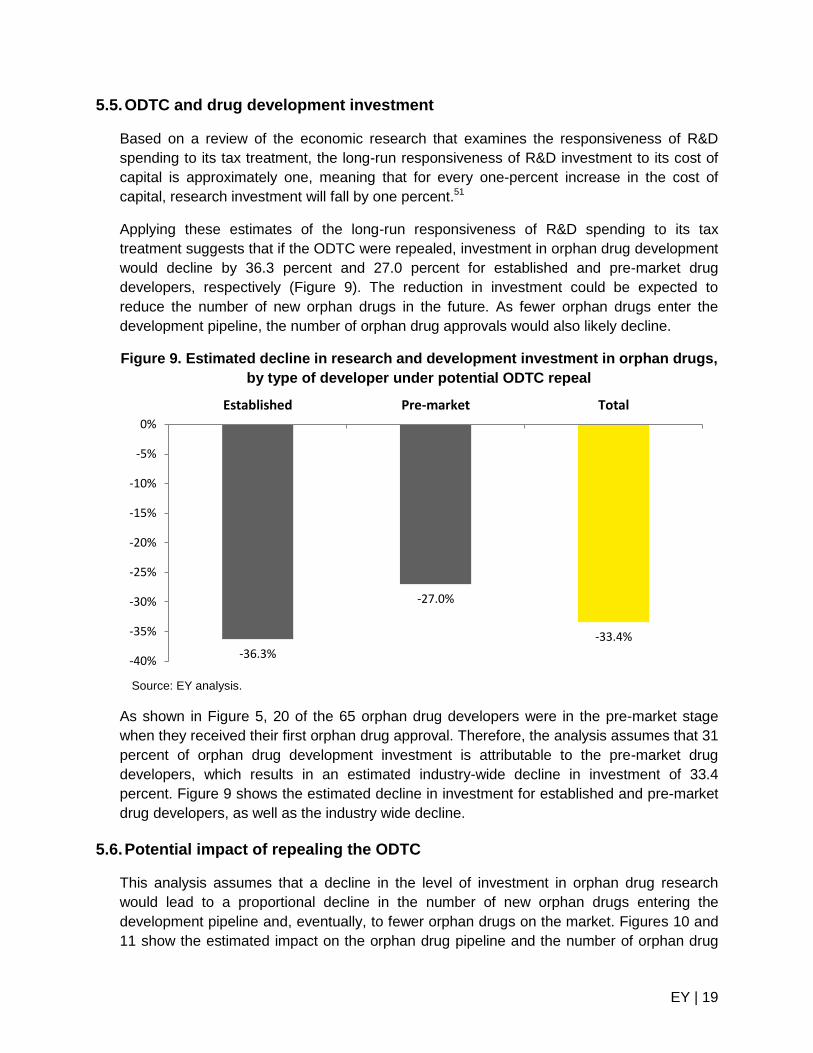
Figure 9. Estimated decline in research and development investment in orphan drugs,
by type of developer under potential ODTC repeal
Source: EY analysis.
As shown in Figure 5, 20 of the 65 orphan drug developers were in the pre-market stage
when they received their first orphan drug approval. Therefore, the analysis assumes that 31
percent of orphan drug development investment is attributable to the pre-market drug
developers, which results in an estimated industry-wide decline in investment of 33.4
percent. Figure 9 shows the estimated decline in investment for established and pre-market
drug developers, as well as the industry wide decline.
5.6. Potential impact of repealing the ODTC
This analysis assumes that a decline in the level of investment in orphan drug research
would lead to a proportional decline in the number of new orphan drugs entering the
development pipeline and, eventually, to fewer orphan drugs on the market. Figures 10 and
11 show the estimated impact on the orphan drug pipeline and the number of orphan drug
-36.3%
-27.0%
-33.4%
-40%
-35%
-30%
-25%
-20%
-15%
-10%
-5%
0%
Established Pre-market Total
EY | 20
approvals over the 1983 through 2014 period both under current law and assuming the
ODTC were not enacted and/or were repealed.
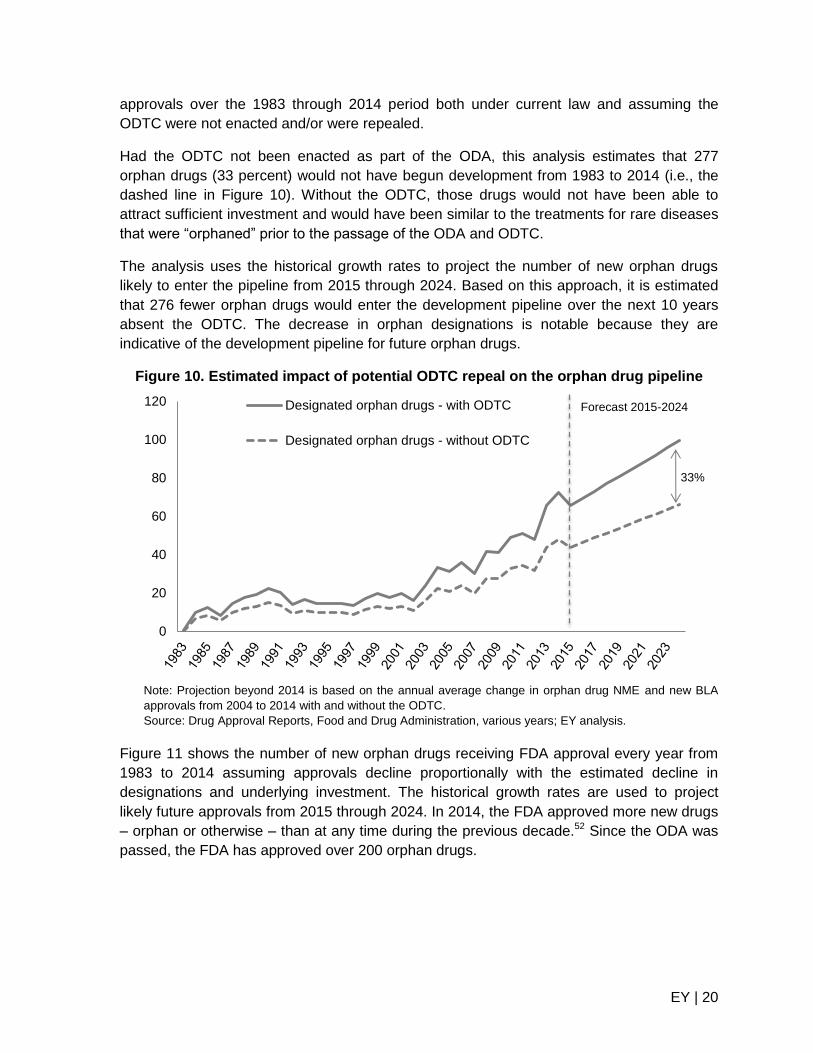
Had the ODTC not been enacted as part of the ODA, this analysis estimates that 277
orphan drugs (33 percent) would not have begun development from 1983 to 2014 (i.e., the
dashed line in Figure 10). Without the ODTC, those drugs would not have been able to
attract sufficient investment and would have been similar to the treatments for rare diseases
that were “orphaned” prior to the passage of the ODA and ODTC.
The analysis uses the historical growth rates to project the number of new orphan drugs
likely to enter the pipeline from 2015 through 2024. Based on this approach, it is estimated
that 276 fewer orphan drugs would enter the development pipeline over the next 10 years
absent the ODTC. The decrease in orphan designations is notable because they are
indicative of the development pipeline for future orphan drugs.
Figure 10. Estimated impact of potential ODTC repeal on the orphan drug pipeline
Note: Projection beyond 2014 is based on the annual average change in orphan drug NME and new BLA
approvals from 2004 to 2014 with and without the ODTC.
Source: Drug Approval Reports, Food and Drug Administration, various years; EY analysis.
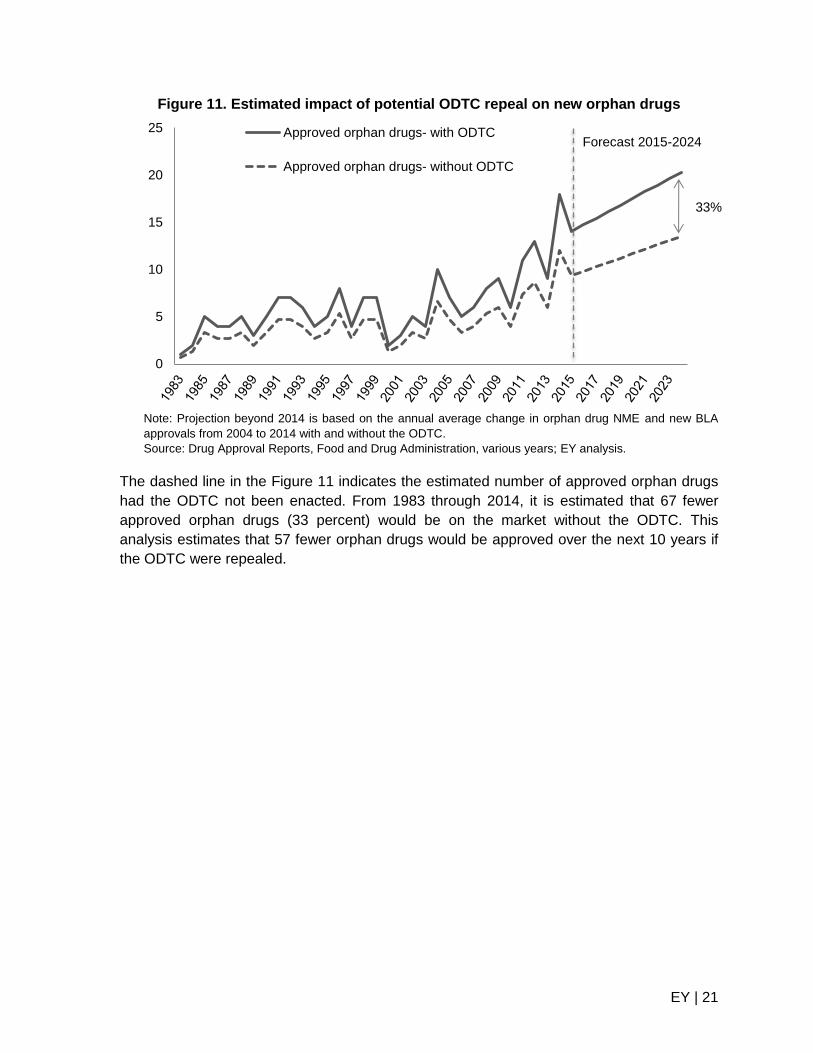
Figure 11 shows the number of new orphan drugs receiving FDA approval every year from
1983 to 2014 assuming approvals decline proportionally with the estimated decline in
designations and underlying investment. The historical growth rates are used to project
likely future approvals from 2015 through 2024. In 2014, the FDA approved more new drugs
– orphan or otherwise – than at any time during the previous decade.52 Since the ODA was
passed, the FDA has approved over 200 orphan drugs.
0
20
40
60
80
100
120 Designated orphan drugs - with ODTC
Designated orphan drugs - without ODTC
Forecast 2015-2024
33%
EY | 21
Figure 11. Estimated impact of potential ODTC repeal on new orphan drugs
Note: Projection beyond 2014 is based on the annual average change in orphan drug NME and new BLA
approvals from 2004 to 2014 with and without the ODTC.
Source: Drug Approval Reports, Food and Drug Administration, various years; EY analysis.
The dashed line in the Figure 11 indicates the estimated number of approved orphan drugs
had the ODTC not been enacted. From 1983 through 2014, it is estimated that 67 fewer
approved orphan drugs (33 percent) would be on the market without the ODTC. This
analysis estimates that 57 fewer orphan drugs would be approved over the next 10 years if
the ODTC were repealed.
0
5
10
15
20
25 Approved orphan drugs- with ODTC
Approved orphan drugs- without ODTC
Forecast 2015-2024
33%
EY | 22
6. Qualitative impact of the ODTC
Repeal of the ODTC would have a direct impact on orphan drug development and the
number of new orphan drugs approved in the future, as discussed in the previous section.
Patients can benefit from orphan drugs through longer life spans and higher quality of life,
while society as a whole can benefit from increased patient productivity and a potential
decline in the amount of resources devoted to health care and government spending.
6.1. Impact of orphan drugs on patients’ lives
Orphan drugs can affect both the length and the quality of patients’ lives. Although the
quality of life can be difficult to measure, it is an important part of the benefit that orphan
drugs provide.
Longevity. Effective orphan drugs can extend and improve patients’ lives. Prior to the ODA,
the number of annual deaths from rare diseases was growing at a slightly higher rate than
that from other diseases (2.0 percent and 1.3 percent, respectively).53 In the 10 years
following the ODA, the number of annual deaths from rare diseases was declining at a rate
of 3.1 percent, while the annual number of deaths from other diseases continued to grow at
a rate of 1.2 percent.54 While the ODA is not the sole reason the annual deaths from rare
diseases have declined, it has led to the development of additional orphan drugs, which
have played a role in reducing annual deaths from rare diseases.
Quality of life. Orphan drugs have the potential to generate large improvements in patients’
lives because rare diseases typically have few, if any, effective treatments available.
According to the Office of Rare Diseases Research at the National Institutes of Health, only
289 of the more than 7,000 identified rare diseases have at least one treatment option. That
means only four percent of recognized rare diseases have an available treatment, despite
the large improvement in the lives of patients and their caregivers provided by a single
treatment.55
A recent survey, conducted by the biotechnology company Shire, found that rare diseases
take a significant emotional toll on patients and their caregivers. Patients and caregivers
reported suffering from isolation from friends and/or family (65 percent and 64 percent),
depression (75 percent and 72 percent), and anxiety and stress (86 percent and 89
percent).56 Patients often have to travel long distances to receive treatment. On average, it
takes 7.6 years for rare-disease patients in the United States to receive an accurate
diagnosis, and patients may see up to four primary care doctors and four specialists before
receiving an accurate diagnosis.57 Orphan drugs may reduce the emotional toll patients and
caregivers face by relieving symptoms and decreasing the burden of inferior treatment
options. These improvements may help reduce feelings of depression, isolation, anxiety,
and stress patients and caregivers often experience.
EY | 23
6.2. Economic impact of orphan drugs
Orphan drugs can also deliver a broad set of economic benefits beyond the increased well-
being of patients and caregivers. Orphan drugs may increase patients’ ability to work,
reduce net medical expenditures, and lower government spending.
Patient and caregiver productivity. Those suffering from chronic disease tend to be less
productive at work, either through increased absenteeism or limitations imposed by their
disease.58 Patients with rare diseases often find it difficult to remain at their jobs due to the
symptoms of their disease.59 Labor-force participation generates personal income and
increases government revenues through tax receipts. As a result, treatments that help
patients to return to work, provide childcare, or participate in other activities may generate
benefits beyond improved health.
The adverse effects of rare diseases are not limited to patients but can affect caregivers as
well. Those caring for someone with a rare disease report feelings of depression, anxiety
and isolation.60 Treatments that help patients to return to work may also lead to productivity
improvements for caregivers.
Health care consumption. Many rare diseases are classified as severe, which require
more paid and unpaid care than non-severe diseases.61 Those with debilitating conditions
often require in-home residential care, which can be expensive. Patients with less severe
conditions may still need a family or friend to be present and able to help in case of an
emergency.
Health care costs for patients with a rare disease can be substantial. Having an effective
treatment available can reduce the need to see numerous doctors, specialists, and undergo
multiple tests. Compared to patients with more common diseases, rare disease patients see
more doctors and have more diagnostic tests, all of which drive up health care consumption.
High levels of health care consumption increase pressure on the US health care system and
place a higher financial burden on insurance companies and patients. In a recent survey, 55
percent of respondents incurred medical expenses not covered by insurance (90 percent
reported having insurance).62 Effective treatments for rare diseases may lower total out-of-
pocket cost medical costs for patients and reduce the aggregate level of health care
consumption.
Government spending. New drugs have been shown to reduce total medical expenditures,
potentially reducing government expenditures.63 Research in this area that focuses on rare
diseases is limited. One study conducted on patients with Parkinson’s disease who took the
drug Selegiline found that the drug may reduce government spending by $10 million per
week by delaying the need for disability payments and providing tax revenues while patients
continue to work.64 New orphan drugs may generate similar outcomes and reduce
government spending for patient populations with rare diseases.
EY | 24
7. Conclusion
The ODA, and more specifically the ODTC, have made significant contributions to the
increase in orphan drug discovery over the last 30 years. Without the ODA, market and
regulatory barriers would limit investment in finding new, potentially life-saving treatments for
patients living with rare diseases. Drug developers use the ODTC to help finance
investments in developing potential new treatments.
When Congress passed the ODA, it was concerned that rising development costs had
caused promising medicines to be abandoned without reaching patients. Today, the total
cost to bring a new drug to market is $1.5 billion (in 2014 dollars). Lacking sufficient market
size or economic incentive, new treatments might not be developed to treat rare diseases.
ODA provisions, like the Orphan Products Grant Program and the ODTC, were designed
specifically to combat such barriers and increase orphan drug development.
In response, drug developers have increased the level of investment in the research and
development of new orphan drugs. Since the ODA’s enactment, in total, 486 orphan
products have been approved and more than 200 new orphan drugs have been brought to
market and many more remain in the development pipeline. Both large and small drug
developers use provisions of the ODA and ODTC to reduce costs associated with
developing new treatments for rare diseases.
This analysis finds that there would have been 33 percent fewer new orphan drugs
developed during the last 30 years without the ODTC. That is the equivalent of 67 drugs,
currently on the market, that would not have been developed. The ODTC has also been
used to begin development on a number of new drugs that may ultimately receive market
approval. Without the ODTC, it is estimated that the drug development pipeline would
ultimately shrink by 276 developmental drugs over the next 10 years. It is estimated that this
reduced pipeline could ultimately result in 57 fewer approved drugs available to patients
over the next 10 years.
Both the ODA and the ODTC have largely accomplished Congress’ intent to increase
orphan drug development. Amendments to the ODA over time have further improved the
ability of the ODA and the ODTC to reduce barriers to orphan drug development.
EY | 25
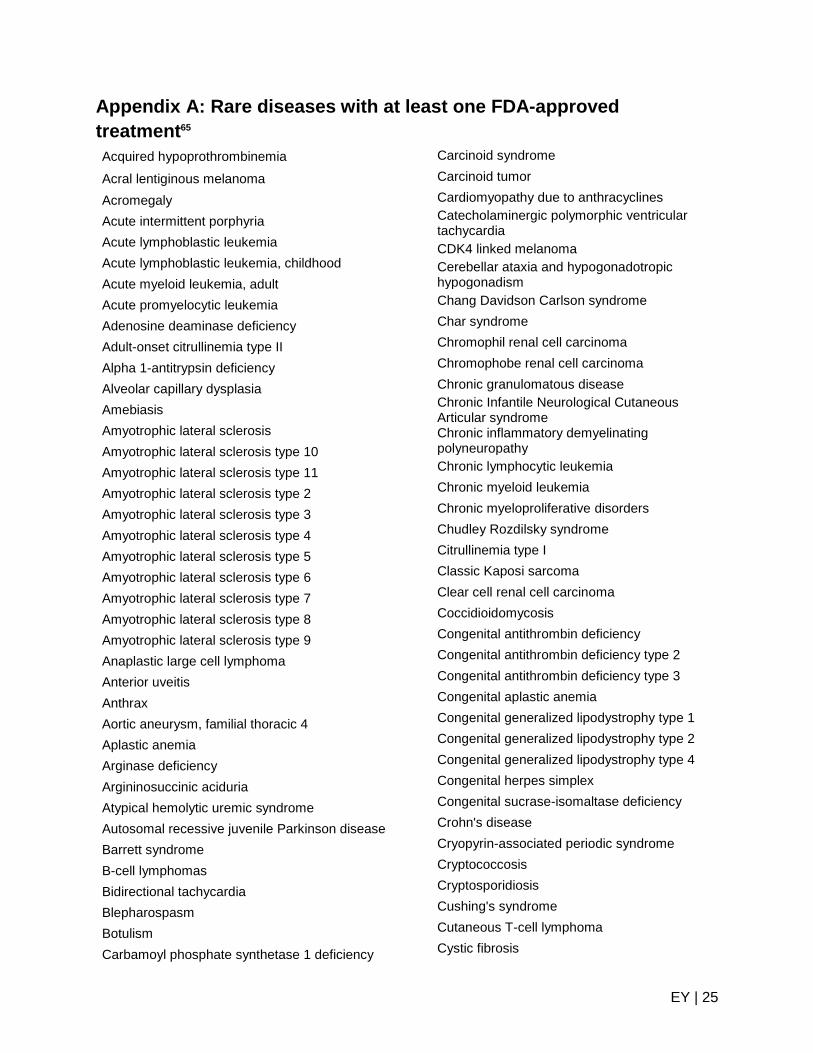
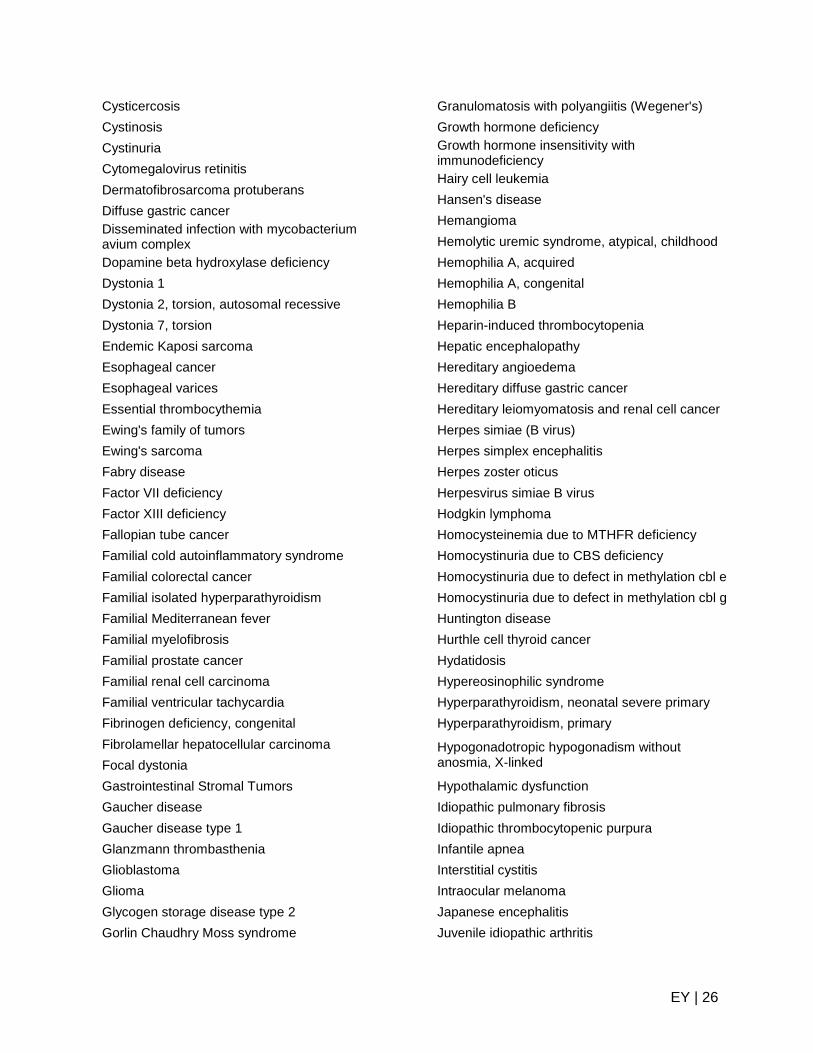
Appendix A: Rare diseases with at least one FDA-approved
treatment65
Acquired hypoprothrombinemia
Acral lentiginous melanoma
Acromegaly
Acute intermittent porphyria
Acute lymphoblastic leukemia
Acute lymphoblastic leukemia, childhood
Acute myeloid leukemia, adult
Acute promyelocytic leukemia
Adenosine deaminase deficiency
Adult-onset citrullinemia type II
Alpha 1-antitrypsin deficiency
Alveolar capillary dysplasia
Amebiasis
Amyotrophic lateral sclerosis
Amyotrophic lateral sclerosis type 10
Amyotrophic lateral sclerosis type 11
Amyotrophic lateral sclerosis type 2
Amyotrophic lateral sclerosis type 3
Amyotrophic lateral sclerosis type 4
Amyotrophic lateral sclerosis type 5
Amyotrophic lateral sclerosis type 6
Amyotrophic lateral sclerosis type 7
Amyotrophic lateral sclerosis type 8
Amyotrophic lateral sclerosis type 9
Anaplastic large cell lymphoma
Anterior uveitis
Anthrax
Aortic aneurysm, familial thoracic 4
Aplastic anemia
Arginase deficiency
Argininosuccinic aciduria
Atypical hemolytic uremic syndrome
Autosomal recessive juvenile Parkinson disease
Barrett syndrome
B-cell lymphomas
Bidirectional tachycardia
Blepharospasm
Botulism
Carbamoyl phosphate synthetase 1 deficiency
Carcinoid syndrome
Carcinoid tumor
Cardiomyopathy due to anthracyclines
Catecholaminergic polymorphic ventricular tachycardia
CDK4 linked melanoma
Cerebellar ataxia and hypogonadotropic hypogonadism
Chang Davidson Carlson syndrome
Char syndrome
Chromophil renal cell carcinoma
Chromophobe renal cell carcinoma
Chronic granulomatous disease
Chronic Infantile Neurological Cutaneous Articular syndrome
Chronic inflammatory demyelinating polyneuropathy
Chronic lymphocytic leukemia
Chronic myeloid leukemia
Chronic myeloproliferative disorders
Chudley Rozdilsky syndrome
Citrullinemia type I
Classic Kaposi sarcoma
Clear cell renal cell carcinoma
Coccidioidomycosis
Congenital antithrombin deficiency
Congenital antithrombin deficiency type 2
Congenital antithrombin deficiency type 3
Congenital aplastic anemia
Congenital generalized lipodystrophy type 1
Congenital generalized lipodystrophy type 2
Congenital generalized lipodystrophy type 4
Congenital herpes simplex
Congenital sucrase-isomaltase deficiency
Crohn's disease
Cryopyrin-associated periodic syndrome
Cryptococcosis
Cryptosporidiosis
Cushing's syndrome
Cutaneous T-cell lymphoma
Cystic fibrosis
EY | 26
Cysticercosis
Cystinosis
Cystinuria
Cytomegalovirus retinitis
Dermatofibrosarcoma protuberans
Diffuse gastric cancer
Disseminated infection with mycobacterium avium complex
Dopamine beta hydroxylase deficiency
Dystonia 1
Dystonia 2, torsion, autosomal recessive
Dystonia 7, torsion
Endemic Kaposi sarcoma
Esophageal cancer
Esophageal varices
Essential thrombocythemia
Ewing's family of tumors
Ewing's sarcoma
Fabry disease
Factor VII deficiency
Factor XIII deficiency
Fallopian tube cancer
Familial cold autoinflammatory syndrome
Familial colorectal cancer
Familial isolated hyperparathyroidism
Familial Mediterranean fever
Familial myelofibrosis
Familial prostate cancer
Familial renal cell carcinoma
Familial ventricular tachycardia
Fibrinogen deficiency, congenital
Fibrolamellar hepatocellular carcinoma
Focal dystonia
Gastrointestinal Stromal Tumors
Gaucher disease
Gaucher disease type 1
Glanzmann thrombasthenia
Glioblastoma
Glioma
Glycogen storage disease type 2
Gorlin Chaudhry Moss syndrome
Granulomatosis with polyangiitis (Wegener's)
Growth hormone deficiency
Growth hormone insensitivity with immunodeficiency
Hairy cell leukemia
Hansen's disease
Hemangioma
Hemolytic uremic syndrome, atypical, childhood
Hemophilia A, acquired
Hemophilia A, congenital
Hemophilia B
Heparin-induced thrombocytopenia
Hepatic encephalopathy
Hereditary angioedema
Hereditary diffuse gastric cancer
Hereditary leiomyomatosis and renal cell cancer
Herpes simiae (B virus)
Herpes simplex encephalitis
Herpes zoster oticus
Herpesvirus simiae B virus
Hodgkin lymphoma
Homocysteinemia due to MTHFR deficiency
Homocystinuria due to CBS deficiency
Homocystinuria due to defect in methylation cbl e
Homocystinuria due to defect in methylation cbl g
Huntington disease
Hurthle cell thyroid cancer
Hydatidosis
Hypereosinophilic syndrome
Hyperparathyroidism, neonatal severe primary
Hyperparathyroidism, primary
Hypogonadotropic hypogonadism without anosmia, X-linked
Hypothalamic dysfunction
Idiopathic pulmonary fibrosis
Idiopathic thrombocytopenic purpura
Infantile apnea
Interstitial cystitis
Intraocular melanoma
Japanese encephalitis
Juvenile idiopathic arthritis
EY | 27
Kallmann syndrome 2
Kallmann syndrome 3
Kidney cancer
Laron syndrome
Leishmaniasis
Lennox-Gastaut syndrome
Lentigo maligna melanoma
Leukemia, B-cell, chronic
Liver cancer
Lymphoblastic lymphoma
Lynch syndrome
Malaria
Malignant hyperthermia
Malignant melanoma, childhood
Malignant mesothelioma
Mantle cell lymphoma
Mastocytosis
Mastocytosis cutaneous with short stature conductive hearing loss and microtia
Melanoma astrocytoma syndrome
Melanoma, familial
Methylmalonic acidemia with homocystinuria
Methylmalonic aciduria with homocystinuria cbl f
Methylmalonicacidemia with homocystinuria cbl d
Microscopic polyangiitis
Morquio syndrome A
Muckle-Wells syndrome
Mucopolysaccharidosis type I
Mucopolysaccharidosis type II
Mucopolysaccharidosis type VI
Multicentric Castleman’s Disease
Multiple endocrine neoplasia type 2A
Multiple myeloma
Multiple sclerosis
Multiple system atrophy (MSA) with orthostatic hypotension
Mycosis fungoides
Myelodysplastic syndromes
Myelodysplastic/myeloproliferative disease
Myelofibrosis
Myopathic carnitine deficiency
N-acetylglutamate synthetase deficiency
Narcolepsy
Natal teeth, intestinal pseudoobstruction and patent ductus
Nephropathic cystinosis
Neuroblastoma
Nodular melanoma
Non 24 hour sleep wake disorder
Non-small cell lung cancer, childhood
Noonan syndrome 1
Ocular melanoma
Ornithine transcarbamylase deficiency
Oslam syndrome
Osteopetrosis
Osteopetrosis and infantile neuroaxonal dystrophy
Osteopetrosis autosomal dominant type 1
Osteopetrosis autosomal dominant type 2
Osteopetrosis autosomal recessive 3
Osteopetrosis autosomal recessive 5
Osteopetrosis autosomal recessive 7
Osteosarcoma
Ovarian cancer
Ovarian epithelial cancer
Paget disease of bone
Paget disease of bone, familial
Pancreatic cancer
Panuveitis
Papillary renal cell carcinoma
Parathyroid carcinoma
Parkinson disease
Parkinson disease type 3
Parkinson disease type 9
Paroxysmal nocturnal hemoglobinuria
Patent ductus arteriosus
Pediatric Crohn's disease
Pediatric hypertension
Pediatric ulcerative colitis
Peripheral T-cell lymphoma
Phenylketonuria
Pheochromocytoma
EY | 28
Pheochromocytoma, childhood
Pheochromocytoma-islet cell tumor syndrome
Philadelphia-negative chronic myeloid leukemia
Pneumocystic carinii pneumonia
Polycythemia vera
Prader-Willi syndrome
Precocious puberty
Premature aging Okamoto type
Primary biliary cirrhosis
Primary carnitine deficiency
Primary gastrointestinal melanoma
Primary malignant melanoma of the cervix
Primary malignant melanoma of the conjunctiva
Protein C deficiency
Pulmonary arterial hypertension
Pure autonomic failure
Renal cell carcinoma 4
Respiratory distress syndrome, infant
ROHHAD
Severe combined immunodeficiency
Short bowel syndrome
Sickle cell anemia
Sjogren syndrome
Slti Salem syndrome
Soft tissue sarcoma
Soft tissue sarcoma childhood
Spinal cord neoplasm
Squamous cell carcinoma
Squamous cell carcinoma of the head and neck
Status epilepticus
Stomach cancer, childhood
Stomach carcinoma
Superficial spreading melanoma
T-cell lymphoma 1A
Testicular cancer
Thyroid cancer, anaplastic
Thyroid cancer, follicular
Thyroid cancer, medullary
Tièche-Jadassohn nevus
Torsion dystonia
Transverse myelitis
Trypanosomiasis, Human West-African
Tuberculosis
Tuberous sclerosis
Tuberous sclerosis, type 1
Tuberous sclerosis, type 2
Turner syndrome
Tyrosinemia type 1
Urea cycle disorders
Uterine sarcoma
Ventricular fibrillation, idiopathic
Vernal keratoconjunctivitis
VIPoma
Von Willebrand disease
Wilson disease
Zollinger-Ellison syndrome

EY | 29
Appendix B: Selected orphan drug timeline
Year Event 1964 Committee of the Public Health Service examines the effect of 1962 changes to FDA
drug approval requirements on the commercial availability of un-patentable drugs and drugs for rare diseases.
1970s Informal coalition of organizations focused on rare conditions promotes need for action to encourage development of drugs for these conditions.
1975 Interagency federal government committee publishes an interim report that describes problems related to drugs of limited commercial value and recommends further study.
1977 Congress creates Commission for the Control of Huntington’s Disease and its Consequences, which called for more basic neurological research and product development for rare diseases.
1979 Interagency Task Force on Drugs of Limited Commercial Value (created in 1978) issues its final report.
1980-82 Congress holds hearings to learn more about problems of drugs for rare diseases.
1983 President signs Orphan Drug Act (P.L. 97-414), which creates a range of incentives for pharmaceutical manufacturers to develop drugs for rare diseases.
National Organization for Rare Disorders, a federation of voluntary health organizations, is established by patients and families who worked together to get the Orphan Drug Act passed.
FDA approves first two orphan drugs.
1984 Congress amends Orphan Drug Act (“Health Promotion and Disease Prevention Amendments” P.L. 98-551) to define a rare disease or condition as one that (1) affects fewer than 200,000 persons in the United States or (2) affects “more than 200,000 persons in the United States, but for which there is no reasonable expectation that the sales of the drug treatment will recover the costs.”
Congress directs the creation of a National Commission on Orphan Diseases to assess the research activities of NIH and other public and private organizations in connection with drug development.
1989 National Commission on Orphan Diseases issues report.
1990 Congress passes legislation to differentiate incentives for orphan drug development depending on commercial value, but the President vetoes it. Congress passes Safe Medical Devices Act of 1990 (P.L. 101-629), which (among other provisions) establishes the basis for the Humanitarian Device Exemption for devices to treat or diagnose a disease or condition that affects fewer than 4,000 individuals and that meet certain other conditions.
1992 Congress waives the payment of certain fees for drug and biologic product review for the sponsors of orphan drugs.
1993 The Office of Rare Diseases is established within the Office of the NIH Director.
1997 Congress permanently extends a tax credit of up to 50 percent for clinical research performed for designated orphan drugs (P.L. 105-34) and grants an exemption for orphan drugs from the usual drug approval application fees charged by the Food and Drug Administration (P.L. 105-115).
2002 Rare Diseases Act (P.L. 107-280) and Rare Disease Orphan Product Development Act (P.L. 107-281) are signed into law. The former legislatively establishes the NIH Office of Rare Diseases (now the Office of Rare Diseases Research) and requires NIH to support regional centers of excellence for clinical research into, training in, and
EY | 30
demonstration of diagnostic, prevention, control, and treatment methods for rare diseases.
2003 NIH Office of Rare Diseases creates Rare Diseases Clinical Research Network, beginning with seven research consortia.
2007 FDA Amendments Act (P.L. 110-85) includes the Pediatric Medical Device Safety and Improvement Act, which provides incentives for industry and researchers to design devices for children.
2008 Congress enacts the Genetic Nondiscrimination Act (P.L. 110-233) to prohibit discrimination in health insurance and employment based on genetic information.
2009 NIH announces Therapeutics for Rare and Neglected Diseases Program and announces expansion of Rare Diseases Clinical Research Network.
Source: Rare diseases and orphan products: accelerating research and development, Institute of Medicine of the National Academies report, 2010; EY analysis.
EY | 31
Appendix C: Search methodology
This report used Medical Subject Headings (MeSH)-based searches to complete a
comprehensive review of relevant literature. MeSH is an index of the biomedical literature
that is used to provide consistent and uniform cataloging. MeSH terms describe the content
of journal articles and eliminate the use of variant terms for the same concept. For example,
articles pertaining to orphan drug manufacturing are categorized as “Orphan Drug
Production.”
The MeSH index is organized into tree structures with 16 main headings. For example,
articles about strep throat will be categorized under “Streptococcus,” and the tree structure
is organized as: Organisms > Bacteria > Gram-Positive Bacteria > Gram-Positive Cocci >
Streptococcaceae > Streptoccocus.66 This structure allows searches of a broad term (Ear) to
include the results of narrower terms as well (Ear, External; Ear, Middle; and Ear, Inner, as
well as all narrower terms under each of these). Selected examples of searches used in this
report are listed below:
► "Orphan Drug Production/statistics and numerical data"[MeSh] OR "Orphan Drug Production/economics"[MeSh]
► ("orphan drug production"[MeSH Terms] OR ("orphan"[All Fields] AND "drug"[All Fields] AND "production"[All Fields]) OR "orphan drug production"[All Fields] OR ("orphan"[All Fields] AND "drug"[All Fields]) OR "orphan drug"[All Fields]) AND (credit[All Fields] OR tax[All Fields])
The MeSH search methodology enables literature searches to be sensitive and specific.
Specific search terms decrease the likelihood of missing important information and prevent
the need to go through irrelevant articles, which can increase search efficiency.67 More
detailed searches increase precision, while the uniform indexing of articles removes the
need to conduct searches using alternative spellings or small differences in terminology
(e.g., manufacturing versus production).
EY | 32
Endnotes
1 “Rare Disease Information,” National Organization for Rare Disorders website, https://www.rarediseases.org/rare-
disease-information. 2 Angeles Villarreal, “Orphan Drug Act: Background and Proposed Legislation in the 107
th Congress,” (RS20971)
(2001), Congressional Research Service, accessed 05 January 2015. 3 “All Bill Information for H.R.5238 - Orphan Drug Act,” US Congress, https://www.congress.gov/bill/97th-
congress/house-bill/5238/all-info, accessed 24 February 2015. 4 Supra, note 2.
5 Ibid.
6 The term “drug sponsor” is commonly used by the FDA to refer to what is commonly also the drug developer. In
some cases the sponsor and developer may be different organizations. This report uses the term developer to describe organizations that are part of a drug’s development process. 7 “Information on the Orphan Products Grants Program,” FDA, accessed 3 April 2015,
http://www.fda.gov/ForIndustry/DevelopingProductsforRareDiseasesConditions/WhomtoContactaboutOrphanProductDevelopment/ucm134580.htm. 8 Aaron S. Kesselheim, (2010), “Innovation and the Orphan Drug Act, 1983-2009: Regulatory and clinical
Characteristics of Approved Orphan Drugs,” The National Academies. 9 Joseph A. DiMasi, Ronald W. Hansen and Henry G. Grabowski, (1991), “Cost of innovation in the pharmaceutical
industry,” Journal of Health Economics. 10
Ibid. 11
Ibid. 12
Joseph A. DiMasi and Henry G. Grabowski, “The cost of biopharmaceutical R&D: is biotech different?” Managerial and Decision Economics, (John Wiley & Sons, Ltd, 2007). 13
“Cost to Develop and Win Marketing Approval for a New Drug is $2.6 Billion,” Tufts Center for the Study of Drug
Development website, http://csdd.tufts.edu/news/complete_story/pr_tufts_csdd_2014_cost_study 14
“Rare diseases and orphan products: accelerating research and development,” 4 October 2010, Institute of Medicine (IOM) of the National Academies. 15
Supra, note 12. 16
“Post marketing Requirements and Commitments,” FDA, accessed 31 March 2015, http://www.fda.gov/Drugs/GuidanceComplianceRegulatoryInformation/Post-marketingPhaseIVCommitments/default.htm. 17
Ibid. 18
Supra, note 2. 19
Johanne Bissonnette, “Close-up on rare diseases and orphan drugs,” Univalor, http://www.univalor.ca/en/media/article/close-rare-diseases-and-orphan-drugs, accessed 21 January 2015. 20
Ronald Reagan, "Statement on Signing the Orphan Drug Act," The American Presidency Project, 4 January 1983,
accessed 14 March 2015, http://www.presidency.ucsb.edu/ws/?pid=40583. 21
Institute of Medicine (US) Committee on Accelerating Rare Diseases Research and Orphan Product Development, “Rare Diseases and Orphan Products,” The National Academies, 2010. 22
James H. Reese, “FDA Orphan drug designation 101,” Office of Orphan Products Development, 10 March 2014. 23
Ibid. 24
Supra, note 2. 25
Products are not required to hold an orphan designation in order to apply for the Orphan Products Grant Program. 26
“Information on the Orphan Products Grants Program,” FDA, accessed 3 April 2015, http://www.fda.gov/ForIndustry/DevelopingProductsforRareDiseasesConditions/WhomtoContactaboutOrphanProductDevelopment/ucm134580.htm. 27
Ibid. 28
Ibid. 29
Supra, note 12. 30
“Food and Drug Administration Modernization Act of 1997 Public Law 105-115 SEC111,” U.S. Government Publishing Office, 21 November 1997, 105
th Congress.
31 “Rare Disease Resources for Medical Professionals,” NORD Physician Guides, http://nordphysicianguides.org/.
32 Ibid.
33 Supra, note 2.
34 http://www.gpo.gov/fdsys/pkg/FR-2014-08-01/pdf/2014-18113.pdf, accessed 3 April 2015.
35 Aaron S. Kesselheim, “Innovation and the Orphan Drug Act, 1983-2009: Regulatory and clinical Characteristics of
Approved Orphan Drugs,” The National Academies, 2010. 36
Senator Ron Wyden, "Introduction of the Office for Rare Disease Research Act of 1994," The Library of Congress, 4 October 1994, accessed 14 April 2015, http://thomas.loc.gov/cgi-bin/query/z?r103:E04OC4-B9.
EY | 33
37
“Novel New Drugs 2014 Summary,” FDA, accessed 14 April 2015, http://www.fda.gov/downloads/Drugs/DevelopmentApprovalProcess/DrugInnovation/UCM430299.pdf. 38
Orphan Drug Product designation database, FDA, accessed 20 February 2015, http://www.accessdata.fda.gov/scripts/opdlisting/oopd/. 39
“Drug Approval Reports,” various years, FDA, accessed 20 February 2015, http://www.accessdata.fda.gov/scripts/cder/drugsatfda/index.cfm?fuseaction=Reports.ReportsMenu#navigation. “New Molecular Entity (NME) Drug and New Biologic Approvals reports,” various years, FDA, accessed 20 February 2015, http://www.fda.gov/Drugs/DevelopmentApprovalProcess/HowDrugsareDevelopedandApproved/DrugandBiologicApprovalReports/NDAandBLAApprovalReports/ucm373420.htm. 40
Ibid. 41
Senator Orrin Hatch, “Statements on Introduced Bills and Joint Resolutions,” Congressional Record, Volume 141, Issue 118, 20 July 1995, accessed 14 April 2005, http://www.gpo.gov/fdsys/pkg/CREC-1995-07-20/pdf/CREC-1995-07-20-pt1-PgS10426-5.pdf. 42
“Form 8820 General Instructions,” IRS website, accessed 5 January 2015, http://www.irs.gov/uac/Form-8820,-Orphan-Drug-Credit. 43
Supra, note 9. 44
The “R&D tax credit” is more formally known as the research credit, under Section 41 of the Internal Revenue Code 45
Based on EY analysis of IRS, Statistics of Income data. 46
Eric James Allen, “The information content of the deferred tax valuation allowance: Evidence from venture capital backed IPO firms,” USC Marshall School of Business, 30 September 2012. 47
Mark Kessel and Frederick Frank, “A better prescription for drug-development financing,” Nature Biotechnology,
Vol. 25, No. 8, (2007). 48
Kevin Hassett and Glenn Hubbard, (2002), “Tax policy and business investment” in M. Feldstein and A. Auerbach (eds.), Handbook of Public Economics, Vol. 3, pp. 1293-1343; Ruud de Mooij and Sjef Ederveen, (2008), “Corporate tax elasticities: a reader's guide to empirical findings,” Oxford Review of Economic Policy, Vol. 24, No. 4, pp. 680-697; Simeon Djankov, Tim Ganser, Caralee McLiesh, Rita Ramalho and Andrei Shleifer, (2008), “The Effect of Corporate Taxes on Investment and Entrepreneurship,” American Economic Journal, Vol. 2, No. 3, pp. 31-64. 49
Joseph A. DiMasi, Ronald W. Hansen and Henry G. Grabowski, (2003), “The price of innovation: new estimates of drug development costs,” Journal of Health Economics, Vol. 22, No. 2, pp.151-185; Joseph A. DiMasi and Henry G. Grabowski, “The cost of biopharmaceutical R&D: is biotech different?” Managerial and Decision Economics, (John
Wiley & Sons, Ltd, 2007); David E. Fagnan, Austin A. Gromatzky, Roger M. Stein, Jose-Maria Fernandez and Andrew W. Lo, (2013), “Financing drug discovery for orphan diseases,” Drug Discovery Today. 50
The study by DiMasi (2007) focused on the drug development costs of biotechnology companies compared to traditional pharmaceutical companies. The study found that biotechnology companies have a greater proportion of orphan drug approvals to total drug approvals than traditional pharmaceutical companies. The most recent study, by Fagnan (2013), analyzed the development process for orphan drugs in particular. The different approaches taken by each of the studies does not dramatically alter the estimated change in the cost of capital. 51
Robert Carroll, Gerald Prante and Robin Quek, “The R&D Credit: An effective policy for promoting research spending,” (2011); Bronwyn H. Hall and John Van Reenen, (2000), “How Effective Are Fiscal Incentives for R&D? A Review of the Evidence,” Research Policy, Vol. 29, pp. 449-469. 52
“Novel New Drugs 2014 Summary,” Center for Drug Evaluation and Research, FDA. 53
Frank R. Lichtenberg, “The effect of new drugs on mortality from rare diseases and HIV,” National Bureau of Economic Research (2001). 54
Ibid. 55
“Rare Diseases with FDA-Approved Medical Products,” Office of Rare Disease Research, http://rarediseases.info.nih.gov/gard/diseases-with-medical-products/. 56
“Rare Disease Impact Report: Insights from patients and the medical community,” Shire, 9 April 2013, http://www.shire.com/shireplc/dlibrary/documents/RareDiseaseImpactReportforWeb.pdf. 57
Ibid. 58
Walter F. Steward, Judith A. Ricci, Elsbeth Chee and David Morganstein, (2003), “Lost Productive Work Time Costs From Health Conditions in the United States: Results From the American Productivity Audit,” Journal of Occupational & Environmental Medicine, Vol. 45, No. 22, pp. 1234-1246; Jodi Messer Pelkowski and Mark C Berger, (2004), “The impact of health on employment, wages, and hours worked over the life cycle,” The Quarterly Review of Economics and Finance, Vol. 44, No. 1, pp. 102-121. 59
“Rare Disease Impact Report: Insights from patients and the medical community,” Shire, 9 April 2013, http://www.shire.com/shireplc/dlibrary/documents/RareDiseaseImpactReportforWeb.pdf. 60
Ibid. 61
Institute of Medicine (US) Committee on Accelerating Rare Diseases Research and Orphan Product Development, “Rare Diseases and Orphan Products,” The National Academies (2010). 62
“Supra, Note 59.

EY | 34
63
Frank R. Lichtenberg, “Benefits and Costs of Newer Drugs: An Update,” National Bureau of Economic Research,
Working Paper No. 8996, 2002. 64
Stacey L. Kowal, Timothy M. Dall, Ritashree Chakrabarti, Michael V. Storm and Anjali Jain, “The current and projected economic burden of Parkinson’s disease in the United States,” Movement Disorders (2013). 65
“Rare Diseases with FDA-Approved Medical Products,” Office of Rare Disease Research,
http://rarediseases.info.nih.gov/gard/diseases-with-medical-products/a. 66
“Medical Subject Headings (MeSH®) in MEDLINE®/PubMed: A Tutorial,” U.S. National Library of Medicine, 2014, http://www.nlm.nih.gov/bsd/disted/meshtutorial/introduction/. 67
Institute for Evidence-Based Health Professions Education, “9.2: Searching the Literature,” University of Georgia College of Public Health,” accessed via http://ebp.uga.edu/courses/Chapter%209%20-%20Meta-analysis%20of%20treatment/3%20-%20Searching%20the%20literature.html.